energy sector company presentation sp12.pdf · energy sector company presentation nick eyer julie...
TRANSCRIPT

Energy Sector Company Presentation
Nick Eyer Julie Heigel
Renae Schlosser May 29, 2012

Agenda
• Overview
• Schlumberger
• Nabors
• Halliburton
• ConocoPhillips
• Chevron
• EOG Resources
• Final Recommendations

11.22
10.85
11.22
14.68 11.39
10.51
20.29
3.45 2.91
3.5
0 0
S&P 500 Weight by Sector Consumer Discretionary
Consumer Staples
Energy
Financials
Health Care
Industrials
Information Technology
Materials
Telecommunication Services
Utilities
Cash
Dividend Receivables
10.04
10.95
10.42
13.36
13.61
7.37
21.91
3.93 1.02 3.47 3.83 0.08
SIM Weight by Sector
Overview as of 4/30/2012
Energy will remain approx. 80 bps underweight

Final Recommendations
Company Price Target
(USD) Current Weight Change
Recommended Weight
Potential Upside
Schlumberger 72.21 174 bps Sell 75 bps 99 bps 7.3%
Nabors 26.82 199 bps Buy 75 bps 274 bps 88.1%
Halliburton 38.37 0 bps Hold 0 bps 22.3%
ConocoPhillips 64.71 290 bps Sell 290 bps 0 bps 24.2%
Chevron 125.47 379 bps Buy 80 bps 459bps 26.8%
EOG Resources 133.11 0 bps Buy 210 bps 210 bps 30.8%
Final recommendations based on analysis included and goal to maintain same exposure to specific energy industries


Schlumberger Limited
• One of worlds largest oilfield service companies
• Full range of services: – Seismic surveys – Formation evaluation – Cementing – Well construction and
completion – Project management
• Acquisition of Smith International – 2010 – $11 B deal – Drilling services and equipment
• 113,000 employees in 85 countries
Stock Data Ticker: SLB
Current Weight: 174 bps
52 Week Range: 54.79 – 95.53
Market Capitalization: 88.12 B
Diluted Shares Outstanding: 1.33 B
Dividend Yield: 1.7%
Historic Beta: 1.2
Industry: Oil & Gas Equipment Services

Schlumberger Limited
• Worthy to Note – $4.02 B capex in 2011,
increase of 38% YOY
– Invests more in R&D every year than all other oilfield services companies combined • 25 R&D centers around the
world
• HiWAY Fracturing Technique
– In June 2012, secured first 3 year contract to drill at Badra oil project in Iraq
– Geographical and product diversification
HiWAY fracturing incorporates proprietary fibers that ensure flow-channel stability

Competition Oil Field Service Companies by Market Cap
Company Market
Capitalization ($B) (as May 21)
Number of Employees
2011 Annual Sales ($B)
Schlumberger Ltd. (SLB) 89.03 113,000 39.67
Halliburton Co. (HAL) 28.77 68,000 24.83
National Oilwell Varco Inc. (NOV)
28.63 49,975 14.66
Baker Hughes Inc. (BHI) 18.41 57,700 19.83
Weatherford International Ltd. (WFT)
9.8 61,000 12.99

Competition 2011 Profitability Ratios
0
0.05
0.1
0.15
0.2
0.25
0.3
Gross Profit Margin Net Profit Margin ROE ROA Return on Invested Cap
Schlumberger
Baker Hughes
Halliburton
Weatherford International
Industry Median

Schlumberger Limited Performance Measures
2006 2007 2008 2009 2010 2011 TTM
Profitability
Net Margin (%) 19.3 22.2 19.7 13.5 14.7 12.6 12.9
Operating
ROA (%) 18.1 20.4 18.2 9.6 10.0 9.3 9.8
ROE (%) 41.2 40.9 34.3 17.4 16.9 16.0 16.8
Liquidity
Debt/Equity 0.45 0.26 0.20 0.23 0.18 0.27 0.26
ROE vs. S&P 500 ROE vs. Industry

Schlumberger Limited 12 Month Stock Performance

Schlumberger Limited QTD Stock Performance

Analyst: Nick Eyer Terminal Discount Rate = 11.25%
Date: 5/23/2012 Terminal FCF Growth = 3.0%
Year 2011E* 2012E 2013E 2014E 2015E 2016E 2017E 2018E 2019E 2020E 2021E
Revenue 39,669 45,619 51,094 56,203 61,823 67,387 72,778 78,601 84,103 89,990 95,389
% Grow th 15.0% 12.0% 10.0% 10.0% 9.0% 8.0% 8.0% 7.0% 7.0% 6.0%
Operating Income 6,636 9,489 10,679 11,746 12,365 12,804 13,828 14,148 14,297 14,398 15,262
Operating Margin 16.7% 20.8% 20.9% 20.9% 20.0% 19.0% 19.0% 18.0% 17.0% 16.0% 16.0%
Interest and Other (298) (342) (383) (422) (464) (505) (546) (590) (631) (675) (715)
Interest % of Sales -0.8% -0.8% -0.8% -0.8% -0.8% -0.8% -0.8% -0.8% -0.8% -0.8% -0.8%
Taxes 1,545 1,921 2,162 2,378 2,499 2,583 2,789 2,847 2,870 2,882 3,055
Tax Rate 24.4% 21.0% 21.0% 21.0% 21.0% 21.0% 21.0% 21.0% 21.0% 21.0% 21.0%
Income Attributable to Noncontrolling Interests16 5 5 5 5 5 5 5 5 5 5
% Grow th -68.8% 0.0% 0.0% 0.0% 0.0% 0.0% 0.0% 0.0% 0.0% 0.0%
Net Income 5,013 7,221 8,128 8,942 9,407 9,721 10,498 10,716 10,802 10,847 11,497
% Grow th 44.0% 12.6% 10.0% 5.2% 3.3% 8.0% 2.1% 0.8% 0.4% 6.0%
Add Depreciation/Amort 3,281 3,878 4,343 4,777 5,255 5,728 6,186 6,681 7,149 7,649 8,108
% of Sales 8.3% 8.5% 8.5% 8.5% 8.5% 8.5% 8.5% 8.5% 8.5% 8.5% 8.5%
Plus/(minus) Changes WC (1,027) 234 (766) (715) (309) (303) (291) (314) (294) (315) (286)
% of Sales -2.6% 0.5% -1.5% -1.3% -0.5% -0.5% -0.4% -0.4% -0.4% -0.4% -0.3%
Subtract Cap Ex 4,016 5,474 6,131 6,744 7,419 7,413 7,278 7,860 7,569 7,649 8,108
Capex % of sales 10.1% 12.0% 12.0% 12.0% 12.0% 11.0% 10.0% 10.0% 9.0% 8.5% 8.5%
Free Cash Flow 3,568 6,104 6,034 6,742 7,379 8,090 9,364 9,492 10,215 10,588 11,262
% Grow th 71.1% -1.2% 11.7% 9.4% 9.6% 15.7% 1.4% 7.6% 3.6% 6.4%
Schlumberger Limited DCF Analysis

Schlumberger Limited Sensitivity Analysis – Implied Equity Value/Share
NPV of Cash Flows 46,551 49%
NPV of terminal value 48,419 51%
Projected Equity Value 94,969 100%
Free Cash Flow Yield 4.32%
Current P/E 16.5 11.4 10.2
Projected P/E 18.9 13.2 11.7
Current EV/EBITDA 9.2 6.8 6.0
Projected EV/EBITDA 10.4 7.7 6.9
Shares Outstanding 1,263
Current Price 65.33$
Implied equity value/share 75.19$
Upside/(Downside) to DCF 15.1%
Terminal Value 140,609
Free Cash Yield 8.01%
Terminal P/E 12.2
Terminal EV/EBITDA 6.4
10.50% 10.75% 11.00% 11.25% 11.50% 11.75% 12.00%
1.50% 75.25 72.99 70.85 68.82 66.90 65.08 63.34
2.00% 77.62 75.19 72.89 70.72 68.66 66.72 64.87
2.50% 80.29 77.65 75.17 72.83 70.62 68.54 66.56
3.00% 83.32 80.43 77.73 75.19 72.81 70.56 68.45
3.50% 86.77 83.60 80.63 77.86 75.27 72.84 70.55
4.00% 90.76 87.23 83.95 80.90 78.06 75.40 72.91
4.50% 95.42 91.45 87.78 84.39 81.25 78.32 75.59
Term
inal
FC
F
Gro
wth
Rate
Terminal Discout Rate

Schlumberger Limited Valuation Analysis
Relative to Industry High Low Median Current
P/Trailing E 1.4 1.0 1.2 1.2
P/Forward E 1.4 .98 1.1 1.2
P/B 1.8 1.0 1.4 1.3
P/S 1.8 1.3 1.6 1.3
P/CF 1.5 .9 1.2 1.1
Relative to S&P500 High Low Median Current
P/Trailing E 2.1 .75 1.4 1.3
P/Forward E 1.8 .82 1.3 1.2
P/B 3.9 1.2 1.8 1.3
P/S 4.2 1.8 2.8 1.8
P/CF 2.2 .8 1.5 1.2
Absolute Valuation High Low Median Current Target Multiple Target E, S, B
/Share Target Price
P/Forward E 24.3 10.2 19.2 14.9 16.95 4.32 73.22
P/S 5.7 1.7 3.3 2.1 2.9 32.29 93.63
P/B 11.9 2.5 3.8 2.7 3.5 24.26 84.30
P/EBITDA 18.47 4.87 11.50 8.45 9.8 6.7 66.10
P/CF 24 5.9 13.2 10.4 11.3 7.85 89.31

Recommendation: SELL 75 bps
Price Target: $72.21
Current Price (May 25): $67.19
Upside Potential: 7.3%
Value Drivers Risks
•Absolute competitive R&D edge
•Geopolitical risk especially in Russia
•Comprehensive offering of products
•Sustained fall in natural gas price
•Strong relationship with the largest integrated oil and gas companies
•Environmental regulation
•Industry leader in Russia
Schlumberger Limited Price Target Calculation
DCF .65(75.19) 48.87
P/Forward E .07(73.22) 5.13
P/S .07(93.63) 6.55
P/B .07(84.30) 5.90
P/EBITDA .07(66.10) 4.63
P/CF .07(89.31) 6.25
Total $72.21


Nabors Industries Ltd.
Stock Data Ticker: NBR
Current Weight: 199 bps
52 Week Range: 11.05 – 28.50
Market Capitalization: 4.06 B
Diluted Shares Outstanding: 290.3 M
Dividend Yield: N/A
Historic Beta: 2.3
Industry: Oil & Gas Drilling
• World’s largest land drilling contractor • 501 land-drilling rigs • 743 land workover and servicing
wells • Offshore operations
• 39 platform rigs • 12 jack ups • 4 barge drilling rigs
• Provides hydraulic fracturing, cementing and pressure pumping services
• Manufactures top drives and drilling instrumentation systems
• Oilfield services • Hauling, engineering, facilities
maintenance

Nabors Industries Ltd.
• Worthy to Note – New CEO Anthony
Petrello’s commitment to streamline operations • Drilling and rig services
• Completion and production services
– Asset disposition from oil & gas operations estimated near $800M
– Actively switching over from gas to oil rigs • Extremely expensive
lowers productivity
October, 2011

Nabors Industries Ltd. Performance Measures
2006 2007 2008 2009 2010 2011 TTM
Profitability
Net Margin (%) 20.7 18.8 10.4 -2.4 2.2 4.0 4.5
Operating
ROA (%) 12.5 9.7 5.4 -0.8 0.8 2.0 2.4
ROE (%) 28 23.1 12 -1.7 1.8 4.5 5.2
Liquidity *as of 3/2012
Debt/Equity 1.13 0.73 0.83 0.76 0.58 0.78 0.77*
ROE vs. S&P 500 ROE vs. Industry

Competition 2011 Profitability Ratios
-0.1
0
0.1
0.2
0.3
0.4
0.5
Gross Profit Margin
Net Profit Margin ROE ROA Return on Invested Cap
Nabors Industries
Helmerich & Payne
Paterson-UTI Energy
Industry Median
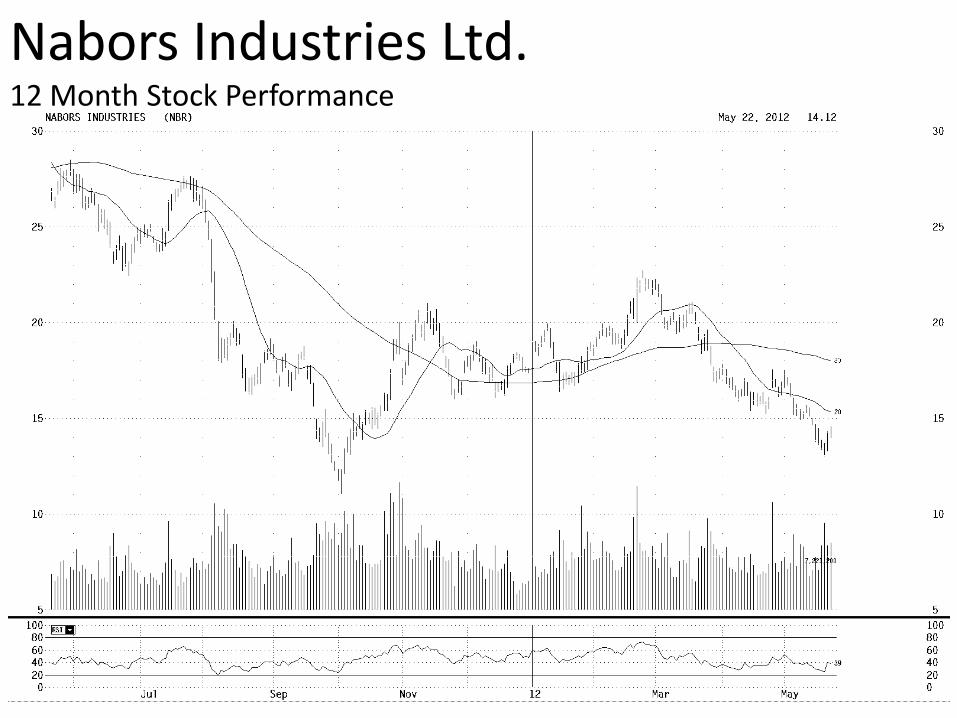
Nabors Industries Ltd. 12 Month Stock Performance

Nabors Industries Ltd. QTD Stock Performance

Analyst: Julie Heigel Terminal Discount Rate = 11.50%
Date: 4/10/2012 Terminal FCF Growth = 2.50%
Year 2012E 2013E 2014E 2015E 2016E 2017E 2018E 2019E 2020E 2021E 2022E
Revenue 6,883,308 7,824,271 8,922,670 9,636,484 10,214,673 10,725,407 11,100,796 11,433,820 11,719,665 12,012,657 12,312,973
% Grow th 13.67% 14.04% 8.00% 6.00% 5.00% 3.50% 3.00% 2.50% 2.50% 2.50%
Operating Income 1,269,354 1,409,156 1,616,879 1,734,567 1,736,494 1,769,692 1,831,631 1,886,580 1,933,745 1,982,088 2,031,641
Operating Margin 18.4% 18.0% 18.1% 18.0% 17.0% 16.5% 16.5% 16.5% 16.5% 16.5% 16.5%
Interest and Other (292,541) (332,532) (379,213) (409,551) (434,124) (455,830) (471,784) (485,937) (498,086) (510,538) (523,301)
Interest % of Sales -4.3% -4.3% -4.3% -4.3% -4.3% -4.3% -4.3% -4.3% -4.3% -4.3% -4.3%
Taxes 312,580 344,520 396,053 424,005 416,759 420,436 435,151 448,206 459,411 470,896 482,669
Tax Rate 32.0% 32.0% 32.0% 32.0% 32.0% 32.0% 32.0% 32.0% 32.0% 32.0% 32.0%
Net Income 664,233 732,105 841,612 901,011 885,612 893,426 924,696 952,437 976,248 1,000,654 1,025,671
% Grow th 10.2% 15.0% 7.1% -1.7% 0.9% 3.5% 3.0% 2.5% 2.5% 2.5%
Add Depreciation/Amort 1,001,521 1,138,431 1,298,249 1,011,831 1,072,541 1,072,541 1,054,576 1,029,044 937,573 900,949 738,778
% of Sales 14.6% 14.6% 14.6% 10.5% 10.5% 10.0% 9.5% 9.0% 8.0% 7.5% 6.0%
Plus/(minus) Changes WC (259) (145,849) (170,252) (182,708) (145,253) (127,096) (92,081) (81,294) (69,439) (71,175) (72,954)
% of Sales 0.0% -1.9% -1.9% -1.9% -1.4% -1.2% -0.8% -0.7% -0.6% -0.6% -0.6%
Subtract Cap Ex 1,514,328 1,721,340 1,962,988 1,782,750 1,634,348 1,555,184 1,443,103 1,029,044 996,172 840,886 738,778
Capex % of sales 22.0% 22.0% 22.0% 18.5% 16.0% 14.5% 13.0% 9.0% 8.5% 7.0% 6.0%
Free Cash Flow 334,896 264,314 305,630 288,877 431,749 502,034 616,193 900,254 894,061 993,522 978,841
% Grow th -21.1% 15.6% -5.5% 49.5% 16.3% 22.7% 46.1% -0.7% 11.1% -1.5%
Nabors Industries Ltd. (NBR)
Nabors Industries Ltd. DCF Analysis

Nabors Industries Ltd. Sensitivity Analysis – Implied Equity Value/Share
NPV of Cash Flows 3,079,632 45%
NPV of terminal value 3,753,573 55%
Projected Equity Value 6,833,205 100%
Free Cash Flow Yield 8.18%
Current P/E 6.2 5.6 4.9
Projected P/E 10.3 9.3 8.1
Current EV/EBITDA 3.6 3.2 2.8
Projected EV/EBITDA 4.8 4.3 3.7
Shares Outstanding 292,484
Current Price 14.00$
Implied equity value/share 23.36$
Upside/(Downside) to DCF 66.9%
Terminal Value 11,147,913
Free Cash Yield 8.78%
Terminal P/E 10.9
Terminal EV/EBITDA 5.5
10.50% 11.00% 11.50% 12.00% 12.50%
1.25% 24.67 23.12 21.72 20.47 19.33
1.75% 25.52 23.84 22.35 21.01 19.8
2.25% 26.45 24.65 23.05 21.61 20.33
2.75% 27.52 25.55 23.82 22.28 20.91
3.25% 28.73 26.57 24.69 23.03 21.55
Terminal Discout Rate
Term
inal
FC
F G
row
th
Rate

Nabors Industries Ltd. Valuation Analysis
Relative to Industry High Low Median Current
P/Trailing E 3.1 0.47 0.89 0.61
P/Forward E 2.3 0.58 0.89 0.66
P/B 2.2 0.4 0.8 0.7
P/S 1.2 0.3 0.7 0.4
P/CF 1.6 0.5 0.9 0.5
Relative to S&P500 High Low Median Current
P/Trailing E 3.7 .28 1.1 0.59
P/Forward E 2.2 0.36 0.99 0.52
P/B 1.3 0.3 0.8 0.4
P/S 3.3 0.5 1.6 0.5
P/CF 2.1 0.2 0.8 0.3
Absolute Valuation High Low Median Current Target Multiple Target E, S, B
/Share Target Price
P/Forward E 37.6 4.8 14.9 6.3 12.4 2.28 28.18
P/S 4.9 0.5 2.1 0.6 1.7 23.6 40.11
P/B 3.7 0.6 2.4 0.8 1.95 17.72 34.55
P/EBITDA 15.98 1.81 7.41 2.11 6.0 4.35 26.15
P/CF 21.6 1.8 8.1 2.8 6.5 5.7 37.15

Nabors Industries Ltd. Value Drivers Risks
•CEO Anthony Petrello refocus
•Geopolitical risk especially in Middle East markets
•Young rig fleet higher daily rates
•North America, Nabors’ largest market, is extremely saturated
•Positioned well for success in Middle East
•Sustained fall in prices of natural gas
•Improving international margins
•High switching costs in North America
Price Target Calculation
DCF .65(23.36) 1.97
P/Forward E .07(28.18) 2.81
P/S .07(40.11) 2.42
P/B .07(34.55) 1.83
P/EBITDA .07(26.15) 2.61
P/CF .07(37.15) 15.18
Total $26.82
Recommendation: BUY 75 bps
Price Target: $26.82
Current Price (May 28): $14.26
Upside Potential: 88.1%

Halliburton Company (HAL) Oil & Gas Equipment & Services
• Oil field service company
• Operates in two segments: • Drilling and evaluation
• Completion and production
• Worthy to Note – $2.95B in capex in 2011, a
43% YOY
– Signed strategic agreement early 2012 with Russian gas company Gazprom
– Young workforce relative to industry average
– Innovation initiatives
Stock Data Ticker: HAL
Current Weight: 0 bps
52 Week Range: 27.21 – 57.77
Market Capitalization: 29.95 B
Diluted Shares Outstanding: 922 M
Dividend Yield: 1.1%
Historic Beta: 1.7
Industry: Oil & Gas Equipment Services

Halliburton Company (HAL) Performance Measures
2006 2007 2008 2009 2010 2011 TTM
Profitability
Net Margin (%) 10.4 22.9 8.4 7.8 10.2 11.4 11.2
Operating
ROA (%) 14.8 23.4 11.2 7.4 10.5 13.5 13.5
ROE (%) 34.2 49.1 21.1 13.9 19.2 24.1 23.9
Liquidity *As of 3/2012
Debt/Equity .38 .38 .33 .44 .37 .37 .35
ROE vs. S&P 500 ROE vs. Industry

Halliburton Company (HAL) DCF Analysis

Halliburton Company (HAL) Sensitivity Analysis – Implied Equity Value/Share

Halliburton Company (HAL) Valuation Analysis
Relative to Industry High Low Median Current
P/Trailing E 1.1 .45 .83 .63
P/Forward E 1.2 .49 .82 .72
P/B 1.3 .5 1.0 1.0
P/S .9 .4 .6 .7
P/CF 1.5 0.5 1.0 .7
Relative to S&P500 High Low Median Current
P/Trailing E 1.8 .46 1.3 .65
P/Forward E 1.6 .56 1.0 .73
P/B 2.8 .4 1.5 1.0
P/S 2.4 .3 1.1 .9
P/CF 2.4 .5 1.3 .7
Absolute
Valuation
High Low Median Current Target
Multiple
Target E, S, B
/Share
Target
Price
P/Forward E 25.3 6.3 16.6 8.8 14 3.64 51
P/S 3 .4 1.4 1.1 1.15 28.56 32.84
P/B 7.7 1.2 4.1 2.1 3.37 11.80 39.83
P/EBITDA 29.97 3.37 9.76 4.29 8.16 5.72 46.62
P/CF 25.9 4.1 12.5 5.9 10.4 2.65 27.56

Halliburton Company (HAL) Value Drivers Risks
•Well diversified – fully integrated product offering
•Geopolitical risk – especially Russia
•Strategic relationships in Russia
•Sustained fall in prices of natural gas
•Lawsuits filed by BP for negligence in Deepwater Horizon incident
Price Target Calculation
DCF .65(37.73) 24.52
P/Forward E .07(52.02) 3.57
P/S .07(32.84) 2.29
P/B .07(39.83) 2.78
P/EBITDA .07(46.62) 3.26
P/CF .07(27.56) 1.92
Total $38.37
Recommendation: HOLD
Price Target: $38.37
Current Price (May 28): $31.37
Upside Potential: 22.3%


ConocoPhillips & Phillips 66
Stock Data Ticker: COP
Current Weight: 290 bps
Market Capitalization: $86.7B
Diluted Shares Outstanding: 1.92B
Dividend Yield: 5.1%
Historic Beta: 1.08
Industry: Oil & Gas Integrated
History: • Conoco founded in 1875 & Phillips
founded in 1905 • Two Companies merged in 2001 to form
3rd largest U.S. integrated oil company 12 Years later: COP split into 2 publicly traded companies (on May 1, 2012)
• ConocoPhillips – Exploration & Production
• Phillips66 – Refining & Marketing, Midstream, Chemicals, & Emerging Businesses
2 for 1 stock split: • Shareholders in COP gained an extra
stock in Phillip66 for every 2 stocks owned
• Now: 5000 shares of COP & 2500 of PSX
Historical Data on Separate Companies NOT fully available (NWC, Debt, CapEx, Taxes)
• DCF not accurate for valuation • Sum of Parts Analysis Instead

ConocoPhillips: Independent E&P
Stock Data Ticker: COP
Current Weight: 290 bps
Adjusted 52 Week Range: 46.49- 59.63
Market Capitalization: $66.7B
Diluted Shares Outstanding: 1.28B
Dividend Yield: 5.1%
Historic Beta: 1.08
Industry: Oil Exploration & Production
Split makes COP one of the largest independent E&P firms in the world • E&P segment has high Operating
Margins • Split enables more Available Cash
to Invest in Exploration • Potential to further grow Proved
Reserves 8.4 billion BOE in Proved Reserves • EV/Proved Reserves = $10.71

Adjusted Stock History (76% of previous stock prices accounting for split)

ConocoPhillips: Independent E&P Valuation Analysis
Relative to Industry High Low Median Current
P/Trailing E 0.59 0.32 0.45 0.46
P/Forward E 0.75 0.30 0.44 0.75
P/B 0.9 0.4 0.5 0.7
P/S 0.2 0.1 0.1 0.1
P/CF 0.7 0.4 0.6 0.6
Relative to S&P500 High Low Median Current
P/Trailing E 0.67 0.24 0.47 0.45
P/Forward E 0.71 0.28 0.45 0.69
P/B 0.6 0.4 0.5 0.5
P/S 0.5 0.2 0.3 0.2
P/CF 0.5 0.2 0.4 0.4
Absolute Valuation High Low Median Current Target Multiple
P/Trailing E 10.7 2.7 6.9 5.8 6.9
P/Forward E 8.8 4.0 6.6 8.4 6.6
P/S 0.6 0.2 0.4 0.3 0.4
P/B 1.4 .7 1.1 1.0 1.1
P/EBITDA 9.74 2.0 2.91 2.23 2.91
P/CF 5.1 1.7 3.9 3.5 3.9

ConocoPhillips: Independent E&P
• Compared to Other E&P firms?
EV Market
Cap Trailing
P/E Ratio Forward P/E
Ratio EPS
Proven Reserves mmBOE EV/ EBITDA
EV/Proven Reserves
EBITDA Margin P/S P/B
Apache 40,500 31,660 6.8 6.6 12.11 2990 3.2 $ 13.55 73.40% 1.8 1.1
Chesapeake 26200 10,474 7.1 19.7 2.24 3300 5.9 $ 7.94 35.60% 0.8 0.6
Devon Energy 28000 24,254 10.3 10.9 5.85 3010 3.8 $ 9.30 62.20% 2.05 1.1
EOG Resources 32,100 27,379 23.9 20.1 4.26 2054 6.8 $ 15.63 42.60% 2.5 2.1
Forest Oil 2,800 992 9.7 14.5 0.87 NA 4.7 NA 79.60% 1.33 0.8
Murphy Oil 8,400 9,242 7.3 8 6.49 NA 2.3 NA 12.40% 0.3 1
Newfield 7,100 4,114 7.9 10.3 3.91 NA 4 NA 66.10% 1.58 1
Pioneer 14,500 12,228 22.1 16.5 4.48 1063 8.9 $ 13.64 57.80% 4.3 2.2
Plains E&P 7,700 4,674 20.0 11.0 1.82 2200 6.1 $ 3.50 60.10% 2.2 1.4
Southwestern 11,500 10,042 16.5 23.7 1.74 NA 6.5 NA 60.30% 3.4 2.4
Talisman 14,900 10,802 18.4 13.7 0.57 1382 13.1 $ 10.78 13.70% 1.3 1.1
Noble Energy 18,300 14,852 15.0 12.3 5.61 1200 7.2 $ 15.25 62.90% 3.7 2.0
ConocoPhillips 90,000 66,684 5.8 8.4 8.97 8400 3.0 $ 10.71 12.00% 0.3 1.0 Peer Group Average 23,230 17,492 13.14 13.52 4.53 2,844 5.81 11.14 49.13% 1.97 1.37

Sum of Parts Analysis
Segment
E/S/B Multiple Target Market
Cap # Diluted
Shares Target Price
Current Stock Price
% return to target
Trailing P/E Ratio 8,242.00 13.14 108,287.20 1,279,693,000 84.62 52.11 62%
Forward P/E Ratio 8,242.00 13.52 111,393.80 1,279,693,000 87.05 52.11 67%
P/S 49,453.00 1.97 97,194.17 1,279,693,000 75.95 52.11 46%
Weighted Average Price
Trailing P/E .2(75.95) 16.92
Forward P/E .2(87.05) 17.41
P/S .6(75.95) 30.38
Total Price Target 64.71
Current Price 52.11
Upside 24.2%

ConocoPhillips: Independent E&P
• Price multiples (Forward & Trailing P/E, P/S, P/B, P/CF) are way below comparative firms as well as industry
• Much lower EV/Proved Reserves than competitor average

ConocoPhillips: Independent E&P
• Conclusion
– New COP is very large & inefficient compared to other smaller independent firms
– Still suffering from structural inefficiencies (bureaucracy of large firm)
– Examine Other Exploration & Production Firms replace COP in portfolio

Phillips 66: Downstream Firm
• Includes:
– Refining & Marketing
– Chemicals
– Emerging Businesses
– Midstream
• Strategy: Build up Chemicals & Midstream segments to support low performing R&M

Phillips 66 Stock History (since May 1st)

Phillips 66: Downstream Firm Comparable Firms Analysis
EV
Closing Stock Price
Shares Outstanding
Market Cap
Trailing P/E Ratio
Forward P/E Ratio EPS
EV/ EBITDA
EBITDA Margin P/S P/B
Adams Resources & Energy 121 37.18 4218000 156.83 7.5 16.4 4.99 2.5 1.50% 0.04 1.6
CVR Energy 2700 26.65 86808000 2313.43 6.4 5.4 4.15 3.6 12.70% 0.4 1.9
Marathon Petroleum 13700 36.88 347614000 12820.00 5.3 5.7 NA 3 5.80% 0.2 1.4
Sunoco 5600 47.29 106817000 5051.38 89.2 38.4 0.53 8.1 1.40% 0.1 7
Targa Resources 3200 44.13 42442000 1872.97 34.2 36.6 1.29 8.2 5.60% 0.27 12.2
Tesoro 4300 23.76 139014000 3302.97 6.6 5.3 3.58 3.1 4.40% 0.1 0.9
Valero Energy 18400 22.34 555069000 12400.24 6.4 5.4 3.51 3.4 4.10% 0.09 0.8
Western Refining 2300 19.76 90815000 1794.50 5.5 4.8 3.6 3.1 7.90% 0.19 2
Phillips66 25700 31.3 639847000 20027.21 0 0 0 0 0 0 0

Phillips 66: Downstream Firm
• Notable: – R&M firms perform very poorly in general – Poor margins, low growth – Price-takers from the Market & Low Buyer Bargaining Power – Susceptible to Significant fines & taxes for Environmental
Regulations
• Chemical Segment is currently through a 50% joint venture with Chevron – Since we already own chevron and will be exposed to this
segment, do not want to have double “risk” – Most of Phillips66 profits will be dependent on this Chemical
segment going forward
• Conclusion: Sell Phillips66 stocks (2500 shares)
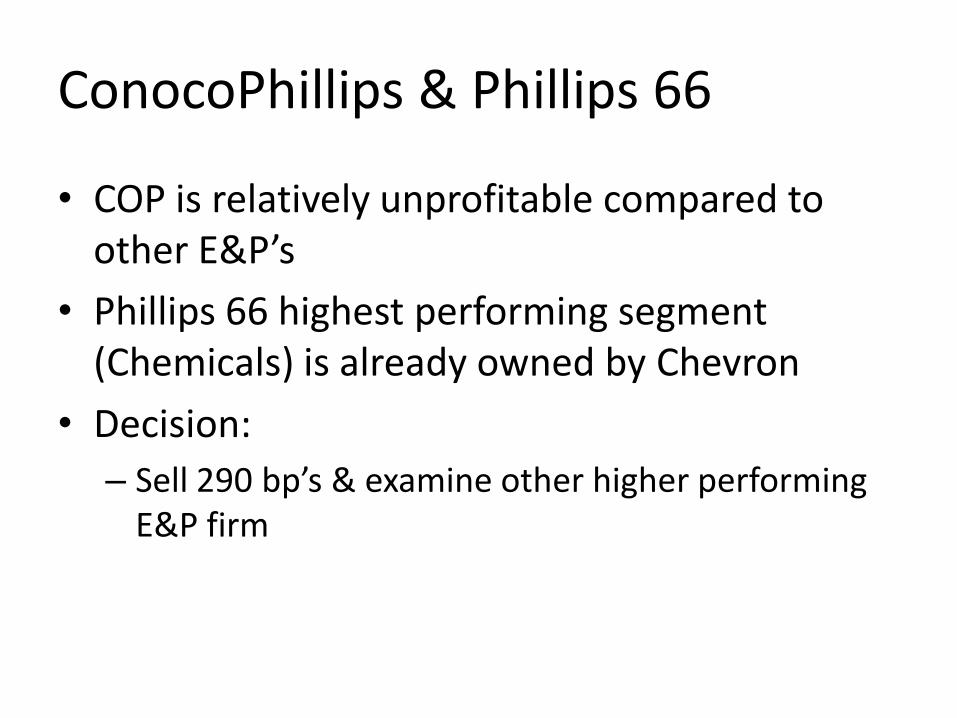
ConocoPhillips & Phillips 66
• COP is relatively unprofitable compared to other E&P’s
• Phillips 66 highest performing segment (Chemicals) is already owned by Chevron
• Decision:
– Sell 290 bp’s & examine other higher performing E&P firm


Stock Data Ticker: CVX
Current Weight: 379 bps
52 Week Range: 86.68 – 112.28
Market Capitalization: 196.4B
Diluted Shares Outstanding: 1.97B
Dividend Yield: 3.60%
Historic Beta: 0.97
Industry: Oil & Gas Integrated
• Second largest integrated energy company in the United States • 61,000+ employees worldwide
• Engages in petroleum, chemicals, mining, power generation and energy operations worldwide
• Upstream activities include: • Exploration • Development • Production • Liquefaction • Regasification
• Downstream activities include: • Refining • Transporting • Manufacturing • Marketing
• Capital and exploratory expenditures • Invested $29.1B in 2011 • Projected $32.7B in 2012
Chevron Corporation

Competition Oil & Gas Integrated Companies by Market Cap
Company Market
Capitalization ($B) (as of May 21)
Number of Employees
2011 Annual Sales ($B)
Exxon Mobil (XOM) 383.6 82,100 496.5
PetroChina Co Ltd (PTR) 238.5 552,810 2083.5
Royal Dutch Shell (RSD.A) 200.9 90,000 493.4
Chevron (CVX) 196.4 61,000 254.1
Petro Brasileiro SA (PBR) 128.3 82,000 150.7

Chevron Performance Measures
2006 2007 2008 2009 2010 2011 TTM
Profitability
Net Margin (%) 8.2 8.5 8.8 6.1 9.3 10.6 10.7
Operating
ROA (%) 13.3 13.3 15.4 6.4 10.9 13.6 13.3
ROE (%) 26.0 25.6 29.2 11.7 19.3 23.8 23.0
Liquidity *as of 5/2012
Debt/Equity 1.11 1.08 1.07 1.11 1.11 1.08 1.07*
ROE vs. S&P 500 ROE vs. Industry

Competition 2011 Profitability Ratios
0
0.05
0.1
0.15
0.2
0.25
0.3
0.35
0.4
0.45
Gross Profit Margin
Net Profit Margin
ROE ROA Return on Invested Cap
Chevron
Exxon Mobil
RDS
BP
Total SA
Industry Median
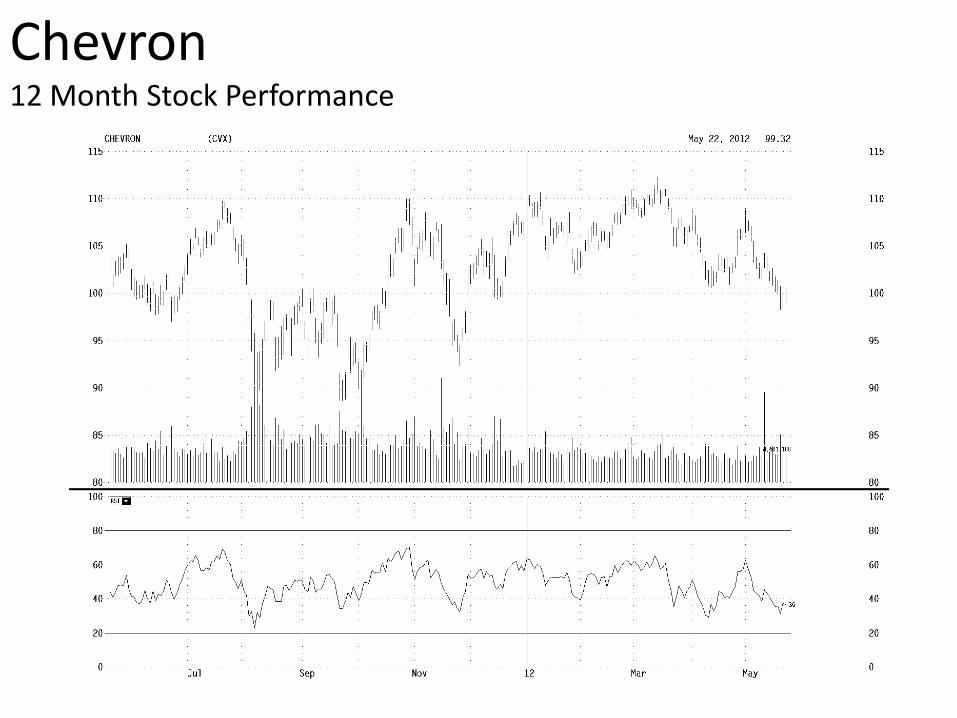
Chevron 12 Month Stock Performance

Chevron YTD Stock Performance

Chevron DCF Analysis
Analyst: Nick Eyer Terminal Discount Rate = 11.25%
Date: 5/23/2012 Terminal FCF Growth = 3.0%
Year 2011E* 2012E 2013E 2014E 2015E 2016E 2017E 2018E 2019E 2020E 2021E
Revenue 253,706 270,619 277,583 284,872 294,273 303,984 314,015 324,378 334,758 345,470 355,834
% Grow th 6.7% 2.6% 2.6% 3.3% 3.3% 3.3% 3.3% 3.2% 3.2% 3.0%
Operating Income 47,634 46,817 48,022 49,283 50,026 51,677 53,383 53,522 55,235 56,312 56,933
Operating Margin 18.8% 17.3% 17.3% 17.3% 17.0% 17.0% 17.0% 16.5% 16.5% 16.3% 16.0%
Interest and Other - (135) (139) (142) (147) (152) (157) (162) (167) (173) (178)
Interest % of Sales 0.0% -0.1% -0.1% -0.1% -0.1% -0.1% -0.1% -0.1% -0.1% -0.1% -0.1%
Taxes 20,626 19,606 20,111 20,639 20,949 21,641 22,355 22,411 23,128 23,578 23,837
Tax Rate 43.3% 42.0% 42.0% 42.0% 42.0% 42.0% 42.0% 42.0% 42.0% 42.0% 42.0%
Income Attributable to Noncontrolling Interests113 124 128 132 136 140 144 148 153 157 162
% Grow th 10.0% 3.0% 3.0% 3.0% 3.0% 3.0% 3.0% 3.0% 3.0% 3.0%
Net Income 27,008 27,075 27,772 28,501 29,066 30,025 31,015 31,097 32,092 32,718 33,080
% Grow th 0.2% 2.6% 2.6% 2.0% 3.3% 3.3% 0.3% 3.2% 2.0% 1.1%
Add Depreciation/Amort 12,911 16,237 16,655 17,092 17,656 18,239 18,841 19,463 20,085 20,728 21,350
% of Sales 5.1% 6.0% 6.0% 6.0% 6.0% 6.0% 6.0% 6.0% 6.0% 6.0% 6.0%
Plus/(minus) Changes WC 1,804 (2,659) (202) (211) (486) (502) (518) (535) (536) (553) (534)
% of Sales 0.7% -1.0% -0.1% -0.1% -0.2% -0.2% -0.2% -0.2% -0.2% -0.2% -0.2%
Subtract Cap Ex 29,066 27,062 27,758 28,487 27,956 27,359 26,691 25,950 25,107 24,183 21,350
Capex % of sales 11.5% 10.0% 10.0% 10.0% 9.5% 9.0% 8.5% 8.0% 7.5% 7.0% 6.0%
Free Cash Flow 13,356 14,248 17,017 17,460 18,806 20,872 23,054 24,416 26,806 28,906 32,573
% Grow th 6.7% 19.4% 2.6% 7.7% 11.0% 10.5% 5.9% 9.8% 7.8% 12.7%

Chevron Sensitivity Analysis – Implied Equity Value/Share
NPV of Cash Flows 121,214 46%
NPV of terminal value 140,035 54% Terminal Value 406,664
Projected Equity Value 261,249 100%
Free Cash Flow Yield 6.72% Free Cash Yield 8.01%
Current P/E 7.4 7.3 7.2 Terminal P/E 12.3
Projected P/E 9.7 9.6 9.4
Current EV/EBITDA 3.2 3.1 3.0 Terminal EV/EBITDA 5.1
Projected EV/EBITDA 4.2 4.1 4.0
Shares Outstanding 2,007
Current Price 98.99$
Implied equity value/share 130.20$
Upside/(Downside) to DCF 31.5%
Terminal Discount Rate
10.50% 10.75% 11.00% 11.25% 11.50% 11.75% 12.00%
1.50% 130.09 126.05 122.22 118.60 115.17 111.92 108.82
2.00% 134.41 130.05 125.94 122.05 118.38 114.90 111.61
2.50% 139.27 134.54 130.08 125.89 121.94 118.22 114.69
3.00% 144.78 139.60 134.75 130.20 125.93 121.91 118.11
3.50% 151.08 145.36 140.04 135.06 130.41 126.04 121.94
4.00% 158.34 151.98 146.08 140.60 135.49 130.71 126.24
4.50% 166.81 159.65 153.06 146.95 141.29 136.03 131.12
Term
inal
FC
F
Gro
wth
Rate

Chevron Valuation Analysis
Relative to Industry High Low Median Current
P/Trailing E 0.99 0.82 0.89 0.84
P/Forward E 1.2 0.77 0.89 0.85
P/B 0.9 0.7 0.9 0.9
P/S 1.1 0.8 1.0 1.0
P/CF 1.2 0.5 0.9 0.9
Relative to S&P500 High Low Median Current
P/Trailing E 0.91 0.47 0.66 0.56
P/Forward E 1.1 0.4 0.64 0.61
P/B 1.3 0.7 0.8 0.7
P/S 0.8 0.5 0.7 0.6
P/CF 0.9 0.4 0.6 0.6
Absolute Valuation High Low Median Current Target Multiple Target E, S, B/
Share Target Price
P/Forward E 14.3 5.6 9.1 7.4 9.0 13.50 121.50
P/S 1.1 0.4 0.9 0.8 0.9 135.58 122.02
P/B 2.9 1.4 1.7 1.6 1.7 60.26 102.44
P/EBITDA 5.4 2.4 4.5 3.2 4.0 30.22 120.88
P/CF 8.2 3.8 5.8 4.9 5.8 20.09 116.52

Recommendation: BUY 80 bps
Price Target: $125.47
Current Price (May 25): $98.99
Upside Potential: 26.8%
Value Drivers Risks
•Heavy CAPEX investments
•Geopolitical risk, specifically Brazil and Ecuador
•Introducing dual gradient drilling
•Strong position in natural gas
•“New” earnings potential in Europe
•Relatively weak short-term demand for natural gas
•Strong position in natural gas and strong relations with Australia and Japan
Chevron Price Target Calculation
DCF .65(130.20) 84.63
P/Forward E .07(121.50) 8.51
P/S .07(122.02) 8.54
P/B .07(102.44) 7.17
P/EBITDA .07(120.88) 8.46
P/CF .07(116.52) 8.16
Total $125.47


Stock Data Ticker: EOG
Current Weight: n/a
52 Week Range: 66.81 – 119.97
Market Capitalization: 27.43B
Diluted Shares Outstanding: 266M
Dividend Yield: 30.70%
Historic Beta: 1.18
Industry: Oil & Gas Expl/Prod
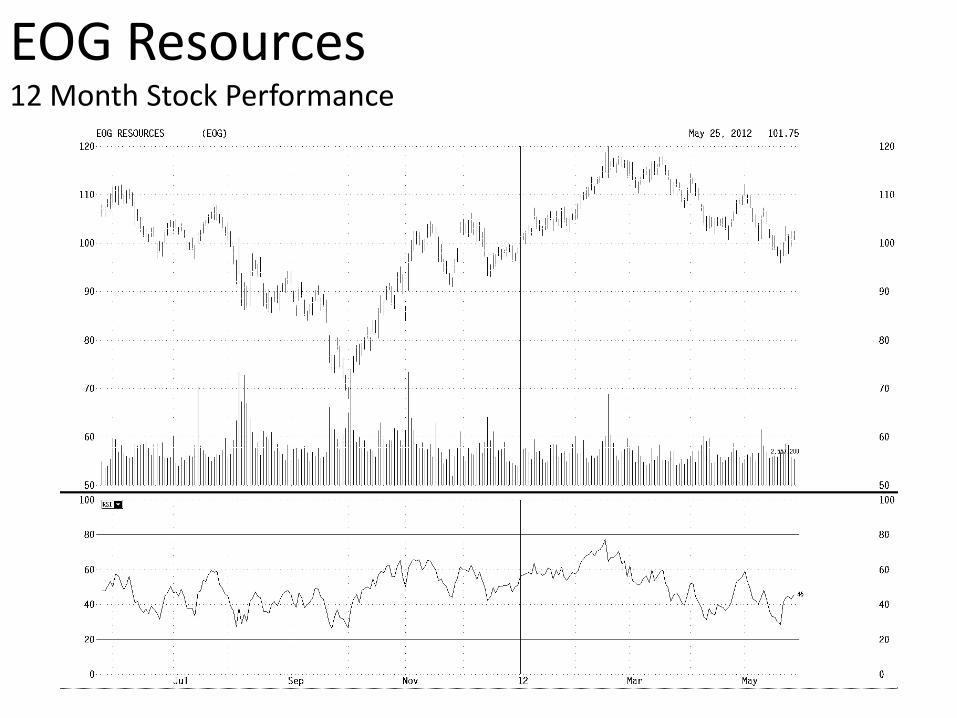
EOG Resources
• Explores for, develops, produces and markets natural gas and crude oil
• Operates primarily in the US, Canada, Trinidad, the UK North Sea and China
• After increasing liquids production by 50%, Q12012 profit increased by more than 100% • Liquids production accounts for
85% of production revenue • Capital and exploratory expenditures
have averaged 67% of sales during previous seven year period
• Recent news: • Upgraded to Stable by Moody’s
(April 2012) • Upgraded to Outperform by
Wells Fargo among others (May 2012)
• Currently trading above 200 day SMA, indicating bullish stock

EOG Resources Performance Measures
2006 2007 2008 2009 2010 2011 TTM
Profitability
Net Margin (%) 33.0 26.8 38.2 11.4 2.6 10.8 11.6
Operating
ROA (%) 15.0 10.0 17.4 3.2 0.8 4.7 5.2
ROE (%) 26.4 17.2 30.5 5.8 1.6 9.5 10.34
Liquidity *as of 5/2012
Debt/Equity 0.13 0.17 0.21 0.28 0.49 0.40 0.39
ROE vs. S&P 500 ROE vs. Industry
EOG Resources 12 Month Stock Performance
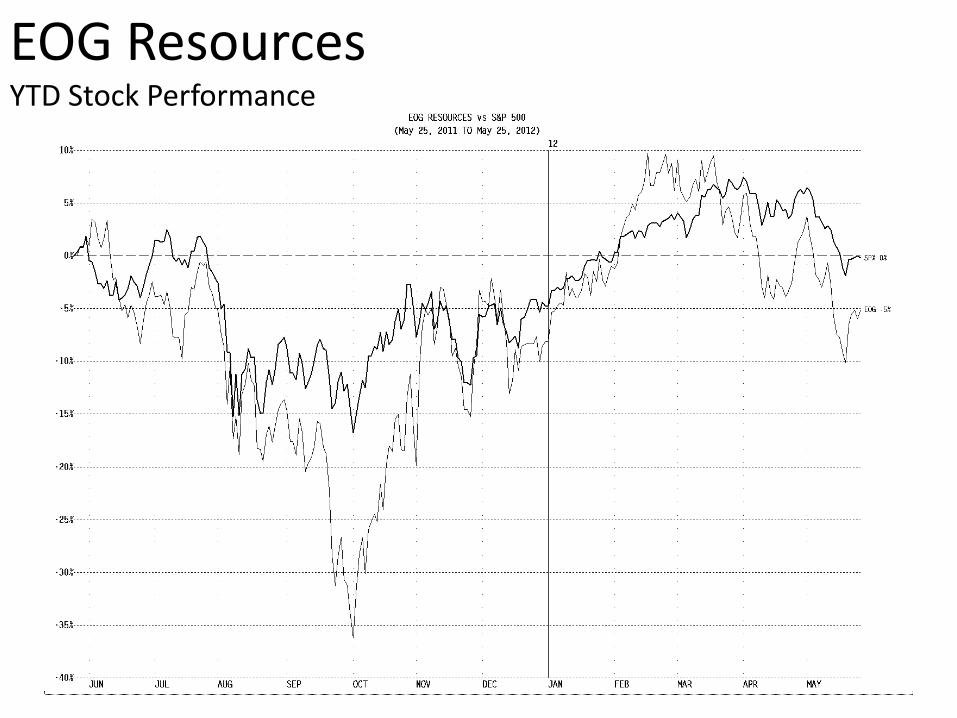
EOG Resources YTD Stock Performance

EOG Resources DCF Analysis
Analyst: Nick Eyer Terminal Discount Rate = 11.25%
Date: 5/24/2012 Terminal FCF Growth = 3.0%
Year 2011 2012E 2013E 2014E 2015E 2016E 2017E 2018E 2019E 2020E 2021E
Revenue 10,126 12,658 16,075 20,898 25,077 29,591 33,734 37,444 40,440 42,462 43,736
% Grow th 25.0% 27.0% 30.0% 20.0% 18.0% 14.0% 11.0% 8.0% 5.0% 3.0%
Operating Income 2,113 3,576 4,541 5,904 6,018 6,510 6,915 7,227 7,360 7,388 7,435
Operating Margin 20.9% 28.3% 28.3% 28.3% 24.0% 22.0% 20.5% 19.3% 18.2% 17.4% 17.0%
Interest and Other (210) 127 161 209 251 296 337 374 404 425 437
Interest % of Sales -2.1% 1.0% 1.0% 1.0% 1.0% 1.0% 1.0% 1.0% 1.0% 1.0% 1.0%
Taxes 819 1,481 1,881 2,445 2,508 2,722 2,901 3,040 3,106 3,125 3,149
Tax Rate 42.9% 40.0% 40.0% 40.0% 40.0% 40.0% 40.0% 40.0% 40.0% 40.0% 40.0%
Net Income 1,090 2,221 2,821 3,668 3,762 4,084 4,352 4,561 4,659 4,688 4,723
% Grow th 103.8% 27.0% 30.0% 2.6% 8.6% 6.6% 4.8% 2.1% 0.6% 0.8%
Add Depreciation/Amort 2,516 3,164 4,019 5,224 6,771 7,398 7,759 7,863 7,684 7,643 7,435
% of Sales 24.8% 25.0% 25.0% 25.0% 27.0% 25.0% 23.0% 21.0% 19.0% 18.0% 17.0%
Plus/(minus) Changes WC (144) (359) (99) (140) (251) (266) (236) (206) (162) (106) (66)
% of Sales -1.4% -2.8% -0.6% -0.7% -1.0% -0.9% -0.7% -0.6% -0.4% -0.3% -0.2%
Subtract Cap Ex 5,519 6,329 8,038 10,449 10,783 10,357 9,445 8,987 8,492 8,068 7,435
Capex % of sales 54.5% 50.0% 50.0% 50.0% 43.0% 35.0% 28.0% 24.0% 21.0% 19.0% 17.0%
Free Cash Flow (512) 428 725 937 1,592 2,442 3,373 3,884 4,165 4,418 4,690
% Grow th 69.4% 29.2% 69.8% 53.4% 38.1% 15.2% 7.2% 6.1% 6.2%
EOG Resources (EOG)

EOG Resources Sensitivity Analysis – Implied Equity Value/Share
NPV of Cash Flows 12,827 39%
NPV of terminal value 20,163 61% Terminal Value 58,555
Projected Equity Value 32,991 100%
Free Cash Flow Yield -1.98% Free Cash Yield 8.01%
Current P/E 23.8 11.7 9.2 Terminal P/E 12.4
Projected P/E 30.3 14.9 11.7
Current EV/EBITDA 8.1 5.6 4.4 Terminal EV/EBITDA 4.7
Projected EV/EBITDA 9.6 6.6 5.2
Shares Outstanding 255
Current Price 101.75$
Implied equity value/share 129.63$
Upside/(Downside) to DCF 27.4%
10.50% 10.75% 11.00% 11.25% 11.50% 11.75% 12.00%
1.50% 129.27 124.76 120.49 116.46 112.65 109.03 105.59
2.00% 134.17 129.30 124.71 120.38 116.29 112.42 108.76
2.50% 139.69 134.39 129.42 124.74 120.33 116.18 112.26
3.00% 145.94 140.14 134.71 129.63 124.86 120.37 116.14
3.50% 153.09 146.68 140.72 135.15 129.94 125.07 120.49
4.00% 161.33 154.19 147.58 141.43 135.71 130.37 125.37
4.50% 170.95 162.91 155.49 148.65 142.30 136.40 130.91
Terminal Discout Rate
Term
inal
FC
F
Gro
wth
Rate

EOG Resources Valuation Analysis
Relative to Industry High Low Median Current
P/Trailing E 4.4 1.1 1.5 1.9
P/Forward E 2.4 0.9 1.4 1.8
P/B 1.9 0.9 1.5 1.4
P/S 2.3 0.9 1.5 1.2
P/CF 2.4 1.0 1.5 1.3
Relative to S&P500 High Low Median Current
P/Trailing E 6.6 0.6 1.1 1.8
P/Forward E 3.0 0.6 1.0 1.7
P/B 2.1 0.8 1.1 1.0
P/S 5.9 1.9 3.0 2.1
P/CF 1.5 0.5 0.9 0.8
Absolute Valuation High Low Median Current Target Multiple Target E, S, B/
Share Target Price
P/Forward E 42.3 9.3 16.4 20.1 16.4 8.2 134.48
P/S 8.7 1.9 4.4 2.5 4.0 40.7 162.80
P/B 6.3 1.4 3.0 2.1 3.0 49.6 148.80
P/EBITDA 12.1 2.4 7.2 5.8 7.0 17.54 122.78
P/CF 16.4 3.9 9.0 7.1 9.0 14.33 128.97
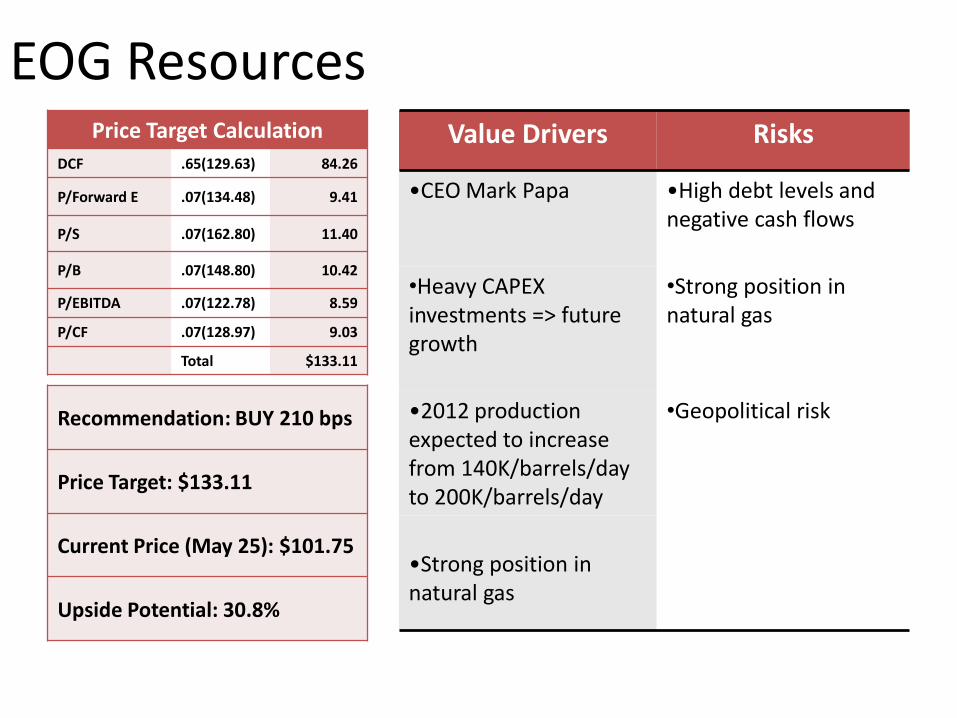
Recommendation: BUY 210 bps
Price Target: $133.11
Current Price (May 25): $101.75
Upside Potential: 30.8%
Value Drivers Risks
•CEO Mark Papa •High debt levels and negative cash flows
•Heavy CAPEX investments => future growth
•Strong position in natural gas
•2012 production expected to increase from 140K/barrels/day to 200K/barrels/day
•Geopolitical risk
•Strong position in natural gas
EOG Resources Price Target Calculation
DCF .65(129.63) 84.26
P/Forward E .07(134.48) 9.41
P/S .07(162.80) 11.40
P/B .07(148.80) 10.42
P/EBITDA .07(122.78) 8.59
P/CF .07(128.97) 9.03
Total $133.11

Final Recommendations
Company Price Target
(USD) Current Weight Change
Recommended Weight
Potential Upside
Schlumberger 72.21 174 bps Sell 75 bps 99 bps 7.3%
Nabors 26.82 199 bps Buy 75 bps 274 bps 88.1%
Halliburton 38.37 0 bps Hold 0 bps 22.3%
ConocoPhillips 64.71 290 bps Sell 290 bps 0 bps 24.2%
Chevron 125.47 379 bps Buy 80 bps 459bps 26.8%
EOG Resources 133.11 0 bps Buy 210 bps 210 bps 30.8%
Final recommendations based on analysis included and goal to maintain same exposure to specific energy industries