energy storage opportunities analysis phase ii final ... · energy storage opportunities analysis...
TRANSCRIPT

SANDIA REPORTSAND2002-1314Unlimited ReleasePrinted May 2002
Energy Storage Opportunities AnalysisPhase II Final ReportA Study for the DOE Energy StorageSystems Program
Paul Butler, Jennifer L. Miller and Paula A. Taylor
Prepared bySandia National LaboratoriesAlbuquerque, New Mexico 87185 and Livermore, California 94550
Sandia is a multiprogram laboratory operated by Sandia Corporation,a Lockheed Martin Company, for the United States Department ofEnergy under Contract DE-AC04-94AL85000.
Approved for public release; further dissemination unlimited.

Issued by Sandia National Laboratories, operated for the United States Departmentof Energy by Sandia Corporation.
NOTICE: This report was prepared as an account of work sponsored by an agencyof the United States Government. Neither the United States Government, nor anyagency thereof, nor any of their employees, nor any of their contractors,subcontractors, or their employees, make any warranty, express or implied, orassume any legal liability or responsibility for the accuracy, completeness, orusefulness of any information, apparatus, product, or process disclosed, or representthat its use would not infringe privately owned rights. Reference herein to anyspecific commercial product, process, or service by trade name, trademark,manufacturer, or otherwise, does not necessarily constitute or imply its endorsement,recommendation, or favoring by the United States Government, any agency thereof,or any of their contractors or subcontractors. The views and opinions expressedherein do not necessarily state or reflect those of the United States Government, anyagency thereof, or any of their contractors.
Printed in the United States of America. This report has been reproduced directlyfrom the best available copy.
Available to DOE and DOE contractors fromU.S. Department of EnergyOffice of Scientific and Technical InformationP.O. Box 62Oak Ridge, TN 37831
Telephone: (865)576-8401Facsimile: (865)576-5728E-Mail: [email protected] ordering: http://www.doe.gov/bridge
Available to the public fromU.S. Department of CommerceNational Technical Information Service5285 Port Royal RdSpringfield, VA 22161
Telephone: (800)553-6847Facsimile: (703)605-6900E-Mail: [email protected] order: http://www.ntis.gov/ordering.htm
3
SAND 2002-1314Unlimited ReleasePrinted May 2002
Energy Storage Opportunities Analysis Phase II Final Report
A Study for the DOE Energy Storage Systems Program
Paula A. Taylor and Jennifer L. MillerEnergetics Inc.
901 D Street S.W.Suite 100
Washington D.C. 20024
Paul C. ButlerSandia National Laboratories
P.O. Box 5800Albuquerque, NM 87185-0614
Abstract
This study on the opportunities for energy storage technologies determined electric utility application requirements,assessed the suitability of a variety of storage technologies to meet the requirements, and reviewed the compatibilityof technologies to satisfy multiple applications in individual installations. The study is called "OpportunitiesAnalysis" because it identified the most promising opportunities for the implementation of energy storagetechnologies in stationary applications. The study was sponsored by the U.S. DOE Energy Storage SystemsProgram through Sandia National Laboratories and was performed in coordination with industry experts fromutilities, manufacturers, and research organizations. This Phase II report updates the Phase I analysis performed in1994.
4
Acknowledgment
Preparation of this report would not have been possible without the substantial contributions of thestakeholder group that convened to discuss the energy storage technologies and applications representedin this report. The authors are pleased to acknowledge the following individuals for their contributions.
ManufacturersGeorge Hunt, GNB Industrial TechnologiesChristian St. Pierre & Benoit Pelletier, Argo TechPhil Eidler & Rob Parry, ZBB Technologies, Inc.Brad Roberts, Omnion PowerBill Kainer & Chuck Berry, Active PowerRichard Smith, Maxwell Energy Products, Inc.Kamal Kalafala, Intermagnetics GeneralMike Graveley, American Superconductor
Electric Power and Service CompaniesDenise Zurn, Northern States PowerSteve Beuning, Northern States PowerBruce Rauhe, Southern Company ServicesJerry Neal, Public Service Company of New MexicoRam Mukherji, Enron
Industry ConsultantsPhil Symons, Electricity Storage AssociationCarl Parker, International Lead Zinc Research OrganizationLaura Johnson & Kim Reichart, Energetics, Incorporated
Sandia National LaboratoriesNancy Clark, Stan Atcitty, John Boyes, & Jeff Braithwaite
U.S. Department of EnergyImre Gyuk (DOE Program Manager)
Sandia is a multiprogram laboratory operated by Sandia Corporation, a Lockheed MartinCompany, for the United States Department of Energy under Contract DE-AC04-94AL85000.
5
Contents
Executive Summary........................................................................................................................ 9
1. Introduction.............................................................................................................................. 9
1.1 The DOE Energy Storage Systems Program in the Context of Utility Restructuring andDistributed Power .................................................................................................. 9
1.2 Phase II Opportunities Analysis Objectives.......................................................................... 10
2. Electric Power Applications of Energy Storage .................................................................... 11
2.1 Applications Definitions ........................................................................................................ 11
2.2 Applications Technical Requirements................................................................................... 11
3. Technology for Electric Power Applications ........................................................................ 13
3.1 Energy Storage Technologies ................................................................................................ 13
3.2 Non-Storage Technology and Non-Technology Options ...................................................... 17
3.3 Energy Storage Technology Compatibility with Individual Applications ............................ 17
4. Necessary Future Work ......................................................................................................... 25
4.1 Cost Breakdowns for Comparison of Storage Systems to Alternatives................................ 25
4.2 Markets and Benefits of Energy Storage in the Competitive U.S. Electricity Industry........ 26
4.3 Multiple Applications to Increase Benefits of a Single Energy Storage System................... 26
Appendix A. Technical Approach for the Phase II Analysis .................................................... 27
Appendix B. Organizations Participating in the Phase II Opportunities Analysis ................... 28
Appendix C. Fact Sheets for Ten Electric Power Applications of Energy Storage .................. 34
Appendix D. Revisions to the Phase-I Cost-Breakdown Structure.......................................... 54
Appendix E. Resources for Revision of Markets and Benefits Estimates................................ 58

6
Figures
Figure 1. The AC Battery Installed at Brockway Standard's Lithography Plant in Homerville,GA. ........................................................................................................................................ 15
Figure 2. Electrochemical Capacitors .......................................................................................... 16Figure 3. Carbon-fiber and Resin Composite Flywheel Rotor..................................................... 16Figure 4. Intermagnetics General Corporation's Truckable SMES and the Superconducting
Magnet................................................................................................................................... 17Figure 5. Traditional coal-fired power plant ................................................................................ 19Figure 6. Schematic of a combustion gas turbine for electric power........................................... 19Figure 7. Diesel generators manufactured by Caterpillar for 60-Hz electric power applications 19Figure 8. Microturbines manufactured by Capstone Turbine Corporation use natural gas or
biofuels and drive high speed electrical generators .............................................................. 19Figure 9. Real-time transactions to buy and sell power provides electric power producers and
service providers a way of addressing competitive needs..................................................... 20Figure 10. Peaking gas combustion turbine at Texas Utilities..................................................... 20Figure 11. FACTS depends on Westinghouse's solid-state STATCOM Switching Device to
redirect power to under-utilized pathways............................................................................ 20Figure 12. Recycling and energy recovery pilot plant (cogeneration) in California uses anaerobic
composting to produce fuel gas that is dried and burned in an internal combustion engine tomake electricity; extra gas fuels heaters, dryers, and steam boilers...................................... 21
Figure 13. Substation auto transformers like this one by Waukesha Electric Systems canmanipulate taps to respond to 10 – 100 MVA transients ...................................................... 21
Figure 14. Distribution class capacitor banks made by Cooper Power Systems are typical of theparallel, series-parallel, or in a three-phase arrangement, 100, 150, and 200 kVar powerratings and 2,400 - to 21,600 - volt capacity......................................................................... 21
Figure 15. Oil coolers for transformers like this Seimens model help keep temperatures downeven during peak loading – as a result, transformers can support larger loads for longertimes before overheating....................................................................................................... 22
Figure 16. 100-foot, 12.5 kV, 1,250A underground transmission cable developed anddemonstrated by Intermagnetics General Corporation, Southwire Company, and the USDOE was installed as a high-temperature (4K) superconducting cable................................ 22
Figure 17. Fermilab's 1400-ton high-efficiency chiller................................................................ 22Figure 18. Static Interruptible Power Supplies (UPSs) like Exide Electronics’ One UPS Plus can
deliver hundreds of volt-amperes to ride through momentary service fluctuations andoutages................................................................................................................................... 23
Figure 19. Piller's Uniblock II rotary UPS combines digital control and power electronics with arotating mass that provides inertia to drive a motor/generator for ride-through of momentaryservice fluctuations................................................................................................................ 23
Figure 20. Seimen's SIPCON – DVR (dynamic voltage restorers) shown here in a turn-key,semi-trailer container; these units located between distribution and load provide power(MVA) and energy (hundreds of kilojoules) to improve power quality............................... 23

7
Figures (continued)
Figure C- 1. System Need for Rapid Reserve Power............................................................... 35Figure C- 2. Storage Response to Provide Rapid Reserve Power............................................ 35Figure C- 3 System Need for Area Control and Frequency Responsive Reserve …….…. 36Figure C- 4. Storage Response to Provide Area Control or Frequency Responsive Reserve ..37Figure C- 5. Effect of storage used for Area Control or Frequency Responsive Reserve on utility grid load…………………………………………………………………..37Figure C- 6. Typical Load Profile for an Aggregation of Customers - Peak has Potential to Approach Capacity as Load Grows ….…………………………………………38Figure C- 7. Energy Storage Response to Commodity Storage Application Demands ……38Figure C- 8. Utility System Needs to Address Transients and Achieve Stability …………….40Figure C- 9. Storage Response to Address Transients ………………………………….…..41Figure C- 10. System Need for VARs to Correct Voltage Loss Due to Impedance……………42Figure C- 11. Storage Injecting and Absorbing VARs During Discharge, Charge and Idle….. 42Figure C- 12. Load Exceeds Acceptable Percentage of Transmission Capacity ………………44Figure C- 13. Transmission Load Grows to Meet Demand …………………………………....45Figure C- 14. Storage Response to Increase Transmission Capacity Until New Facilities are Cost-justified …………………………………………………………………….45Figure C- 15. Distribution Load Exceeds Acceptable Percentage of Capacity ………………...46Figure C- 16. Distribution Load Growth Approaches Capacity ………………………………46Figure C- 17. Storage Provides Peak Power to Temporarily Defer Purchase of New Equipment Until it is Cost-justified ………………………………………………………….47Figure C- 18. Customer Demand that Creates Economic Need to Reduce Peaks .…………..48Figure C- 19. Energy Storage Providing Power to Manage Customer Load Profile …………..48Figure C- 20. Aggregate Load Peaks During a Typical Week that do not Coincide with Renewable Production Peaks ……………………………………………………50Figure C- 21. Off-peak Storage of Renewable Energy for On-peak Dispatch to Increase Capacity Credit and Economic Value of Renewables ..…………………………51Figure C- 22. A 50-volt Transient Spike on a 480-Volt Line that Could Cause an Outage at a Production Facility……………………………………………………………….53Figure C- 23. Storage Delivers and Absorbs Power Fluctuations as Needed ………………….53
Tables
Table 1. Definitions and Categories of Electric Power Applications of Energy Storage ...... 12Table 2. Summary of Applications Requirements ................................................................. 14Table 3. Non-Storage Technology and Non-Technology Options for Electric Power
Applications ............................................................................................................. 18Table 4. Technical and Strategic Advantages and Disadvantages of Non-Storage Technology
and Non-Technology Options .................................................................................. 19Table 5. Functional Capabilities of Storage Technologies for Electric Power Applications. 24
Table D-1. Cost Components for an Energy Storage System.................................................... 57
8
Acronyms and Abbreviations
APS Advanced Pumped StorageASTM American Society For Testing and MaterialsCAES Compressed Air Energy StorageCAS Compressed Air StorageDOE Department of EnergyECs Electrochemical CapacitorsESS Energy Storage SystemsFACTS Flexible Alternating Current Transmission SystemFES Flywheel Energy StorageHTS High Temperature SuperconductivityPCS Power Conversion SystemR&D Research And DevelopmentSMES Superconducting Magnetic Energy StorageSNL Sandia National LaboratoriesT&D Transmission And DistributionVAR Volt-Amp ReactiveVRLA Valve-Regulated Lead-Acid
9
Energy Storage Opportunities Analysis Phase II Final ReportA Study for the DOE Energy Storage Systems Program
Executive Summary
The Opportunities Analysis was intended tocharacterize the potential for providing energystorage options to provide significant benefits toelectric utilities and their customers. This study, thePhase II – Opportunities Analysis expands on thePhase I study in defining the potential applicationrequirements, preliminary benefits and costs ofenergy storage. Uncertainty resulting from electricpower industry changes was considered and a broadarray of technical experts participated in the analysis.
This Phase II study updates and enhances severalaspects of the earlier Phase I Opportunities Analysisreport published in 1994. The Phase II studyincludes definitions and characteristics of utilityapplications for energy storage and fact sheets foreach application. The Phase II study participantsconcluded that ten of the original thirteen feasibleapplications of energy storage systems are in generaldemand and have high value for electric powerproducers and their customers. Power and energyrequirements were identified and a duty cycle wasdefined for each application. This study expandedthe scope from Phase I to include emerging non-battery technologies to serve utility applications.Three categories of energy storage technologies areaddressed in this report:
− Electrochemical storage devices includingflooded and valve-regulated lead-acid batteries,lithium/polymer batteries, nickel/metal hydridebatteries, sodium/sulfur batteries, vanadium-redox batteries, zinc/bromine batteries, andelectrochemical capacitors
− Electromechanical storage devices includingsteel and composite rotor flywheels
− Electrical storage devices such assuperconducting magnetic energy storage(SMES).
Four important conclusions regarding energy storagetechnologies can be gained from this study:
− The lead-acid battery technologies have the mostfield experience and can adequately satisfy mostof the defined utility energy storage applications.However, if footprint and portability areimportant, then lead-acid batteries may not be anideal energy storage solution
− The remaining electrochemical storage devices(sodium/sulfur, nickel/metal hydride,lithium/polymer, vanadium-redox andzinc/bromide batteries and electrochemicalcapacitors) are considered potential candidatesfor all applications, however, some of thesetechnologies are just emerging as pilot-scalesystems and have not been fully evaluated
− Steel rotor FES has limited promise for the entirearray of applications but is well-suited to hybridFES/battery power quality applications.Composite-rotor FES has potential for broaderapplicability but will require significantdevelopment to compete with other, more maturetechnologies and non-technology options.
− SMES has the potential to provide electricalstorage to a majority of the applications.However, this technology is still emerging, andmore R&D will be needed to make SMEScompetitive in a wide variety of utility storagemarkets.
This Phase II report provides a more updatedframework for evaluating energy storage in utilityapplications.
1. Introduction
1.1 The DOE Energy Storage SystemsProgram in the Context of UtilityRestructuring and DistributedPower
The U.S Department of Energy (DOE) Energy StorageSystems (ESS) Program at Sandia National Laboratories(SNL) is responsible for the development of hardware(storage components, power electronics, control systems,system integration components and system testing) andcommunication to stakeholders of the status andbenefits of storage systems in specific applications. As the

10
electric power industry in the U.S. is changing, the ESSProgram is responding by conducting research anddevelopment (R&D) and analyses that help to increase thereliability and economic value of electricity production inthe U.S. while also helping to make it moreenvironmentally sustainable.
In the last three decades, the electric power industry haschanged significantly. In the 1970s the nation’s electricpower industry consisted of regulated, vertically-integratedcompanies that generated, transmitted and distributedelectricity under terms established by Federal and Stateagencies. In general, electric power producers owned andoperated large power plants with hundreds of megawatts ofgenerating capacity, transmission lines that carried powerover long distances and distribution lines that servedcommunities and individual customers that existed far fromthe large central generating station. This approach tomaking and delivering electric power took advantage ofeconomies of scale that were available in a regulatedbusiness environment and possible with the technology ofthe era. However, the 1980s and ‘90s brought with them aseries of legislative acts and technological advances thatreduced the value of a vertically-integrated businessstructure and the economy of scale of large, central powerstations.
Regulators ratified rules that increased competition andelectric power producers began to separate their generation,transmission and distribution and customer serviceoperations into discrete business units. One likely outcomeof this industry restructuring is that all electricityconsumers will be able to choose their power providermuch like telephone account holders now choose theirlong-distance service providers. As of June 2001, twenty-four states and the District of Columbia have enactedcomprehensive electricity restructuring legislation orregulatory orders.
In this competitive environment, smaller, distributedpower generation and delivery have increased invalue and new companies that provide energyservices have emerged to serve the changing marketplace. Coupled with the new economic viability ofsmaller distributed power facilities, technicaladvances have made new technologies available toserve distributed power applications. Among thesetechnologies that compliment and compete withtraditional electric power technologies are moreefficient diesel and gas generators, microturbines,fuel cells, fast switches, sophisticated on-site andremote controls and turn-key energy storage systemsthat include electrochemical batteries,electromechanical systems (flywheels) and directcurrent (DC) storage devices.
In response to the changes in the U.S. electric powerindustry, the ESS Program has helped to identify theapplications that energy storage can best serve,
conducted R&D on technologies for thoseapplications and transferred technology to powerequipment manufacturers and power producers. Aspart of this process to ensure that the nation hasaccess to the most economically and environmentallysustainable power technologies available, the ESSProgram initiated an Opportunities Analysis forenergy storage in 1993. This analysis had the goal ofdeveloping improved understanding of electric-powerapplications’ requirements, battery systems’capabilities and the benefits possible from servingapplications with battery storage.
Even as SNL prepared the report for theOpportunities Analysis for publication in 1994,participants recognized that dramatic changes in theelectric power industry and improvements inemerging technologies would make updates to theresults necessary. In recognition of this need, the titleto that report identified the project as Phase I of ananalysis that would be part of a continuing body ofwork.1 As expected, the applications and thetechnologies to serve them changed. In 1998, theESS Program initiated Phase II of the OpportunitiesAnalysis to expand the scope of the study to include awider range of energy storage technologies and toaddress the effects of restructuring on theapplications’ requirements. SNL pursued anapproach for the Phase II analysis similar to thePhase I approach which consisted of workingmeetings with stakeholders in the electric powerindustry and post-meeting research and analysis.Appendix A presents the details of the approach.Appendix B presents the names and roles of theindustry stakeholders that participated in the workingmeetings. The following section details theobjectives of the Phase II Opportunities Analysis.
1.2 Phase II Opportunities AnalysisObjectives
The Phase I analysis identified 13 applications ofbattery energy storage systems and three sets ofcombined applications that a single energy storagesystem could serve to achieve better benefit/costratios. The report also discussed the best-fitcombinations of specific technologies withapplications and combinations of applications. ThePhase I document presented the first attempt to break
1 Battery Energy Storage for Utility Applications:Phase I – Opportunities Analysis, P. Butler,SAND94-2605, 1994.

11
down the cost components of an energy storagesystem so that direct benefit/cost assessment againsttraditional technologies was possible. The report alsomade the first attempt to quantify the markets forenergy storage systems in electric power applicationsand estimate the benefits to the nation of energystorage penetrating those markets.
As a follow-on to the Phase I work, the Phase IIeffort had the following original objectives:
1. Reassess the value of applications for energystorage in a competitive electric power industry
2. Refine definitions of application requirementsfor energy storage systems
3. Identify the best applications of specific energystorage system technologies
4. Reassess the potential market size and benefits ofenergy storage
5. Refine the previously defined cost breakdownfor energy storage systems to allow comparisonof storage systems and other technologies forelectric power applications.
While analysts pursued the first three objectives, theyalso identified significant barriers to achieving thefourth and fifth objectives of the Phase II work. As aresult, objectives four and five were deferred for lateranalysis that would be founded on more substantialdata than were available at the time of the Phase IIwork. Section 4 of this report presents a discussionof the necessary future work in markets and benefitsassessment and refinements of cost breakdowns.
2. Electric Power Applications ofEnergy Storage
2.1 Applications Definitions
The group of industry experts who participated in thePhase II project used the perceived need for eachapplication across the nation and the potentialtechnical and economic benefits for utilities ascriteria to evaluate the 13 applications identified inthe Phase I report and other potential applications.From this process emerged the definitions shown inTable 1 for ten individual applications of energystorage that are in general demand and have highvalue for electric power producers and theircustomers. Table 1 also shows an organization of theapplications under headings of Generation,Transmission and Distribution (T&D) and CustomerService. Although utility functions of generation,
transmission and distribution and customer servicenow generally occur in separate business units, theorganization for the applications under thoseheadings does not signify that a storage systemcould/should serve only one application orapplication type. In fact, as discussed in Section 4.2of this report, a storage system is most valuable to autility when it performs multiple functions in morethan one of these groups of applications.
2.2 Applications TechnicalRequirements
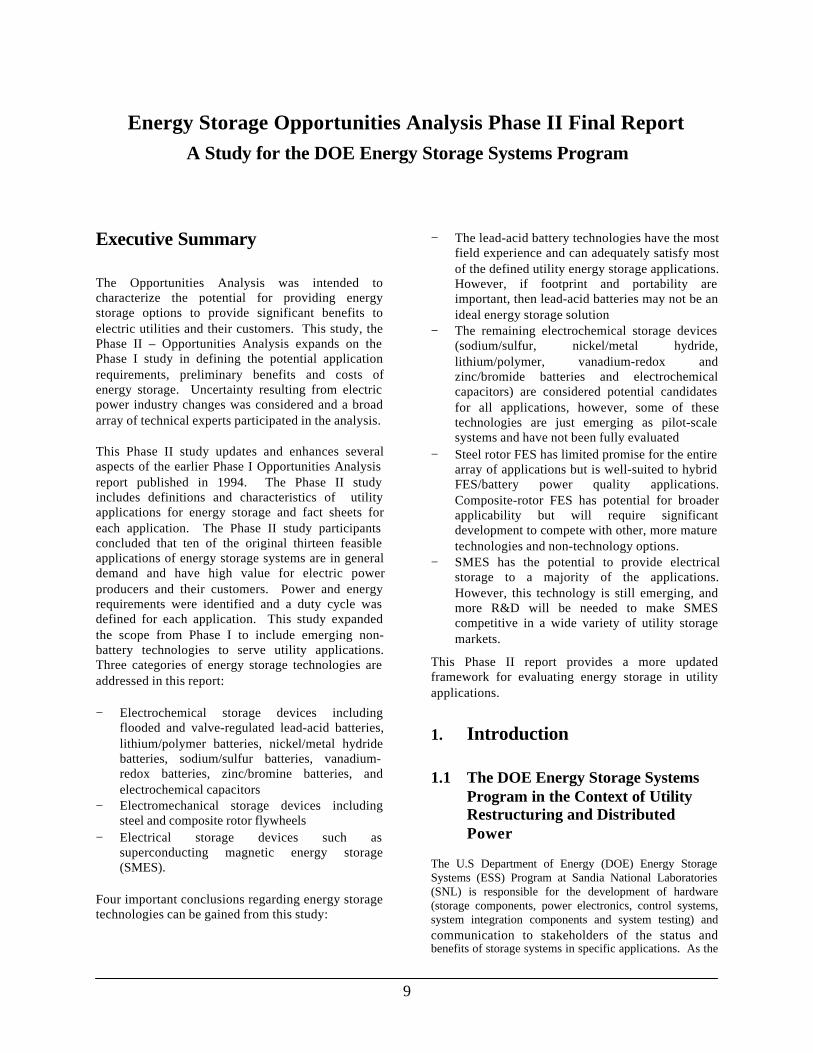
Regulatory, operational and economic influencescreate technical requirements for each electric powerapplication of energy storage. The industry expertswho participated in this effort identified theapplication requirements shown below as the mostsignificant to electric power applications: power,duration of discharge, AC system voltage, floor-space requirements, portability, and the type, numberand distribution of duty cycles. The characteristics ofthe operating environment are also important fortechnical requirements for an energy storage system.Table 2 summarizes the requirements of energystorage systems for the ten candidate utilityapplications.
Power RequirementsKilo/mega-watts (kW or MW) for real power,kilo/mega-vars (kVAR or MVAR) for reactive power,kilo/mega-volt-amperes (kVA or MVA) for acombination of real and reactive power
Power requirements determine the size of the powerconversion system and can influence the capacity ofthe system via the power-to-energy ratio. An energystorage system must be rated so that power drain doesnot significantly reduce its cycle life. Powerrequirements impact the size and cost of the energystorage system, the support structure and thebuilding. High power levels increase the cost of thecontrol and power-handling equipment. Electric arcfurnaces, cranes, welding machines, rolling mills andother induction motors typically have large and/orwidely fluctuating needs for reactive power that cancause production or operational disturbances andreduce the life of the manufacturing equipment. Utilitiesexperience higher impedance and reduced capacity ontransmission and distribution lines with reactive loading.Therefore power providers typically impose a kVA demandcharge to compensate for this cost. To avoid this charge,industrial facilities often try to supply reactive poweronsite using generators, capacitors, synchronousmotors and other technologies.

12
Table 1. Definitions and Categories of Electric Power Applications of Energy Storage
Category Application Name and DefinitionRapid ReserveGeneration capacity that a utility holds in reserve to meet North American Electric ReliabilityCouncil (NERC) Policy 10* requirements to prevent interruption of service to customers in theevent of a failure of an operating generating station.Area Control and Frequency Responsive ReserveThe ability for grid-connected utilities to prevent unplanned transfer of power between themselvesand neighboring utilities (Area Control) and the ability of isolated utilities to instantaneouslyrespond to frequency deviations (Frequency Responsive Reserve). Both applications stem fromNERC Policy 10 requirements.
Gen
erat
ion
Commodity StorageStorage of inexpensive off-peak power for dispatch during relatively expensive on-peak hours. Inthis report, Commodity Storage refers to applications that require less than four hours of storage.Transmission System StabilityAbility to keep all components on a transmission line in sync with each other and prevent systemcollapse.Transmission Voltage RegulationAbility to maintain the voltages at the generation and load ends of a transmission line within fivepercent of each other.Transmission Facility DeferralAbility of a utility to postpone installation of new transmission lines and transformers bysupplementing the existing facilities with another resource.
Tra
nsm
issi
on&
Dis
tribu
tion
Distribution Facility DeferralAbility of a utility to postpone installation of new distribution lines and transformers bysupplementing the existing facilities with another resource.Customer Energy ManagementDispatching energy stored during off-peak or low cost times to manage demand on utility-sourcedpower.Renewable Energy ManagementApplications through which renewable power is available during peak utility demand (coincidentpeak) and available at a consistent level.
Cus
tom
erSe
rvic
e
Power Quality and ReliabilityAbility to prevent voltage spikes, voltage sags, and power outages that last for a few cycles (lessthan one second) to minutes from causing data and production loss for customers.
* (available for download at http://www.nerc.com/~oc/)

13
Duration of Discharge/Energy RequirementsTime units (sec, min, hr) for duration of dischargeand kilo- or mega-watt-hours (kWh or MWh) forenergy required
Energy is the amount of power delivered over aperiod of time. Therefore, the longer the dischargeduration at any power, the greater the energy that thestorage system must be able to deliver. Energyrequirements typically determine the size of thesystem. Consideration must be given to the effect ofdischarge depth on the service life of the system.Higher energy requirements result in increases in thesize and cost of the shelter and support structure.
AC System Voltage RequirementsRoot-mean square of the load in kilovolts (kVRMS)
The AC system voltage and maximum currentdemand determine the size and the cost of thetransformer between the power conditioning systemand the AC source and load. Voltage requirementsalso influence the gauge and cost of cabling for thesystem.
Floor Space/Footprint RequirementsSquare feet of area (ft2) that the energy storagesystem occupies
As implied above, the application requirementsinfluence physical size and the physical size affectsthe cost of entire system. For many applications, andfor some utilities, space availability is verysignificant in the selection and cost of a storagesystem.
Portability RequirementsRelative difficulty or cost of transporting the energystorage system to either temporary or permanentsites
Some applications are temporary in nature, thereforethe ability to transfer a storage system from site tosite can significantly increase its overall value.Portability varies greatly between types of systems.Superconducting magnetic energy storage (SMES)units, battery storage systems and flywheel energystorage systems are all now offered commercially aspre-packaged, turn-key systems that fit intocontainers with all necessary monitors, controls andpower conditioning equipment for easy transportationand installation. For large systems requiringsignificant energy content, however, portable systemsmay not be feasible, as the size of the storage mediaoften becomes impractical or non-economic fortransport.
Duty Cycle RequirementsQuantity and periodicity (uniformily distributed, vs.clustered and predictable vs. random) of dischargeover a specified time period
The characteristics of the duty cycle affect theperformance and service life of the storage device.Cycling requirements influence the size and change-out interval for both the storage media and peripheralcomponents. The nature of the duty cycle profile, itsdistribution and frequency also affect the efficiencyof virtually all storage systems. While frequentcycles increase the efficiency of some storage media,they decrease efficiency of others. Frequent cyclingalso introduces transient effects and associatedsystem inefficiencies that can increase cycle life cost,increase the necessary size of the storage or powerelectronics and, therefore, the cost of the system.
3. Technology for Electric PowerApplications
3.1 Energy Storage Technologies
Analysts established criteria to choose technologiesthat were both advanced enough in their developmentto be viable candidates for the storage applicationsunder consideration, but that still required additionalsystems or component development for full marketpenetration. Based upon these two criteria, thefollowing storage technologies were chosen forinclusion in this report: lead-acid batteries, (floodedand valve-regulated), lithium/polymer batteries,nickel/metal hydride batteries, sodium/sulfurbatteries, vanadium-redox batteries, zinc/brominebatteries, flywheels (steel and composite rotors),superconducting magnetic energy storage andelectrochemical capacitors.
14
Table 2. Summary of Applications Requirements
Application Power* Storage(minutes)
ACVoltage(kVRMS)
Floor Space(importance)
Portability(importance)
Duty CycleRequirements
SpecialDemands
RapidReserve
101-102
real101-102 101-102 Medium Low 101/year, random,
discharge onlyNone
Area Control& FrequencyResponsiveReserve
101-102
realCharge/dischargecycles of<101
101-102 Low Low Random,continuouscharge/dischargecycles clustered in2-hour blocksdaily
None
CommodityStorage
100-102
real102-103 101-103 Medium Negligible 102/year, regular,
periodic, weekdayblock discharge,increased use inshoulder months
Harmonics aremore importantthan in othergenerationapplications
TransmissionSystemStability
101-102
complex10-3-10-1 101-103 Medium Low 102/year, random,
charge &discharge cycles
None
TransmissionVoltageRegulation
100-101
reactive101-102 101-102 Medium High 102/year, random
charge &discharge cyclestypicallyweekdays,seasonal byregion – at least6-7 months
Safety concernsare important
TransmissionFacilityDeferral
10-1-101
complex102 101-102 High High 102/year, most
likely duringweekday peaks,charge &discharge
Safety concernsare important
DistributionFacilityDeferral
10-1-100
real102 100-101 High High 102/year, most
likely duringweekday peaks,charge &discharge
Safety concernsare important
CustomerEnergyManagement
10-2-101
complex101-102 10-1-101 High Varies 102 - 103/year,
regular periodsSafety concernsare important
RenewableEnergyManagement
10-2-102
complex10-3-103 Variable High High 102 - 103/year,
regular periods,discharge only,unpredictablesource
Hostileenvironmentsincludingextreme heatand cold,particulates andcorrosiveatmospheres
PowerQuality &Reliability
10-2-101
complex10-3-100 10-1-101 High Varies 102 - 103/year,
irregular periods,charge &discharge
Safety concernsare important
* Real (MW), Reactive (MVAR), or Complex (MVA)

15
Appendix C of this report contains fact sheets foreach application identified above. The fact sheetsdiscuss the applications in terms of their operationaland economic significance in the electric powerindustry and the technical requirements they imposeon energy storage systems. The fact sheets includegraphical illustration of a load profile that creates theapplication, text description of the application and therationale for storage. The fact sheets also present thepower and energy requirements for the application,annual number of cycles that the system wouldexperience and the expected distribution of cyclesthroughout the year.
Electrochemical Storage Systems
Electrochemical batteries are storage media in whichreversible electrochemical reactions enable storage ofelectrical energy as chemical potential and release ofthat energy on demand. In general, electrical energyintroduced into an electrochemical battery causesreactions that make one electrode lose electrons andthe other electrode gain electrons. The potentialenergy is stored in the charged electrodes and theyrelease it when they return to their uncharged states.Because these electrochemical reactions are notperfectly efficient, some of the energy is lost in bothcharging and discharging the battery. Each batterytechnology has its own unique set of electrochemicalreactions, materials, and electrical characteristics.This wide variety of attributes leads to tremendousdiversity in battery types and uses.
To be useful in electric power applications describedin this report, the battery must be part of a fullyintegrated system that includes sophisticated solid-
state power conversion devices, monitors, controls,climate controls, utility and user interface equipment,safety devices and transportation features. Thetechnical challenges of integrating subsystems withina turn-key storage system are applicable to alltechnologies addressed in this chapter.
Electrochemical batteries considered in this studyinclude the most technically mature and wellunderstood electrochemistries and those justemerging for field demonstrations. The most maturetechnology, flooded lead-acid batteries and valve-regulated lead-acid (VRLA) batteries, have been inservice in electric power applications such as thoseidentified in this report for nearly two decades2.Figure 1 shows a 10-second, 1 MW lead-acid batteryenergy storage system installed at a lithography plantto improve power quality by protecting the plantfrom surges, sags and momentary interruptions.Zinc/bromine, sodium/sulfur and vanadium-redoxbatteries also have some field experience in electricpower applications3, but are at earlier stages of theirtechnical maturity than lead-acid technologies.Lithium/polymer and nickel/metal hydride, alsoincluded in this study as candidate storage media, arejust emerging in pilot scale systems that might servesome of the electric power applications identified inthis report. Linden’s battery handbook containscomplete descriptions of the characteristics of theelectrochemistries mentioned above4.
2Lessons Learned from the Puerto Rico BatteryEnergy Storage System, M. Farber DeAnda, et al.,SAND99-2232, 1999; Final Report on theDevelopment of a 250kW Modular, Factory-Assembled BESS, Corey, et al., SAND97-1226,1997; Final Report on the Development of a 2MW/10 Second Battery Energy Storage System toPower Disturbance Protection, Omnion, #DE-FC04-94AL99852.3 Development of Zinc/Bromine Batteries for Load-leveling Applications; Phase II Final Report,SAND89-2691, 1989.4 Handbook of Batteries 2nd Edition, D. Linden ed.,McGraw-Hill Book Company; New York. 1994.
Figure 1. The AC Battery Installed atBrockway Standard's LithographyPlant in Homerville, GA.
16
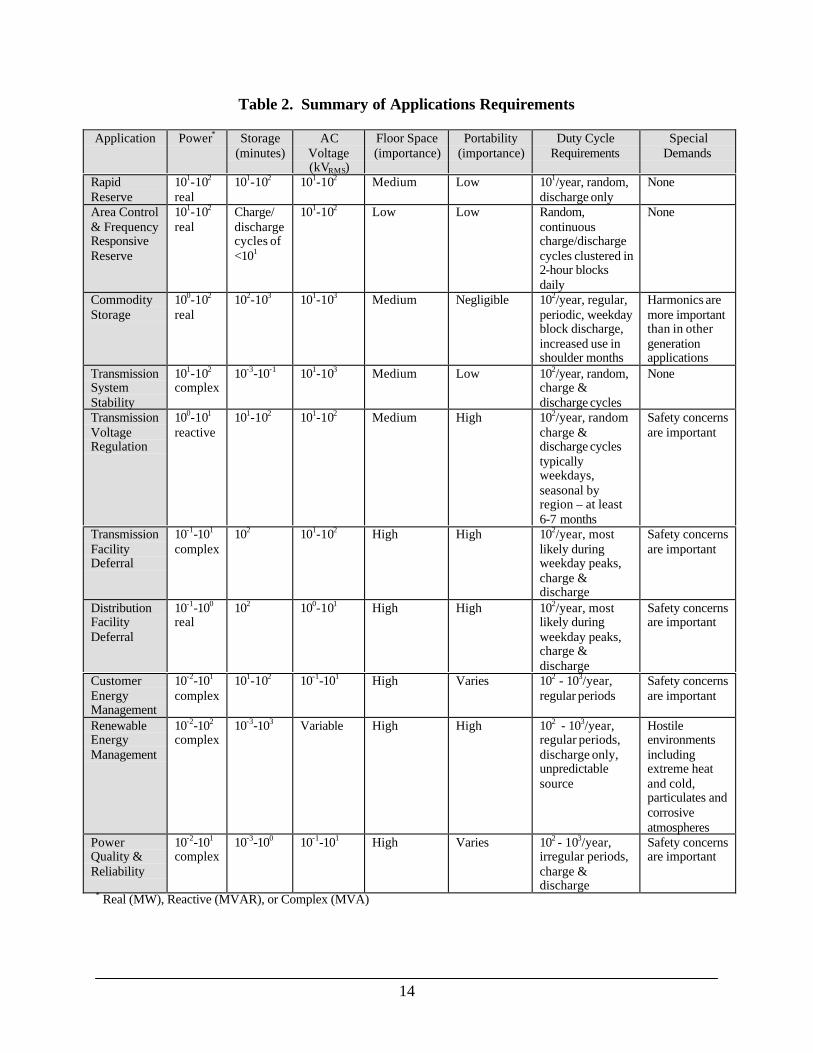
Electrochemical capacitors, or ECs, are the majornew capacitor technology to emerge in the last 15years. An electrochemical capacitor can be thoughtof as part battery and part capacitor. Electrochemicalcapacitors are also known under a variety of othernames and trademarks including supercap,ultracapacitor, double-layer capacitor, etc. In thesimplest terms, electrochemical capacitors resemblebatteries because the charge is stored by ions andresemble capacitors because no chemical reaction isinvolved in energy delivery. However, under certain
conditions, called pseudocapacitance, chemicalreactions do occur within the capacitor and serve toincrease the capacitor’s energy density.
Electrochemical capacitors exhibit much greaterenergy densities compared to traditional capacitorsdue to the use of extremely high surface areaelectrodes which store charge in an ionic double layernear the electrodes' surfaces. Figure 2 showselectrochemical capacitors under development byMaxwell Technologies.
Electromechanical Energy Storage Systems(Flywheel Systems)
In electromechanical systems, the kinetic energy of amoving mass stores electrical energy. The mostprevalent type of mass in an electromechanicalstorage system is a rotating mass, or flywheel. Likeelectrochemical batteries, flywheels must be part of afully integrated system that includes sophisticatedsolid-state power conversion devices, monitors,controls, climate controls, utility and user interfaceequipment, safety devices and transportation featuresto be useful in electric power applications describedin this report.
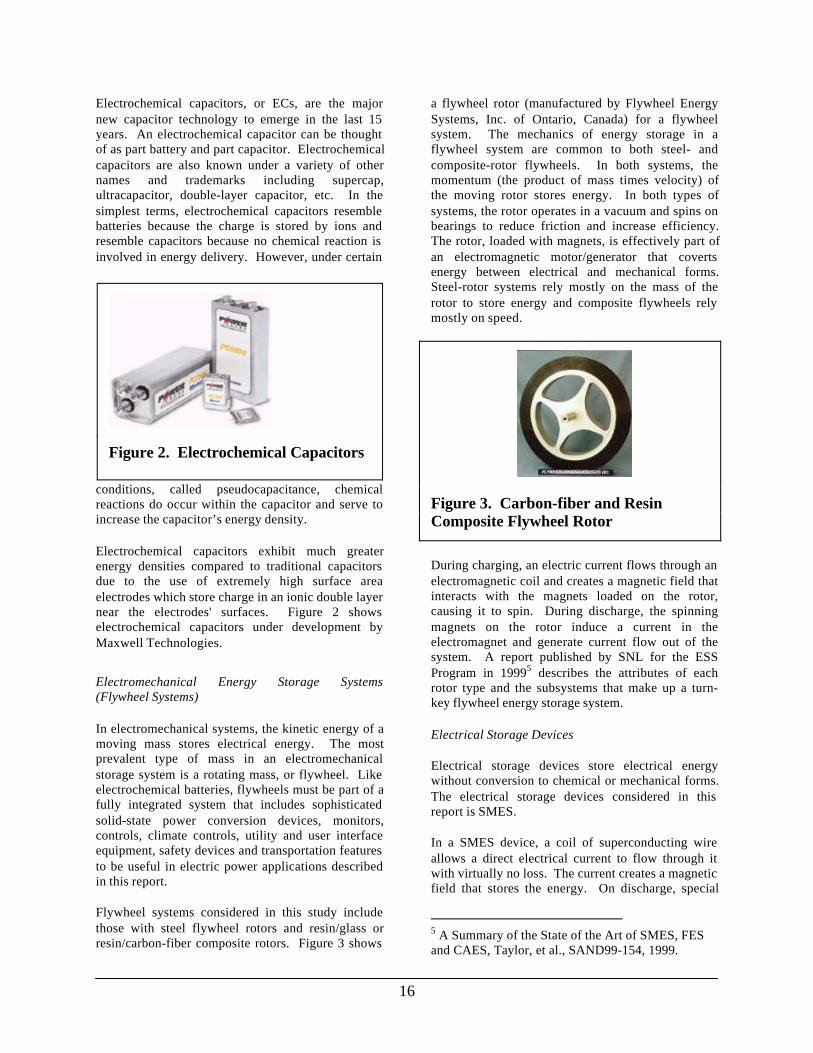
Flywheel systems considered in this study includethose with steel flywheel rotors and resin/glass orresin/carbon-fiber composite rotors. Figure 3 shows
a flywheel rotor (manufactured by Flywheel EnergySystems, Inc. of Ontario, Canada) for a flywheelsystem. The mechanics of energy storage in aflywheel system are common to both steel- andcomposite-rotor flywheels. In both systems, themomentum (the product of mass times velocity) ofthe moving rotor stores energy. In both types ofsystems, the rotor operates in a vacuum and spins onbearings to reduce friction and increase efficiency.The rotor, loaded with magnets, is effectively part ofan electromagnetic motor/generator that covertsenergy between electrical and mechanical forms.Steel-rotor systems rely mostly on the mass of therotor to store energy and composite flywheels relymostly on speed.
Figure 3. Carbon-fiber and ResinComposite Flywheel Rotor
During charging, an electric current flows through anelectromagnetic coil and creates a magnetic field thatinteracts with the magnets loaded on the rotor,causing it to spin. During discharge, the spinningmagnets on the rotor induce a current in theelectromagnet and generate current flow out of thesystem. A report published by SNL for the ESSProgram in 19995 describes the attributes of eachrotor type and the subsystems that make up a turn-key flywheel energy storage system.
Electrical Storage Devices
Electrical storage devices store electrical energywithout conversion to chemical or mechanical forms.The electrical storage devices considered in thisreport is SMES.
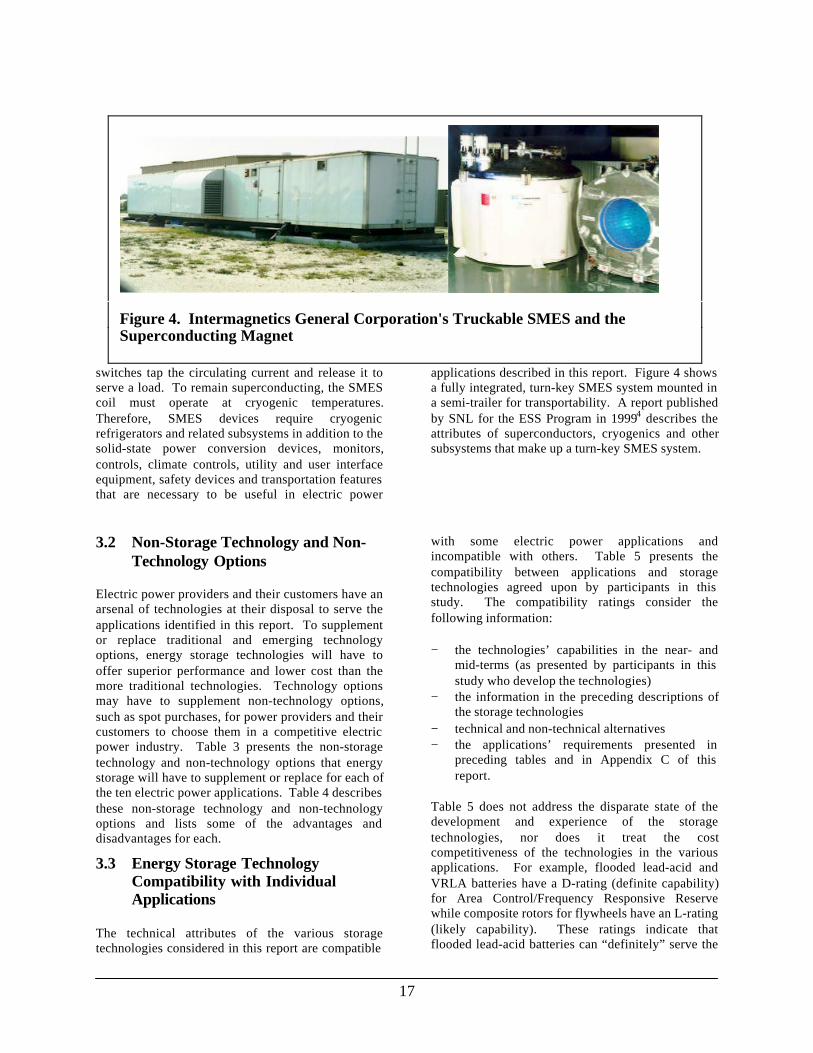
In a SMES device, a coil of superconducting wireallows a direct electrical current to flow through itwith virtually no loss. The current creates a magneticfield that stores the energy. On discharge, special
5 A Summary of the State of the Art of SMES, FESand CAES, Taylor, et al., SAND99-154, 1999.
Figure 2. Electrochemical Capacitors
17
switches tap the circulating current and release it toserve a load. To remain superconducting, the SMEScoil must operate at cryogenic temperatures.Therefore, SMES devices require cryogenicrefrigerators and related subsystems in addition to thesolid-state power conversion devices, monitors,controls, climate controls, utility and user interfaceequipment, safety devices and transportation featuresthat are necessary to be useful in electric power
applications described in this report. Figure 4 showsa fully integrated, turn-key SMES system mounted ina semi-trailer for transportability. A report publishedby SNL for the ESS Program in 19994 describes theattributes of superconductors, cryogenics and othersubsystems that make up a turn-key SMES system.
3.2 Non-Storage Technology and Non-Technology Options
Electric power providers and their customers have anarsenal of technologies at their disposal to serve theapplications identified in this report. To supplementor replace traditional and emerging technologyoptions, energy storage technologies will have tooffer superior performance and lower cost than themore traditional technologies. Technology optionsmay have to supplement non-technology options,such as spot purchases, for power providers and theircustomers to choose them in a competitive electricpower industry. Table 3 presents the non-storagetechnology and non-technology options that energystorage will have to supplement or replace for each ofthe ten electric power applications. Table 4 describesthese non-storage technology and non-technologyoptions and lists some of the advantages anddisadvantages for each.
3.3 Energy Storage TechnologyCompatibility with IndividualApplications
The technical attributes of the various storagetechnologies considered in this report are compatible
with some electric power applications andincompatible with others. Table 5 presents thecompatibility between applications and storagetechnologies agreed upon by participants in thisstudy. The compatibility ratings consider thefollowing information:
− the technologies’ capabilities in the near- andmid-terms (as presented by participants in thisstudy who develop the technologies)
− the information in the preceding descriptions ofthe storage technologies
− technical and non-technical alternatives− the applications’ requirements presented in
preceding tables and in Appendix C of thisreport.
Table 5 does not address the disparate state of thedevelopment and experience of the storagetechnologies, nor does it treat the costcompetitiveness of the technologies in the variousapplications. For example, flooded lead-acid andVRLA batteries have a D-rating (definite capability)for Area Control/Frequency Responsive Reservewhile composite rotors for flywheels have an L-rating(likely capability). These ratings indicate thatflooded lead-acid batteries can “definitely” serve the
Figure 4. Intermagnetics General Corporation's Truckable SMES and theSuperconducting Magnet
18
application and that composite flywheels are “likely”to be able to serve the application in the future.These ratings are based on the fact that lead-acidtechnology has already successfully served theapplication and composite flywheel developersbelieve that their technology will. Therefore, theratings do not reflect which technology will addressthe application requirements more cost effectively
when they are at the same level of technical maturityand experience.
Table 3. Non-Storage Technology and Non-Technology Options for Electric PowerApplications
Application TechnologyRapid Reserve Centralized stations: backed-off thermal fossil, combustion gas turbines, small
diesel generator systems, spot purchases (in the future competitive industry);Distributed units: diesel generators, microturbines
Area Control and FrequencyResponsive Reserve
Intermediate cycling and peaking plants, combustion turbines
Commodity Storage Flexible AC Transmission System (FACTS)*, CogenerationTransmission System Stability Auto transformers, Flexible AC Transmission System (FACTS)Transmission VoltageRegulation
Capacitor banks
Transmission Facility Deferral Diesel generators, oil coolers for transformers, superconducting cables (future)Distribution Facility Deferral Diesel generators, oil coolers for transformers, superconducting cables (future)Customer Energy Management Thermal storage (passive solar, chiller), diesel generators, microturbinesRenewable EnergyManagement
Diesel generators
Power Quality and Reliability Diesel generators, static uninterruptible power supplies (UPS), rotary UPS,dynamic voltage restorers
*While FACTS does not store energy for dispatch during peak times, the technology allows reconfigured dispatch of existinginfrastructure and redirects surplus power around bottlenecks in transmission systems so that load peaks can be served. However,FACTS is only a partial solution for commodity storage because the arbitrage option is not available.
19
Table 4. Technical and Strategic Advantages and Disadvantages of Non-StorageTechnology and Non-Technology Options
Option Advantages Disadvantages Applications
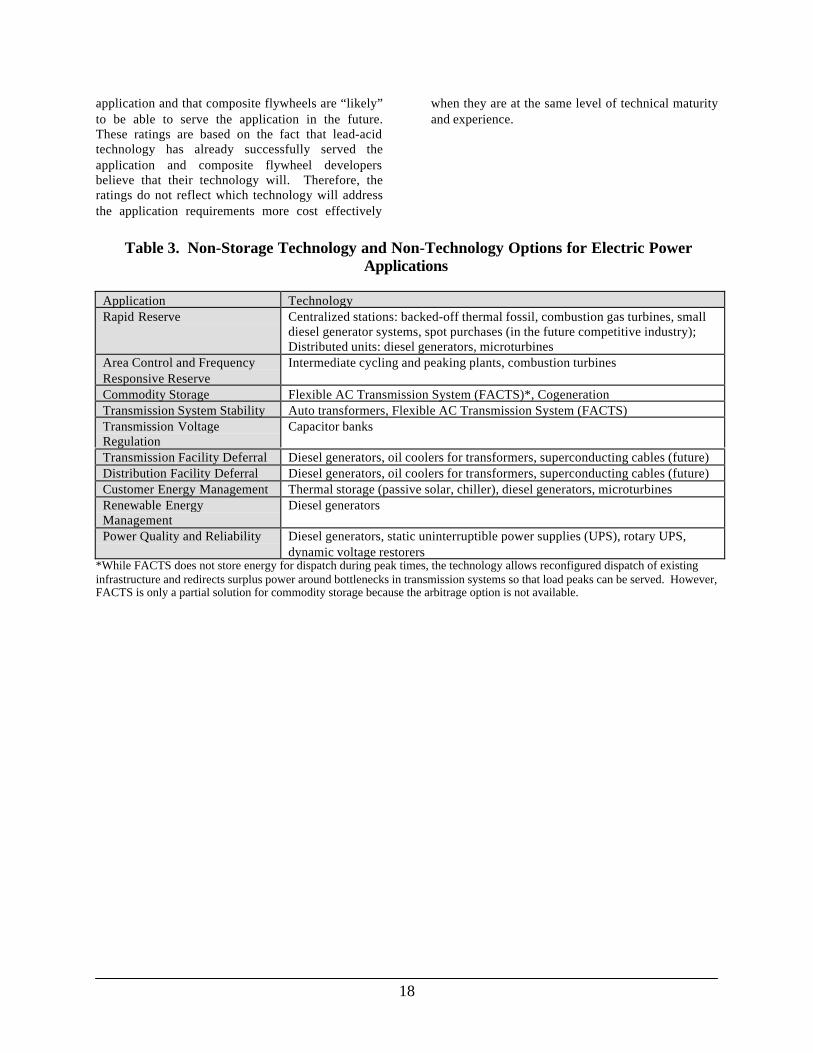
Figure 5. Traditional coal-firedpower plant
• Acceptedindustry practice
• Well-understoodtechnology
• No initial capitalcost for existingunits
• Highmaintenance
• Inefficient• Air emissions
(SOx, NOx)• Usually run in a
backed-off mode
• Rapid Reserve
Figure 6. Schematic of acombustion gas turbine for electricpower
• High degree ofmarket acceptance
• Well-understoodtechnology
• Relatively lowcost (capital:$400/kW,operating:$0.02/kWh)
• Highmaintenance
• Air emissions(SOx, NOx)
• Rapid Reserve
Figure 7. Diesel generatorsmanufactured by Caterpillar for60-Hz electric power applications
• High degree ofmarket acceptance
• Well understoodtechnology
• Relatively lowcost (captial:$650/kW,operating:$0.035/kWh)
• Air emissions(SOx, NOx)
• Varying fuelcosts
• Rapid Reserve• Transmission
Facility Deferral• Distribution Facility
Deferral• Customer Energy
Management• Renewable Energy
Management• Power Quality and
Reliability
Figure 8. Microturbinesmanufactured by CapstoneTurbine Corporation use naturalgas or biofuels and drive highspeed electrical generators
• Emerging marketacceptance
• Relatively lowcost(capital:$700/kW,operating:$0.015/kWh)
• Efficient at fullload
• Lower SOx thandiesel generators
• Highmaintenance
• Hightemperatureissues
• Rapid Reserve• Customer Energy
Management
20
Option Advantages Disadvantages Applications
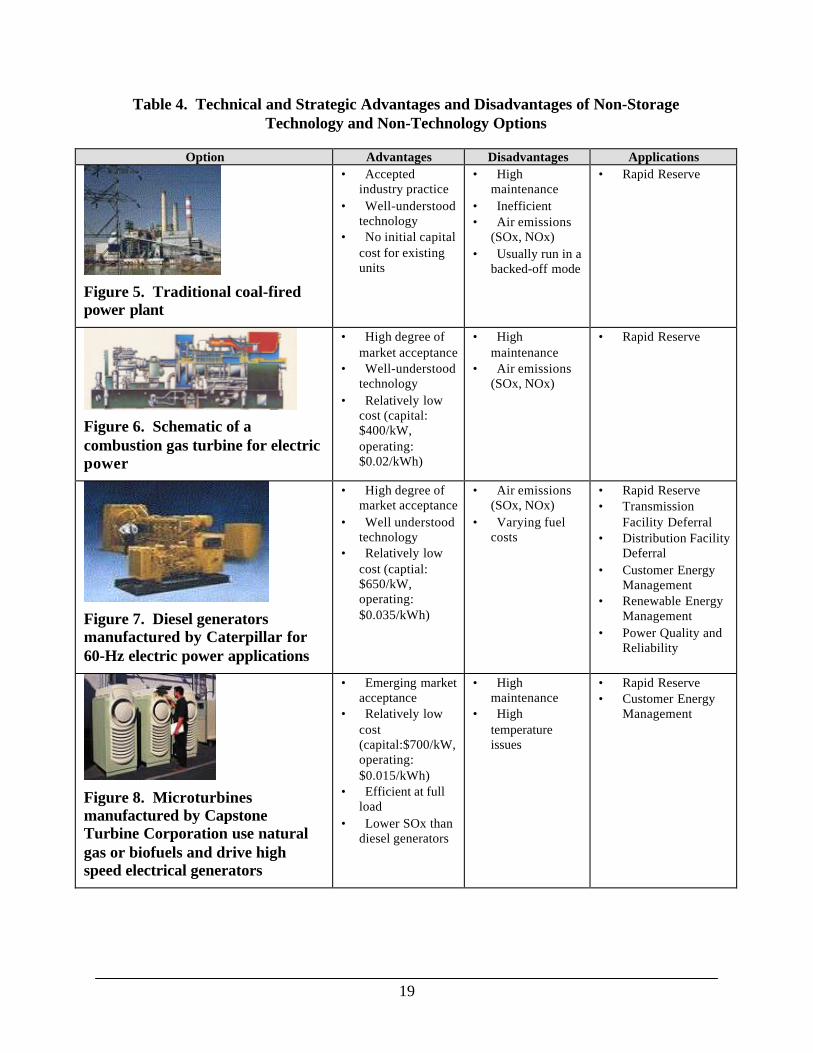
Figure 9. Real-time transactions tobuy and sell power provideselectric power producers andservice providers a way ofaddressing competitive needs
• No additionalcapital investmentor physicalresources required
• Low cost(capital: <$10/kW,operating:$0.032/kWh)
• Requiresminutes tomaketransactions(too slow forinstantaneousapplications)
• Uncontrolledand unreliablewith currentinstitutionalstructure`
• Rapid Reserve
Figure 10. Peaking gas combustionturbine at Texas Utilities
• Instantaneousresponse
• Understoodtechnology
• High marketacceptance
• Highmaintenance
• Hightemperatureissues
• Area Control andFrequencyResponsive Reserve
Figure 11. FACTS depends onWestinghouse's solid-stateSTATCOM Switching Device toredirect power to under-utilizedpathways
• Makes existinginfrastructure moreuseful
• Uses well-understood solid-state technologies
• Untried on alarge scale
• Unknowncommercialcosts
• Commodity Storage• Transmission
System Stability
21
Option Advantages Disadvantages Applications
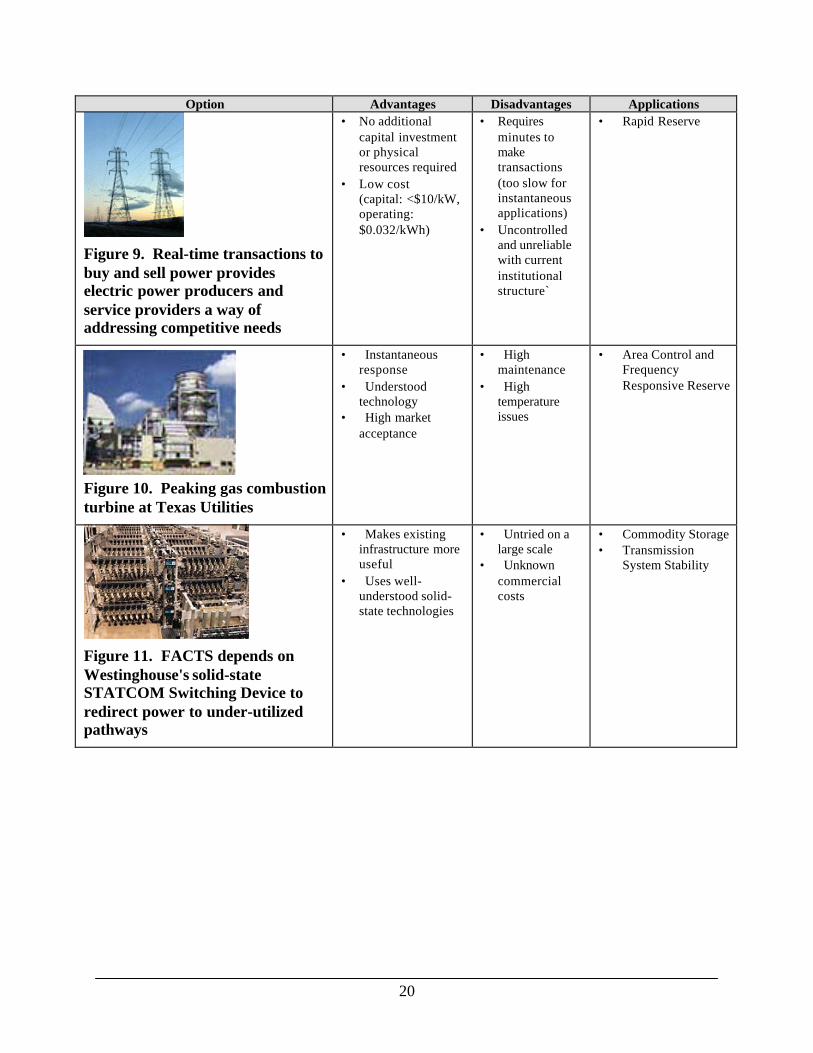
Figure 12. Recycling and energyrecovery pilot plant (cogeneration)in California uses anaerobiccomposting to produce fuel gas thatis dried and burned in an internalcombustion engine to makeelectricity; extra gas fuels heaters,dryers, and steam boilers
• Low initial capitalcost
• Siting andpermittingbarriers
• Gridinterconnectionissues
• Commodity Storage
Figure 13. Substation autotransformers like this one byWaukesha Electric Systems canmanipulate taps to respond to 10 –100 MVA transients
• Well-understood,acceptedtechnology
• High marketacceptance
• Generallyexpensive
• Largefootprint
• Long lead-time topurchase
• TransmissionSystem Stability
Figure 14. Distribution classcapacitor banks made by CooperPower Systems are typical of theparallel, series-parallel, or in athree-phase arrangement, 100, 150,and 200 kVar power ratings and2,400 - to 21,600 - volt capacity
• Inexpensive($25/kVar)
• Well-understoodtechnology
• High degree ofmarket acceptance
• Large size toachieve neededcapacities
• TransmissionVoltage Regulation

22
Option Advantages Disadvantages Applications
Figure 15. Oil coolers fortransformers like this Seimensmodel help keep temperaturesdown even during peak loading –as a result, transformers cansupport larger loads for longertimes before overheating
• Well-understoodtechnology
• High degree ofmarket acceptance
• Environmentalconcerns
• TransmissionFacility Deferral
• Distribution FacilityDeferral
Figure 16. 100-foot, 12.5 kV,1,250A underground transmissioncable developed and demonstratedby Intermagnetics GeneralCorporation, Southwire Company,and the US DOE was installed as ahigh-temperature (4K)superconducting cable
• Virtually loss-lesstransmission ofelectricity
• Expensive• At advanced
R&D stage ofdevelopment(manufacturinglimitations ofcables withappropriatecurrent densityand cablelength)
• Requirescryogenicoperatingenvironment
• TransmissionFacility Deferral
• Distribution FacilityDeferral
Figure 17. Fermilab's 1400-tonhigh-efficiency chiller
• Environmentallybenign
• Inefficient• Non-
transportable
• Customer EnergyManagement
23
Option Advantages Disadvantages Applications
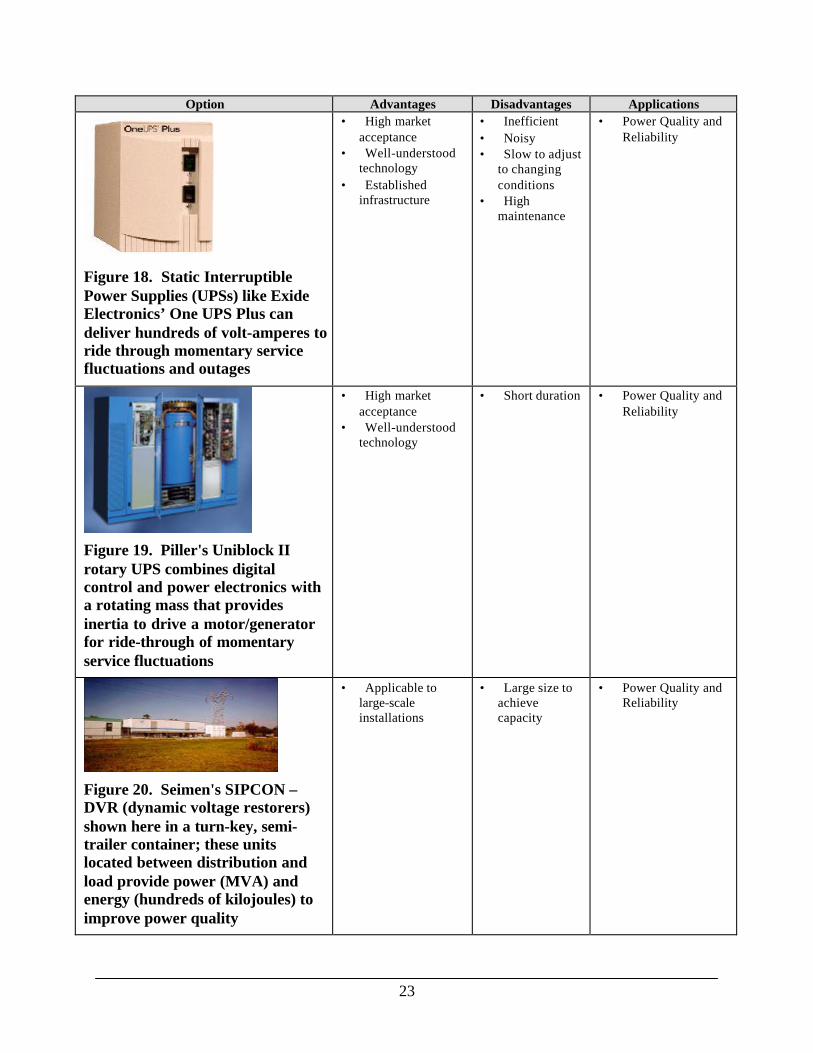
Figure 18. Static InterruptiblePower Supplies (UPSs) like ExideElectronics’ One UPS Plus candeliver hundreds of volt-amperes toride through momentary servicefluctuations and outages
• High marketacceptance
• Well-understoodtechnology
• Establishedinfrastructure
• Inefficient• Noisy• Slow to adjust
to changingconditions
• Highmaintenance
• Power Quality andReliability
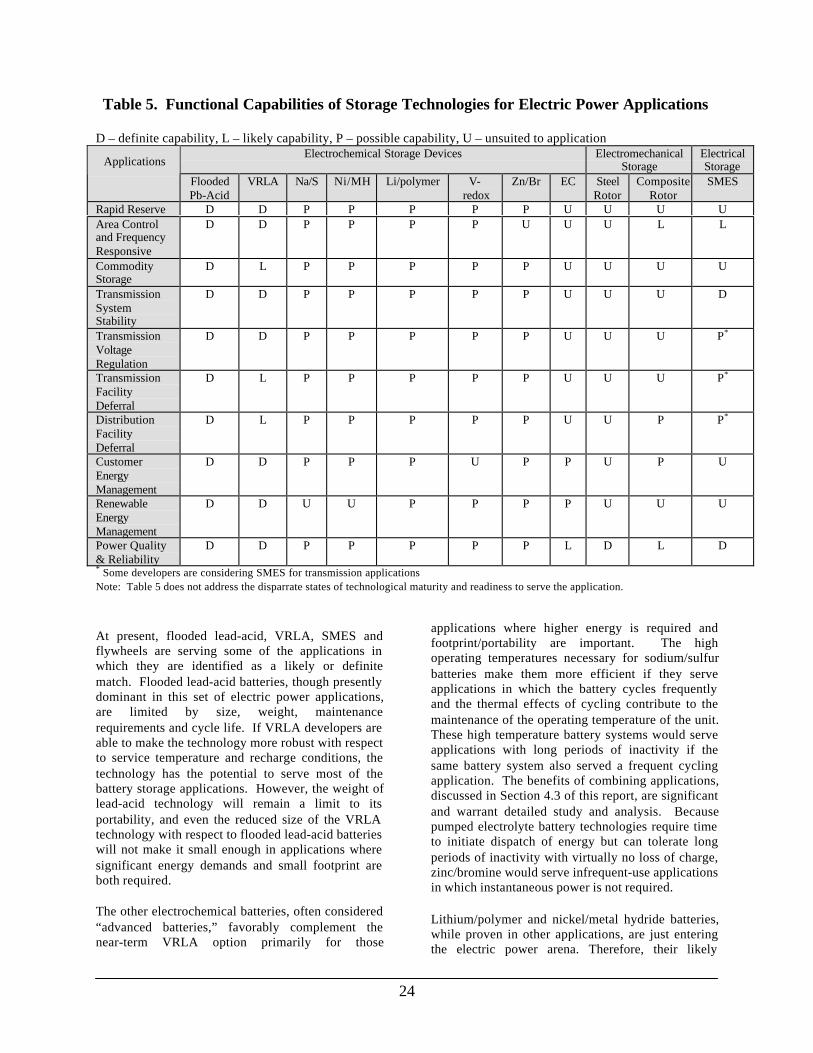
Figure 19. Piller's Uniblock IIrotary UPS combines digitalcontrol and power electronics witha rotating mass that providesinertia to drive a motor/generatorfor ride-through of momentaryservice fluctuations
• High marketacceptance
• Well-understoodtechnology
• Short duration • Power Quality andReliability
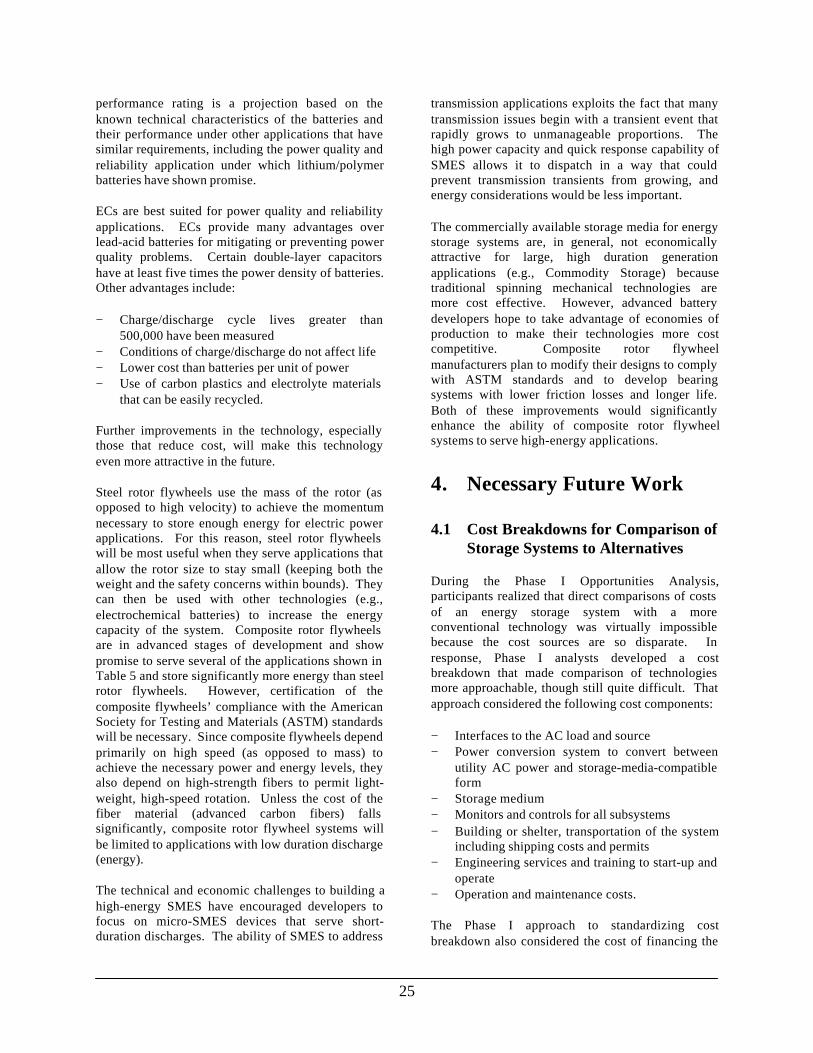
Figure 20. Seimen's SIPCON –DVR (dynamic voltage restorers)shown here in a turn-key, semi-trailer container; these unitslocated between distribution andload provide power (MVA) andenergy (hundreds of kilojoules) toimprove power quality
• Applicable tolarge-scaleinstallations
• Large size toachievecapacity
• Power Quality andReliability
24
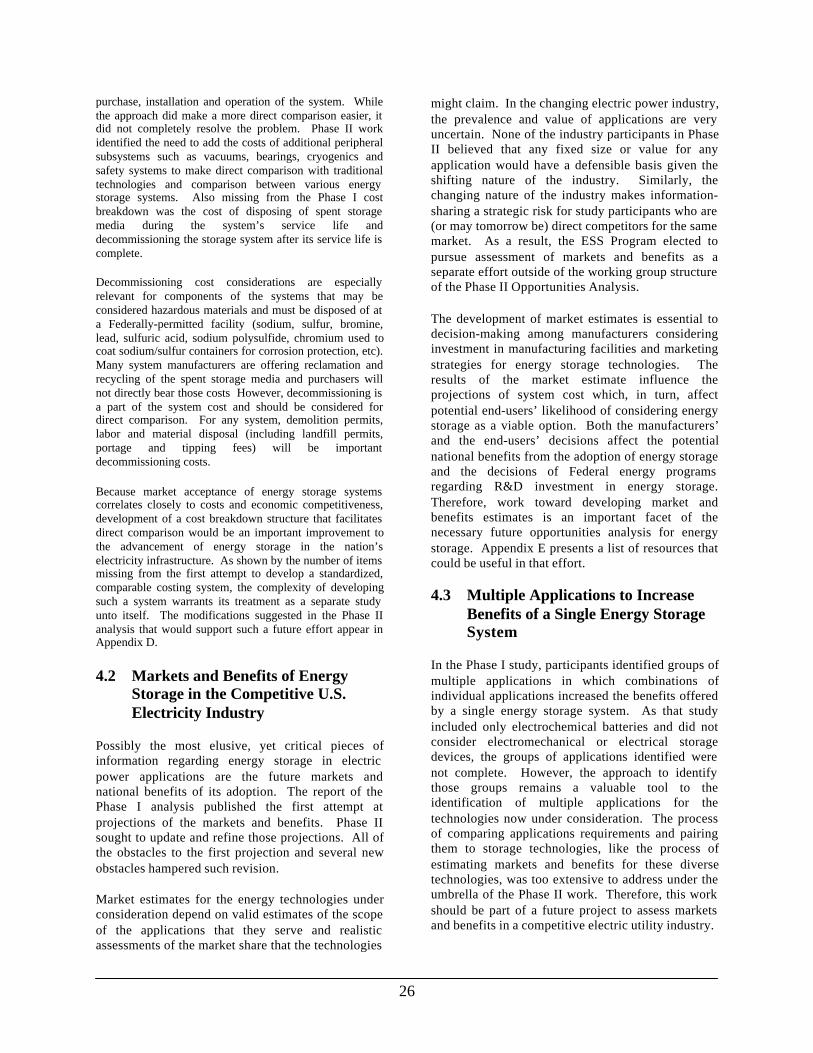
Table 5. Functional Capabilities of Storage Technologies for Electric Power Applications
D – definite capability, L – likely capability, P – possible capability, U – unsuited to applicationElectrochemical Storage Devices Electromechanical
StorageElectricalStorageApplications
FloodedPb-Acid
VRLA Na/S Ni/MH Li/polymer V-redox
Zn/Br EC SteelRotor
CompositeRotor
SMES
Rapid Reserve D D P P P P P U U U UArea Controland FrequencyResponsive
D D P P P P U U U L L
CommodityStorage
D L P P P P P U U U U
TransmissionSystemStability
D D P P P P P U U U D
TransmissionVoltageRegulation
D D P P P P P U U U P*
TransmissionFacilityDeferral
D L P P P P P U U U P*
DistributionFacilityDeferral
D L P P P P P U U P P*
CustomerEnergyManagement
D D P P P U P P U P U
RenewableEnergyManagement
D D U U P P P P U U U
Power Quality& Reliability
D D P P P P P L D L D
* Some developers are considering SMES for transmission applicationsNote: Table 5 does not address the disparrate states of technological maturity and readiness to serve the application.
At present, flooded lead-acid, VRLA, SMES andflywheels are serving some of the applications inwhich they are identified as a likely or definitematch. Flooded lead-acid batteries, though presentlydominant in this set of electric power applications,are limited by size, weight, maintenancerequirements and cycle life. If VRLA developers areable to make the technology more robust with respectto service temperature and recharge conditions, thetechnology has the potential to serve most of thebattery storage applications. However, the weight oflead-acid technology will remain a limit to itsportability, and even the reduced size of the VRLAtechnology with respect to flooded lead-acid batterieswill not make it small enough in applications wheresignificant energy demands and small footprint areboth required.
The other electrochemical batteries, often considered“advanced batteries,” favorably complement thenear-term VRLA option primarily for those
applications where higher energy is required andfootprint/portability are important. The highoperating temperatures necessary for sodium/sulfurbatteries make them more efficient if they serveapplications in which the battery cycles frequentlyand the thermal effects of cycling contribute to themaintenance of the operating temperature of the unit.These high temperature battery systems would serveapplications with long periods of inactivity if thesame battery system also served a frequent cyclingapplication. The benefits of combining applications,discussed in Section 4.3 of this report, are significantand warrant detailed study and analysis. Becausepumped electrolyte battery technologies require timeto initiate dispatch of energy but can tolerate longperiods of inactivity with virtually no loss of charge,zinc/bromine would serve infrequent-use applicationsin which instantaneous power is not required.
Lithium/polymer and nickel/metal hydride batteries,while proven in other applications, are just enteringthe electric power arena. Therefore, their likely
25
performance rating is a projection based on theknown technical characteristics of the batteries andtheir performance under other applications that havesimilar requirements, including the power quality andreliability application under which lithium/polymerbatteries have shown promise.
ECs are best suited for power quality and reliabilityapplications. ECs provide many advantages overlead-acid batteries for mitigating or preventing powerquality problems. Certain double-layer capacitorshave at least five times the power density of batteries.Other advantages include:
− Charge/discharge cycle lives greater than500,000 have been measured
− Conditions of charge/discharge do not affect life− Lower cost than batteries per unit of power− Use of carbon plastics and electrolyte materials
that can be easily recycled.
Further improvements in the technology, especiallythose that reduce cost, will make this technologyeven more attractive in the future.
Steel rotor flywheels use the mass of the rotor (asopposed to high velocity) to achieve the momentumnecessary to store enough energy for electric powerapplications. For this reason, steel rotor flywheelswill be most useful when they serve applications thatallow the rotor size to stay small (keeping both theweight and the safety concerns within bounds). Theycan then be used with other technologies (e.g.,electrochemical batteries) to increase the energycapacity of the system. Composite rotor flywheelsare in advanced stages of development and showpromise to serve several of the applications shown inTable 5 and store significantly more energy than steelrotor flywheels. However, certification of thecomposite flywheels’ compliance with the AmericanSociety for Testing and Materials (ASTM) standardswill be necessary. Since composite flywheels dependprimarily on high speed (as opposed to mass) toachieve the necessary power and energy levels, theyalso depend on high-strength fibers to permit light-weight, high-speed rotation. Unless the cost of thefiber material (advanced carbon fibers) fallssignificantly, composite rotor flywheel systems willbe limited to applications with low duration discharge(energy).
The technical and economic challenges to building ahigh-energy SMES have encouraged developers tofocus on micro-SMES devices that serve short-duration discharges. The ability of SMES to address
transmission applications exploits the fact that manytransmission issues begin with a transient event thatrapidly grows to unmanageable proportions. Thehigh power capacity and quick response capability ofSMES allows it to dispatch in a way that couldprevent transmission transients from growing, andenergy considerations would be less important.
The commercially available storage media for energystorage systems are, in general, not economicallyattractive for large, high duration generationapplications (e.g., Commodity Storage) becausetraditional spinning mechanical technologies aremore cost effective. However, advanced batterydevelopers hope to take advantage of economies ofproduction to make their technologies more costcompetitive. Composite rotor flywheelmanufacturers plan to modify their designs to complywith ASTM standards and to develop bearingsystems with lower friction losses and longer life.Both of these improvements would significantlyenhance the ability of composite rotor flywheelsystems to serve high-energy applications.
4. Necessary Future Work
4.1 Cost Breakdowns for Comparison ofStorage Systems to Alternatives
During the Phase I Opportunities Analysis,participants realized that direct comparisons of costsof an energy storage system with a moreconventional technology was virtually impossiblebecause the cost sources are so disparate. Inresponse, Phase I analysts developed a costbreakdown that made comparison of technologiesmore approachable, though still quite difficult. Thatapproach considered the following cost components:
− Interfaces to the AC load and source− Power conversion system to convert between
utility AC power and storage-media-compatibleform
− Storage medium− Monitors and controls for all subsystems− Building or shelter, transportation of the system
including shipping costs and permits− Engineering services and training to start-up and
operate− Operation and maintenance costs.
The Phase I approach to standardizing costbreakdown also considered the cost of financing the
26
purchase, installation and operation of the system. Whilethe approach did make a more direct comparison easier, itdid not completely resolve the problem. Phase II workidentified the need to add the costs of additional peripheralsubsystems such as vacuums, bearings, cryogenics andsafety systems to make direct comparison with traditionaltechnologies and comparison between various energystorage systems. Also missing from the Phase I costbreakdown was the cost of disposing of spent storagemedia during the system’s service life anddecommissioning the storage system after its service life iscomplete.
Decommissioning cost considerations are especiallyrelevant for components of the systems that may beconsidered hazardous materials and must be disposed of ata Federally-permitted facility (sodium, sulfur, bromine,lead, sulfuric acid, sodium polysulfide, chromium used tocoat sodium/sulfur containers for corrosion protection, etc).Many system manufacturers are offering reclamation andrecycling of the spent storage media and purchasers willnot directly bear those costs However, decommissioning isa part of the system cost and should be considered fordirect comparison. For any system, demolition permits,labor and material disposal (including landfill permits,portage and tipping fees) will be importantdecommissioning costs.
Because market acceptance of energy storage systemscorrelates closely to costs and economic competitiveness,development of a cost breakdown structure that facilitatesdirect comparison would be an important improvement tothe advancement of energy storage in the nation’selectricity infrastructure. As shown by the number of itemsmissing from the first attempt to develop a standardized,comparable costing system, the complexity of developingsuch a system warrants its treatment as a separate studyunto itself. The modifications suggested in the Phase IIanalysis that would support such a future effort appear inAppendix D.
4.2 Markets and Benefits of EnergyStorage in the Competitive U.S.Electricity Industry
Possibly the most elusive, yet critical pieces ofinformation regarding energy storage in electricpower applications are the future markets andnational benefits of its adoption. The report of thePhase I analysis published the first attempt atprojections of the markets and benefits. Phase IIsought to update and refine those projections. All ofthe obstacles to the first projection and several newobstacles hampered such revision.
Market estimates for the energy technologies underconsideration depend on valid estimates of the scopeof the applications that they serve and realisticassessments of the market share that the technologies
might claim. In the changing electric power industry,the prevalence and value of applications are veryuncertain. None of the industry participants in PhaseII believed that any fixed size or value for anyapplication would have a defensible basis given theshifting nature of the industry. Similarly, thechanging nature of the industry makes information-sharing a strategic risk for study participants who are(or may tomorrow be) direct competitors for the samemarket. As a result, the ESS Program elected topursue assessment of markets and benefits as aseparate effort outside of the working group structureof the Phase II Opportunities Analysis.
The development of market estimates is essential todecision-making among manufacturers consideringinvestment in manufacturing facilities and marketingstrategies for energy storage technologies. Theresults of the market estimate influence theprojections of system cost which, in turn, affectpotential end-users’ likelihood of considering energystorage as a viable option. Both the manufacturers’and the end-users’ decisions affect the potentialnational benefits from the adoption of energy storageand the decisions of Federal energy programsregarding R&D investment in energy storage.Therefore, work toward developing market andbenefits estimates is an important facet of thenecessary future opportunities analysis for energystorage. Appendix E presents a list of resources thatcould be useful in that effort.
4.3 Multiple Applications to IncreaseBenefits of a Single Energy StorageSystem
In the Phase I study, participants identified groups ofmultiple applications in which combinations ofindividual applications increased the benefits offeredby a single energy storage system. As that studyincluded only electrochemical batteries and did notconsider electromechanical or electrical storagedevices, the groups of applications identified werenot complete. However, the approach to identifythose groups remains a valuable tool to theidentification of multiple applications for thetechnologies now under consideration. The processof comparing applications requirements and pairingthem to storage technologies, like the process ofestimating markets and benefits for these diversetechnologies, was too extensive to address under theumbrella of the Phase II work. Therefore, this workshould be part of a future project to assess marketsand benefits in a competitive electric utility industry.
27
Appendix A. Technical Approachfor the Phase II Analysis
The success of the Phase I Opportunities Analysissuggested that the direct involvement of expertstakeholders in a series of working meetings was ahighly effective approach to identify and analyzeopportunities for energy storage. Therefore, like thePhase I process, the Phase II process gatheredrepresentatives from numerous stakeholder groups tomeet and provide input to this project.
Also like the Phase I project, Phase II consisted oftwo, two-day working meetings of the expertstakeholders. The first meeting was held inNovember 1998 and the second in April 1999. In thefirst meeting, the group assessed the present state ofknowledge of utility energy storage applications,reviewed the Phase I definitions of applications andtheir requirements and revised those definitions. Inthe second meeting, participants refined theapplication definitions and made presentations ontheir respective technologies and the applications thatcould be addressed by them. The group membersreviewed each presenter’s claims for his/hertechnology’s capabilities and reached consensusregarding them. Table 5 of this report presents theconsensus views. Uncertainty regarding the effect ofemerging competition and sensitivity regardingmarket data will make future assessments of energystorage markets, benefits, and cost breakdowns moredifficult.
Organizations interested in energy storagetechnologies today are confronted by a dizzying arrayof choices. Although flooded, lead-acid batteriesdominate the rechargable battery market, otherbattery technologies are maturing and closing thegap. David Linden’s Handbook of Batteries forexample, lists 24 different battery chemistries. Inaddition, flywheels, SMES, and electrochemicalcapacitors increase the number of technologies toconsider and increase the need for a concise study ofenergy storage technologies to choose a workablecrosscut of potential candidates for deployment inutility applications.
Some battery chemistries are relatively easy todismiss as potential candidates. For example, non-rechargeable batteries were not included on the list ofpotential candidates as utility applications requirerechargeable batteries. Rechargeable batteriesrequired more careful consideration. For this reason,analysts established criteria to chose technologies
that were both advanced enough in their developmentto be viable candidates for the storage applicationsunder consideration, but still required additionalsystems or component development for full marketacceptance.
A key example of a technology that supports thisrationale is lead-acid batteries. Lead-acid batteriesincluding their variants, flooded and valve-regulated,are both advanced in their development and mature intheir penetration of some markets. However, theyhave some technical deficiencies and are notimmature technology for large-scale stationaryapplications. Lead-acid batteries are a benchmarkagainst which all other storage technologies arecompared, thus making their inclusion in the reportmandatory.
Fuel cells were not included in this study even thoughthey are a potentially viable candidate for someenergy storage applications. Fuel cells, however, arefundamentally different in that a fuel cell bothgenerates and stores energy. Further, fuel cellsprocess energy external to the storage device. A fuelcell storage system is not directly, electricallyrecharged. Fuel cells may be included in a futureassessment of utility storage applications as thetechnology matures.
Based upon the two criteria identified above, thefollowing storage technologies included in this study:
− lead-acid batteries, (flooded and valve-− regulated)− lithium/polymer batteries− nickel/metal hydride batteries,− sodium/sulfur batteries− vanadium-redox batteries− zinc/bromine batteries− flywheels (steel and composite rotors),− superconducting magnetic energy storage
and electrochemical capacitors.

28
Appendix B. OrganizationsParticipating in the Phase IIOpportunities AnalysisAs noted in the acknowledgements to this report,many organizations devoted their resources toadvancing the understanding of applicationsrequirements in the emerging electric power industryand the markets and benefits for energy storage inthose applications. The following list describes theorganizations that directly contributed to this effort.
Energy Service Providers
investor-owned utilities, energy-service companies,electric cooperatives, utility trade organizations
Enron Energy Services
Enron Energy Services, a subsidiary of Enron Corp.,partners with commercial and industrial businesses toprovide integrated energy and facility managementoutsourcing solutions on a national basis. Enron'sinnovative approach to energy delivery andmanagement frees customers to focus criticalresources on their core business while Enron assumesthe responsibility of managing energy and facilitycosts. Enron is one of the world's leading integratednatural gas and electricity companies. The companyowns approximately $30 billion in assets andproduces electricity and natural gas, develops,constructs and operates energy and water facilitiesworldwide and delivers physical commodities andrisk management and financial services to customersaround the world.
Northern States Power (now part of Xcel Energy)
Northern States Power (NSP) Company, founded in1916 and headquartered in Minneapolis, Minnesota,is a major investor-owned utility with growingdomestic and international non-regulated operations.NSP and its subsidiary operate generation,transmission and distribution facilities to provideelectricity to about 1.4 million consumers inMinnesota, Michigan, Wisconsin, and North andSouth Dakota. NSP and its subsidiary also provide awide variety of energy-related services throughoutthese service areas. NSP operates two nuclear plants,five major coal plants, hydroelectric plants, windturbines, and several facilities that burn refuse-derived fuel, oil, wood and gas. Renewable sourceslike wind and hydro account for about 3% of NSPgeneration. Refuse-derived fuel and waste woodproduce about 1% of the company’s electricity.
Public Service of New Mexico
Public Service of New Mexico (PNM) is a combinedgas and electric utility that serves about 1.2 millionpeople in 100 communities throughout the state ofNew Mexico. In addition to retail gas and electric,PNM sells power on the wholesale market, operates awater utility in Santa Fe and offers many energy-related services. While 51% of the people served bythe company reside in or near Albuquerque, PNMprovides gas and electric service to a largegeographical portion of NM. PNM has formed fourstrategic business units: Electric Services providesretail electricity to customers; Gas services deliversboth gas products and services to customers; BulkPower Services manages the generation andtransmission system in the state to deliver wholesaleand retail electricity in the state and throughout theregion; Energy Services provides a variety of newenergy-related services that are based on PNM’smanagement and technical expertise.

29
Southern California Edison
Southern California Edison (SCE) is the secondlargest electric utility in the United States, servingover 11 million customers in a territory of 50,000square miles. The largest subsidiary of EdisonInternational, Inc., SCE was established in 1887. In aproject with the Electric Power Research Institute andother organizations, SCE worked to design, installand operate a 10-MW, 40-MWh battery energystorage system for a demonstration of utility scaleload leveling in Chino, CA in the late 1980s. Thedesign was based on the BEWAG system inGermany, and was the template for the PREPAsystem in Puerto Rico. Recent reorganization at SCEprompted by emerging competition resulted in theformation of five distinct business units: CustomerSolutions, Distribution, Generation, Power Grid(responsible for bulk power transmission) and QF(responsible for power purchase contracts with third-party generators). The Chino storage demonstrationwas complete at the time of the reorganization andthe facility has been decommissioned.
Southern Company
The Southern Company is the umbrella organizationfor 17 electric utilities throughout the United States,South America, Caribbean, China, Philippines, andthe European Union Countries. It is one of thelargest producers of electricity in the world,generating over 50,000 MW of electricity in 1999.Southern Company products and services includeelectricity generation, natural gas storage andmanagement, and wholesale energy trading andmarketing. Net income for 1999 was $1.3 billion onrevenues of about $11 billion. Southern Companyassets in 1999 were worth approximately $38 billion.
Manufacturers
batteries/BES systems, flywheels/FES systems,supercapacitors/SCs systems, superconductors/SMES systems, power electronics, renewable hybridsystems, trade organizations
Active Power
Active Power manufactures a steel flywheel calledthe CleanSource Flywheel. This 7000-rpm flywheel,when connected to a power conversion system,provides 400 kW of DC power for 5 seconds, butvaried combinations of power and discharge durationare possible with the same rotor. Also, two or morerotors can be combined to serve loads up to 800 kWor more. Active Power has chosen not to integrate apower conversion system into its flywheel, insteadmaking its technology more readily incorporated intoa current UPS product. Active Power plans to marketits products in power quality and battery extensionapplications. Active Power has pursued a steelflywheel as opposed to a composite fiber flywheel forseveral reasons: low-cost, safety and high powerdensity. At $150/kW installed, the CleanSourceflywheel is significantly less expensive for shortduration applications than composite flywheels andhas promise to serve those applications. ActivePower does not envision their product serving longer-duration applications unless it serves in a hybridsystem with another technology that is moreeconomic at longer durations of dispatch.
American Superconductor
ASC is a manufacturer of SMES and installed their firstSMES unit in 1993. The company now has 9 installationsworldwide, and is currently developing and marketingSMES devices for utility power quality applications. Theirstandard turn-key product, configured in a semi-trailer, candeliver 1 MW for 1 second quickly enough to preventsensitive equipment from suffering interruption of electricalservice. The SMES magnet is made of a low temperaturesuperconducting material that requires liquid helium-basedcryogenics. ASC has introduced a new SMES product witha more sophisticated cryogenic design than their earlierproducts. The improvements to the system reduced theelectrical load to cool the unit significantly. The newdesign SMES system can sustain normal operationfor about 200 hours after an unplanned shutdown ofthe refrigeration system. This “micro” SMES unit issuited to power quality applications.
30
Electricity Storage Association
The Electricity Storage Association (ESA) is anindustry trade organization founded by eight electricutilities in 1990 that perceived a viable role forenergy storage in electric power applications.Originally focused on battery energy storage, theorganization was founded as an informal associationas the Utility Battery Group, and later incorporated asthe Energy Storage Association. The ESA is now amembership trade association that has the mission offostering development and commercialization ofcompetitive and reliable energy storage deliverysystems for use by electricity suppliers and theircustomers.
GNB Industrial Technologies
GNB Industrial Technologies is one of the world’slargest manufacturers and recyclers of lead-acidbatteries. GNB has plants in North America,Australia, and New Zealand, and manufactures,distributes and recycles lead-acid batteries forindustrial, automotive, heavy-duty and specialtyapplications around the world. GNB has beenbuilding batteries for over 100 years and is closelyconnected with Ford Motor Company, supplyingbatteries to its automotive, truck and tractor division.GNB also supplies batteries to the United StatesNavy for its submarines and to the United States AirForce for Peacekeeper missile silos. GNB hasformed a teaming relationship with General Electricon several battery energy storage system projects,and has attended meetings of the Energy StorageAssociation since its inception.
Intermagnetics General Corporation
IGC gained significant experience withsuperconducting magnets from development ofMagnetic Resonance Imaging (MRI) equipment.IGC’s SMES systems include liquid heliumcryogenics and power electronics that allow thesystem to respond to voltage sags, spikes andelectrical interruptions. An IGC unit recentlyinstalled at an Air Force base includes a 6MJsuperconducting coil, a closed-loop cryocooler, andoff-the-shelf power conversion and remotemonitoring units. Housed in a mobile/relocatableshelter, the system is designed to minimize on-siteengineering. The system is intended for unmannedoperation, similar to commercially available UPSsystems. IGC remains highly active in MRI devicesand in R&D of high-temperature superconductingmaterials (still cryogenic) that could eventuallyreplace the low temperature devices that are currentlyfielded.
Maxwell Energy Products
Maxwell focuses on two core competencies: pulsedpower and industrial computers. Within its pulsedpower thrust, the company includes research,development and sales of numerous energy products.These devices include ceramic capacitors for militaryand industrial use, electromagnetic interference filtersfor implantable medical devices, high-voltage energystorage and discharge capacitors for medical,industrial, research and defense applications, andultracapacitors that provide electrical energy at highpower for up to 45 seconds. These ultracapacitorsare useful for consumer electronics, power qualitydevices and automotive applications. Coupled withthe products in the company’s Phoenix division:power conditioning, power distribution and powersupply systems, ultracapacitors have the potential toserve in a number of energy storage applications ofinterest in this study. Maxwell manufacturesultracapacitors through its subsidiary Power Cache,and has 6 sizes commercially available.

31
Omnion Power Engineering Corporation
Omnion Power Engineering Corp. (now the PowerElectronics Division of S & C Electric Co.) has beendeveloping advanced power systems, power systemcomponents and system controls since 1971.Omnion has become recognized as the leadingsupplier in this country of power electronics andsystem controls for utility interconnected advancedenergy systems. Omnion was the developer of thePQ2000, a 2000 kW for 10 seconds transportablepower quality system which won an R&D 100 awardin 1997. This system was the predecessor of theMobile PQ2000, a trailer-mounted, power qualitysystem that can deliver up to 2 MW for 15 seconds toovercome brief power disturbances.
ZBB Energy Corporation
ZBB Energy Corporation (ZBB) is a Wisconsin-based developer of proprietary zinc/bromine batterytechnology. The company also maintains researchand development laboratories and regional marketingand administrative offices in Perth, WesternAustralia. ZBB’s main product is large-scale(capacity) advanced technology batteries for thestorage of power from a variety of generatingsources. The zinc/bromine technology is typicallydesigned as an aqueous flow battery, using acirculation loop to continuously feed reactants to thebattery stacks. The battery can be fully dischargedrepeatedly without any damage to the system and hasa life of at least 1,500 full charge/discharge cycles.This battery is ideally suited to applications thatrequire deep-cycle and long-cycle life. Typicallythese battery systems range in capacity from 50 kWhin a single, three-stack module, up to 500 kWh inmultiple modules arranged in series and parallelarrays.
Industry Consultants
research organizations, consultants
Energetics, Incorporated
Since 1979, Energetics (a subsidiary of VSECorporation) has provided energy and environmentalconsulting services for private industry and Federalclients involved in technology research, development,demonstration, assessment and commercialization.Expertise includes advanced technology assessment,technical and economic feasibility analysis,technology transfer, R&D planning, modeling andsimulation engineering studies, market assessment,strategic resource management, regulatory analysis,environmental compliance and risk management—especially as related to energy supply and end-useindustries and technologies. Specific technologyareas include industrial and building technologies,transportation technologies, advanced fuel andgeneration technologies, transmission anddistribution technologies and distributed resourcetechnologies. Energetics’ work in energy storage andhydrogen crosscut these areas and addresstechnologies that include battery energy storage,SMES, flywheel energy storage, fuel cells, hydrogenstorage, power conversion systems and pumpedhydro.
International Lead Zinc Research Organization
The International Lead Zinc Research Organization(ILZRO) was formed in 1958 as a non-profit researchfoundation for the purpose of conducting research on behalfof the international community of lead and zinc miners andsmelters. Since that time, ILZRO's membership has grownto include significant numbers of end users of these metalsfrom among the steel, automotive, die casting, battery,galvanizing and other industries. ILZRO contributes to thedevelopment of environmentally-appropriate markets forlead and zinc by discovering and developing new uses andimproving existing uses and by furnishing technicalinformation to organizations that will adopt and/orpromote those uses. ILZROs R&D portfolio for1999-2000 covers most major areas of lead and zincconsumption, such as batteries, coatings and diecastings, as well as significant work in the areas ofthe environment and human health.

32
Sandia National Laboratories
Sandia National Laboratories is a multi-programlaboratory for the U.S. Department of Energy (DOE)and is managed by Sandia Corporation, a subsidiaryof Lockheed-Martin Corporation. Sandia's missioninvolves engineering and development oftechnologies for national security and it works withgovernment, industry, academia and other researchand development organizations on a wide range ofadvanced technologies. The DOE Energy StorageSystems (ESS) Program is conducted by Sandia andinvolves systems integration, componentdevelopment, prototype testing and systems analysis.Many ESS projects are performed in collaborationwith private sector organizations as well as bytechnology specialists at Sandia. The OpportunitiesAnalysis was an ESS analysis project managed bySandia and contracted to Energetics, Inc. Sandia'srole was to provide overall project guidance anddirection, to review the technical results andconclusions of the study and provide technologyinformation when appropriate. Several Sandia staffmembers attended and participated in theOpportunities Analysis meetings and contributed tothe technical content of the project.

33
This page intentionally left blank.
34
Appendix C. Fact Sheets for Ten Electric Power Applications of Energy Storage
Rapid ReserveArea Control and Frequency Responsive ReserveCommodity StorageTransmission System StabilityTransmission Voltage RegulationTransmission Facility DeferralDistribution Facility DeferralRenewable Energy ManagementCustomer Energy ManagementPower Quality and Reliability
Rapid Reserve
NERC requires utilities to avoid interruption of service to customers, even if an electrical generating unit fails. The reserve power supply must haveinstantaneous response to comply with NERC Policy 10 requirements. Satisfying this requirement can represent a significant cost to power producers.
Because cold thermal power plants require hours, and combustion turbines require a half-hour to get generators ready to accept load, utilities operate thermalplants and combustion turbines at less-than-full capacity to keep generators hot and spinning and ready to provide reserve power. Energy storage can helputilities maintain rapid reserve, reduce or eliminate the need for supplemental power from combustion turbines, and free thermal plants to generate at fullcapacity (for greater efficiency and economy). Storage systems designed for rapid reserve can replace generation units that fail, and provide power until theutility brings other sources of power on-line or repairs the failed unit.
Since the power plants that they would temporarily replace have power ratings in the order of 10 to 100 MW, storage systems for rapid reserve must have powercapacities in this same range. Generation outages that require rapid reserve typically occur about 20 to 50 times per year. These outages occur randomly.Therefore, storage facilities for rapid reserve must be able to address up to 50 significant discharges that occur randomly through the year.
Figure C-1 illustrates the generation capacity of a utility for a typical week in which a significant failure occurs; the balloon shows the detail of the capacity lossand recovery with appropriate resources. Figure C-2 shows how storage would respond to the demand to maintain the utility’s ability to satisfy the load.

35
Figure C- 1. System Need for Rapid Reserve Power
Figure C- 2. Storage Response to Provide Rapid Reserve Power
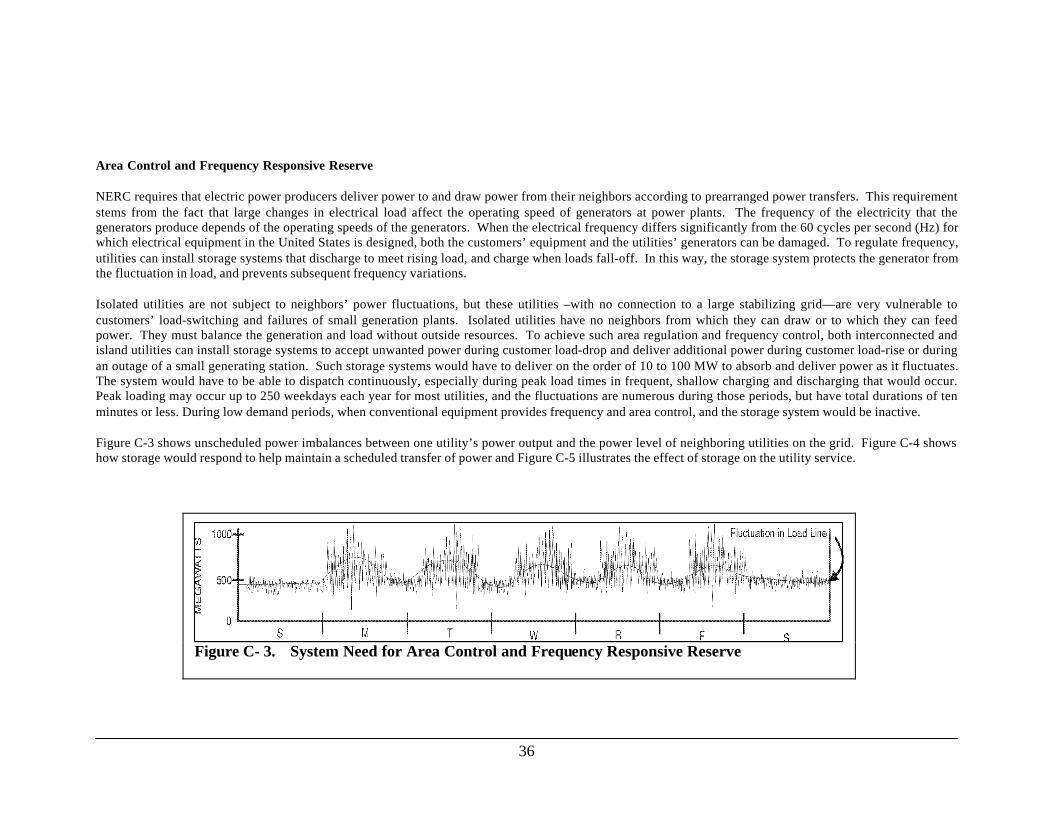
36
Area Control and Frequency Responsive Reserve
NERC requires that electric power producers deliver power to and draw power from their neighbors according to prearranged power transfers. This requirementstems from the fact that large changes in electrical load affect the operating speed of generators at power plants. The frequency of the electricity that thegenerators produce depends of the operating speeds of the generators. When the electrical frequency differs significantly from the 60 cycles per second (Hz) forwhich electrical equipment in the United States is designed, both the customers’ equipment and the utilities’ generators can be damaged. To regulate frequency,utilities can install storage systems that discharge to meet rising load, and charge when loads fall-off. In this way, the storage system protects the generator fromthe fluctuation in load, and prevents subsequent frequency variations.
Isolated utilities are not subject to neighbors’ power fluctuations, but these utilities –with no connection to a large stabilizing grid—are very vulnerable tocustomers’ load-switching and failures of small generation plants. Isolated utilities have no neighbors from which they can draw or to which they can feedpower. They must balance the generation and load without outside resources. To achieve such area regulation and frequency control, both interconnected andisland utilities can install storage systems to accept unwanted power during customer load-drop and deliver additional power during customer load-rise or duringan outage of a small generating station. Such storage systems would have to deliver on the order of 10 to 100 MW to absorb and deliver power as it fluctuates.The system would have to be able to dispatch continuously, especially during peak load times in frequent, shallow charging and discharging that would occur.Peak loading may occur up to 250 weekdays each year for most utilities, and the fluctuations are numerous during those periods, but have total durations of tenminutes or less. During low demand periods, when conventional equipment provides frequency and area control, and the storage system would be inactive.
Figure C-3 shows unscheduled power imbalances between one utility’s power output and the power level of neighboring utilities on the grid. Figure C-4 showshow storage would respond to help maintain a scheduled transfer of power and Figure C-5 illustrates the effect of storage on the utility service.
Figure C- 3. System Need for Area Control and Frequency Responsive Reserve
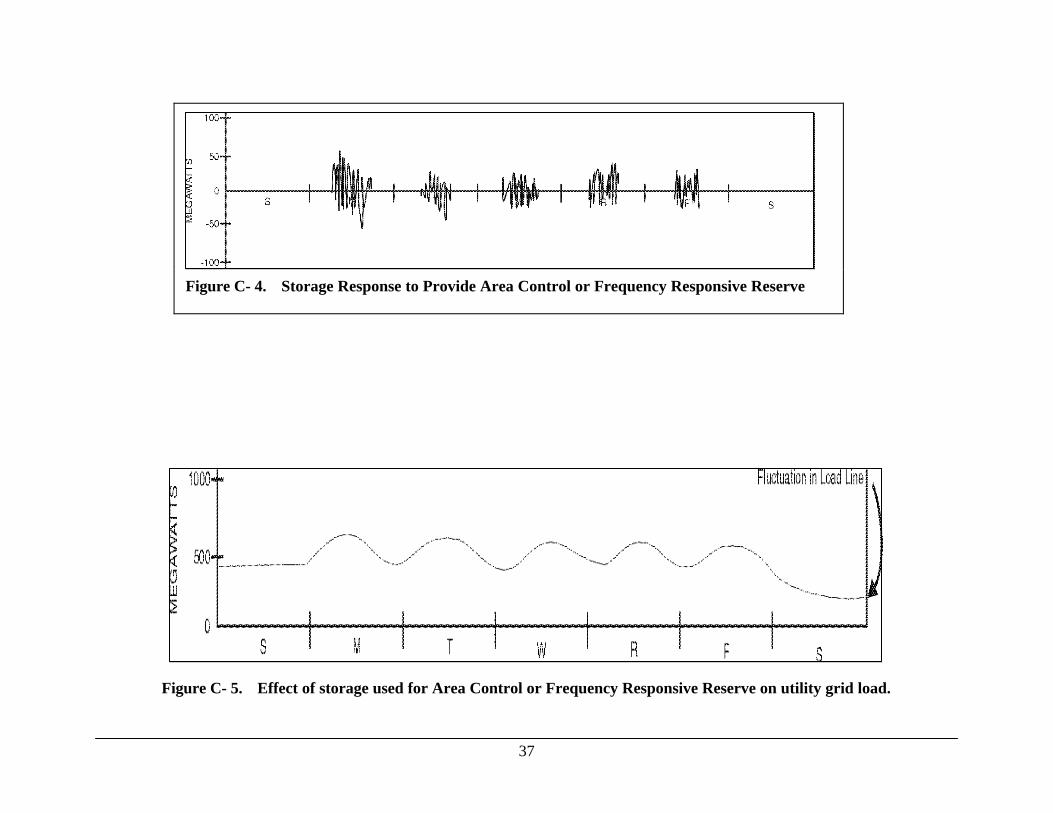
37
Figure C- 5. Effect of storage used for Area Control or Frequency Responsive Reserve on utility grid load.
Figure C- 4. Storage Response to Provide Area Control or Frequency Responsive Reserve
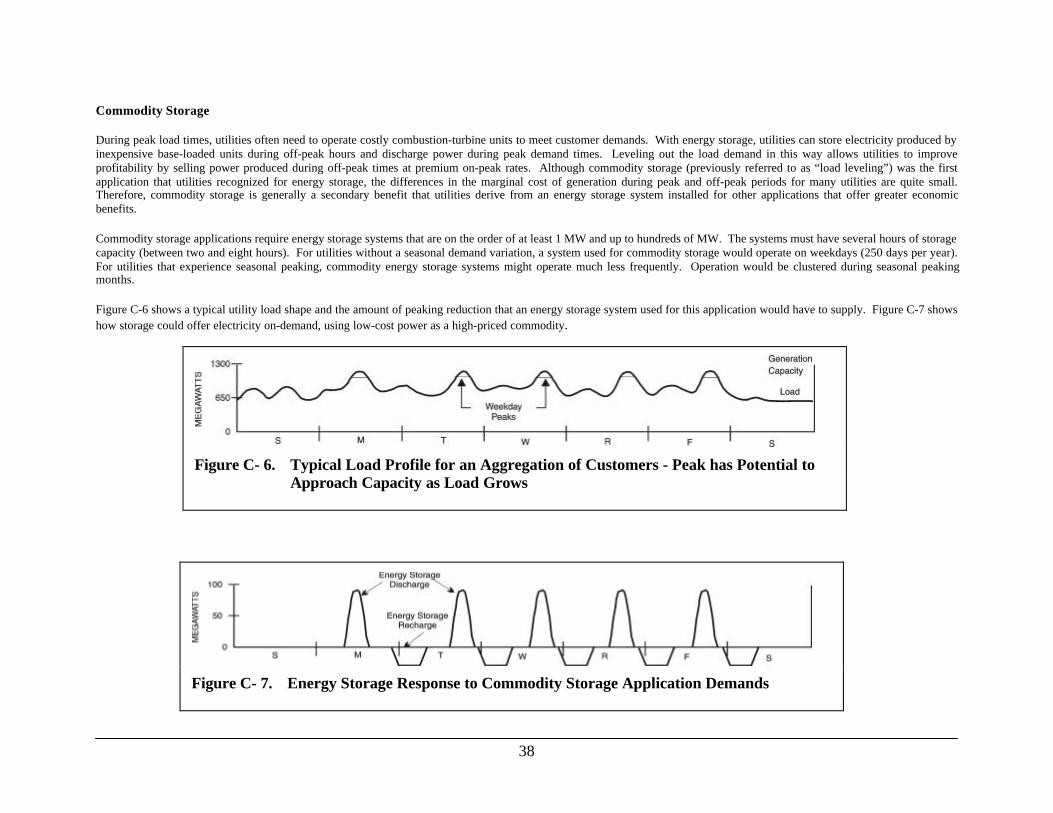
38
Commodity Storage
During peak load times, utilities often need to operate costly combustion-turbine units to meet customer demands. With energy storage, utilities can store electricity produced byinexpensive base-loaded units during off-peak hours and discharge power during peak demand times. Leveling out the load demand in this way allows utilities to improveprofitability by selling power produced during off-peak times at premium on-peak rates. Although commodity storage (previously referred to as “load leveling”) was the firstapplication that utilities recognized for energy storage, the differences in the marginal cost of generation during peak and off-peak periods for many utilities are quite small.Therefore, commodity storage is generally a secondary benefit that utilities derive from an energy storage system installed for other applications that offer greater economicbenefits.
Commodity storage applications require energy storage systems that are on the order of at least 1 MW and up to hundreds of MW. The systems must have several hours of storagecapacity (between two and eight hours). For utilities without a seasonal demand variation, a system used for commodity storage would operate on weekdays (250 days per year).For utilities that experience seasonal peaking, commodity energy storage systems might operate much less frequently. Operation would be clustered during seasonal peakingmonths.
Figure C-6 shows a typical utility load shape and the amount of peaking reduction that an energy storage system used for this application would have to supply. Figure C-7 showshow storage could offer electricity on-demand, using low-cost power as a high-priced commodity.
Figure C- 6. Typical Load Profile for an Aggregation of Customers - Peak has Potential toApproach Capacity as Load Grows
Figure C- 7. Energy Storage Response to Commodity Storage Application Demands

39
This page intentionally left blank.

40
Transmission System Stability
NERC requires numerous safeguards regarding the stability of the nation’s transmission system. These safeguards are the topic of debate as the country moves toa competitive electricity industry and power providers seek ways by which they can avoid the cost of maintaining stability. This problem is especially difficultsince many events in routine utility operation can cause instability in transmission systems. Events as common as customers switching loads, lightning strikes,and generators going on or off-line cause generators in the system to fall out-of-sync with the rest of the system. The difference between the phase-angle of agenerator and the phase-angle of the load-end of the transmission line measures the synchronization and stability of the system. If the difference between thoseangles is too large and the utility cannot quickly (within a few cycles) damp unstable oscillations, the power system can collapse. In this very undesirablecircumstance, the utility must shut down and restart its equipment to resynchronize the system.
Energy storage systems can help utilities maintain synchronous operation of their systems by discharging to provide power and charging to absorb power assystem loading conditions change. Energy storage systems for transmission line stability require power in the 100s of MW, have a self-commutated converter (toprovide real and reactive power), and have enough storage capacity to discharge at full power from a minute up to hours. Energy storage system operation couldtypically occur about 100 times annually.
Figure C-8 illustrates two instances of transmission line stability; both events take the generator away from synchronous operation with the system, and towardan angle difference that could cause system collapse. The balloon shows an expanded time-scale of the first transient event, and the generator’s return to stableoperation. Figure C-9 shows the energy storage system discharging and charging multi-megawatt pulses into the system to counter instabilities.
Figure C- 8. Utility System Needs to Address Transients and Achieve Stability

41
Figure C- 9. Storage Response to Address Transients

42
Transmission Voltage Regulation
Without corrective measures, impedance in transmission lines causes the voltage at the generation-end of a line to be greater that voltage at a load location at theother end of the line. To offset this effect, utilities inject reactive power and maintain the same voltage at all locations on the line. Traditionally, fixed andswitched capacitors have provided the reactive power (VARs) necessary for voltage regulation. An energy storage system that a utility has installed for someother primary application can provide VARs to the system to augment existing capacitors and replace capacitors planned for future installation.
An energy storage system can provide VARs during discharge, charge, or inactivity. For this reason, utilities can use energy storage systems in megawatt sizes(that have other primary functions in the utility) to achieve voltage regulation on the order of 1 to 10 MVARs. The energy storage system for voltage regulationmust provide MVARs for 15-minutes to an hour during daily load peaks (250 times per year). Peaks might not happen as frequently in regions where loading isseasonal. The power conversion system must be self-commutated to provide reactive power.
Figure C-10 illustrates high-demand times that might require voltage regulation. Figure C-11 shows an energy storage system operating to provide VARs duringdischarge, charge, and inactivity. The circular plots associated with voltage regulation periods show real and reactive power the system provides. As inferred bythe plots, the relative magnitudes of VARs and watts that the system provides are not independent, and the inverter must be large enough to provide VARs whiledischarging at full real power levels.
Figure C- 10. System Need for VARs to Correct Voltage Loss Due to Impedance
Figure C- 11. Storage Injecting and Absorbing VARs During Discharge, Charge and Idle

43
This page intentionally left blank
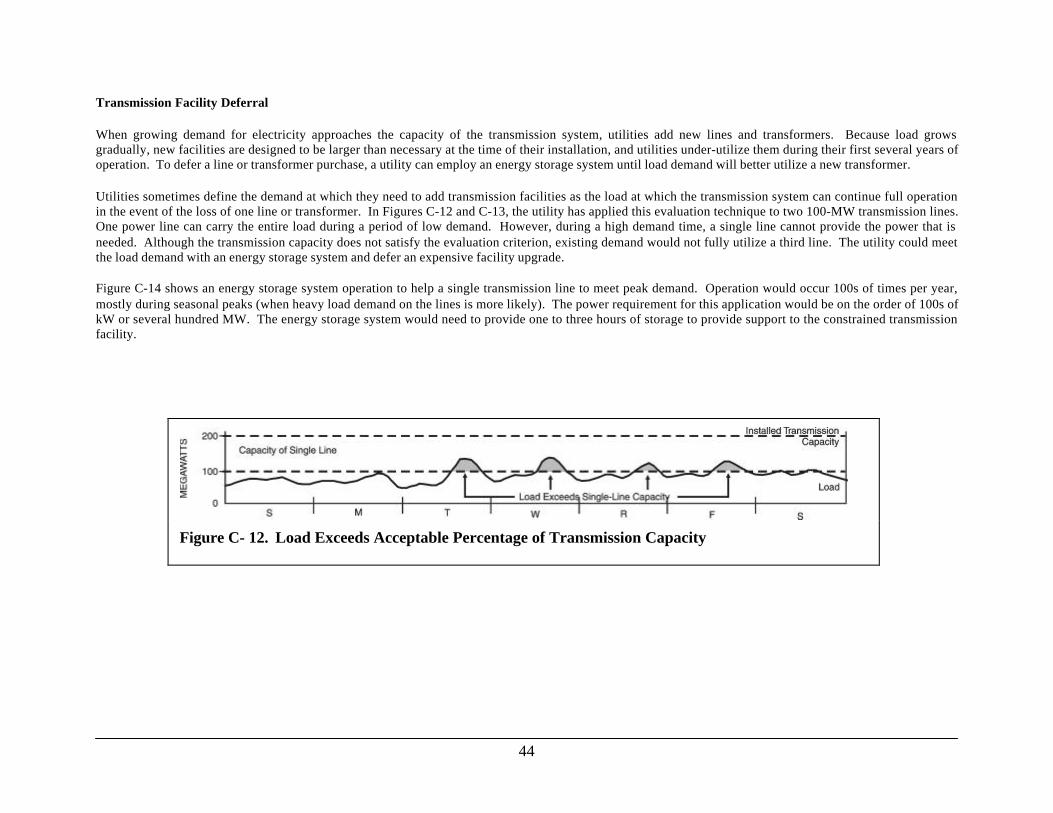
44
Transmission Facility Deferral
When growing demand for electricity approaches the capacity of the transmission system, utilities add new lines and transformers. Because load growsgradually, new facilities are designed to be larger than necessary at the time of their installation, and utilities under-utilize them during their first several years ofoperation. To defer a line or transformer purchase, a utility can employ an energy storage system until load demand will better utilize a new transformer.
Utilities sometimes define the demand at which they need to add transmission facilities as the load at which the transmission system can continue full operationin the event of the loss of one line or transformer. In Figures C-12 and C-13, the utility has applied this evaluation technique to two 100-MW transmission lines.One power line can carry the entire load during a period of low demand. However, during a high demand time, a single line cannot provide the power that isneeded. Although the transmission capacity does not satisfy the evaluation criterion, existing demand would not fully utilize a third line. The utility could meetthe load demand with an energy storage system and defer an expensive facility upgrade.
Figure C-14 shows an energy storage system operation to help a single transmission line to meet peak demand. Operation would occur 100s of times per year,mostly during seasonal peaks (when heavy load demand on the lines is more likely). The power requirement for this application would be on the order of 100s ofkW or several hundred MW. The energy storage system would need to provide one to three hours of storage to provide support to the constrained transmissionfacility.
Figure C- 12. Load Exceeds Acceptable Percentage of Transmission Capacity

45
Figure C- 13. Transmission LoadGrows to MeetDemand
Figure C- 14. Storage Response to Increase Transmission Capacity Until New Facilitiesare Cost-justified
YEARS

46
Distribution Facility Deferral
As load demand approaches the capacity of distribution facilities, utilities add new lines and transformers. Figure C-15 shows a distribution load that allows an insufficient marginbetween its peaks and the system capacity. Figure C-16 illustrates demand growth that approaches the installed distribution capacity. Because demand will continue to grow,utilities install facilities that exceed existing load demands. Therefore, utilities under-utilize expensive distribution facilities during their first several years in service. With energystorage systems, utilities can meet current load demands with existing distribution facilities, and defer the purchase and installation until the demand better justifies new facilities.
An energy storage system to defer installation of new distribution capacity requires power on the order of 10s of kW to a few MW, and must provide 1 to 3 hours of storage. In atypical distribution facility, the battery system would operate most frequently during daily high-load periods that occur during seasonal peaks. Figure C-17 shows the energystorage discharging to meet demand.
Figure C- 15. Distribution Load Exceeds Acceptable Percentage of Capacity
Figure C- 16. Distribution Load GrowthApproaches Capacity
New
YEARS

47
Figure C- 17. Storage Provides Peak Power to Temporarily Defer Purchaseof New Equipment Until it is Cost-justified

48
Customer Energy Management
Utilities typically charge commercial and industrial customers a monthly fee (peak-demand charge) based on the highest power drawn during the month. By reducing peakdemand or by “peak shaving,” customers can significantly reduce peak demand charges. Figure C-18 illustrates the way that customers typically reduce monthly demand peaks.At the beginning of the month, the energy storage system shaves the first peak and notes the reduced peak power level. Then the energy storage system remains idle until powerdemand exceeds the reference value noted during the previous peak shaving event. When load exceeds the reference value, the system discharges the battery to shave this peak,and again notes the maximum power that the utility provided to the customer. This process continues until the end of the month, when the system resets.
In Figure C-18, peak shaving occurs twice to the customer’s load during the first week in a billing period. The energy management system shaves the firstmonthly peak, stores the maximum load value (represented by the lowest dashed line) and waits for load to exceed the stored value to operate a second time.Figure C-19 shows the energy storage operation with discharge for peak shaving and recharge during off-peak hours. In this application, the energy storagesystem would discharge seven or eight times per month, or about 100 times per year. The system size would be in the 10 kW to 1 MW range. The energystorage system would need one to two hours of storage capacity.
Figure C- 18. Customer Demand that Creates Economic Need to Reduce Peaks
Figure C- 19. Energy Storage Providing Power to Manage Customer LoadProfile

49
50
This page intentionally left blank.
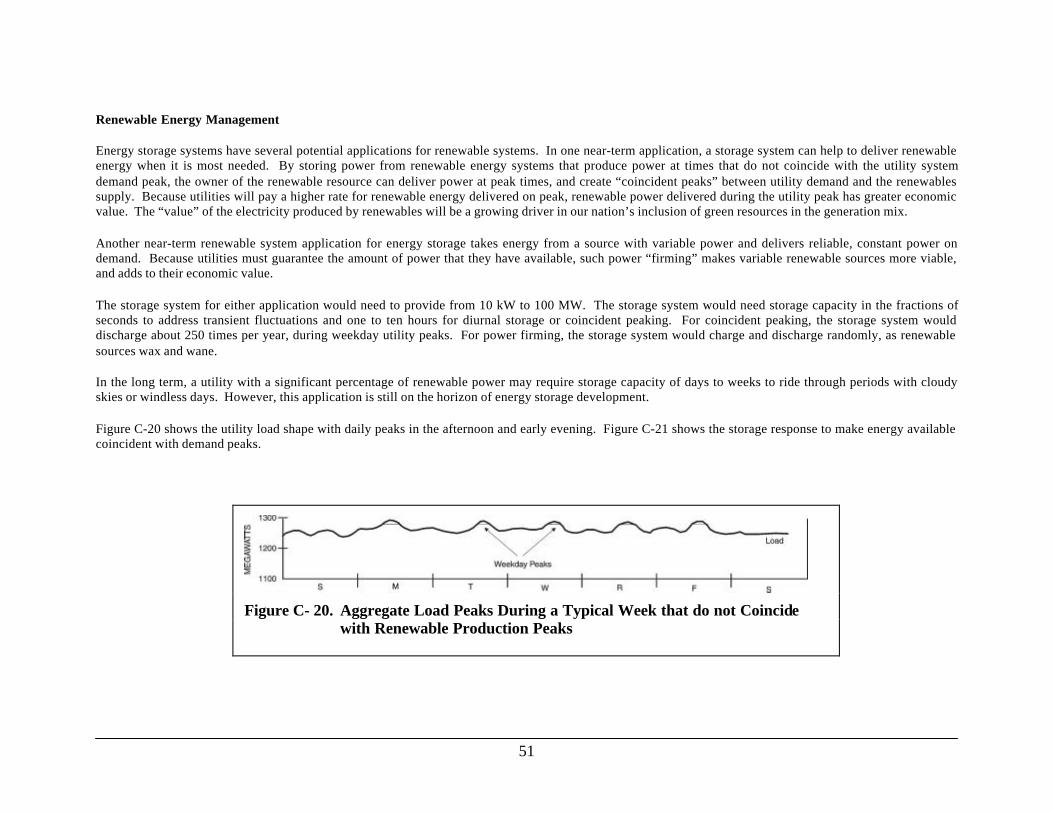
51
Renewable Energy Management
Energy storage systems have several potential applications for renewable systems. In one near-term application, a storage system can help to deliver renewableenergy when it is most needed. By storing power from renewable energy systems that produce power at times that do not coincide with the utility systemdemand peak, the owner of the renewable resource can deliver power at peak times, and create “coincident peaks” between utility demand and the renewablessupply. Because utilities will pay a higher rate for renewable energy delivered on peak, renewable power delivered during the utility peak has greater economicvalue. The “value” of the electricity produced by renewables will be a growing driver in our nation’s inclusion of green resources in the generation mix.
Another near-term renewable system application for energy storage takes energy from a source with variable power and delivers reliable, constant power ondemand. Because utilities must guarantee the amount of power that they have available, such power “firming” makes variable renewable sources more viable,and adds to their economic value.
The storage system for either application would need to provide from 10 kW to 100 MW. The storage system would need storage capacity in the fractions ofseconds to address transient fluctuations and one to ten hours for diurnal storage or coincident peaking. For coincident peaking, the storage system woulddischarge about 250 times per year, during weekday utility peaks. For power firming, the storage system would charge and discharge randomly, as renewablesources wax and wane.
In the long term, a utility with a significant percentage of renewable power may require storage capacity of days to weeks to ride through periods with cloudyskies or windless days. However, this application is still on the horizon of energy storage development.
Figure C-20 shows the utility load shape with daily peaks in the afternoon and early evening. Figure C-21 shows the storage response to make energy availablecoincident with demand peaks.
Figure C- 20. Aggregate Load Peaks During a Typical Week that do not Coincidewith Renewable Production Peaks
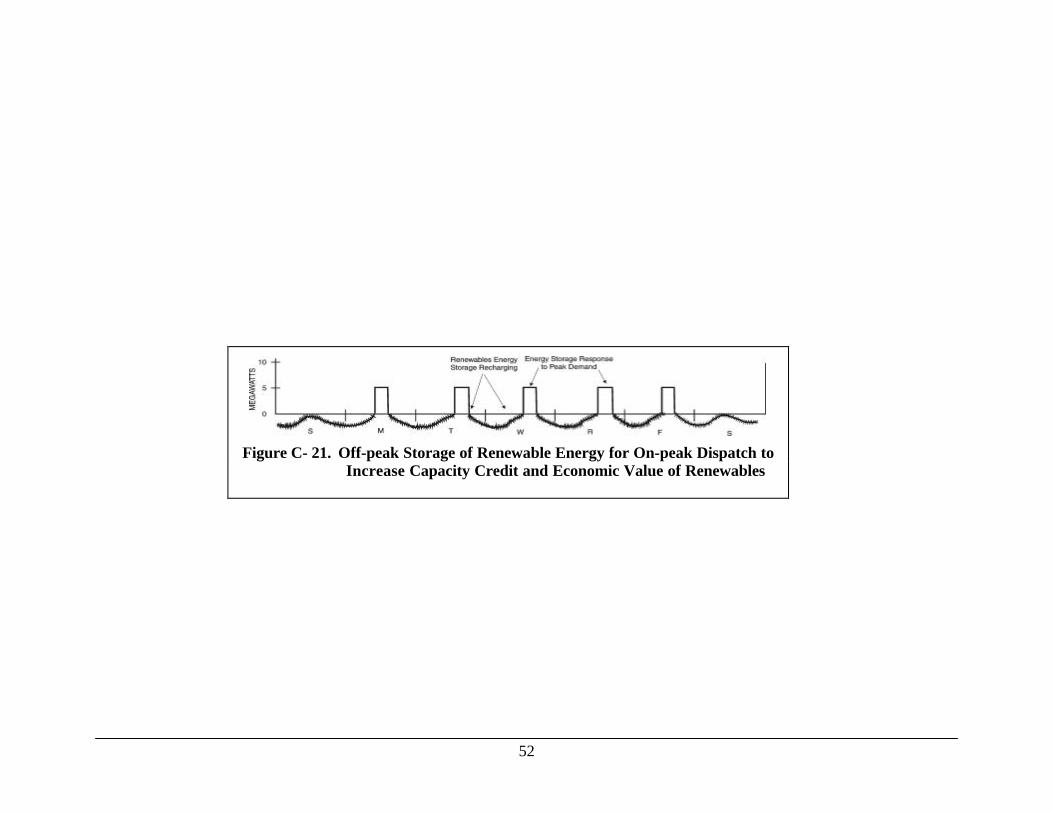
52
Figure C- 21. Off-peak Storage of Renewable Energy for On-peak Dispatch toIncrease Capacity Credit and Economic Value of Renewables
53
Power Quality and Reliability
Small industrial and commercial customers often operate sensitive electronic systems that cannot tolerate voltage sags, spikes, or loss of power. The duration ofa power sag may be only one or two cycles (1/60th of a second) but the effects can be costly. Microprocessors on assembly lines may shut down, and productionand data processing suffer. Figure C-22 illustrates a momentary voltage spike that might cause such production loss.
To protect these electronic devices, customers can install energy storage systems to prevent power sags, spikes, and failures from ever reaching their equipment.If an energy storage system operates in parallel with the load, the battery system disconnects load from a faulted power supply, and provides power until normalutility voltage returns. If an energy system operates in series with the load, the power conversion system always operates. However, energy storage providespower only when voltage sags and interruptions occur. The energy storage system would require 100s of kilowatts and 15 minutes of storage.
Voltage sags, spikes, and power loss typically occur about 10 times a year. A self-commutated converter is necessary to reform 60-Hz voltage.
Figure C-23 shows a storage system installed in parallel with the load where it operates all of the time and provides or absorbs backup power as needed.

54
Figure C- 22. A 50-volt Transient Spike on a 480-Volt Line that Could Causean Outage at a Production Facility
Figure C- 23. Storage Delivers and Absorbs Power Fluctuations as Needed
55
This page intentionally left blank.

56
Appendix D. Revisions to thePhase-I Cost-Breakdown Structure
The cost breakdown structure presented in the PhaseI report considered battery energy storage systemsonly. A revised structure must consider additionalsubsystems that are part of electromechanical andelectrical storage systems. However, the treatmentmust be comparable to the costing structure fortraditional technologies. Table D-1 presents aslightly revised version of the Phase I structure as atool for future analysis to develop a more refined costestimate. The text after the table discusses otherconsiderations that should be part of that refinement.
Some cost groups collapse into a line-item for turn-key systems. However, the detailed breakdown isnecessary for specifying the system on which vendorsbid. Additional detail will be necessary to allowtrue comparative costing of systems. As noted inSection 4 of this report, realistic cost comparisonsmust also consider the complete life-time cost of asystem. This issue is especially relevant forcomponents of the systems that may be consideredhazardous materials that must be disposed of at aResource Conservation Recovery Act (RCRA)permitted facility (sodium, sulfur, bromine, lead,sulfuric acid, sodium polysulfide, chromium used tocoat Na/S containers for corrosion protection, etc.).
While many system manufacturers are offeringreclamation and recycling of the spent storage media,and the customer for the system will not directly bearthe cost, it is a part of the system cost and should beconsidered for direct comparison. For any system,demolition permits, labor, and material disposal(including landfill permits, portage and tipping fees)will be important decommisioning costs.
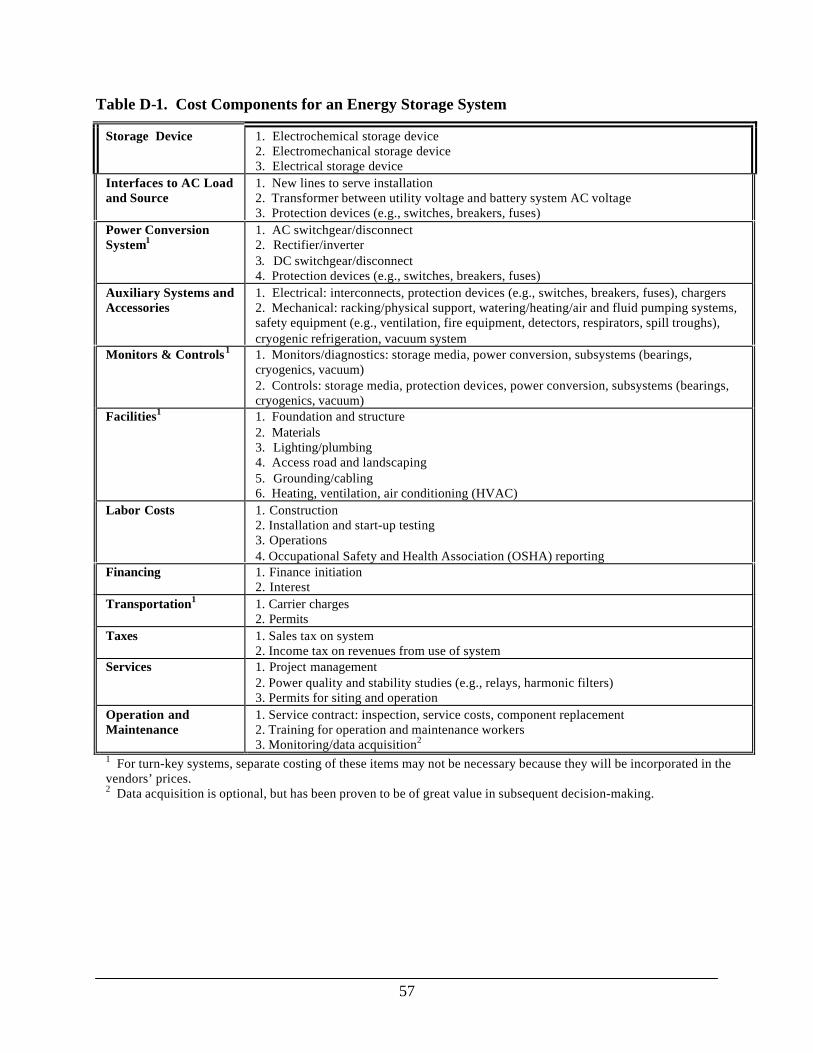
57
Table D-1. Cost Components for an Energy Storage System
Storage Device 1. Electrochemical storage device2. Electromechanical storage device3. Electrical storage device
Interfaces to AC Loadand Source
1. New lines to serve installation2. Transformer between utility voltage and battery system AC voltage3. Protection devices (e.g., switches, breakers, fuses)
Power ConversionSystem1
1. AC switchgear/disconnect2. Rectifier/inverter3. DC switchgear/disconnect4. Protection devices (e.g., switches, breakers, fuses)
Auxiliary Systems andAccessories
1. Electrical: interconnects, protection devices (e.g., switches, breakers, fuses), chargers2. Mechanical: racking/physical support, watering/heating/air and fluid pumping systems,safety equipment (e.g., ventilation, fire equipment, detectors, respirators, spill troughs),cryogenic refrigeration, vacuum system
Monitors & Controls1 1. Monitors/diagnostics: storage media, power conversion, subsystems (bearings,cryogenics, vacuum)2. Controls: storage media, protection devices, power conversion, subsystems (bearings,cryogenics, vacuum)
Facilities1 1. Foundation and structure2. Materials3. Lighting/plumbing4. Access road and landscaping5. Grounding/cabling6. Heating, ventilation, air conditioning (HVAC)
Labor Costs 1. Construction2. Installation and start-up testing3. Operations4. Occupational Safety and Health Association (OSHA) reporting
Financing 1. Finance initiation2. Interest
Transportation1 1. Carrier charges2. Permits
Taxes 1. Sales tax on system2. Income tax on revenues from use of system
Services 1. Project management2. Power quality and stability studies (e.g., relays, harmonic filters)3. Permits for siting and operation
Operation andMaintenance
1. Service contract: inspection, service costs, component replacement2. Training for operation and maintenance workers3. Monitoring/data acquisition2
1 For turn-key systems, separate costing of these items may not be necessary because they will be incorporated in thevendors’ prices.2 Data acquisition is optional, but has been proven to be of great value in subsequent decision-making.

58
Appendix E. Resources forRevision of Markets and BenefitsEstimates
For utilities to consider energy storage as a viablecommercial resource option, they must be able toquantify its benefits and costs. For manufacturers toinvest in developing storage for utility applications,they must be reasonably certain of the potentialmarket and its production demands and profits. Inthe Phase I Opportunities Analysis, participantsestimated the use of storage in various applicationsand analysts used those estimates to project thepotential market for storage and the magnitude of thebenefits to the nation that could result from the use ofstorage in those applications.
At the outset of the Phase II Opportunities Analysis,participants hoped to refine those initial estimates andto make the estimates specific to the new applicationsdefinitions derived in the Phase II work. The originalplan for the Phase II analysis was to hold threemeetings, the first to define applications and theirrequirements, the second to identify whichtechnologies could serve the applications and thethird to gather data that would permit refinedestimates of the markets and benefits. In the courseof the first and second meetings, participants began torecognize that the information required to improveupon the Phase I estimates would require effortoutside of the scope of the Phase II resources.Therefore, the ESS Program elected to address in theestimation of markets and benefits in a separateproject.
Chapter 7 of the Phase I report details the analyticmethods used in the first market/benefit projectionsfor storage. The description of the analytic methodscites the studies and reports upon which data weredrawn and assumptions made. The following listidentifies studies from the Phase I report (and/orrevisions and updates to those studies) that might beuseful in future estimates of market and benefits ofenergy storage.
1. SAND93-3900, “Battery Energy Storage: APreliminary Assessment of National Benefits(The Gateway Study).” – this report was the firstattempt to estimate the potential benefits of usingenergy storage in the US electric power grid.
2. “Benefits of Battery Storage as SpinningReserve, EPRI-AP-5327,” Zaininger – thisreport, conducted for electric utility customers by
ZECO of California, identified that ensuringemergency reserve power represents about 0.4percent of utilities' operating expenses. Thisnumber may change with deregulation andcompetition.
3. “Financial Statistics for Investor-Owned ElectricUtilities, DOE/EIA-0437” – this report showsthat national utility production costs were $70billion in 1990. This number allows estimationof the cost of providing rapid reserve in thenation when taken with the 0.4 percent estimategiven by the previous report.
4. “DOE/EIA Annual Energy Outlook 2000,”– thedata available in this document is useful for 1)Estimating the amount of renewable resources inthe US generation mix and the potential marketand benefits from using storage to increaserenewables penetration and capacity factor;(Table A17) 2) Projecting generation capacityfor the US that, when taken with the data fromReference 7, allow estimation of the potential fordeferring transmission capacity installations; and3) Estimating benefits from energy storage incustomer energy management applications.
5. “Photovoltaic Industry Survey: An Evaluation ofthe Photovoltaic Battery Market, 1992,”Document Number 93-101-RES, ThePhotovoltaic Design Assistance Center at SNL –the results of this survey will help refineestimates of benefits and develop market projectsfor energy storage system support ofphotovoltaics.
6. “Integration of Renewable Energy Sources intoElectric Power Distribution Systems, Vol.2,Utility Case Assessments, ORNL-6775/2,” – thisreport estimates that capacitors cost between $10and $120 per kVAR, figures useful to analysis ofenergy storage in renewable support. The cost ofcapacitors is also useful in analysis of secondarybenefits of installed storage system such ascapacity factor correction. It also cites theinstalled costs of 25 MVA transformers at $1M,or more, a figure useful in the estimation of thebenefits of renewables support and distributioncapacity deferral.
7. "Staff Report on Electric Power Supply andDemand for the Contiguous United States (1989-1998)" DOE/IE-0018 – this report details thenumber of miles of transmission lines (above22 kV) installed for every MW of newgeneration capacity and estimates installations of

59
extra-high voltage (EHV) transmission lines(254 kV and above). This data will help inestimating transmission capacity deferralbenefits.
8. “Potential Benefits of Battery Storage toElectrical Transmission and DistributionSystems, EPRI GS6681,”- this document citesthat transmission lines cost about $1 million permile, excluding transformers, relays, or otherauxiliaries to the cable and its supports. Thisdata with the data from References 4 and 7 allowestimation of the benefits from transmission anddistribution capacity deferral.
9. “Load-Leveling Lead-Acid Battery Systems forCustomer-Side Applications, Market Potentialand Commercialization Strategy, EPRI-AP/EM-5895” – this report cites that a typical demandcharge for a large customer is near $12/kW.This figure is useful in estimating benefits fromenergy storage in Customer Energy Managementapplications.
10. Handbook of Batteries 2nd Edition. D. Linden,ed. McGraw-Hill Book Company. New York.1994
This list of resources is intended to assist futureefforts to assess the markets and benefits ofemploying energy storage technologies in electricpower applications defined in the main body of thisreport.

60