energy survey study survey study...energy survey study report for malshiras irep block sponsored by...
TRANSCRIPT

ENERGY SURVEY STUDY REPORT FOR MALSHIRAS IREP BLOCK
Sponsored by Maharashtra Energy Development Agency (MEDA), Pune
Prepared by Society for Promoting Participative Eco-system Management
(SOPPECOM) 16 Kale Park, Someshwarwadi Road
Pashan, Pune 411 008
September 2000

1
ENERGY SURVEY REPORT FOR MALSHIRAS IREP BLOCK
Suhas Paranjape
Seema Kulkarni
K. J. Joy
Assisted by:
Raju Adagale
Vilas Londhe
Advisors:
K. R. Datye, R. K. Patil, S. N. Lele, S. B. Sane and Vilas Gore
SOPPECOM Girish Sant, Shantanu Dixit, Subodh Wagale and Amol Phadke
PRAYAS and
Dr. Sulabha Brahme

2
Acknowledgements
This study of Malshiras IREP block in Solapur district by Society for Participative Ecosystem
Management (SOPPECOM), Pune was sponsored by the Maharashtra Energy Development
Agency (MEDA). We would like to express our sincere thanks to MEDA, and specially its
Director General Shri Madhu Pillai, for granting this study to SOPPECOM. We are also
thankful to Shri V. V. Mahulkar (Manager IREP) and Shri N. J. Patel (Project Executive, IREP)
for all their help during the entire project period.
Our work, specially during the primary data collection phase, was greatly facilitated because of
the full-hearted cooperation extended to us, specially our field study team, by various officials
at the district and block level. Though it may not be possible to mention all of them, credits are
due to the Block Development Officer, Tahsildar, the agriculture extension officer who handles
the MEDA programme at the block level, supply officer and gramsevaks and talathis from our
sample villages. We also got valuable help from the MSEB officials at the block level, RTO
officials at Solapur, officers in the Regional Statistical Office, the officials at the Survey of
India office, officers at MEDA office, etc., in getting access to data, information, maps,
toposheets, etc., which have all contributed to the study as well as the preparation of this report.
Our thanks are also due to the field data collection team who have tried their best in ensuring
the quality of the data. Similarly we would like to thank Ms. Pratima Medhekar for office
assistance and computer data entry.
We affectionately acknowledge the cooperation and patience shown by the villagers of
Malshiras block specially the households which formed our sample.
We acknowledge the contributions made by our friends in PRAYAS, Dr. Sulabha Brahme, our
senior colleagues from SOPPECOM and our families during the course of this study.
Pune Suhas Paranjape August 3, 2000 Seema Kulkarni K. J. Joy

3
Index
Acknowledgements
Index
Chapter 1 Executive Summary 10
Chapter 2 Introduction 26
Chapter 3 Profile of the Area 29
Chapter 4 Methodology and Approach 46
Chapter 5 Survey Findings 75
Chapter 6 Energy Consumption Scenario for Malshiras Block 135
Chapter 7 IREP and Beyond 158
References 209

4
Index in detail
Acknowledgements
Index
Chapter 1 Executive Summary 10
Chapter 2 Introduction 26
Chapter 3 Profile of the Area 29 Fig. 3.1: Map of Maharashtra State showing Solapur District.
Fig. 3.2: Map of Solapur District showing Malshiras Block.
Fig. 3.3: Map of Malshiras Block showing different revenue circles
Table 3.1: Demographic Profile of Malshiras Block
Table 3.1a: Decennial variation and estimated rise in population
Table 3.2: Land Use Pattern for Malshiras Tehsil
Table3.3: Cropping Pattern for Malshiras block
Table 3.4: Crop wise Irrigated area for Malshiras Block
Table 3.4a: Crop and source wise irrigated area for Malshiras block (1998-99)
Table 3.5: Rainfall data
Table 3.6: Area Irrigated by source for Malshiras Block
Table 3.6a: Irrigation wells and other wells for Malshiras block
Table3.7: Total Crop Production and Productivity of Main Crops - District Solapur
Table3.8: Cattle Population of Malshiras
Table3.9: Electricity use in Malshiras block
Table 3.9a: Total Number of Borewells, Handpumps in use and electric motors
Table 3.10: Kerosene quota for Malshiras block
Table 3.11: LPG connections
Table 3.12: Petrol and Diesel vehicles in Malshiras block

5
Table 3.13: Rural Agricultural and Non-agricultural Enterprises in Solapur District for
the year 1990
Table 3.14: Year-wise Distribution of Energy saving devices in Malshiras block
Chapter 4 Methodology and Approach 46 Fig. 4.1: Location of selected villages in Malshiras block.
Fig. 4.2: Resource index class and Scheduled Caste population class for villages in
Malshiras block.
Table 4.1: List of villages according to Resource Index Class and Tribal Population
Class
Table 4.2: List of villages selected for primary data collection
Table 4.3: Comparison of All Villages and Selected Villages: Selected Indicators
Table 4.4: Coverage of Below Poverty Line (BPL) households in the sample
Annexure 4.1: Sample questionnaires
Chapter 5 Survey Findings 75 Table 5.1: Demographic profile of survey households according to household size and
Circles
Table 5.2: Demographic profile of survey households according to SC, ST population
and circles
Table 5.3: Demographic profile of survey households according to age and Circles
Table 5.4: Demographic profile of survey households according to educational status
and Circles
Table 5.5: Distribution of population according to occupation and Circles
Table 5.6: Distribution of households according to Non-Agricultural Income (NAI)
and Circles
Table 5.7: Distribution of households according to landholding and Circles
Table 5.8: Crop pattern and irrigation status
Table 5.9: Annual agricultural biomass production and use from crop area
Table 5.10: Annual utilisation of biomass from non-crop land
Table 5.11: Trees owned by sample households

6
Table 5.12: Animals owned by sample households
Table 5.13: Annual fodder and feed consumption and dung production for the sample
households
Table 5.14: Annual use of draught power for the sample households
Table 5.15: Annual use of mechanical equipment for the sample households
Table 5.16: Annual pumping energy for the sample households
Table 5.17a: Daily domestic fuel use (except electricity) for the sample households
Table 5.17b:Daily domestic per capita fuel use (except electricity) for the sample
households
Table 5.17c: Annual Domestic Fuel Use (except electricity) for sample households
Table 5.17d:Annual domestic per capita fuel use (except electricity) for the sample
households
Table 5.18: Annual fuel value of domestic fuel used (except electricity) for the sample
households
Table 5.19: Annual delivered heat of domestic fuel used (except electricity) for the
sample households
Table 5.20: Estimated annual green fodder balance for the sample households
Table 5.21: Estimated annual dry fodder balance for the sample households
Table 5.22: Estimated annual free grazing component
Table 5.23: Estimated annual dung use for the sample households
Table 5.24: Estimated annual firewood balance for the sample households
Table 5.25: Households reporting no electricity by Circles for the sample households
Table 5.26: Domestic electricity use by type of equipment and Circles for the sample
households
Table 5.27: Number of Pressure cookers, biogas plants and improved chulhas in the
sample households
Table 5.28: Status of biogas plants in sample households
Table 5.29: Status of improved chulhas in sample households
Table 5.30: User response to improved chulhas
Table 5.31: Energy saving devices used in the sample households

7
Table 5.32: Use pattern of different energy saving devices in the sample households
Table 5.33: Reported number of establishments in the village and sample units by type
of establishment
Table 5.34: Employment pattern in sample establishments by type of establishment
Table 5.35: Annual fuel use in sample establishments by type of fuel and type of
establishment
Table 5.36: Fuel value of annual fuel use in sample establishments by type of fuel and
type of establishment
Table 5.37: Annual electricity use in sample establishments by type of establishment
and type of equipment
Table 5.38: Table of parameters and conversion factors
Chapter 6 Energy Consumption Scenario for Malshiras Block 135 Table 6.1: Projected population and households for Malshiras block (2000 to 2010)
Table 6.2: Projected annual domestic fuel use for Malshiras block (2000 to 2010)
Table 6.3: Fuel value of projected annual domestic fuel use for Malshiras block (2000
to 2010)
Table 6.4: Delivered useful heat of projected annual domestic fuel use for Malshiras
block (2000 to 2010)
Table 6.5: Projected annual domestic electricity use by households for Malshiras
block (2000 to 2010)
Table 6.6: Projected annual electricity use by small rural establishments for Malshiras
block (2000 to 2010)
Table 6.7: Projected annual electricity supply need for domestic and non-agricultural
sector for Malshiras block (2000 to 2010)
Table 6.8: Projected gross irrigated area for Malshiras block (2000 to 2010)
Table 6.9: Projected annual draught power for Malshiras block (2000 to 2010)
Table 6.10: Projected annual mechanical agricultural equipment use for Malshiras
block (2000 to 2010)
Table 6.11: Projected annual electricity consumption by agricultural pumpsets for
Malshiras block (2000 to 2010)

8
Table 6.12: Projected livestock population, annual fodder and feed needs and dung
availability for Malshiras block (2000 to 2010)
Table 6.13: Projected domestic firewood balance for Malshiras block (2000 to 2010)
Table 6.14: Projected green fodder balance for Malshiras block (2000 to 2010)
Table 6.15: Projected dry fodder balance for Malshiras block (2000 to 2010)
Table 6.16: Projected free grazing estimate for Malshiras block (2000 to 2010)
Table 6.17: Projected estimate of pressure on the forest, commons and wastelands for
Malshiras block (2000 to 2010)
Table 6.18: Summary of various kinds of energy use for Malshiras block (2000)
Table 6.19: Comparison of computed and observed values of global solar radiation for
Pune region
Table 6.20: Comparison of computed and observed values of diffuse solar radiation
for Solapur region
Table 6.21: Mean Daily hours of sunshine - estimated for Malshiras block
Chapter 7 IREP and Beyond 158
Table 7.1: Projected programme for improved chulha
Table 7.2: Projected programme for optimised Deenbandhu type biogas plants
Table 7.3: Projected programme for improved kerosene stoves
Table 7.4: Projected programme for nightsoil and dung based community biogas
plants
Table 7.5: Projected programme for leaf litter/biowaste, nightsoil and dung based
community biogas plants
Table 7.6: Projected programme for improved kerosene lanterns
Table 7.7: Projected programme for replacement of filament lamps by electronic
choke and tubelights
Table 7.8: Projected programme for replacement of filament lamps by CFL
Table 7.9: Projected fuel savings from the programme for improved chulha
Table 7.10: Projected fuel saving from the programme for optimised Deenbandhu type
biogas plants
Table 7.11: Projected fuel saving for the programme for improved kerosene stoves

9
Table 7.12: Projected programme for nightsoil and dung based community biogas
plants
Table 7.13: Projected fuel saving for the programme for leaf litter/biowaste, nightsoil
and dung based community biogas plants
Table 7.14: Projected fuel savings for the programme for improved kerosene lanterns
Table 7.15: Projected fuel savings for the programme for replacement of filament
lamps by electronic choke and tubelights
Table 7.16: Projected fuel savings for the programme for replacement of filament
lamps by CFL
Table 7.17: Expenditure on training and stipend of para professionals
Table 7.18: Projected fuel savings for the entire programme at 100% potential
Table 7.19: Fuel value of projected fuel savings for the entire programme at 100%
potential
Table 7.20: Impact of entire biofuel programme on the pressure on the commons at
different levels of achievement of potential
Annexure 7.1: Sustainable and Affordable Energy in Rural and Small Town
Communities -- K. R. Datye
Annexure 7.2: List of NGOs and their addresses
References 209

10
Chapter 1 Executive Summary
1.1 Introduction Humans in all walks of life use energy. In the domestic sphere, energy is required in cooking,
lighting and heating; in agriculture and industries it is used in production related activities.
However, the present rural energy scenario in terms of access to energy is quite dismal. Also,
along with the issue of availability of energy, the other issues like tapping of renewable energy
sources, energy efficient devices and sustainable energy use through integrated planning have
also become very crucial to meet the livelihood requirements of the rural population and also to
move towards sustainable prosperity. The IREP initiated by MEDA partially addresses this
issue and as part of this programme the study of Malshiras IREP block was given to Society for
Promoting Participative Ecosystem Development (SOPPECOM), Pune.
1.2 Malshiras block -- the study area Malshiras block is situated in Solapur district. It is divided into seven revenue circles
for the purpose of administration. Its total geographical area is 1068 sq. km. The trends
in land use indicate that the area under the commons and forests, etc., is fast declining
and as a result the per household availability of common land in the block is very
limited.
The block, which is entirely rural, comprises of 110 villages. As per the 1991 census,
the total population of the block is about 3,50,000 with a total number of 63,000
households. Almost 19% of its total population belong to the scheduled castes. The
main occupation of the people of Malshiras is agriculture with almost 77.5% of the
total main workers being engaged in agriculture related activities.
Jowar, bajra, wheat and maize are the main cereal crops grown in the district. The
main pulses grown are matki, tur and harbara. Sugarcane and cotton are the main cash
crops in the block. The net cropped area of the block has been increasing gradually and
there has been a subsequent decline in the area under fallows. In 1995-96 almost 40%
of the gross cropped area has come under irrigation and about 60% of this is under well
irrigation.

11
1.3 Methodology of the study
A two stage sampling procedure was adopted to select the sample. At the first stage 12 villages
were selected through a systematic stratified random sampling method and at the second stage
25 households from each of the sample villages were selected, again, through a systematic
stratified random sampling method.
Resource index and proportion of Scheduled Caste population were the key variables
considered for the purpose of selection of the 12 sample villages. Based on these key variables,
six strata of villages were formed. It was very difficult to form any clusters or zones,
which were contiguous, and homogenous on the key variables identified. It was,
therefore, decided to present the data and the analysis on the basis of these seven
revenue circles. The sample size for the household survey was 306 and the estimations
of the domestic energy consumption has been done based on the survey findings.
Rural establishments were also studied to understand the energy use pattern in the non-
domestic sector in the block. There were about 30 different types of establishments in all these
villages together. These fell in 7 broad categories as per their energy use and requirements.
Simple random sampling was done within each category to select the sample.
1.4 IREP coverage in Malshiras block Malshiras has been covered extensively under the MEDA programme. Coverage of the
programme in the block for the period between 1995-96 to 1999-2000 is given below in Table
1.1. The data shows that the programme, to a great extent, has been able to meet the targets it
had set.
Table 1.1: Year-wise Distribution of Energy saving devices in Malshiras block
Schemes 95-96 96-97 97-98 98-99 99-2000
Biogas 45 44 64 58 -
Pressure Cookers 96 59 93 23 -
Improved Lanterns 291 1,228 582 1,220 430
Iron Chulhas 1,000 300 - 35 -
Mud Chulhas - - 430 - -

12
1.5 Survey findings and projections for the block
Firewood, fodder and the pressure on the commons The main source of fuel for cooking purposes in the block is firewood. The annual firewood use
per family comes to 3.25 T and much of this comes from their own land. The total firewood
drawn from the commons is very marginal as it comes to only about 2% of the total
requirement. The projections for the block indicate that in the years 2000, 2005 and 2010 the
total domestic firewood requirement would be 2,01,680 T, 2,24,580 T and 2,50,090 T
respectively assuming the proportionate availability of other fuels such as dungcake, kerosene,
etc., as per present composition of fuel use.
The study shows that the households meet most of their fodder requirements from the
production on their own lands and there is very little dependence on the commons. The
availability of dry fodder in the form of crop residue is much higher than the reported
consumption. The estimated free grazing component per animal unit comes to about 25% of the
total fodder and feed requirement. The projections for the block indicate that in the years 2000,
2005 and 2010 the total estimated fodder consumption in terms of dry weight would be about
2,45,060 T, 2,56,310 T and 2,65,240 T respectively.
The estimated pressure on the commons presently is to the tune of 4.35 T/ha (dry weight). This
would increase to 5.5 T/ha in the next 10 years. The estimations show that we are cutting into
the accumulated biomass stock from the commons at the rate of 2.5 T/ha that is indicative of a
crisis that needs to be addressed. The main reason for this is that the commons is very limited
as compared to the number of households in the block. The Table 1.2 below indicates the
pressure on the commons for the years 2000, 2005 and 2010.
Table 1.2 : Projected estimate of pressure on the forest, commons and wastelands for Malshiras block
Year Firewood dry wt
('000T) Free grazing dry
wt ('000T) Total extraction dry wt ('000T)
Estimated area of commons (ha)
Extraction rate dry wt (T/ha)
2000 86.19 48.79 134.98 31,000 4.35
2005 100.48 51.03 151.51 31,005 4.89
2010 116.98 52.81 169.79 31,010 5.48
Dung availability and use The total dung production and its various uses are given in Table 1.3. The table shows that out
of the 540 T (dry weight) dung produced, about 64 T (about 12%) is used for making dungcake,
about 43 T (about 8%) for biogas and the remaining 434 T (about 80%) dung is used as
manure. Of the different types of fuels used for domestic purposes, dung forms only a minor

13
part. The study shows that, of the total annual domestic fuel use, in terms of fuel value,
dungcake forms just 3.5% and biogas forms only 2.4%.
Table 1.3: Estimated annual dung use for the sample households All values in tons
Circle Animal units Dung production Dung used for Dungcake
(dry weight)
Dung used for biogas
(dry weight)
Estimated dung use for manure
(dry weight) gross weight dry weight
Akluj 253 249.08 99.63 12.87 23.36 63.40
(0.99) (0.41) (0.05) (0.09) (0.25)
Dahigaon 202 223.27 89.31 3.88 10.51 74.92
(1.10) (0.44) (0.02) (0.05) (0.37)
Mahalung 198 264.70 105.88 20.88 4.42 80.59
(1.34) (0.53) (0.11) (0.02) (0.41)
Malshiras 61 78.69 31.48 4.56 -- 26.92
(1.28) (0.51) (0.07) -- (0.44)
Natepute 198 221.81 88.72 3.74 -- 84.98
(1.12) (0.45) (0.02) -- (0.53)
Piliv 189 167.57 67.03 10.00 -- 57.03
(0.89) (0.36) (0.05) -- (0.30)
Velapur 115 146.22 58.49 8.21 4.38 45.90
(1.27) (0.51) (0.07) (0.04) (0.40)
Total 1,216 1351.34 540.54 64.14 42.67 433.73
(1.11) (0.44) (0.05) (0.04) (0.36)
Figures in parentheses denote per animal unit values for that zone.
Kerosene The daily per household kerosene use for domestic purposes for the sample households is about
0.20 litre. Of the different types of fuels used for domestic purposes, kerosene forms only a
minor part. The study shows that, of the total annual domestic fuel use, in terms of fuel value,
kerosene forms just about 4%. The estimated demand for kerosene shows that at the end of the
year 2000 the total annual consumption of kerosene would be 4,580 kl.
Composition of different fuels used for domestic purposes (except electricity) for the sample households Table 1.4, given below, gives the annual fuel value of different types of fuels used for domestic
purposes. The table indicates that firewood forms the single largest source in meeting the
domestic fuel requirement of a household.
Table 1.4 : Annual fuel value of domestic fuel used (except electricity) for the sample households
All figures are in '000 kcal/year Circle Firewood Dungcake Kerosene LPG Biogas Total

14
Akluj 835,558.00 32,165.63 29,346.00 9,526.50 54,896.00 961,492.13
(1,903.32) (73.27) (66.85) (21.70) (125.05) (2,190.19)
Dahigaon 652,620.00 9,695.31 20,878.00 9,163.59 24,703.20 717,060.10
(1,778.26) (26.42) (56.89) (24.97) (67.31) (1,953.84)
Mahalung 540,638.00 52,195.00 31,013.32 4,234.00 18,527.40 646,607.72
(1,721.78) (166.23) (98.77) (13.48) (59.00) (2,059.26)
Malshiras 276,670.00 11,406.25 26,036.67 10,020.47 -- 324,133.38
(1,740.06) (71.74) (163.75) (63.02) -- (2,038.57)
Natepute 805,190.00 9,353.13 28,032.00 1,199.63 -- 843,774.76
(2,048.83) (23.80) (71.33) (3.05) -- (2,147.01)
Piliv 563,560.00 25,002.50 29,784.00 -- -- 618,346.50
(2,126.64) (94.35) (112.39) -- -- (2,333.38)
Velapur 302,658.00 20,531.25 15,719.33 2,117.00 10,293.00 351,318.58
(1,903.51) (129.13) (98.86) (13.31) (64.74) (2,209.55)
Total 3,976,894.00 160,349.06 180,809.32 36,261.19 108,419.60 4,462,733.17
(1,897.37) (76.50) (86.26) (17.30) (51.73) (2,129.17) Figures in parentheses are average values per capita for that circle.
Electricity The study shows that, of the total number of sample households, about 34% have reported no
electric connections. The data indicates a very high use of bulbs. Per household annual
electricity consumption comes to about 340 kWh. The total annual electricity consumption for
all the 68 establishments surveyed come to about 1,15,040 kWh. The total electrical energy
used for pumping water is 4,69,274 kWh which, on an average, comes to 2,878 kWh per
pumpset.
The estimated total annual electrical energy requirement for the block for the years 2000, 2005
and 2010 is shown in Table 1.5. The total estimated supply need has been worked out with 20%
T&D losses.

15
Table 1.5: Projected annual electricity supply need for Malshiras block (2000, 2005 and
2010)
All values in kWh Year Rural household
consumption Small rural
establishment consumption
Semi-urban sector
consumption
Agricultural pumpset
consumption
Estimated supply need with 20%
T&D losses
2000 21,086,943 15,442,372 1,675,261 13,133,907 64,175,604
2005 25,722,537 17,195,898 3,684,746 14,419,471 76,280,821
2010 31,377,183 19,148,541 6,322,344 15,439,824 90,362,378
Source-wise energy use in the block The source-wise energy use pattern for the block is given in Table 1.6. The table shows that
firewood accounts for about 85% of the total energy use in the block.
Table 1.6 : Summary for various kinds of energy use for Malshiras block (2000)
Kinds of energy use
Units Total Annual Consumption
Energy equivalent Percentage
'000 Mkcal '000 GJ
Firewood '000 T 201.68 806.73 3,372.14 84.77
Dungcake '000 T 13.01 32.53 135.97 3.42
Kerosene '000 kl 4.58 3.67 15.33 0.39
LPG '000 T 0.61 7.36 30.75 0.77
Biogas MNm3 4.68 21.99 91.93 2.31
Diesel '000 kl 2.03 16.24 67.88 1.71
Electricity MU 51.34 44.14 184.53 4.64
Bullocks '000 days 3,070.00 11.86 49.57 1.25
Total 951.72 3948.11 100.00
1.6 People's responses and their purchasing power A vast majority of the people are very positive about the introduction of the NRSE devices.
However, people have voiced the problems they face in utilising these devices effectively and
also have given certain suggestions to overcome the constraints. Some of these problems and
suggestions for the various gadgets are given below.
Suggestions about energy efficient devices As expected a vast majority of the respondents have said that the government should increase
the subsidy component of the schemes (in their words they should get economic help from the
government) so that many more people would start using devices like improved chulhas,
biogas, lanterns, solar cookers, etc. Most of them also suggested that the distribution of these
devices should not be limited to only those who live in the main village; but should be

16
distributed in the wadis also. Most of them also felt that the government officials are corrupt
and hence there are irregularities in distribution. They also felt that a wider spread of energy
saving devices would ultimately save energy. Many others felt that the information should
reach the people in all the wadis and vastis. The use of solar energy should also be propagated.
A few of the respondents felt that the cost of these devices should be reduced. Propagation of
solar energy should also be made in order to save energy.
Responses and suggestions with regard to the MEDA schemes Most of the respondents expressed the need to get detailed and correct information about
MEDA schemes. The respondents from the remote villages in the block complained that these
schemes do not get implemented in these areas. Many of them also complained about the delay
in getting the government schemes sanctioned. Generally there is a perception among the
people that any government scheme, and MEDA schemes are not exceptions to this, takes an
enormous amount of time to get it sanctioned. Another reaction was that very often these
schemes get monopolised by the richer and influential sections of the village and the needy and
poorer people do not get the benefits of these schemes. Hence many of them pointed out the
need to make these schemes affordable to the poorer sections in the rural areas. There were also
isolated responses like community biogas schemes based on night soil should be introduced in
the villages.
Suggestions to solve the energy problem Invariably almost all the respondents have complained against the frequent power breakdowns
and failures and have very strongly expressed the need for continuous power supply and that
too without much of voltage fluctuations. Another equally important suggestion is about
kerosene. Most of the respondents have very strongly expressed their view that they should get
access to different schemes coming under MEDA. Sufficient quantities of kerosene through the
public distribution system should be given and that too at an affordable cost. Their suggestion
was that the government should provide for saplings to enhance the biomass plantation
The suggestions and responses of the respondents also show that most of them are aware of the
energy problem. In fact, many of them have given suggestions to overcome the energy crisis
and some of these suggestions include (a) the dependence on firewood could be reduced if the
government makes arrangements for more number of biogas plants in the rural areas so that
more and more people switch to biogas for cooking and this would arrest the depletion of
forests, (b) the government should supply more number of devices which run on solar energy at
an affordable cost so that there would be saving of firewood, kerosene, etc., (c) LPG cylinders
should be provided which would also help in reducing the use of firewood, (d) there should be
systematic efforts at afforestation, (e) people should be educated as how to efficiently use fuels

17
and thus save fuels, (f) energy problem at the village level can be solved by collecting and
storing more cowdung and fuelwood and the Gram Panchayat should make the necessary
arrangements or design appropriate schemes for this and implement them, and (g) government
should provide subsidy for distribution of saplings and take up plantation programmes.
1.7 Recommendations of the study for IREP and beyond The study while recognising the importance and the need for increasing the spread of energy
saving gadgets and other NRSE systems also suggests the need for moving beyond the IREP. It
advocates an alternative energy plan, which takes into account the availability of renewable
resources and the potential they have for generation of energy. A holistic approach, rather than
a piecemeal one, is suggested to bring about a change in the current energy scenario. This
includes planning for watershed development and large-scale plantations of trees to enhance the
availability of biomass basically to meet fuel and fodder needs and also generate surplus
biomass, which can be used for power generation. Along with the technical plans there is also a
need to involve the users for a judicious and sustainable use of energy. Several institutional
arrangements therefore become necessary to make a success of the alternative strategy.
Suggested programme for IREP
Firewood, fodder and the pressure on the commons In respect of biofuels programme which has an impact on the pressure on the commons, the
study suggests a modified programme comprising of improved chulhas aimed at half fuel
replacement, optimised Deenbandhu family biogas plants, similarly nightsoil and dung based
community biogas plants and an experimental scale programme for a Pura-style community
biogas plant based on dung, nightsoil as well as leaf litter for different sections. The impact on
the pressure on the commons of the biofuel programme at different levels of the estimated
potential coverage for the block is given below in Table 1.7 and the potential fuel saving at
100% coverage of the entire programme is given in Table 1.8.
It may be seen that even though these programmes give substantial savings in fuel, nevertheless
it is only when the programme reaches 100% of potential coverage that the extraction rate from
the commons comes within the level of expected annual increments, i.e., within sustainable
levels. From another point of view, it is important to estimate at what percent of potential
coverage the programme succeeds in arresting the extraction rate at current levels, i.e., does not
at least worsen the situation any further.
Table 1.7 : Impact of entire biofuel programme on the pressure on the commons at different levels of achievement of potential
Programme coverage as %
Projected 2010 dry biomass
Estimated firewood saving
Dry weight of estimated
Estimated area of forests and
Extraction rate from commons
Reduction in extraction rate

18
of potential extraction from the commons
('000 T)
from the entire programme
('000 T)
firewood saving from the entire
programme ('000 T)
commons ('000 ha)
(T dry biomass per ha)
due to programme
(T dry biomass per ha)
100% 169.79 174.10 139.28 31.01 0.77 4.50
50% 169.79 87.05 69.64 31.01 2.54 2.25
25% 169.79 43.53 34.82 31.01 3.42 1.12
10% 169.79 17.41 13.93 31.01 3.95 0.45
Table 1.8 : Projected fuel savings for the entire programme at 100% potential
Firewood ('000 T)
Dungcake ('000 T)
Kerosene cooking fuel
('000 kl)
Kerosene lighting fuel
('000 kl)
Electricity ('000 kWh)
Improved chulha 48.75 3.15 -- --
Family biogas plants 97.50 6.30 1.47 --
Improved kerosene stove -- -- 0.81 --
Community biogas plant (night soil and dung)
23.10 1.50 --
Community biogas plant (night soil and dung with litter/biowaste)
5.36 0.35 0.08 --
Improved kerosene lantern -- -- -- 0.27
Electronic choke and tube -- -- -- -- 2,207.85
CFL 4,237.05
Total 174.71 11.30 2.36 0.27 6,444.90
One of the conclusions of the above is that the IREP biofuels programme alone cannot be
expected to bring down the extraction rate to sustainable levels and that there must be a
convergence with other supply augmenting programmes like wasteland development,
watershed development, social forestry and other similar programmes.
Suggested level of potential coverage for improved chulha and family and community biogas plants Choosing a suggested level of programme is thus dependent on a consideration of cost and of
other programmes. The objective has been to at least have a coverage where the programme
succeeds in arresting any increase in extraction rate from the commons while other supply
augmenting programmes ease the pressure and bring it within sustainable limits. In this respect
the study strongly recommends that, in the Ist phase, the programme of improved chulha be
taken up at 50% of potential coverage and Deenbandhu family biogas and community biogas
programmes at 10% of potential coverage.
Kerosene Although the recommendation would still be to move away from non-renewable to renewable
energy resources, the need of the hour is to make a judicious increase in the kerosene quota for

19
several reasons. The landless labourers are a section most vulnerable to fuel shortage. They
have no access to firewood resources of their own and their dependence on kerosene is high.
The smaller farmers have a somewhat better access to firewood and biofuels but they too face
practically the same situation. For these sections therefore there is a twofold need in respect of
kerosene: a) they should be the first target for dissemination of kerosene saving devices at a
higher rate of subsidy, and b) they should have expanded access to kerosene supply.
Introduction of improved stoves and improved lanterns is therefore strongly recommended at a
coverage potential of 10% in the initial phase. This would still mean a fuel saving of 650 Mkcal
due to introduction of improved stoves and 220 Mkcal due to introduction of improved
kerosene lanterns.
Electricity and lighting Although there does not seem to be an apparent gap in the electricity demand and supply, the
introduction of gadgets like CFL's and electronic chokes and tubelights would result in saving
in electrical energy which can be used for other production related activities.
The recommendation for the Ist phase is the introduction of electronic chokes and tubelights and
CFL's at 25% coverage potential. In the 2nd phase the number of electronic chokes and
tubelights could be reduced to increase the coverage of CFLs which are more energy efficient.
The introduction of these schemes presupposes a regular electric supply at normal voltage.
The tables below show the expected fuel savings by introduction of electronic chokes and
tubelights and CFL's at different coverage levels.
Table 1.9: Projected fuel savings for the programme for replacement of filament lamps by electronic choke and tubelights
Coverage of the programme
Lamps Cost ('000 Rs.)
Electricity saved (kWh)
100% potential 90,000 36,000 2,207,850.83
50% potential 45,000 18,000 1,103,925.42
25% potential 22,500 9,000 551,962.71
10% potential 9,000 3,600 220,785.08
Annual energy saved per Re (kWh/Re) 0.08
Table 1.10: Projected fuel savings for the programme for replacement of filament lamps by CFL
Coverage of the programme
Lamps Cost ('000 Rs.)
Electricity saved (kWh)
100% potential 1,60,000 52,000 4,237,049.28
50% potential 80,000 26,000 2,118,524.64
25% potential 40,000 13,000 1,059,262.32
10% potential 16,000 5,200 423,704.93

20
Annual energy saved per Re (kWh/Re) 0.11
Impact of the programme on fuel saving The fuel saving that would accrue from the suggested programme over a period of 10 years
from 2000-2010 is given in the table below.
Table 1.11 : Fuel saving form the suggested programme
Programme Coverage (%)
Firewood ('000 T)
Dungcake ('000 T)
Kerosene cooking fuel
('000 kl)
Kerosene lighting fuel
('000 kl)
Electricity ('000 kWh)
Improved chulha 50 24.38 1.58 -- -- --
Family biogas plants 10 9.75 0.63 0.15 -- --
Improved kerosene stove 10 -- -- 0.08 -- --
Community biogas plant (night soil and dung)
10 2.31 0.15 0.04 -- --
Community biogas plant (night soil and dung with litter/biowaste)
-- 5.36 0.35 0.08 -- --
Improved kerosene lantern 10 -- -- -- 0.03 --
Electronic chokes and tubelights 25 -- -- -- -- 551.96
CFL 25 -- -- -- -- 1,059.26
Total 41.8 2.71 0.35 0.03 1,611.22
Investment Required It is suggested that IREP programme components should be included in other related
programmes like wasteland development, watershed development, health programmes, etc.,
and part of the funds of the IREP programme should be allocated from such allied schemes.
The cost therefore is assumed to be divided between users, IREP funds and other Government
scheme funds. For electrical components, at present, only IREP and user funds are assumed,
though it is possible to work out a contribution to these from MSEB and allied sources.
The investment required for the recommended programme is given in Table 1.11 below. The
distinction is essentially made on two aspects. The first set of schemes directly relates to the
pressure created on the commons and forestlands. This investment therefore means that the
impact will be seen on the environment at large. The pressure on commons would be reduced
considerably.
The second component is the energy required for lighting. The investment made here will have
an impact on the total electrical energy saved. The MSEB and the IREP could jointly decide the
investment pattern but there is a recommendation for the programme to go ahead at the
coverage potential discussed above.
Apart from this, investment on personnel too has to be made to ensure the proper
implementation and monitoring of the programme. This has been outlined in the last chapter.

21
Table 1.11: Investment required for the suggested programme for the period 2001 to 2010
Sr. No.
NRSE gadgets Coverage (%)
Investment from different sources ('000 Rs.)
IREP Government Users Total
1. Improved chulha 50 1,500 1,500 1,500 4,500
2. Deenbandhu biogas 10 5,000 5,000 5,000 15,000
3. Improved kerosene stoves
10 463 -- 463 925
4 Community biogas 10 1,000 1,000 1,000 3,000
5 Community biogas plant (night soil and dung with litter/biowaste)
-- 1,650 1,650 1,650 4,950
6 Improved lanterns 10 263 -- 263 525
7 Electric chokes and tubelights
25 4,500 -- 4,500 9,000
8 CFLs 25 6,500 -- 6,500 13,000
Total 20,876 9,150 20,876 50,900 Table 1.12: Investment required for the suggested programme at 100% coverage
Sr. No.
NRSE gadgets Investment from different sources ('000 Rs.)
IREP Government Users Total
1. Improved chulha 3,000 3,000 3,000 9,000
2. Deenbandhu biogas 50,000 50,000 50,000 150,000
3. Improved kerosene stoves 4,625 -- 4,625 9,250
4 Community biogas 10,000 10,000 10,000 30,000
5 Community biogas plant (night soil and dung with litter/biowaste)
1,650 1,650 1,650 4,950
6 Improved lanterns 2,625 -- 2,625 5,250
7 Electronic chokes and tubelights
18,000 -- 18,000 36,000
8 Cfl'S 26,000 -- 26,000 52,000
Total 115,900 64,650 115,900 296,450
Solar cookers, solar water heaters, solar photo voltaic devices Solar cookers, solar water heaters, solar photo voltaic devices are the three main groups of solar
devices being propagated under the IREP. The study finds that in rural areas they have received
lukewarm response, and at best have a demonstration and awareness value because of a host of
problems associated with domestic solar devices. For this reason it is suggested that they should
be taken up on a demonstration scale, for example, as part of Urja Grams. SPV street lighting is
also one of the possible demonstration devices, provided there is a service back up.

22
Crop wastes and biomass for energy generation At present crop wastes surpluses as well as other utilisable biomass surpluses are not readily
available. Also given the immense pressure on the commons, it is not considered advisable to
withdraw biomass for power generation at this stage.
Wind, Hydro, and micro hydel explorations
Solar energy Solar energy has not been monitored anywhere in Malshiras block. The closest figures
available are for the Pune region and the data shows that, except for July and August, values for
global radiation are above 5kWh/sq.m./day, which shows that there is good potential for solar
energy. The mean daily hours of sunshine, however, are not very well distributed and are
consistently low for the four monsoon months.
Wind energy Wind energy is not being monitored at any site in Malshiras as part of the study of wind energy
sites being taken up all over Maharashtra. So there is no data available to assess the potential
for wind energy in the block. Even if any future study indicates wind energy potential or partial
potential for the block (on any site in the block) we would advocate a hybridisation approach in
harnessing that potential. For this, see Datye (1997) and Paranjape and Joy (1995).
Hydro power Malshiras block being situated in the drought-prone region, the annual rainfall is only about
500 mm. Analysis of the rainfall series data shows that there would not be significant
dependable flows within the block. The terrain of the block is also relatively flat. Thus,
Malshiras block will not have a significant hydro potential.
Mass utillisation of renewable energy as basis for sustainable prosperity Many of the possibilities of mass utillisation of renewable energy as basis for sustainable
prosperity are examined in greater detail in Datye (1997) and Paranjape and Joy (1995). At
present crop wastes surpluses as well as other utilisable biomass surpluses are not readily
available. If IREP is treated as a supplementary part of associated convergent schemes for
sustainable productivity enhancement, biomass surpluses will be generated and can be
integrated into sustainable energy systems described in the annexed note. Most of the
programmes flowing out of these fall outside the current scope and nature of IREP. Moreover,
without supplementing IREP with a programme on that scale, IREP might only prove to be
symptomatic relief; but joined with it, it can become a part of a synergetic energy system that

23
ensures an enhanced quality of life for the rural population without compromising on
sustainability and equity. That however requires a separate study focussed on evolving a pilot
project for this purpose.
Role of NGOs, women's groups and village institutions with support from MEDA/Government The issue of energy has not yet become a key issue of involvement for most of the NGOs and
organisations working in rural areas. So, although many of these NGOs and organisations have
a base among the people in the rural areas, they do not have much of experience in dealing with
issues related to energy. Thus, first of all, there is a need for the NGOs and organisations to
consciously decide to make energy-related programmes as part of their overall developmental
work. There should be also initiative from the side of the government, and specially MEDA, to
get the involvement of NGOs and organisations in the rural energy programme. It is proposed
that the recommended programme be taken up jointly where the strengths of all the
organisations involved such as MEDA, NGOs, village institutions, user groups, women's self
help groups (SHGs), etc., be put together to achieve the targets set. The proposed programme
therefore assumes participation of all the concerned organisations.
Institutional issues Besides its technical component, any programme must take into account the social mechanisms
through which the programme objectives are to be achieved. Presently, government personnel
who are already burdened with their own departmental responsibilities administer the
programmes. They are not in a position to fulfil the multifarious functions that such a
comprehensive programme demands. Moreover for far too long they have been used to one-
way communication (best described in the term -- delivery system) and are not adequately
equipped to handle the needs of two-way communication. For this reason, the study proposes
an alternative institutional mechanism for handling the multifarious needs that an IREP
programme demands. The two main elements in it are the user groups and the service
organisation/group. The role of NGO's becomes very crucial in the formation of user groups.
User Groups User groups are now a well recognised institutional measure for ensuring participation. User
groups should be formed village-wise around each component as the programme progresses.
For example, in the case of biogas and improved chulhas the users are women. It would
therefore be appropriate to form women's user groups to deal with the implementation of the
programme. Wherever possible, the programmes should feed into SHG activities and the SHGs

24
themselves can become user groups for the programme. This will help achieve convergent
community action (CCA) which is one of the important shortfalls of government programmes.
Support services Any programme, as detailed in this report, cannot be taken up on a mass scale without ensuring
effective support service mechanisms. There are three main types of support services that are
needed: a) awareness creation, information dissemination and motivation, b) provision of
technical services and c) preparation of guidelines, recommendations and improvements.
Team of para-professionals It is proposed that MEDA should take up the task of forming and training a team of para-
professionals at the block level, somewhat along the lines of village health workers. The local
NGOs could be also involved in the process of identifying the para-professionals. They need to
be trained in the devices propagated under the IREP. They should also receive training for
making an appropriate choice of devices, constructing/installing the devices, and in handling
routine repairs and advise on maintenance and monitor performance.
The para professionals will receive on-job as well as separate training. It is suggested that the
person get a stipend of Rs. 750 p.m. during the first year which shall be considered a training
period. However, the person will have to begin the work of organising around ongoing
programmes immediately on induction.
After training, the person will be entitled to a stipend of Rs. 1000 p.m. for another four years,
during which he or she shall be responsible for the targets to be achieved within the person's
designated area/group. Since as emphasised earlier, the programme should not disperse its
efforts but should concentrate on covering an area progressively but intensively, it is assumed
that the para-professionals are inducted in a phased manner. Thus every year for the first six
years, 30 para- professionals will be inducted and trained. They should also be able to act as the
conduit for a two way communication between users and the government as well as support
scientific institutions.
1.8 List of NGOs and their addresses Given below is a list of NGOs and organisations, along with their addresses, working in
Solapur district and the nearby areas who could be associated with the energy programme in the
block.
a) Mahatma Phule Samaj Seva Mandal Niyojan nagar Jamkhed Road P.B.No 9 Karmala

25
District Solapur 413203 Contact person: Shri Pramod Zinjade Tel. No. 02182-20609
b) Model Action for Rural Change
'Nimbonichamala' At post Kem Taluka Karmala District Solapur 413223 Contact person: Shri Shivaji Talekar Tel. No. 02182-40760/40778
c) Nisarg Yatri 20, Pundaliknagar, Pandharpur District Solapur 413304 Contact person: Shri R. Govind Sabnis Tel. No. 020-6870957, 6878243
d) Vanashthali Rural Development Centre 318/19 B Canal Road Shivajinagar Pune, 411016 Contact person: Prof. Nirmala Purandare Phone 020-5651550

26
Chapter 2 Introduction
2.1 Background of the study
Access to sufficient quantities of energy, like water, is a prerequisite for the sustainable
prosperity of any society. Energy is used in every walk of human life -- domestic lighting,
cooking, agriculture, irrigation, industry, transportation, establishments and offices all need or
use energy in one form or the other. It is said that energy is the key to all production, including
agricultural production; but nowhere is it as important as in non-agricultural, industrial
production, which has the potential to generate significant non-farm incomes to the vast
sections of the rural resource poor. Thus, energy is a critical resource for subsistence, livelihood
assurance, and in turn the quality of life, of the rural population. No wonder prosperity and
quality of life very often get equated with access to energy.
However, the present Indian rural scenario in terms of access to energy is quite dismal. It is
estimated that the energy availability in India is of the order of 500 kgce (kilograms of coal
equivalent) per capita, and for the rural areas, this value is likely to be of the order of 200 kgce.
The pre-Second World War levels of energy consumption of the advanced countries were of
the order of 5000 kgce. It is true that more than half of this consumption is accounted for
domestic heating and transportation and so for comparison we can take that the per capita
energy consumption of the order of 2500 kgce. This means that in pre-Second World War times
the people of advanced countries had access to energy to the tune of 12.5 times as compared to
the present rural scenario in India. The gap between the developed and developing countries in
terms of per capita access to energy has further widened with the latest estimates that in many
of the developed countries the per capita availability of energy is to the tune of 6000 to 10,000
kgce.
The problem is not only with the quantum of energy. With environmental concerns and
sustainability issues coming to occupy an important place in the mainstream discourse on
development, the quality of energy and its source has also become very important. Coupled
with this there are also studies to show that the fossil fuels are also fast getting depleted and it is
predicted that with the present levels and trends in energy consumption, especially of the
developed countries, the fossil fuel deposits would get depleted within the next 20 to 25 years.
The protests against large, centralised projects like hydro power plants (and big dams), thermal
powers plants, atomic power plants, etc., are also becoming quite wide-spread on many counts
like the displacement, pollution, health hazards, unsafe nature, etc. Over the last couple of
decades there is also a renewed interest in renewable and dispersed sources of energy like solar,

27
wind, small-hydro, biomass, etc., and because of this there are already many technologies and
gadgets available to harvest these renewable sources of energy and efforts are being made to
achieve new breakthroughs in this field.
All these call for a new and innovative approach to the issue of energy with the ultimate goal
being energy self reliance of rural communities. Though it implies a long term strategy and
policy initiatives from the state, one of the immediate things one can do is to shift to energy
efficient devices so that the same activities and functions can be carried out with less energy.
Let us not forget that energy saved is equivalent to new energy generated. Along with this it is
also important to promote non-conventional and renewable sources of energy (NRSE) systems
so that the dependence on fossil fuel based energy could be gradually reduced. In fact the main
objective of state level co-ordinating agencies like Maharashtra Energy Development Agency
(MEDA) is to develop such integrated energy plans and also to promote energy efficient
devices, technologies and NRSE systems.
It is also true that to efficiently intervene in the present rural energy scene it is important to
understand the micro-level situation especially in terms of the present energy use pattern -- both
from the supply and demand side. This would help in identifying the gaps and also indicate
areas where optimisations and interventions are possible. It also gives a feedback on the energy
efficient devices that are being promoted by MEDA so that MEDA can make the necessary
changes in the overall programme as well as make perspective plans and work out an action
agenda.
It is with this idea in mind that MEDA commissioned studies of the various IREP blocks in
Maraharashtra. The study of Malshiras IREP block in Solapur district was given to Society for
Promoting Participative Eco-system Management (SOPPECOM) -- a non-governmental
organisation working in the field of natural resource management with participation,
sustainable productivity enhancement, equity and energy self-reliance as its major concerns.
And it is this concern which prompted SOPPECOM to take up this study.
2.2 Scope of work
The scope of work as per the `work order' issued by MEDA includes:
a) To select sample villages in Malshiras block, which represent its geographical, social,
cultural and energy use pattern characteristics.
b) To estimate present energy use pattern utilising the existing sources of energy.
c) To make an assessment of all existing energy resources, namely, conventional, non-
conventional, commercial, non-conventional, renewable and non-renewable.

28
d) To make a judicious estimation of projected energy demand for the next five and ten years
based on suitable assumptions.
e) To identify and quantify any apparent and disguised energy gap between demand and
supply based on the studies of rate of utilisation and rate of consumption.
f) To propose realistic approach towards planning the energy programme which can help to
bridge the gap of demand and supply to a great extent considering the energy impact,
physical achievement and financial implication.
g) To make an assessment on the performance and popularity of various energy saving
devices supplied by MEDA to beneficiaries in the block and give recommendations.
h) To make an assessment of the requirement of various NRSE systems, energy efficient
systems like improved kerosene lantern, stove and energy efficient lights by various
sectors.
i) To make an assessment of requirement of conventional bulbs in households and the scope
of their replacement by energy efficient lamps.
2.3 Organisation of the report
The report is organised and presented in seven chapters. The first chapter gives the executive
summary of the report. After the second chapter, which is introductory in nature, we have the
third chapter, which gives a brief profile of Malshiras block. Chapter 4 deals with the
methodology of the study. The survey findings of the sample villages are presented in Chapter
5. Chapter 6 presents the block level estimations and projections for the years 2000 to 2010.
Finally the seventh chapter presents an alternative energy programme for Malshiras block.
Tables, figures and annexures (including the questuionnairs used for primary data collection)
relevant for each chapter are given at the end of the very same chapters.

29
Chapter 3 Profile the Area
3.1 Geographical location Malshiras is one of the 11 blocks of Solapur district and it extends approximately between
latitudes 17°36' N and 18°2' N and between longitudes 74°41'E and 76°18' E. The block is on
the Western side of the district. Pandharpur, the abode of the famous temple of Vithoba and
Rakhmai, is about 51 kms to the East of Malshiras. On its Southern boundary lies Sangola
block and to its East is Pandharpur. Malshiras is subdivided in seven revenue circles. Malshiras
block has no urban areas. Akluj is one of its most prominent and prosperous villages.
Malshiras is one of the few blocks in the district, which has some hilly areas. The district is
otherwise flat and waving. The chief hill in Malshiras is the Gurvad hill, which lies on its
Western side. The rest of the block is flat and devoid of trees.
The major rivers are the Nira and the Bhima. The Nira runs from the West to the East on the
northern border of the block and later joins the Bhima in the NorthEast of the district close to
Tembhurni town. The Eastern side of Malshiras lies in the Bhima valley. The Bhima runs from
North to South on the eastern border. The rivers are mostly dry in the hot season.
3.2 Rainfall and climate The climate of the block is generally dry and hot and the rains are scanty and uncertain. The
SouthWest monsoons commence around June and last till September. October and November
constitute the post monsoon or the retreating monsoon season. Almost 70% of the rainfall is
received through the South-West monsoons. The average rainfall of the block is around 500
mm.
The winter season starts around December and lasts up to February. The summer season starts
around March and lasts till May. In fact May is the hottest month of the year with temperatures
rising to about 42°- 45° C.
3.3 Demographic profile According to the 1991 Census the total population of the block is about 3,50,000 with 63,000
households and has a population density of 230. The block has 110 inhabited villages. About 18
% of the population in the block belong to Scheduled Castes. The literacy rate of the block is
44% and female literacy is about 35%. Agriculture is the main occupation of the people. About
77.5% of the total main workers in the block work in the agricultural sector (Tables 3.1 and
3.1a).

30
3.4 Land use pattern The total geographical area of the block is 1608 sq. km. The time series data shows that there is
no significant change in the land use pattern over the ten years period from 1984-85 to 1995-96
except in the case of area under forest. In the case of forest, the area has been declining. In
1984-85 it was about 3.66% of the total geographical area and the 1995-96 data shows that it
has declined to about 0.18%. The net cropped area has been increasing gradually since 1984-
85. In fact there is a decline in the area from 84-85 to 88-89. But there has been a gradual
increase from about 59% in 1988-89 to 66% in 1995-96.
Area under grazing land has declined from 8.45% in 1984-85 to just 0.18% in 1994-95. A
similar trend is observed for area under groves and trees. This trend generally seems to indicate
a decline in the availability of common property resources, forest lands, etc. (Table 3.2).
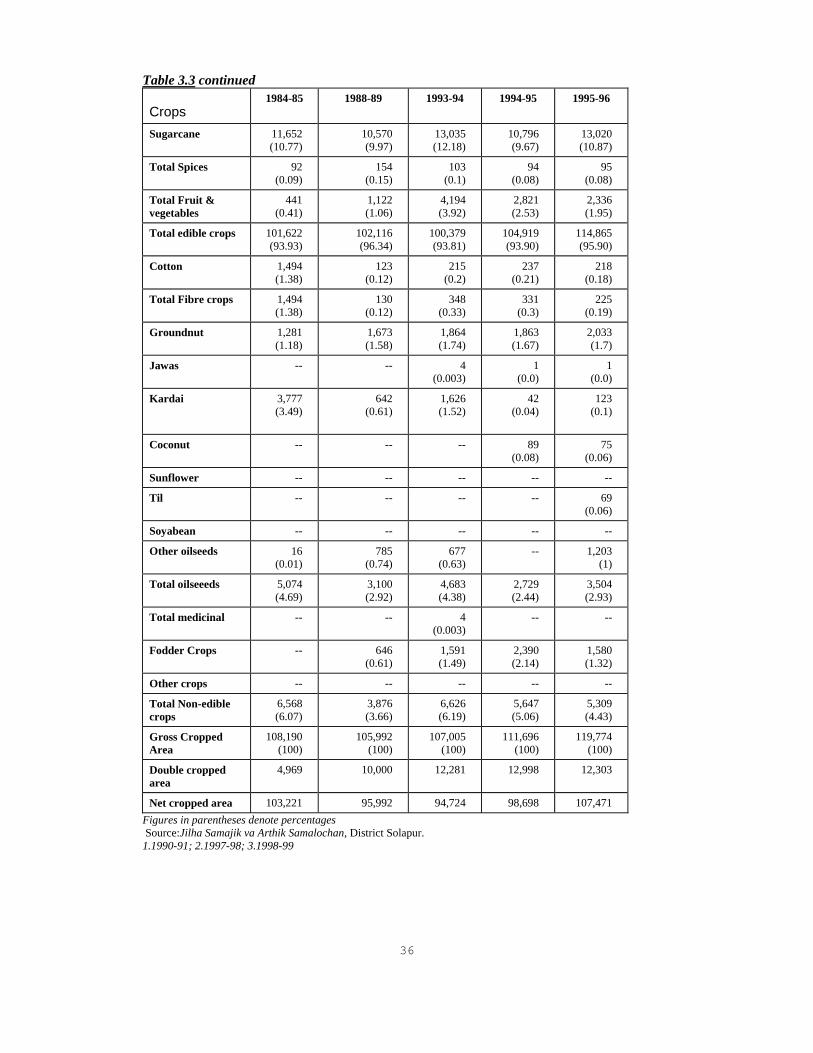
3.5 Cropping pattern The soils of Malshiras block are generally shallow and light in colour and not retentive of
moisture. Some parts are stony too. However, fertile black soils of sufficient depth are also
found in some parts of the block thereby allowing cropping of jowar, bajra, wheat, kardai and
cotton. Rabbi jowar is the principal crop of the block accounting for about 59% of the gross
cropped area in 1995-96. The time series data, however, shows that the area under rabbi jowar
has increased only marginally -- from 56.67% in 1993-94 to 58% in 1995-96. The area under
pulses has been decreasing as the area under pulses has come down from 6.68% in 1984-85 to
4.1% in 1995-96. Harbara is the main pulse taken in the area. The area under coconut seems to
be on the rise as no area under coconut was reported prior to 1994-95.
Of the total irrigated area, jowar accounts for about 29.79% in 1995-96. The irrigated area
under all cereals is about 56.51% and there has been very marginal change in this over a period
of 10 years. The area of sugarcane, which accounts for only about 10% of the gross cropped
area, is 30%. This has, more or less, remained the trend for the period 1984-85 to 1995-96. The
irrigated area under harbara has gone up marginally from 2.17% in 1984-85 to about 3.25% in
1995-96 (Tables 3.4 and 3.4a). The data for crop production and productivity in the district is
given in Table 3.7.
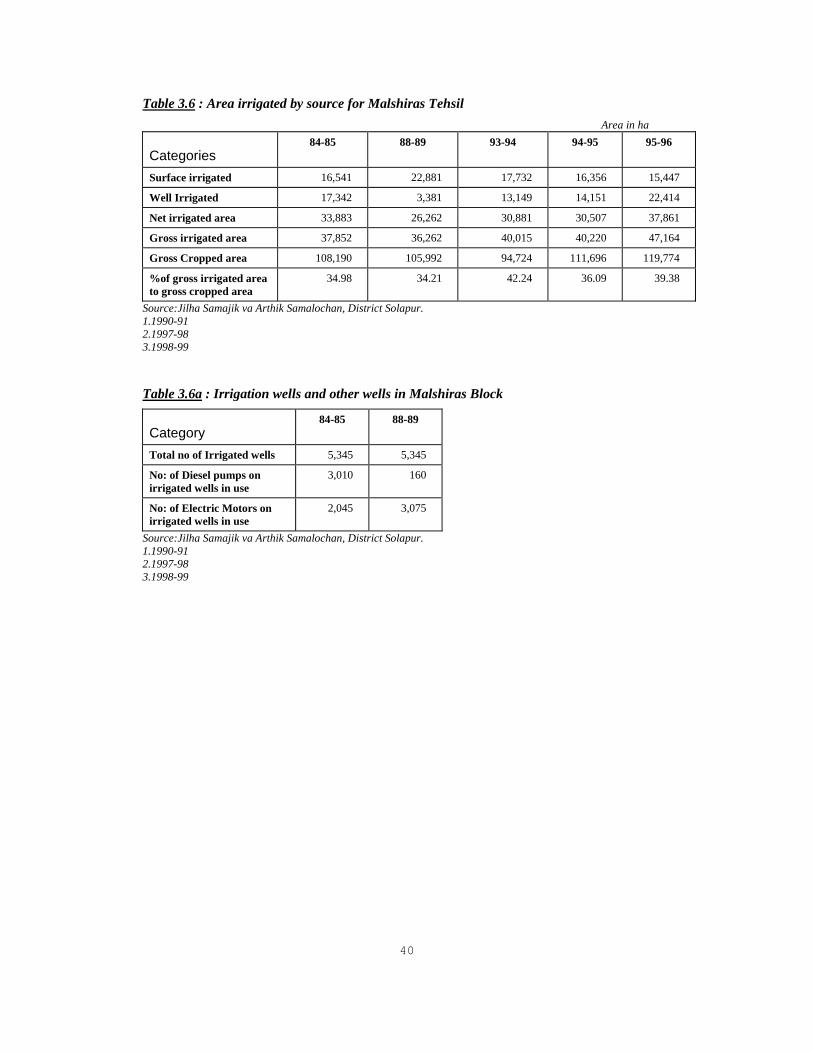
3.6 Irrigation status
The gross irrigated area from all sources for the year 1999-96 is 37,861 ha, which is about
39.38% of the gross cropped area. This has increased from 34.98% in 1984-85 with a sharp
increase in the year 1993-94 when it was about 42%. The area irrigated by wells has increased
from 17,342 ha in 1984-85 to 22,414 ha in 1995-96. The percentage of area irrigated by wells is
about 51% in 1984-85 and this has been increasing and for the year 1995-96 it is about 60% of

31
the total irrigated area (Table 3.6). The data for the total number of irrigation wells and electric
motors installed on them is shown in Table 3.6a. Estimations for the years 2005-2010 for
pumping energy have been made on the basis of data for electric motors installed for the year
1988-89. The data for the subsequent years seemed rather incongruent and hence has not been
used for projections for pumping energy.
3.7 Domestic animals The total cattle population -- bullocks and cows both of the crossbred and pure breed varieties -
- is about 1,05,950. Malshiras has a higher population of indigenous cattle as about 57% of the
total cattle population belong to this. Of the total crossbred and pure breed cows, 35% yield
milk. Of the indigenous varieties about 29% are milk yielding cows. The total number of
crossbred and pure breed working bullocks is about 1950. The number for indigenous bullocks
is about 16,500. Of the total crossbred and pure breed varieties of bullocks, 58% are working
bullocks. The figure for indigenous bullocks is 91%.
The total number of buffaloes in the block are 34,770 and of these 30% are milk yielding ones.
The other domestic animals in the region include sheep and goat, which are there in large
numbers accounting for almost 60% of the total animal population. The total animal population
of the block is 3,59,180 (Tables 3.8 and 3.8a).
3.8 Electricity use The total electricity use for Malshiras block for the year 1999-2000 has been 6,04,22,000 kWh.
Of this, about 45% is domestic use and agricultural use accounts for about 24%. The average
annual domestic electrical energy available for each household in the block is about 429.80
kWh (Tables 3.9 and 3.9a).
3.9 Use of kerosene/LPG Table 3.10 indicates the monthly quota of kerosene for the months of June and July 2000. The
quota for the month of July amounts to about 9.5 litres for each household. There seems to be a
marginal increase in the quota from the previous month. The average monthly quota per
household is 7.9 litres.
There are about 18,165 LPG connections in the block. This means that about 25% of the
households of the block have access to LPG to meet their cooking and other needs (Table 3.11).
3.10 Rural commercial establishments and industries The data for the district shows that there are about 67,870 rural enterprises in the district.
Almost 88% of these falls in the private sector and the remaining 12% comprise of the co-
32
operative and public sector. About 17% of the total enterprises are run on electrical power
(Table 3.13).
3.11 MEDA schemes Malshiras block is one of the blocks taken up under the IREP programme. The main thrust of
the programme seems to be on distribution of improved lanterns and installation of biogas
plants. The distribution of pressure cookers has decreased from 96 in 1995-96 to just 23 in
1998-99. The distribution of iron chulhas too seems to have decreased considerably from 1000
in 1995-96 to a mere 35 in 1998-99. There seems to be hardly any data available for other
schemes of MEDA such as improved stoves, euro lights, CFL's, solar cookers or the improved
crematoria introduced recently (Table 3.14).

33
Table 3.1 : Demographic profile of Malshiras block 1991 census
Categories
Area (sq km.) 1,608
Density(population/sq. km area
230
Habited villages 110
Inhabited villages 0
Towns/cities 0
Total number of Households(000)
63,000
Population (000)
SC Male 33
SC Female 31
SC Total 64
ST Male 1
ST female 1
ST total 2
Total Male 182
Total Female 168
Total 350 Source:Jilha Samajik va Arthik Samalochan, District Solapur 1998-99
Table 3.1a : Decennial Variation in Malshiras block
Year Total Population
(‘000)
% increase
1991 350 24.10
1981 282 24.65
1971 226 36.01
1961 167 35.57
1951 123 -- Source:Jilha Samajik va Arthik Samalochan, District Solapur 1998-99

34
Table 3.2 : Land use pattern for Malshiras block Area in ‘00 ha
Categories 84-85 88-89 93-94 94-95 95-96
Total Geographical area 1,608 (100)
1,608 (100)
1,608 (100)
1,608 (100)
1,608 (100)
Forest 59 (3.66)
59 (3.66)
3 (0.18)
3 (0.18)
3 (0.18)
Land put to non-agri use 4 (0.24)
4 (0.24)
3 (0.18)
3 (0.18)
5 (0.31)
Non Cultivable waste 158
(9.82) 158
(9.82) 52
(3.23) 52
(3.23) 50
(3.10)
Cultivable waste 88 (5.47)
- 198 (12.31)
197 (12.25)
198 (12.31)
Grazing land & pastures 136 (8.45)
136 (8.45)
3 (0.18)
3 (0.18)
7 (0.43)
Land under trees/groves 1 (0.06)
- - - -
Current Fallows 5 (0.31)
291 (18.09)
228 (14.17)
217 (13.49)
211 (13.12)
Other Fallows 125 (7.77)
- 171 (10.63)
143 (8.89)
57 (3.54)
Net Cropped Area 1,032 (64.17)
960 (59.70)
947 (58.89)
986 (61.31)
1,075 (66.85)
Double Cropped Area 50 100 123 129 123
Gross Cropped area 1,072 1,060 1,070 1,116 1,198
Total Cultivable Land 1,251 1,251 1,544 1,543 1,541 Figures in parentheses denote percentages Source: Source:Jilha Samajik va Arthik Samalochan, District Solapur . 1.1990-91 2.1997-98 3.1998-99

35
Table 3.3 : Cropping pattern Malshiras block Area in ha
Crops 1984-85 1988-89 1993-94 1994-95 1995-96
Rice 200 (0.18)
60 (0.06)
50 (0.05)
143 (0.13)
56 (0.05)
Wheat 8,203 (7.58)
400 (0.38)
7,771 (7.26)
9,093 (8.14)
7,772 (6.49)
K.Jowar 322 (0.3)
204 (0.19)
384 (0.36)
372 (0.33)
105 (0.09)
R. Jowar 69,354 (64.1)
69,500 (65.57)
60,642 (56.67)
62,865 (56.28)
69,571 (58.09)
Total Jowar 69,676 (64.4)
69,704 (65.76)
61,026 (57.03)
63,237 (56.62)
69,676 (58.17)
Bajri 1,872 (1.73)
10,600 (10)
9,252 (8.65)
10,251 (9.18)
12,930 (10.8)
Maize 2,263 (2.09)
1,863 (1.76)
-- 3,300 (2.95)
3,672 (3.07)
Other Cereals -- 57 (0.05)
7 (0.01)
81 (0.07)
--
Total Cereals 82,214 (75.99)
82,684 (78.01)
78,490 (73.35)
86,105 (77.09)
94,106 (78.57)
Harbara 2,272 (2.1)
285 (0.27)
1,850 (1.73)
2,828 (2.53)
2,531 (2.11)
Tur 1,059 (0.98)
495 (0.47)
1,287 (1.2)
1,063 (0.95)
731 (0.61)
Mung 442 (0.41)
76 (0.07)
525 (0.49)
14 (0.01)
11 (0.01)
Kulith -- -- -- 429 (0.38)
912 (0.76)
Matki -- -- -- -- 717 (0.6)
Hulga -- -- -- -- --
Other pulses 3,450 (3.19)
6,730 (6.35)
9 (0.01)
21 (0.02)
2 (0.0)
Total Pulses 7,223 (6.68)
7,586 (7.16)
4,948 (4.62)
5,103 (4.57)
4,908 (4.1)
Total food crops 89,437 (82.67)
90,270 (85.17)
83,047 (77.61)
91,208 (81.66)
99,414 (83)
36
Table 3.3 continued
Crops 1984-85 1988-89 1993-94 1994-95 1995-96
Sugarcane 11,652 (10.77)
10,570 (9.97)
13,035 (12.18)
10,796 (9.67)
13,020 (10.87)
Total Spices 92 (0.09)
154 (0.15)
103 (0.1)
94 (0.08)
95 (0.08)
Total Fruit & vegetables
441 (0.41)
1,122 (1.06)
4,194 (3.92)
2,821 (2.53)
2,336 (1.95)
Total edible crops 101,622 (93.93)
102,116 (96.34)
100,379 (93.81)
104,919 (93.90)
114,865 (95.90)
Cotton 1,494 (1.38)
123 (0.12)
215 (0.2)
237 (0.21)
218 (0.18)
Total Fibre crops 1,494 (1.38)
130 (0.12)
348 (0.33)
331 (0.3)
225 (0.19)
Groundnut 1,281 (1.18)
1,673 (1.58)
1,864 (1.74)
1,863 (1.67)
2,033 (1.7)
Jawas -- -- 4 (0.003)
1 (0.0)
1 (0.0)
Kardai 3,777 (3.49)
642 (0.61)
1,626 (1.52)
42 (0.04)
123 (0.1)
Coconut -- -- -- 89 (0.08)
75 (0.06)
Sunflower -- -- -- -- --
Til -- -- -- -- 69 (0.06)
Soyabean -- -- -- -- --
Other oilseeds 16 (0.01)
785 (0.74)
677 (0.63)
-- 1,203 (1)
Total oilseeeds 5,074 (4.69)
3,100 (2.92)
4,683 (4.38)
2,729 (2.44)
3,504 (2.93)
Total medicinal -- -- 4 (0.003)
-- --
Fodder Crops -- 646 (0.61)
1,591 (1.49)
2,390 (2.14)
1,580 (1.32)
Other crops -- -- -- -- --
Total Non-edible crops
6,568 (6.07)
3,876 (3.66)
6,626 (6.19)
5,647 (5.06)
5,309 (4.43)
Gross Cropped Area
108,190 (100)
105,992 (100)
107,005 (100)
111,696 (100)
119,774 (100)
Double cropped area
4,969 10,000 12,281 12,998 12,303
Net cropped area 103,221 95,992 94,724 98,698 107,471 Figures in parentheses denote percentages Source:Jilha Samajik va Arthik Samalochan, District Solapur. 1.1990-91; 2.1997-98; 3.1998-99

37
Table 3.4 : Crop wise Irrigated area for Malshiras block Area in ha
Crops 84-85 88-89 93-94 94-95 95-96
Rice 200 (0.53)
60 (0.17)
5 (0.01)
143 (0.36)
56 (0.12)
Wheat 7,166 (18.93)
348 (0.96)
7,471 (18.67)
7,092 (17.63)
7,772 (16.48)
K.Jowar 259 (0.68)
163 (0.45)
84 (0.21)
72 (0.18)
--
R. Jowar 10,062 (26.58)
9,730 (26.83)
9,143 (22.85)
9,070 (22.55)
14,052 (29.79)
Total Jowar 10,321 (27.27)
9,893 (27.28)
9,227 (23.06)
9,142 (22.73)
14,052 (29.79)
Bajri 1,872 (4.95)
10,600 (29.23)
2,298 (5.74)
6,249 (15.54)
2,930 (6.21)
Maize 1,829 (4.83)
1,490 (4.11)
-- 973 (2.42)
1,372 (2.91)
Nachni -- -- -- -- --
Other Cereals 2 (0.01)
-- -- -- --
Total Cereals 21,390 (56.51)
22,391 (61.75)
18,999 (47.48)
20,599 (51.22)
26,182 (55.51)
Harbara 820 (2.17)
102 (0.28)
850 (2.12)
828 (2.06)
1,531 (3.25)
Tur 521 (1.38)
243 (0.67)
-- 262 (0.65)
531 (1.13)
Mung 142 (0.38)
24 (0.07)
-- -- --
Vatana -- -- -- -- 4 (0.01)
Other Pulses -- -- -- -- --
Total Pulses 1,490 (3.94)
370 (1.02)
850 (2.12)
1,090 (2.71)
2,066 (4.38)
Total Food crops 22,880 (60.45)
22,761 (62.77)
19,849 (49.6)
21,689 (53.93)
28,248 (59.89)
Sugarcane 11,652 (30.78)
10,570 (29.15)
13,035 (32.58)
10,796 (26.84)
13,020 (27.61)

38
Table 3.4 Continued
Crops 84-85 88-89 93-94 94-95 95-96
Total Spices 70 (0.18)
117 (0.32)
103 (0.26)
93 (0.23)
95 (0.2)
Total Fruits 193 (0.51)
78 (0.22)
2879 (7.19)
2701 (6.72)
1426 (3.02)
Total vegetables 268 (0.71)
940 (2.59)
1151 (2.88)
522 (1.3)
460 (0.98)
Total edible crops 35,063 (92.63)
34,466 (95.05)
37,017 (92.51)
35,801 (89.01)
43,249 (91.7)
Cotton 1,494 (3.95)
123 (0.34)
215 (0.54)
237 (0.59)
218 (0.46)
Total Fibre crops 1,494 (3.95)
123 (0.34)
348 (0.87)
331 (0.82)
225 (0.48)
Groundnut 1,281 (3.38)
1,673 (4.61)
1,226 (3.06)
1,883 (4.68)
2,033 (4.31)
Sunflower -- -- 4 (0.01)
560 (1.39)
--
Kardai -- -- -- -- --
Other oilseeds 14 (0.04)
-- 111 (0.28)
89 (0.22)
75 (0.16)
Total oilseeeds 1,295 (3.42)
1,673 (4.61)
1,453 (3.63)
2,545 (6.33)
3,110 (6.59)
Total medicinal -- -- 4 (0.01)
-- --
Fodder Crops -- -- 1,193 (2.98)
1,348 (3.35)
580 (1.23)
Total Non-edible crops
2,789 (7.37)
1,796 (4.95)
2,998 (7.49)
4,419 (10.99)
3,915 (8.3)
Total Irrigated area
37,852 (100)
36,262 (100)
40,015 (100)
40,220 (100)
47,164 (100)
Figures in parentheses denote percentages Source:Jilha Samajik va Arthik Samalochan, District Solapur . 1.1990-91 2.1997-98 3.1998-99

39
Table 3.4a : Crop and source-wise irrigated area for 1998-99 for Malshiras Block Area in ha
Crop Canal Well Total irrigation
(canal and well)
Jowar 10,179 12,949.33 23,128.33
Bajra 2,932.5 7,126.95 10,059.45
Rice 7.4 267.75 275.15
Wheat 4,139.24 5,867.56 10,006.8
Maize 2,491.35 4,925.65 7,417
Other cereals 5,730.92 203.28 5,934.2
Tur 362.64 709.27 1071.91
Harbara 284.59 699.62 984.21
Mung 14.81 8.58 23.39
Hulga -- -- --
Matki -- -- --
Sugarcane 7,313.04 9,859.4 17,172.44
Groundnut 713.37 286.36 999.73
Sunflower 289.78 62.81 352.59
Soyabean 148.67 56.23 204.9
Cotton 509.67 101.92 611.59
Total Fruit and vegetables
-- -- 5,073.24
Source: Tehsil office Malshiras Table 3.5 : Rainfall data
Year Rainfall (mm)
June-Oct 96 412
1997 525
1998 1667
1999 693 Source Panchayat Samiti, Malshiras
40
Table 3.6 : Area irrigated by source for Malshiras Tehsil
Area in ha
Categories 84-85 88-89 93-94 94-95 95-96
Surface irrigated 16,541 22,881 17,732 16,356 15,447
Well Irrigated 17,342 3,381 13,149 14,151 22,414
Net irrigated area 33,883 26,262 30,881 30,507 37,861
Gross irrigated area 37,852 36,262 40,015 40,220 47,164
Gross Cropped area 108,190 105,992 94,724 111,696 119,774
%of gross irrigated area to gross cropped area
34.98 34.21 42.24 36.09 39.38
Source:Jilha Samajik va Arthik Samalochan, District Solapur. 1.1990-91 2.1997-98 3.1998-99 Table 3.6a : Irrigation wells and other wells in Malshiras Block
Category 84-85 88-89
Total no of Irrigated wells 5,345 5,345
No: of Diesel pumps on irrigated wells in use
3,010 160
No: of Electric Motors on irrigated wells in use
2,045 3,075
Source:Jilha Samajik va Arthik Samalochan, District Solapur. 1.1990-91 2.1997-98 3.1998-99

41
Table 3.7 : Total Crop Production and Productivity of Main Crops District Solapur
Crops
90-91 97-98 98-99
Product-ivity/ha in kgs
Total Production (00metric tons)
Product-ivity/ha in kgs
Total Production (00metric tons)
Product-ivity/ha in kgs
Total Production (00metric tons)
Rice 880 44 1,095 23 1,138 33
Wheat 1,067 476 800 379 1,200 851
Jowar 537 3,806 217 1,580 467 2,257
Bajra 383 113 511 115 505 189
Barley 667 2 1,000 1 1,000 1
Maize 1,213 251 1,427 314 1,748 535
Nachni -- -- -- -- -- --
Other Cereals -- -- 500 3 947 89
Total Cereals 580 4,692 294 2,416 624 3,955
Harbara 497 169 352 113 557 286
Tur 243 96 109 29 307 84
Udid 182 4 486 17 443 15
Mung 257 9 333 10 434 17
Masoor -- -- -- -- -- --
Other pulses -- -- 313 61 424 86
Total Pulses 353 398 270 230 462 488
Jawas 219 7 111 1 339 --
Ground-nut 1,688 854 887 196 1,784 --
Til 231 3 217 5 307 --
Sugarcane 85,315 33,017 79,985 43,112 88 5,480
Cotton 1,000 24 282 73 237 --
Mesta (Ambadi)
192 16 180 8 180 --
Tobacco 1,000 1 1,000 1 1,000 --
Ginger -- -- -- -- -- --
Chillies 778 28 794 27 784 --
Turmeric 1,246 896 6,000 1,734 1,351 --
Potato 5,025 201 -- -- -- --
Mohri -- -- 250 1 250 --
Castor -- -- 1,091 12 410 -- Source:Jilha Samajik va Arthik Samalochan, District Solapur 1.[1990-91] 2.[1997-98] 3.[1998-99]

42
Table 3.8 : Cattle Population
Crossbred/Pure breed Cattle
Bullocks above 2.5 years of age
Working bullocks 1,953
Working and breeding purposes 803
Others 582
Total 3,338
Cows above 2.5 years
Milch cows 14,819
Others 7,729
Total cows above 2.5 years 22,548
Cows upto 2.5 years 18,904
Total cows 41,452
Total Pure breed cows and bullocks 44,790
Indigenous Bullocks above 3 years
Working Bullocks 16,461
For breeding and working 950
Others 631
Total 18,042
Indigenous Cows above 3 years
Milk Cows 12,606
Others 9,974
Total Cows 22,580
Indigenous calves below 3 years of age 20,536
Total cows and calves 43,116
Total Indigenous cows and bullocks 61,158
Total Pure breed and Indigenous cows and bullocks
105,948
Source: Jilha Samajik vaArthik samalochan District Solapur1997-98

43
Table 3.8 continued : Other Cattle and Domestic Animals He buffaloes above 3 years
Working 1,255
Others 1,044
Total 2,299
She buffaloes above 3years
Milking Buffaloes 10,777
Others 6,732
Total 17,959
He buffaloes upto 3 years 14,512
Total Buffaloes 34,770
Other Domestic Animals
Sheep 108,889
Goat 105,888
Horses and ponies 564
Other animals 3,323
TOTAL DOMESTIC ANIMALS 359,382
Hens 1,015,540
Total Fowls 1,015,741 Source:Jilha samajik va arthik samalochan, district Solapur, 1997-98 Table 3.9 : Electricity Use For Malshiras Taluka for the year 1999-2000 000kWh
Type of electricity use
Natepute division Akluj division Total
Domestic Connections 11,259 15,819 27,078
Commercial 15,267 2,741 18,008
Industries 302 507 809
Agriculture 14,200 1,327 15,527 Source : Deputy Engineer,MSEB,Malshiras
Table 3.9 a :Total Number of Borewells, Handpumps in use and electric motors
Categories 90-91 97-98
Successful Borewells 1,062 1,707
HandPumps 987 1,644
Electric motors installed 75 100 Source:Jilha Samajik va Arthik Samalochan, District Solapur. 1.1990-91 2.1997-98 3.1998-99
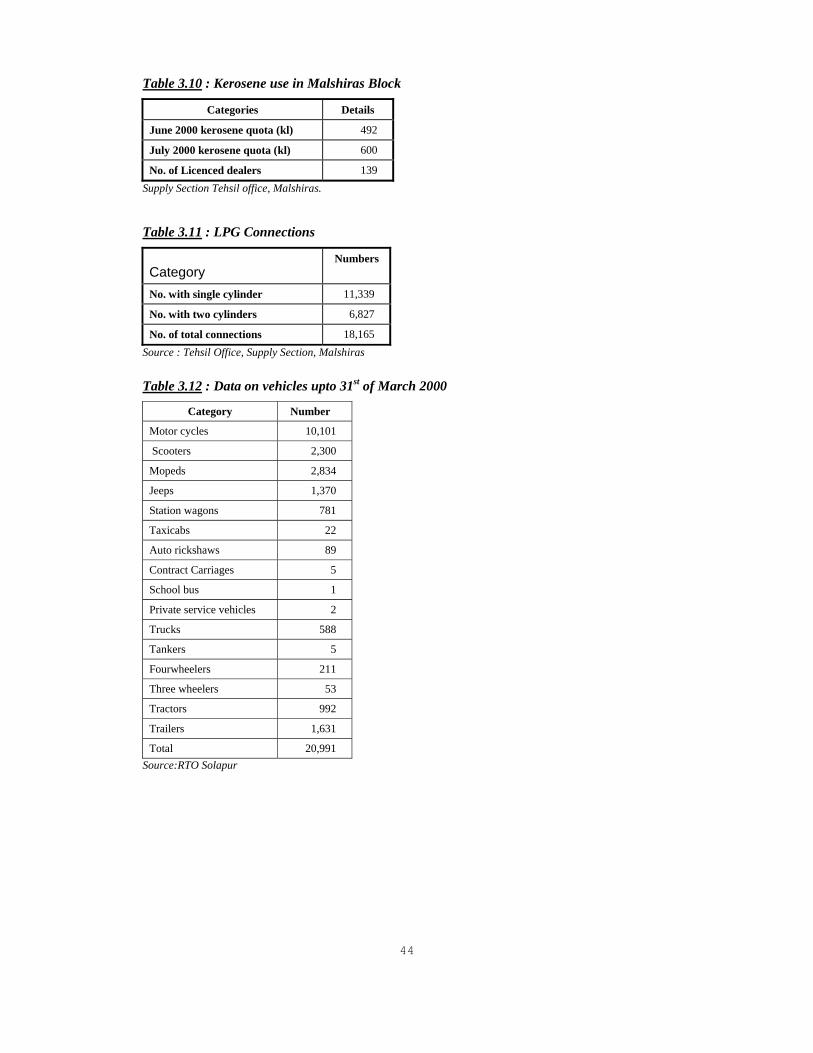
44
Table 3.10 : Kerosene use in Malshiras Block
Categories Details
June 2000 kerosene quota (kl) 492
July 2000 kerosene quota (kl) 600
No. of Licenced dealers 139 Supply Section Tehsil office, Malshiras.
Table 3.11 : LPG Connections
Category Numbers
No. with single cylinder 11,339
No. with two cylinders 6,827
No. of total connections 18,165 Source : Tehsil Office, Supply Section, Malshiras Table 3.12 : Data on vehicles upto 31st of March 2000
Category Number
Motor cycles 10,101
Scooters 2,300
Mopeds 2,834
Jeeps 1,370
Station wagons 781
Taxicabs 22
Auto rickshaws 89
Contract Carriages 5
School bus 1
Private service vehicles 2
Trucks 588
Tankers 5
Fourwheelers 211
Three wheelers 53
Tractors 992
Trailers 1,631
Total 20,991 Source:RTO Solapur

45
Table 3.13 : Rural Agricultural and Non-agricultural Enterprises in Solapur District for the year 1990
Categories Numbers
Total Enterprises
Family based 51,497
Establishments 16,373
Total 67,870
Numbers as per ownership type
Co-operative 1,490
Public sector 6,622
Private 59,758
Source: Jilha Samajik Va arthik Samalochan, Pune District 1997-98
Table 3.14 : Year-wise Distribution of Energy saving devices in Malshiras tehsil
Schemes 95-96 96-97 97-98 98-99 99-2000
Biogas 45 44 64 58 --
Pressure Cookers 96 59 93 23 --
Improved Lanterns 291 1,228 582 1,220 430
Iron Chulhas 1,000 300 -- 35 --
Mud Chulhas -- -- 430 -- -- Source : Panchayat Samiti Agriculture Extension Officer Mr. A B Patil

46
Chapter 4 Methodology and Approach
4.1 Sampling method The purpose of the study is to make an assessment of the energy balance for Malshiras block of
Solapur district. Based on this, projections of an energy scenario for the years 2005 and 2010
would be made. Suggestions for an alternative energy scenario, which would address the
current energy crisis, are to be made. The study included an estimation of the current energy
consumption pattern to understand the energy needs and procurement patterns of the people of
Malshiras block. For this purpose it was important to collect relevant data at various levels.
• At the primary level it is important to look at the energy consumption pattern at
domestic, agricultural, rural industries and artisans levels.
• At the secondary level it is important to look at the available energy sources at
the block level.
• Data collected at the block level is important to make estimations based on the
primary data findings. These estimations will allow us to make projections for
the future energy scenario and suggestions regarding alternatives.
Most of the secondary data is available either at the block or district level or available in the
form of census handbooks or district statistical abstracts. However, the primary data to be
collected from various households and rural enterprises needs a detailed survey. Malshiras
block has 110 villages with a population of about 3,50,000 with the total number of households
being 63,000. It is, therefore, impossible and unnecessary to do a survey of the entire universe,
which comprises of 110 villages. However, a planned sampling methodology that would help
select a representative sample becomes necessary. A two stage sampling procedure was
adopted to select the sample. At the first stage 12 villages were selected through a systematic
stratified random sampling method ensuring that they represent all the features and variations in
the block. At the second stage 25 households from each of the selected villages were selected
again through a systematic stratified random sampling method. Rural establishments that were
studied were selected through a simple random sampling method.
4.2 Selection of sample villages Th following was the process adopted for the selection of the 12 sample villages.
• The first stage was based on a systematic study of the village level census data for
the block from the 1991 Solapur District Census Handbook.

47
• For the second stage the factors that are likely to affect the energy consumption
pattern were listed out and studied. These were as follows:
1. Physiography
2. Forest cover per household
3. Population density
4. Irrigation intensity
5. Per capita cultivated area
6. Cattle population per household
7. Electrification status
8. Distance from urban areas
• Based on the understanding of the above factors and their likely effects on
energy use in the context of Malshiras block two variables were identified as
being the key variables affecting the energy use for the block. These two
variables were:
a) Resource index
b) Proportion of Scheduled Caste population
Resource index The term resource index combines three associated factors affecting rural energy consumption
pattern. These are as follows:
a) Per household availability of forest area
b) Per household availability of cultivated area
c) Per household availability of irrigated area
A resource index indicates the per household availability of forest, cultivated and irrigated area.
The higher the resource index greater is the availability on the above three resources. Single
weightage was given to per household availability of forest area and cultivated area and a
double weightage was given to per household availability of irrigated area.
Based on the above variables, the universe of 110 villages was divided into three classes. These
were A, B & C. The class A ranked low on the resource index while B ranked medium on the
resource index and C was the class of villages with a very high resource index.

48
Proportion of Scheduled Caste Population The second key variable affecting the energy use pattern was considered to be the proportion of
scheduled caste population in the villages. Two classes were formed around this variable --
class A and class B. Class A represented a low proportion of SC population and class B
represented a high proportion of SC population.
• Based on the above classification of resource index and proportion of SC
population the universe of 110 villages was divided into six strata showing the
position of each of the villages on both the variables. The six strata were AA, AB,
CA, CB, BA, and BB. Stratum AA ranked low on the resource index and also low
on the proportion of SC population. AB is low on the resource index but high on
the proportion of SC population. CA ranks very high on the resource index but low
on proportion of SC population. Stratum CB ranks very high on the resource index
as well as the SC population proportion. BA has a medium resource index but is
low on the proportion of SC population. BB ranks medium on resource index and
high on proportion of SC population.
• Within each of the six strata there was homogeneity on the key variables
identified. Table 4.1 gives a detailed listing of all the villages according to the
strata (Table 4.1 and Figure 4.1).
• Simple random sampling method was adopted within each stratum to select the
villages. The sample in each stratum was proportional to the size of that stratum. A
computerised random number was generated to avoid any kind of biases. As can
be seen from Table 4.1, stratum AA comprised of 14 villages from which a single
village was selected. From stratum AB, which comprised of 31 villages, three
villages have been selected. Stratum BA, which has 26 villages, a sample of three
was drawn. BB comprises of 24 villages from which three were chosen for the
sample. One village each was selected from CA and CB, which comprised of 10
and 5 villages respectively. A total sample of 12 villages was thus drawn in a
systematic stratified random sampling method (Table 4.2). The block has 7
revenue divisions referred to as the Circles. The sampling method ensured that the
villages from each of these 7 Circles are chosen to be part of the sample.
• The representativeness of the sample was verified by the following method. The
arithmetic mean and Standard Deviation for selected variables (Table 4.3) was
calculated for the sample villages. The same parameters were calculated for these
variables for the universe, that is, all the villages of the block. The parameters for

49
the sample were found to be comparable with those for the universe for all the
variables.
4.3 Revenue Circles as the category for analysis The block could not be divided into contiguous zones or clusters on the basis of the six strata. It
was seen that all the six strata were spread across the entire block and hence it was difficult to
form clear-cut clusters or zones in the block. The 7 Circles formed for revenue purposes have,
therefore, been used as the basis for presenting and analysing the data.
4.4 Sampling of households This was the second stage in the two stage sampling method. In the first stage 12 villages were
selected out of the universe of 110. In the second stage a certain number of households had to
be selected from these 12 villages. The total number of households from these 12 villages is
6208 and of which about 300 were to be selected. Here too the method of stratified sampling
was adopted. For each of the villages three kinds of lists were obtained. They were as follows:
a) List of all the household in the village
b) List of BPL families
c) List of beneficiaries of MEDA schemes
These three lists were treated as three different strata and simple random sampling method was
used to select households from each of the three lists. It was decided that a 5% sample would be
drawn for the households, which meant a selection of about 25 households per village. It was
decided that a minimum of five households from each of the BPL and beneficiary lists would
be selected leaving the remaining 15 to be selected from the general household list. The sample
households for BPL and MEDA beneficiaries, however, would vary from village to village as
per the total numbers for those categories in each of the villages. As Table 4.4 indicates, of the
total BPL households in the 12 villages selected, 3.06% are part of the sample. Of the total
households for the 12 villages, 5% households form part of the sample. Of the total sample
households, about 24% belong to BPL
4.5 Sampling for rural establishments In the preliminary visits to the selected villages a detailed listing of the establishments in each
of the villages was made. There were about 32 different types of establishments in all these
villages together. These fell in 7 broad categories as per their energy use and requirements.
Simple random sampling was done within each category to select the sample.

50
4.6 Survey process
Questionnaires The stage of preparing the household schedules was completed by end of April. There were
three different kinds of questionnaires that were used for the purpose of the energy survey.
1) The first was the household schedule to be addressed to the individual households.
2) The second set was the schedule to be addressed to beneficiaries of biogas and
improved chulhas.
3) The third was to be addressed to rural establishments.
Household schedule The household schedule could be divided into four sections. The first section comprised of the
socio-economic and demographic profile of the family. The second section included the
information related to agricultural operations and the use of energy. The third section was
related to domestic consumption of energy. This included energy used for cooking and lighting
and related purposes. The fourth section comprised of information on energy saving devices
supplied by MEDA and peoples opinion on the use of these devices. An attempt was made to
address the women of the household specifically for the information related to energy
consumed for domestic purposes. (Annexure 4.1).
Biogas and improved chulha The second set of schedules was addressed to beneficiaries of biogas and improved chulha
schemes implemented by MEDA and the Zilla Parishad. The questions were largely related to
the use and maintenance of the appliances and people's opinions on the use and difficulties for
each of them. Peoples suggestions for improvements were also taken up in this set of schedules
(Annexure 4.1).
Schedule for rural establishments This schedule addressed the energy use in the rural artisanal and establishment sector. The first
part of the schedule dealt with general information related to the establishment, that is,
seasonality of operation, the number of workers, turnover, annual production, etc. The second
section more specifically deals with the tools and equipment used, type of energy use for the
concerned activity, etc. The final section looks at the plans for expansion of the establishment
to assess the likely impact on the energy use (Annexure 4.1).

51
Training of the team The survey process began in the middle of May. A team of 8 people was trained to administer
the schedules in the sample villages of Malshiras block. A one-day training session was
conducted to familiarise the data collection team with the questionnaires and the issues to be
addressed. Mock interviews were conducted during the training programme. This helped the
team to understand the problems they are likely to encounter while administering the schedules.
Actual survey The programme was planned in such a way that one village (25 households) would be covered
in one day. The whole team of 8 people along with two supervisors would go to the village and
complete the data collection by the end of the day and move on to the next village the next day.
Sufficient contacts were established by the supervisors with the gramsevaks, surpanches,
talathis, etc., during their preliminary visits to the area. This facilitated the management of the
programme as per the plan. In each of the villages there would be sufficient preparation before
hand which enabled the team to complete the 25 households in the stipulated time.
The lists of households to be surveyed were prepared well in advance. Hence the main task
after reaching the village was to identify the locations of each of the sample households and
divide the work accordingly. Administering each questionnaire used to take about 40-45
minutes.
Some of the information that could not be covered through the questionnaire was collected
through informal discussions with different people in the village. This was noted down in
diaries given to each of the team members.
Weights and measurements The team members were instructed to write the actual responses of the people for weights and
measures to avoid any subjective interpretation of actual data. These were later converted to
either kgs or quintals based on the required time frame. Two spring balances were given to the
team to take the weights of the fuels used by a household.
Method of fuelwood measurement People's responses for fuelwood used for cooking and heating were largely expressed in terms
of head-loads (bhara, moli) or mann, etc. The responses for those collecting fuelwood from
either commons or own land was expressed in bharas and molis. For those purchasing
fuelwood the responses were expressed in mann which is broadly equivalent to 40 kgs. The
daily consumption of the family was retained as kgs/day and the purchases were converted into
quintals/annum.

52
Method of dung measurement The response for weight of dung was largely expressed in patis. The team was asked to weigh a
pati to get the measure for actual dung collected. This was found to be about 10 kgs. This was
converted into kg/day of dung produced, which was later related to the fodder consumption
pattern of the cattle.
Method of measurement of kerosene Kerosene use was calculated on a monthly basis in litres as that was how people responded.
The monthly ration quota was one way of knowing the possible availability of kerosene with a
household/month.
4.7 Block level data The overall secondary information regarding the demographic characteristics, land use pattern,
cropping pattern, livestock details, irrigation facilities, introduction of energy saving devices,
etc., was largely obtained from various government departments at the block, district as well as
the regional level through published and unpublished reports, census handbooks, personal
information, etc.
4.8 Methodology of assessment The survey findings have been used for estimations at the block level. The seven Circles form
the basis for analysis of the survey findings as well as for all the block level estimations.
• Fuel used for cooking, heating and lighting has been converted into average daily
use in kg/household and also in terms of average annual use in tons/household for
that Circle.
• For agricultural operations the basis has been average values per cropped area for
the concerned Circle. For example use of draught power has been estimated on the
basis of animal hours/cropped area for the Circle. Similarly mechanical power like
tractor and thresher too is estimated on equipment hours/cropped area of that
particular Circle.
• Energy drawn for pumping of water is based on per pump energy drawn in kWh.
• Domestic electrical energy use is based on energy consumed per gadget in kWh for
that Circle. On the basis of total number of gadgets in each Circle an average use
of electrical energy in kWh per household has been calculated for that particular
Circle. The domestic electrical consumption has been calculated taking into
consideration the weekly incidence of power failure as reported by the
respondents.

53
• Dry weights of fodder and dung have been calculated for precision for estimations.
• The incidence of reporting of crop residue as fuel from sugarcane has been very
low. However, during informal group discussions with people it was clear that
residue from sugarcane was used as fuel. Based on these discussions 5% of the
total cane production has been taken as residue used for fuel for that particular
Circle.

54
Table 4.1 : List of villages according to Resource Index Class and SC Population Class
Location code
Village Circle Resource Index Class
SC Popula-
tion Class
Village Area (ha)
No. of house-holds
Total Popula-
tion
Resource Index Class A, SC Population Class A 4 Hanumanwadi NV Dahigaon A A 358.70 145 1,016
36 Purandawade Malshiras A A 707.93 971 4,100 38 Jadhavwadi Malshiras A A 804.80 252 1,684 43 Goradwadi Malshiras A A 1,983.38 386 2,300 52 Zanjevasti(N.V.) Piliv A A 235.00 355 2,160 55 Bacheri Piliv A A 2,577.63 283 1,636 66 Vizori Velapur A A 733.00 401 2,243 72 Dasur Velapur A A 599.00 275 1,474 90 Savatgavhan Akluj A A 447.67 448 2,398 91 Bijwadi* Akluj A A 354.19 166 883
101 Rautgat (N.V) (100) Mahalung A A 816.78 479 2,574 103 Malewadi (N.V.)(102) Mahalung A A 304.12 221 1,276
106 Kondarpatta(N.V.) (107) Mahalung A A 464.00 220 1,092
107 Neware Mahalung A A 957.00 439 2,188

55
Location
code Village Circle Resource
Index Class
SC Popula-
tion Class
Village Area (ha)
No. of house-holds
Total Popula-
tion
Resource Index Class A, SC Population Class B 5 Kurbavi Dahigaon A B 703.34 346 2,121 6 Tambewadi* Dahigaon A B 590.77 264 1,341 7 Ekshiv Dahigaon A B 930.88 691 4,039
16 Gursale Dahigaon A B 1,437.09 705 3,982 17 Dharmpuri Natepute A B 2,188.00 645 3,740 19 Morochi Natepute A B 1,404.09 590 3,554 20 Natepute Natepute A B 2,525.00 2,162 12,285 33 Medad Malshiras A B 1,290.91 666 3,649 34 Malshiras* Malshiras A B 3,544.00 2,722 14,941 35 Yeliv Malshiras A B 415.02 246 1,473 37 Chitalenagar Malshiras A B 495.15 686 3,559 39 Bhamburdi Malshiras A B 1,522.89 594 3,514 44 Mandaki Malshiras A B 924.81 346 2,065 47 Pathanevasti Piliv A B 1,096.73 260 1,407 53 Pilliv Piliv A B 3,029.96 1,198 6,235 70 Malkambi Velapur A B 833.00 416 2,257 73 Bondale Velapur A B 711.00 321 1,497 82 Anandnagar Akluj A B 770.17 466 2,443 83 Bagechiwadi Akluj A B 72.86 530 2,953 84 Girzani Akluj A B 750.00 431 2,553 85 Yashawantnagar Akluj A B 753.00 1,925 9,560 87 Malewadi Akluj A B 1,089.00 643 3,506

56
Location
code Village Circle Resource
Index Class
SC Popula-
tion Class
Village Area (ha)
No. of house-holds
Total Popula-
tion
88 Akluj Akluj A B 1,361.00 5,792 31,432 89 Malinagar Akluj A B 948.13 1,852 9,283 97 Wagholi Mahalung A B 1,050.00 553 2,912 98 Lawang Mahalung A B 1,524.00 860 4,713 99 Mahalung Mahalung A B 3,435.86 3,208 16,486
102 Borgaon Mahalung A B 643.88 947 5,237 104 Mire* Mahalung A B 814.00 315 1,671 108 Jambud Mahalung A B 1,857.00 672 3,766 110 Vijaywadi (N.V.)(65) Velapur A B 335.84 240 1,339
Resource Index Class B, SC Population Class A 9 Bangarde Dahigaon B A 757.10 209 1,469
14 Pirale Dahigaon B A 1,409.44 431 2,512 21 Mandave Natepute B A 3,030.30 782 4,919 22 Pimpari* Natepute B A 2,631.00 364 2,377 23 Kothale Natepute B A 1,766.00 187 1,075 24 Fadtari Natepute B A 3,144.00 477 3,192 25 Londhe Mohitewadi Natepute B A 716.00 161 911 27 Giravi Natepute B A 2,297.04 420 2,451 29 Rede Natepute B A 1,748.19 297 1,653 30 Tamsiwadi Malshiras B A 1,324.67 415 2,712 40 Kanher Malshiras B A 1,699.39 436 2,600 46 Garwad Piliv B A 4,067.54 408 2,522 51 Salmukhwadi* Piliv B A 335.00 64 418

57
Location
code Village Circle Resource
Index Class
SC Popula-
tion Class
Village Area (ha)
No. of house-holds
Total Popula-
tion
Resource Index Class B, SC Population Class A 54 Sulewadi Piliv B A 27.30 370 2,473 57 Kalamawadi Piliv B A 444.00 162 950 59 Kolegaon Piliv B A 1,429.87 633 3,580 62 Zunjewadi Velapur B A 510.91 100 622 63 Dombalwadi Velapur B A 348.80 136 821 67 Pisewadi Velapur B A 1,458.55 394 2,503 77 Tandulwadi Velapur B A 3,484.32 1,143 5,844 79 Tirwandi Akluj B A 3,977.00 423 2,614 80 Chakore* Akluj B A 1,132.00 411 2,121 81 Kondabavi Akluj B A 1,366.00 595 2,848 93 Sangam Akluj B A 1,335.00 370 1,623 96 Ganeshgaon Mahalung B A 442.00 138 848
105 Umbare (Velapur) Mahalung B A 1,250.00 328 1,621 Resource Index Class B, SC Population Class B
1 Shindewadi Dahigaon B B 1,917.13 633 3,420 8 Kalamboli* Dahigaon B B 709.00 238 1,210
12 Kadamwadi Dahigaon B B 352.43 138 836 13 Fondshiras Dahigaon B B 3,040.51 1,142 6,936 18 Karunde* Natepute B B 1,778.02 413 2,456 26 Lonand Natepute B B 2,488.10 339 2,092 28 Bhamb Natepute B B 1,690.90 174 975 32 Umbare Dahigaon Malshiras B B 1,011.00 323 1,971 41 Islampur Malshiras B B 1,419.52 409 2,579
Location
code Village Circle Resource
Index Class
SC Popula-
tion Class
Village Area (ha)
No. of house-holds
Total Popula-
tion
Resource Index Class B, SC Population Class B 48 Nimgaon Piliv B B 4,187.39 1,054 5,667 49 Chandapuri Piliv B B 1,431.00 220 1,337 56 Shingorni Piliv B B 2,658.12 336 2,279 58 Falwani Piliv B B 1,509.62 515 2,689 61 Tarangfal Velapur B B 808.00 328 1,599 64 Khudus Velapur B B 1,936.00 673 3,955 65 Paniv Velapur B B 951.26 366 2,126 68 Velapur Velapur B B 4,592.00 2,206 11,962 75 Dhanore Velapur B B 492.00 187 1,120 76 Maloli Velapur B B 3,367.00 939 5,004

58
Location code
Village Circle Resource Index Class
SC Popula-
tion Class
Village Area (ha)
No. of house-holds
Total Popula-
tion
86 Chaundeshwarwadi Akluj B B 1,031.00 524 2,841 92 Tambave Akluj B B 1,439.00 450 2,739 94 Babulgaon Akluj B B 720.00 280 1,535 95 Wafegaon Mahalung B B 848.00 195 1,065
100 Khandali* Mahalung B B 1,780.44 581 3,437

59
Location
code Village Circle Resource
Index Class
SC Popula-
tion Class
Village Area (ha)
No. of house-holds
Total Popula-
tion
Resource Index Class C, SC Population Class A 2 Deshmukhwadi Dahigaon C A 788.12 181 1,292 3 Dombalwadi Dahigaon C A 777.33 211 1,289
10 Palasmandal Dahigaon C A 1,373.61 256 1,541 11 Motewadi Dahigaon C A 1,709.11 83 511 31 Markadwadi Malshiras C A 1,421.27 295 1,686 45 Jalbhavi Malshiras C A 2,111.00 158 826 50 Kusmod* Piliv C A 2,234.00 254 1,248 60 Shendechinch Piliv C A 680.00 163 895 78 Kacharewadi Akluj C A 1,070.00 247 1,822
109 Vitthalwadi Mahalung C A 563.44 95 538 Resource Index Class C, SC Population Class B
15 Dahigaon Dahigaon C B 4,541.00 1,035 6,634 42 Motewadi Malshiras C B 2,252.81 176 1,082 69 Ughadewadi Velapur C B 1,461.82 406 2,192 71 Khalawe Velapur C B 1,031.00 175 959 74 Tondale* Velapur C B 711.00 146 2,185

60
Table 4.2 : List of villages selected for primary data collection
Sr. No. Name of village Location code Circle 1 Tambewadi 6 Dahigaon 2 Kalamboli 8 Dahigaon 3 Karunde 18 Natepute 4 Pimpari 22 Natepute 5 Malshiras 34 Malshiras 6 Kusmod 50 Piliv 7 Salmukhwadi 51 Piliv 8 Tondale 74 Velapur 9 Chakore 80 Akluj 10 Bijwadi 91 Akluj 11 Khandali 100 Mahalung 12 Mire 104 Mahalung

73
Table 4.3 : Comparison of All Villages and Selected Villages: Selected Indicators
All Villages Selected Villages Difference in Average
as % of range
% difference in Std.
Deviation
Total No. of villages
AverageValue
Std. Deviation
Total No. of villages
AverageValue
Std. Deviation
Geographical Area 157,404.95 110 1,430.95 1,026.71 16,613.42 12 1,384.45 1,015.45 -1.02 -1.10
No. of Households 62,731 110 570 720.51 5,938 12 495 715.01 -1.32 -0.76
Forest area 5,099.03 110 46.35 129.35 494.87 12 41.24 133.90 -0.55 3.52
Irrigated Area 61,300.72 110 557.28 565.41 8,453.17 12 704.43 871.89 4.36 54.21
Unirrigated Area 49,895.36 110 453.59 453.51 4,312.05 12 359.34 369.77 -4.32 -18.47
Culturable Wastes 20,705.73 110 188.23 284.44 1,972.11 12 164.34 207.36 -1.48 -27.10
Area Not Available for Cultivation
20,116.58 110 182.88 246.90 1,648.82 12 137.40 161.30 -4.08 -34.67
Total Population 350,346 110 3,185 3,850.73 34,288 12 2,857 3,891.67 -1.06 1.06
Total Males 182,099 110 1,655 2,014.31 17,966 12 1,497 2,077.63 -0.98 3.14
Total Females 168,247 110 1,530 1,837.27 16,322 12 1,360 1,814.55 -1.14 -1.24
SC -- Males 32,745 110 298 435.61 3,070 12 256 391.55 -1.23 -10.11
SC -- Females 30,596 110 278 399.63 2,865 12 239 343.10 -1.26 -14.14
ST -- Males 924 110 8 30.02 122 12 10 24.51 0.70 -18.36
ST -- Females 877 110 8 27.90 98 12 8 19.73 0.08 -29.28

74
Table 4.4 : List of BPL households
Total Households BPL Households
Circle Name of village
In the village
In the sample
In the village In the sample
Dahigaon Tambewadi 264 25 113 5
Dahigaon Kalamboli 238 23 138 7
Natepute Karunde 413 25 154 5
Natepute Pimpari 364 25 130 0
Malshiras Malshiras 2,722 26 1,259 9
Piliv Kusmod 254 27 0 5
Piliv Salmukhwadi 64 25 57 10
Velapur Tondale 416 26 113 5
Akluj Chakore 411 27 257 5
Akluj Bijwadi 166 26 107 10
Mahalung Khandali 581 26 0 5
Mahalung Mire 315 25 150 10
6,208 306 2,478 76
75
Chapter 5 Survey Findings
5.1 Household profile of the survey households Household profile attempts to contextualise the survey households by giving detailed
information of the households in terms of their demographic profile (which includes household
size, the proportion of Scheduled Caste (SC) and Scheduled Tribe (ST) population, age,
educational status), occupation and non-agricultural income.
Households, population and sex ratio As explained in the chapter on methodology the data of the survey are mainly presented
according to the different Circles in the block. Out of the total sample of 306 households, 53
households are from Akluj Circle, 48 households are from Dahigaon Circle, 51 households are
from Mahalung Circle, 26 households are from Malshiras Circle, 50 households are from
Natepute Circle, 52 households are from Piliv Circle and 26 households are from Velapur
Circle. The total population covered in the survey is 2096. Of this, 1084 are males and 987 are
females, which gives a sex ratio of 911 females for 1000 males (Table 5.1).
Household size Data on household size shows that a vast majority of the sample households, accounting for
more than 85%, fall in the two household size categories of 1 to 5 and 6 to 10. Though the
average family size for all the Circles together is 6.85, there is also considerable variation
between Circles. For example the average family size for Akluj, Malshiras and Dahigaon
Circles comes to 8.28, 7.86 and 7.65 where as in Piliv Circle the average family size is only
6.11 (Table 5.1).
Proportion of SC, ST population The SC and ST population together forms about 15% and out of this SC population alone
accounts for nearly 15.25% of the total population. Thus the ST population is very negligible.
About 85% population falling in the other caste category predominantly includes communities
like Maratha, Mali, Dhangar and Wadar. The proportion of ST population amongst the sample
households is particularly high in Circles like Akluj (25.53%), Mahalung (23.53%) and Velapur
(23.08%) and in Malshiras Circle it is much lower (11.54%) as compared to the all Circles
average (Table 5.2).

76
Age composition About 58% of the population fall in the productive age group of 16 to 60 years. Children up to
the age of 15 account for about 35% and the remaining 7% consists of old people above the age
of 60. In terms of the proportion of people within the age group of 16 to 60 Malshiras ranks the
highest with nearly 63% and Akluj ranks the lowest with about 54%. The data does not show
any significant variation between males and females in terms of age class except in the age
category of above 60 years where 8.12% of the total male population falls in this category
where as only 5.67% of women comes in this age group (Table 5. 3).
Educational status Out of the total population, 12.36% consists of non-school going age group children, 25.41%
are illiterate, 1.29% are neo-literate, 52.53% have studied up to matriculation and 9.11% have
gone above matriculation. The literacy rate is about 72% (if we exclude non-school going age
group children) and about 75% if we consider the entire population which means about 25% are
illiterate. However, there is variation across Circles and more significantly between males and
females. For example in Piliv Circle about 33.5% are illiterate. There is significant variation in
educational status between males and females across the Circles. For example the illiteracy rate
of females is about 33% as compared to about 17% of the males. This variation across Circles
and between males and females could be noticed in the case of higher education also (Table
5.4).
Occupational status Out of the total population, nearly 40% belong to the non-applicable category comprising small
children, students, old people and disabled. Agriculture constitutes the single largest occupation
with about 22% of the responses. Other occupations like agricultural and other wage labour
accounts for about 14%, salaried employment accounts for 2.85% and other types of work
accounts for 3.32%. The artisanal activity is very minimal with about 1% responses. Women,
as in other areas, do a double duty -- housework and agricultural work and/or wage labour.
Data also show that the percentage of people engaged in agriculture is slightly lower in Akluj
and Malshiras Circles as compared to other Circles. This variation is partly taken care of by the
fact that in occupations like salaried employment these Circles report a slightly higher
proportion of people as compared to other Circles. This is very prominent in Malshiras Circle
as salaried employment and other work together account for about 12.5% of the responses. This
to some extent indicates that the respondents from Malshiras and Akluj Circles are at a
comparatively advantageous position in terms of access to non-agricultural occupations. The
data also indicate that the participation of women in occupations like salaried employment,

77
artisanal activities and other type of work with access to cash income are very minimal as
compared to the men (Table 5.5).
Access to non-agricultural income Table 5.6 shows that about 20% of the survey households do not have access to Non-
Agricultural Income (NAI), about 19% of the households get NAI up to Rs. 10,000 per year,
about 25.50% of the households falls in the category of ten to twenty thousand and about 37%
of the households get NAI above Rs. 20,000. The average annual NAI for the reporting
households is about Rs. 24,265. The data indicates that there is significant variation across the
Circles with Circles like Akluj and Malshiras Circles leading in average annual NAI with Rs.
33,233 and Rs. 31,700 respectively. Where as in Piliv Circle the average annual NAI comes to
only Rs.16.040. This also corroborates the earlier observation that Circles like Malshiras and
Akluj are comparatively better placed in terms of non-farm occupations (Table 5.6).
5.2 Land holding, crop pattern and irrigation
Land holding Out of the total sample of 306 households, 103 households (about 33.60%) are landless and this
is particularly high in Malshiras Circle (53.85%). Out of he total number of households, about
7% of the households have less than 0.5 ha holding, about 30% have holdings between 0.5 to 2
ha, 12.75% have holdings between 2 to 4 ha and about 17% of the households have a holding
size above 4 ha. The average size of the holding per family for all the Circles together comes to
2.32 ha. However, the per household landholding reported by Malshiras and Akluj Circles is
only about half of the all Circle average. In terms of average size of the holding Mahalung
Circle seems to be comparatively better placed with 3.77 ha average holding per household
(Table 5.7).
Crop pattern Though there is significant crop diversity amongst the sample households, the major crops are
jowar (23.30% of the cropped area), bajra (19.2%), sugarcane (16.68%), wheat (10.95 %),
pulses (7.18%), fodder crops (5.60%), maize (5.90%) and fruits (3.74%). Some of the other
reported cash crops include cotton (0.85%) and onion (1.62%). The crop pattern for the sample
households shows that about 6.70% of the total cultivated area is kept as fallow as part of the
crop rotation. There is also quite a bit of variation between Circles in relation to the percentage
of area under different crops. For example in the case of Jowar though the all Circle average is
23.30%, in Natepute Circle it is as high as 31.80% and in Dahigaon Circle it is only 13.8%. In
the case of Bajra the data shows a range between 7.31% in Velapur to 29.85% in Piliv Circle.

78
In the case of sugarcane area also there is a wide variation. For example in Piliv and Natepute
Circles the reported area under sugarcane comes to only 1.19% and 2.4% respectively. Whereas
in Circles like Velapur and Mahalung it is as high as 35.7% and 27.5% respectively (Table 5.
8).
Irrigation status For all the seven Circles together the reported cropped area is 609.37 ha and out of this about
60.98% is irrigated. Here it would be noted that the main reason for this high proportion of
irrigated land is that we have included even lands with a couple of waterings during dry spells,
especially in kharif season, in the irrigated category.
The data show that there is also variation between the different Circles in terms of the area
irrigated. For example in Dahigaon and Mahalung Circles the reported irrigated area comes to
about 72.10% and 70.10% respectively. Whereas in Piliv Circle it is only 40.76%. Flow
irrigation by the government canals and lift irrigation from wells is the main mode of irrigation.
The important irrigated crops are jowar (29.97% of the total irrigated area), followed by
sugarcane (27.09%) and wheat (17.55%). Amongst these irrigated crops sugarcane is the most
water intensive crop and thus in terms of water use it would be taking up most of the water that
is used for irrigation (Table 5.8).
5.3 Agricultural biomass production and use The biomass produced on cropland is taken into account here. Biomass in this context includes
everything, say grain, seeds, flowers, stalks, leaves, roots, etc., that are produced on the crop
land and not restricted to the main production, say only grain, which is often associated with
terms like `crop production' or `agricultural production'.
Table 5.9 presents the data related to annual biomass production from crop land and biomass
use for the sample households. The table gives both the main production as well as the residue
which consists of fodder and fuel. Taking all the Circles together, the main production comes to
about 10,707.25 T. Residue used as fodder and fuel comes to about 2,162.23 T and about
355.51 T respectively. However, it should be noted here that the figures for residue do not
denote actual production but use as fodder and fuel. Thus the figures in the table do not indicate
the total availability of residues as a part of the residue is burned in situ. For example the stalks
of crops like bajara, wheat, sugarcane lopping, etc. are very often burned in the field itself.
(Table 5.9)

79
5.4 Trees and biomass utilisation from non-crop land The annual biomass utilisation from non-crop land for the sample households consists of two
main uses, namely, fodder and fuel. The respondents could not estimate use of timber as timber,
mainly used for construction, is extracted only once in a couple of years and does not fall in the
annual cycle. For all the seven Circles together the average per household annual utilisation of
biomass in terms of fodder and fuel from non-crop land comes to about 0.83 T. Out of this, fuel
use accounts for as high a share as 0.50T and fodder use comes to only 0.33T. There is also
quite a bit of variation amongst the Circles in terms of biomass utilisation from non-crop area.
In Velapur and Dahigaon Circles the biomass utilisation comes to only 0.12T and 0.20T
respectively, whereas in Mahalung Circle it comes to about 1.38 T (Table 5.10).
Table 5.11 gives the number of trees owned by the sample households in terms of (a) fodder,
timber and fuel yielding trees, (b) fruit trees (fruit trees which are grown as regular horticulture
crops are not included in this), and (c) other trees like ornamental plants, etc.
5.5 Animal composition, fodder and feed consumption and dung production
Animal composition The data related to the animals owned by sample households is presented in Table 5.12. In the
table we have given both the total number of each of the animals for each Circle as well as the
number of animal units. We have tried to standardise animals owned by the sample households
by working out the number of animal units for each Circle by using the same norms as given in
MANAGE Manual on Watershed Development.
The table shows that the all the sample households together own 1,216 animal units and per
household it comes to 3.97 animal units. However, the data also shows certain variation across
the Circles. At one end of the range we have Malshiras Circle with only 2.36 animal units per
household and on the other end we have Akluj, Velapur and Dahigaon Circles with 4.47, 4.43
and 4.21 animal units respectively. The major reason for this seems to be that the proportion of
crossbred milch cows is much higher in these Circles as compared to other Circles. This
becomes clearer in the discussion below about the animal composition for each Circle.
In terms of composition of the animal units the data shows that for all the sample households
together the single largest category is crossbred milch cows which accounts for 417.50 animal
units (about 34%), followed by milch buffaloes (17.85%) and bullocks (about 11%). The data
also very clearly show that the incidence of small ruminants like goat and sheep is very
marginal.

80
There are also some variations in the animal composition of the seven Circles. Though in
almost all Circles with the exception of Mahalung Circle, the proportion of crossbred milch
cows is higher than the other animals, this proportion is particularly high in Circles like Akluj
and Dahigaon.
Fodder and feed consumption Table 5.13 gives the data related to annual fodder and feed consumption for the sample
households according to Circles. The table gives both the gross weight (wet weight) and dry
weight for green fodder, dry fodder and animal feeds and concentrates. The annual per animal
unit consumption of green fodder, dry fodder and feeds and concentrates have been also
worked out in the table. Taking all the Circles together the annual per animal unit consumption
(in terms of dry weight) of green fodder comes to 0.41 T, dry fodder comes to 0.34 T and the
consumption of feeds and concentrates comes to 0.15 T. One of the significant variations
between Circles is that in terms of the consumption of feeds and concentrates in Mahalung
Circle where the per animal unit consumption is as low as 0.08 T. In the rest of the Circles there
is very little variation in terms of consumption of animal feed.. There seems to be little
variation across Circles in the green fodder and dry fodder consumption per animal unit. The
green fodder consumption mentioned here does not include the free grazing component. During
the data collection it has been observed that green fodder is generally given in the four
monsoon months of the year.
Dung Production The annual dung production per animal unit is also shown in the same table. The data across
Circles do not show much variation and this is in line with little variation in fodder
consumption pattern across Circles. In terms of dry weight the average per animal unit dung
production for all Circles is 0.45. The variation across Circles is not very high. The range is
between 0.36 in Piliv to 0.53 in Mahalung.
5.6 Use of draught power Draught power used by sample households has been estimated for the two basic agricultural
operations and as a means of transport (Table 5.14). The survey has shown that no draught
power is used amongst the sample households for lifting water. The table also gives the average
number of animal days per ha cropped area and also the division between owned and rented
animals supplying draught power out of the total draught power used.
The total draught power used per ha cropped area for all the Circles together comes to about 22
animal days in a year. Out of this about 69.77% of the draught power is used for agricultural
operations, primarily tilling of the land. Thus the use of draught power as a means of transport

81
is very negligible. The data clearly indicate that most of the draught power used by the sample
households (about 69.2% of the total number animal days used per ha cropped area) is owned
by them.
The above mentioned table shows certain variations between the Circles. For example the
number of animal days used per ha cropped area is 30.23 animal days for Natepute which is
nearly double that of Akluj Circle where it is only 16.32 animal days per ha cropped area. One
reason for this is that the sample households in Natepute (Table 5.12) are much better placed as
compared to other Circles in terms of the bullocks that they own. The second reason is that
there is much more mechanisation in the agricultural operations in the other Circles especially
in Akluj. This would become clear from the data presented in the next table on annual use of
mechanical equipment for the sample households.
5.7 Use of mechanical power The major mechanical equipment considered here is tractors and threshers. Table 5.15 gives
details of the number of tractors owned by the sample households, the number of hours of
tractor use for agricultural operations and for transport, and the number of hours of thresher
use. It also gives data about the average values per ha cropped area. The use of mechanical
power is estimated in terms of equipment hours.
The sample households have reported that they own 23 tractors. All the 23 tractors together use
709 hours for agricultural operations and per ha cropped area use of this comes to 1 hour. The
respondents have also reported a total of about 867 hours as rented in, which comes to 1.22
hours per ha cropped area. The data also show that the use of tractors for transport is on par
with use for agricultural operations. About 1,413 hours of thresher use is reported. Of this 98
hours is owned and the rest is rented. There are 14 threshers owned in the area. The table also
brings out the Circle-wise variation in mechanical power use. Piliv and Velapur Circles do not
report any ownership of tractor.
5.8 Annual pumping energy Table 5.16 gives the annual pumping energy for the sample households. It has details like the
number of pumpsets owned, capacity of the pumpsets, annual hours of use and the energy used.
Data for electrical pumpsets diesel pumpsets are given separately. Based on this data, the per
pumpset use has been estimated.
From the table it is very clear that the use of diesel pumpsets is very minimal (about 5,120
hours of use and 18667.90 kWh energy use) as compared to electric pumpsets (12,1230 hours
of use and 469275.28 kWh energy use). The table also shows the variations between the
Circles. For example Akluj, which is the most prosperous Circle, reports 24,857 annual hours
82
of use and Piliv reports only 6,069 annual hours of use. The higher use of pumping energy can
be clearly seen in sugarcane growing areas. The total number of electric pumpsets owned in all
the Circles is 163. The average per pump hours of use for all Circles is 743.74 and the total
energy use per pump amounts to 2,878.98 kWh
5.9 Domestic non-electrical fuel use The data regarding the domestic non-electrical fuel use are presented in terms of daily domestic
fuel use for sample households, annual domestic fuel use, fuel value of daily domestic fuel
used, and delivered heat of daily domestic fuel used. Use of electricity is treated separately and
given later.
Daily domestic fuel use The non-electrical fuels reported are firewood, dungcake, kerosene, LPG, vegetable oil, biogas
and coal. Table 5.17 gives data about the daily Circle-wise use of each of these fuels and also
the per household use for each Circle. Domestic use includes cooking, heating bathing water
and lighting. The daily use of LPG is very minimal (0.03 kg/household) The respondents have
reported that kerosene is used for cooking, heating bath water and lighting. Similarly firewood
and dungcake are used for cooking and heating bath water. The data show that the major non-
electrical fuels used for domestic uses are firewood (8.9 kg per household per day) and
dungcake (0.57 kg per household per day). It can be seen that Malshiras reports a higher use of
kerosene (0.34) as compared to the other Circles, which use kerosene in the range of 0.15 to
0.21 per day. This can easily be explained by the fact that there is much more availability of
kerosene in town like villages. The reach of biogas plants seems to be the highest in Akluj
Circle [0.60 Nm3/household as compared to Mahalung where it is only 0.21 Nm3] (Table
5.17). Table 5.17 a shows the per capita use of domestic fuel which essentially reflects the
explanations given above.
Annual domestic fuel use Table 5.17 b estimates the annual domestic fuel use for each of the fuels according to Circles.
The table also gives the annual per household use of these fuels. The annual per household
domestic use comes to 3.25 T of firewood, 0.21 T of dungcake, 0.07 kl of kerosene, 0.01 T of
LPG, and 0.08 Nm3 of biogas. (Table 5.17b). For he annual domestic per capita fuel use see
table 5.17c.
Fuel value of Annual domestic fuel used Table 5.18 gives the estimated fuel value for all the fuels that are used as domestic fuels. The
daily per capita fuel value for all the fuels together comes to 2,12,9170 kcal and there does not

83
seem to be much of variation across the Circles The table clearly brings out that in terms of fuel
value firewood continues to be the main provider of domestic fuel as it provides 18,97,370 kcal
(per capita per day) which comes to about 89% of the total fuel value. Then comes dungcake
and kerosene with values of 76,500 kcal (3.59%) and 86,260 kcal (5.03%) respectively.
Delivered heat of annual domestic fuel used Table 5.19 presents the estimated delivered heat for different fuels, which also shows the
relative efficiency of these fuels. The table shows that out of the total delivered heat of 27,8490
kcal/capita 18,9740 kcal (about 68%) comes from firewood, 38,820 kcal (about 13.9% from
kerosene, 31,040 kcal (about 11.1%) from biogas and 7,650 kcal (about 2.7%) comes from
dungcake. Thus from the point of view of delivered heat the role of dungcake is very marginal.
(Table 5.19)
5.10 Annual flows and balances
Green fodder balance for the sample households The estimated annual green fodder balance for the sample households is given in Table 5.20.
The table gives Circle-wise details of the green fodder consumption and the quantum of green
fodder procured from different sources. The table also gives the estimated shortfall, which is
collected from the commons. Thus the table tries to estimate the extent of the pressure on
commons to meet the green fodder requirement of the sample households.
For all the Circles taken together the annual consumption of green fodder for total animal units
comes to 997.27 T. There is no shortfall which means that green fodder needs are met from
owned lands and that there is no dependence on the commons for green fodder. There seems to
be a surplus in the availability of green fodder. The reason why this sort of a picture emerges is
because the availability of commons too is not very high in this region. Only Akluj, Natepute
and Piliv Circles seem to depend on the commons to meet there green fodder needs. The table
also gives average values per animal unit for the Circles (Table 5.20).
Dry fodder balance for the sample households Table 5.21 shows that in terms of dry fodder requirement the sample households do not depend
on the commons. This means that the needs are met form fodder, which is either purchased, or
that which is available as crop residue and from non-crop land. Of the total fodder, fodder from
crop residue forms the largest share. The table shows that there is no shortfall in procuring dry
fodder and in fact there seems to be a surplus in the dry fodder balance.(Table 5.22)
84
Annual free grazing component Since reliable data cannot be obtained directly from the respondents about the free grazing
component, we have tried to make an estimate of this component by making an estimation of
the total fodder and feed consumption required for production of the dung, which is reported by
the sample households. Since we already know the fodder component, which is collected or
procured by the sample households, we could estimate the shortfall, which is taken to have
come from free grazing.
Table 5.22 shows that the annual dung production reported by the sample households is about
1,351.34 T (and about 540 T dry weight). To produce this the estimated fodder required is
about 1,351 T (dry weight). The total collected/procured green fodder, dry fodder and feed and
concentrates together account for about 1,082.28 T (dry weight) which comes to about 80% of
the estimated fodder consumption. Thus the remaining fodder of about 269 T (about 20%)
comes as the free grazing component. (Table 5.22)
Annual dung use for the sample households Table 5.23 gives the details related to the various uses of dung. Since we know what is the total
dung produced and the quantum of dung used for making dungcake and use in biogas plants it
has been possible to estimate the quantum of dung used as manure. The table shows that out of
the 540 T (dry weight) dung produced, about 65.14 T (about 11.8%) is used for making
dungcake, about 42.47 T is used for biogas (about 7.8%) and the remaining 433.73 T (about
80%) dung is used as manure (Table 5.23).
Annual firewood balance for the sample households Table 5.24 gives the estimated firewood collection from commons and forests. For all the
Circles together the annual firewood consumption is about 995.22 T and firewood procured
from non-crop land, crop residues used as firewood and firewood purchased all add up to about
985.01 T (about 98% of the total consumption). Thus the estimated firewood collected from
commons and forests come to about 8.17 T (dry weight) which is about 2% of the total
firewood consumption. This means that there is very little pressure on the commons for
meeting firewood needs. The table does not show much variation across Circles. Natepute
Circle seems to extract the largest share from the commons of all the Circles.
5.11 Domestic electricity use Out of the total 306 sample households, 104 households (33.9%) have reported that they do not
have electricity connection. Piliv and Akluj Circles account for the highest number of houses
without electric connections. (Table 5.25). The high incidence of reporting of no electricity in
households seems to be largely due to the fact that there was under reporting by the

85
respondents. The data collection team observed during data collection that people were using
various kinds of electrical equipment and yet reporting for no electric connection.
Table 5.26 gives a detailed account of all the electrical equipment and gadgets used by the
sample households. The details include number of each equipment, total wattage and annual
electricity use according to Circles. Out of the total 10,3,950.89 kWh annual electricity use for
all the sample households together, bulbs account for as much as 55.8%, followed by TV's
(13.67%) fans (7.82%), refrigerators (5.41%) electric stoves (5.43%) and tube lights (5.36%).
The use of other electric gadgets like energy saving lamps, irons, radios, electric stoves, fans,
mixers, etc. is very minimal. Out of the total domestic electricity use, lighting accounts for
about 60.17%. In Akluj Circle the annual electricity use per household is 367 kWh. There does
not seem to be a very wide variation between Circles. The total annual electricity use per
household amounts to 339 kWh.
5.12 Use of pressure cookers, biogas plants and improved chulhas Table 5.27 gives village-wise data with regard to pressure cookers, biogas plants and improved
chulhas in the sample households. According to this table there are 70 pressure cookers, 25
biogas plants and 10 improved chulhas in the sample households. Velapur and Akluj Circles do
not report any Improved chulhas.
Status of biogas plants Out of the total number of 26 biogas plants, 15 plants are in use. The 15 plants (out of the total
26) which have reported a capacity have a combined capacity of 125.5 Nm3. The reported cost
of bringing the 11 plants not in use to use is Rs. 31,000. Out of this the users are ready to bear
Rs. 11,200 which comes to about 36% of the expected cost (Table 5.28).
Status of improved chulhas The total number of improved chulhas reported are 10 and of these 4 are in use (Table 5.29).
The user response to improved chulhas in terms of change in smoke, change in fuel use and
change in cooking time on a 5 point scale of large increase, small increase, no change, small
decrease, and large decrease is presented in Table 5.30. This table shows that out of the 4
chulhas, which are in use, all have responded to the user response. On the question of change in
smoke, 1 has marked large decrease in smoke, 2 have marked small decrease, and 1 has opted
for large increase. When it comes to change in fuel use, there is one response for large increase,
1 for small decrease, one for no change and one for small increase. Responses to change in
cooking time shows that two have opted for large decrease, 1 has opted for small decrease and

86
one for large increase. Overall one can say from these responses that majority of them feel that
there has been decrease in smoke, in fuel use and in cooking time.
The respondents have also reported some of the problems associated with the improved chulhas
and which have contributed for their disuse. Some of these problems include (a) firewood has
to be small in size, (b) the mouth of the chulha is too large, (c) the stand is broken, (d)
inadequate information on its use, (e) the stove was not fixed properly, (f) not sufficient for the
cooking needs of the family, and (g) increase in the consumption of firewood.
5.13 Status and use pattern of the MEDA energy saving devices used in the sample households Table 5.31 gives the status of the various energy saving devices like improved lantern, pressure
cooker, solar cooker, energy saving lamp, wick stove and solar batteries. The table gives Circle
wise data about the total number of each of the gadgets and the number in use. There are no
solar cookers reported amongst the sample households. Out of total number, only one energy
saving device has been reported in the sample households and that is in use. The table shows
that in the sample households there has been a very limited reach of the MEDA schemes. The
selection of sample households and villages was done through a stratified random sampling
method. The sample was also tested for its representativeness. This therefore indicates that the
reach of the MEDA schemes in Malshiras block has been very limited and this was
corroborated by people’s response during the survey. It was seen that people were not very
satisfied with the mode of operation of distribution of MEDA schemes. People’s main
complaint was that the schemes should come through the Gram Panchayat rather than through
the Panchayat Samiti as is currently done.(Table 5.31).The use pattern of these gadgets is given
in Table 5.32. According to this table, out of the 3 improved lanterns in use, 2 are used only
when there is electricity failure. Only 1 is reported to be in constant use. In the case of the other
gadgets all the ones in use are in constant use.
5.14 Perception of the respondents to energy saving devices and energy use
Use of pressure cookers A vast majority of the respondents do not own pressure cookers. Non-affordability is quoted as
the main reason for not using pressure cookers. Many have also said that they have not bought
cookers because they do not know how to use them. A few of the non-users have also given
reasons like (a) they have not felt the need for pressure cookers, (b) they feel afraid to use them,
and (c) they do not know anything about them and (d) they do not see the need for using
pressure cookers.

87
Suggestions about energy efficient devices As expected a vast majority of the respondents have said that the government should increase
the subsidy component of the schemes (in their words they should get economic help from the
government) so that many more people would start using devices like improved chulhas,
biogas, lanterns, solar cookers, etc. Most of them also suggested that the distribution of these
devices should not be limited to only those who live in the main village; but should be
distributed in the wadis also. Most of them also felt that the government officials are corrupt
and hence there are irregularities in distribution. They also felt that a wider spread of energy
saving devices would ultimately save energy. Many others felt that the information should
reach the people in all the wadis and vastis. The use of solar energy should also be propagated.
A few of the respondents felt that the cost of these devices should be reduced. The schemes
should not reach only the few leaders of the village. Propagation of solar energy should also be
made in order to save energy.
Responses and suggestions with regard to the MEDA schemes Most of the respondents expressed the need to get detailed and correct information about
MEDA schemes. The respondents from the remote villages in the block complained that these
schemes do not get implemented in these areas. Many of them also complained about the delay
in getting the government schemes sanctioned. Generally there is a perception among the
people that any government scheme, and MEDA schemes are not exceptions to this, takes an
enormous amount of time to get it sanctioned. Another reaction to these schemes was that very
often these schemes got monopolised by the richer and influential sections of the village and
the needy and poorer people do not get the benefits of these schemes. Hence many of them
pointed out the need to make these schemes affordable to the poorer sections in the rural areas.
There were also isolated responses like community biogas schemes based on night soil should
be introduced in the villages
Some of the responses were of very general nature like (a) the government machinery is very
corrupt and because of this it is very difficult to get these schemes sanctioned, (b) the
politicians do not allow the schemes to reach the needy people, and (c) the government officials
do not provide sufficient information about these schemes to the people.
Suggestions to solve the energy problem: Invariably almost all the respondents have complained against the frequent power breakdowns
and failures and have very strongly expressed the need for continuous power supply and that
too without much of voltage fluctuations. Another equally important suggestion is about
kerosene. Most of the respondents have very strongly expressed their view that they should get

88
access to different schemes coming under MEDA. Sufficient quantities of kerosene through the
public distribution system should be given and that too at an affordable cost. Their suggestion
was that government should provide for saplings to enhance the biomass plantation they also
suggested that the government should increase the kerosene quota.
The suggestions and responses of the respondents also show that most of them are aware of the
energy problem. In fact, many of them have given suggestions to overcome the energy crisis
and some of these suggestions include (a) the dependence on firewood could be reduced if the
government makes arrangements for more number of biogas plants in the rural areas so that
more and more people switch to biogas for cooking and this would arrest the depletion of
forests, (b) the government should supply more number of devices which run on solar energy at
an affordable cost so that there would be saving of firewood, kerosene, etc., (though one
respondent has mentioned that solar devices may not work in this block because of climatic
reasons), (c) LPG cylinders should be provided which would also help in reducing the use of
firewood, (d) there should be systematic efforts at afforestation, (e) people should be educated
as to how to efficiently use fuels and thus save on them.(f) energy problem at the village level
can be solved by collecting and storing more cowdung and fuelwood and the Gram Panchayat
should make the necessary arrangements or design appropriate schemes for this and implement
them, and (g) government should provide subsidy for distribution of saplings and take up
plantation programmes.
5.15 Village establishments and their energy use
Type of establishments Table 5.33 gives the number of establishments under each category or type of establishment in
the selected villages and in the sample for survey. The types of establishments are broadly
classified into seven categories, namely, artisanal establishments, brick kilns, flour and masala
mill food products, small industrial establishments, poultry and goatery, and shops and other
small establishments. Artisanal establishments include kumhar, lohar, handloom, etc. Food
products would include teashops and hotels, sugarcane and other juice joints, bakeries, etc.
Establishments like fabrication units, garage, tailoring shops, etc. are grouped together under
small industrial establishments. The last category of shops and small establishments includes
provision shops, schools, offices of the gram panchayat cooperative society, clinics (PHCs),
post office, balwadi, bank, etc. According to this table out of the 762 total establishments
reported in the sample villages, 68 have been included in the survey sample, which comes to
nearly 8.9%.

89
Employment pattern in sample establishments Table 5.34 gives the employment pattern existing in the sample establishments. The data give
details like whether the employment is of permanent nature or temporary and in each of them
what is the division between household members and non-household members. The table gives
number of persons and person days for each of the type of establishment. This table is helpful
to understand the seasonality of the operations (whether the establishment operates through out
the year or only for a number of months in the year) and also to some extent the size or
quantum of operations.
Annual fuel (non-electrical) use in sample establishments Table 5.35 gives the details of annual fuel use by different types of establishments. The fuel use
is also given as per different fuel sources like coal, diesel, firewood, crop residue, dungcake,
LPG and kerosene. The reported annual coal use is about 1.69 T and nearly most of it (1.63 T)
is used by brick kilns. The reported annual diesel use is of 21.9 kliters and shops and small
establishments use all of it. About 206.98 T of firewood is annually used and almost 77% of it
is used by artisanal establishments like the kumhars, lohars etc. and 16.9% is used by
establishments which cover food products, basically bakeries. Brick kilns account for the entire
crop residue (15 T) used as fuel. The table shows that the use of LPG is very marginal. Out of
the 5.9 kl kerosene that is used for establishments a high share goes into flour and masala mills.
Fuel value of annual fuel use The fuel value of the different fuel uses for the sample establishments is given Table 5.36. In
terms of the fuel value firewood accounts for the highest use of 8,27,920 (‘000 kcal), followed
by dungcake 2,89,500 (‘000 kcal), and diesel 1,75,296 (‘000 kcal) in that order . The other
fuels like coal and LPG are quite marginal in terms of their fuel value in terms of their
proportionate share in the total fuel value used by the sample establishments.
Annual electricity use in sample establishments The total electricity use of all the sample establishments together in a year comes to about
1,15,040 kWh. Out of this, flour and masala mills account for about 50% of the total electricity
use, followed by shops and establishments, which account for about 33% and small industrial
establishments which accounts for 8.8%. The electricity consumption of all other types of
establishments is quite marginal. In terms of type of equipment, motors account for about 63%
of the total electricity use, followed by bulbs (11.45%), and fans (7.7%). Electricity used by
other gadgets like CFL, TVs, refrigerators, tape recorders, battery chargers and blacksmith
grinders is not very significant (Table 5.37)

92
Table 5.1 : Demographic profile of sample households according to household size and circles
Circle Hh size 1 to 5 Hh size 11 and above Hh size 6 to 10 Total
No. of Hh Males Females Total No. of Hh Males Females Total No. of Hh Males Females Total No. of Hh Males Females Total
Akluj 14 37 25 62 26 98 94 192 13 99 86 185 53 234 205 439
(26.42) (15.81) (12.20) (14.12) (49.06) (41.88) (45.85) (43.74) (24.53) (42.31) (41.95) (42.14) (100.00) (100.00) (100.00) (100.00)
Dahigaon 19 42 35 77 18 70 62 132 11 79 79 158 48 191 176 367
(39.58) (21.99) (19.89) (20.98) (37.50) (36.65) (35.23) (35.97) (22.92) (41.36) (44.89) (43.05) (100.00) (100.00) (100.00) (100.00)
Mahalung 31 76 54 132 13 49 41 90 7 47 45 92 51 172 140 314
(60.78) (44.19) (38.57) (42.04) (25.49) (28.49) (29.29) (28.66) (13.73) (27.33) (32.14) (29.30) (100.00) (100.00) (100.00) (100.00)
Malshiras 15 33 32 65 10 35 39 74 1 8 12 20 26 76 83 159
(57.69) (43.42) (38.55) (40.88) (38.46) (46.05) (46.99) (46.54) (3.85) (10.53) (14.46) (12.58) (100.00) (100.00) (100.00) (100.00)
Natepute 19 44 36 80 23 86 79 165 8 69 59 148 50 199 174 393
(38.00) (22.11) (20.69) (20.36) (46.00) (43.22) (45.40) (41.98) (16.00) (34.67) (33.91) (37.66) (100.00) (100.00) (100.00) (100.00)
Piliv 31 55 56 113 20 64 76 140 1 7 5 12 52 126 137 265
(59.62) (43.65) (40.88) (42.64) (38.46) (50.79) (55.47) (52.83) (1.92) (5.56) (3.65) (4.53) (100.00) (100.00) (100.00) (100.00)
Velapur 14 37 24 62 9 28 33 61 3 21 15 36 26 86 72 159
(53.85) (43.02) (33.33) (38.99) (34.62) (32.56) (45.83) (38.36) (11.54) (24.42) (20.83) (22.64) (100.00) (100.00) (100.00) (100.00)
Total 143 324 262 591 119 430 424 854 44 330 301 651 306 1084 987 2096
(46.73) (29.89) (26.55) (28.20) (38.89) (39.67) (42.96) (40.74) (14.38) (30.44) (30.50) (31.06) (100.00) (100.00) (100.00) (100.00)
Figures in parentheses denote percentages.
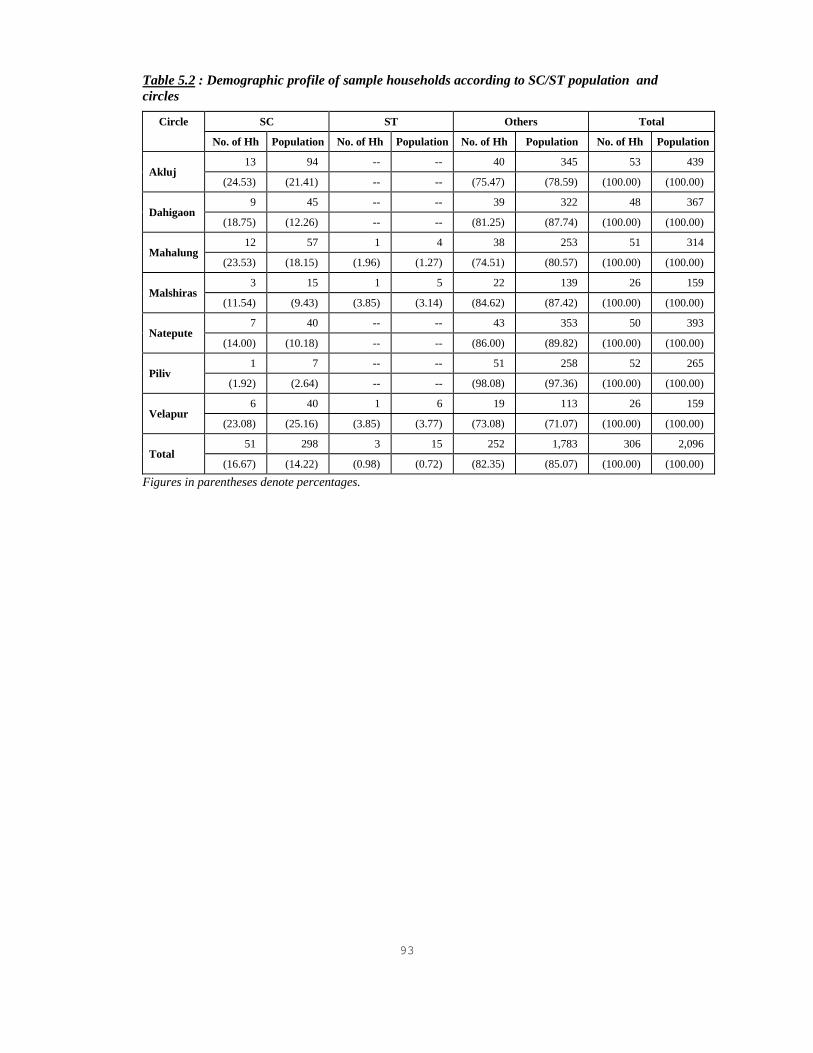
93
Table 5.2 : Demographic profile of sample households according to SC/ST population and circles
Circle SC ST Others Total
No. of Hh Population No. of Hh Population No. of Hh Population No. of Hh Population
Akluj 13 94 -- -- 40 345 53 439
(24.53) (21.41) -- -- (75.47) (78.59) (100.00) (100.00)
Dahigaon 9 45 -- -- 39 322 48 367
(18.75) (12.26) -- -- (81.25) (87.74) (100.00) (100.00)
Mahalung 12 57 1 4 38 253 51 314
(23.53) (18.15) (1.96) (1.27) (74.51) (80.57) (100.00) (100.00)
Malshiras 3 15 1 5 22 139 26 159
(11.54) (9.43) (3.85) (3.14) (84.62) (87.42) (100.00) (100.00)
Natepute 7 40 -- -- 43 353 50 393
(14.00) (10.18) -- -- (86.00) (89.82) (100.00) (100.00)
Piliv 1 7 -- -- 51 258 52 265
(1.92) (2.64) -- -- (98.08) (97.36) (100.00) (100.00)
Velapur 6 40 1 6 19 113 26 159
(23.08) (25.16) (3.85) (3.77) (73.08) (71.07) (100.00) (100.00)
Total 51 298 3 15 252 1,783 306 2,096
(16.67) (14.22) (0.98) (0.72) (82.35) (85.07) (100.00) (100.00) Figures in parentheses denote percentages.

94
Table 5.3 : Demographic profile of sample households according to age and zones
Circle Age above 60 Age between 16 and 60 Age less than 15 Total
Males Females Total Males Females Total Males Females Total Males Females Total
Akluj 25 9 34 125 111 236 84 85 169 234 205 439
(10.68) (4.39) (7.74) (53.42) (54.15) (53.76) (35.90) (41.46) (38.50) (100.00) (100.00) (100.00)
Dahigaon 13 7 20 115.00 107 222 63 62 125 191 176 367
(6.81) (3.98) (5.45) (60.21) (60.80) (60.49) (32.98) (35.23) (34.06) (100.00) (100.00) (100.00)
Mahalung 10 5 15 100 86 186 62 49 113 172 140 314
(5.81) (3.57) (4.78) (58.14) (61.43) (59.24) (36.05) (35.00) (35.99) (100.00) (100.00) (100.00)
Malshiras 6 7 13 48 52 100 22 24 46 76 83 159
(7.89) (8.43) (8.18) (63.16) (62.65) (62.89) (28.95) (28.92) (28.93) (100.00) (100.00) (100.00)
Natepute 16 15 31 109 98 217 74 61 145 199 174 393
(8.04) (8.62) (7.89) (54.77) (56.32) (55.22) (37.19) (35.06) (36.90) (100.00) (100.00) (100.00)
Piliv 10 7 17 77 80 159 39 50 89 126 137 265
(7.94) (5.11) (6.42) (61.11) (58.39) (60.00) (30.95) (36.50) (33.58) (100.00) (100.00) (100.00)
Velapur 8 6 14 54 43 98 24 23 47 86 72 159
(9.30) (8.33) (8.81) (62.79) (59.72) (61.64) (27.91) (31.94) (29.56) (100.00) (100.00) (100.00)
Total 88 56 144 628 577 1218 368 354 734 1084 987 2096
(8.12) (5.67) (6.87) (57.93) (58.46) (58.11) (33.95) (35.87) (35.02) (100.00) (100.00) (100.00) Figures in parentheses denote percentages.

95
Table 5.4 : Demographic profile of sample households according to educational status
Circle Illiterate Neo-literate Educated up to matriculation
Eleventh and above Not Applicable Total
M F T M F T M F T M F T M F T M F T
Akluj 39 62 101 3 3 6 130 99 229 33 9 42 29 32 61 234 205 439
(16.67) (30.24) (23.01) (1.28) (1.46) (1.37) (55.56) (48.29) (52.16) (14.10) (4.39) (9.57) (12.39) (15.61) (13.90) (100) (100) (100)
Dahigaon
25 54 79 1 2 3 118 87 205 23 5 28 24 28 52 191 176 367 (13.09) (30.68) (21.53) (0.52) (1.14) (0.82) (61.78) (49.43) (55.86) (12.04) (2.84) (7.63) (12.57) (15.91) (14.17) (100) (100) (100)
Mahalung 25 40 65 3 4 9 93 75 168 25 8 33 26 13 39 172 140 314
(14.53) (28.57) (20.70) (1.74) (2.86) (2.87) (54.07) (53.57) (53.50) (14.53) (5.71) (10.51) (15.12) (9.29) (12.42) (100) (100) (100)
Malshiras 8 22 30 1 0 1 40 38 78 21 12 33 6 11 17 76 83 159
(10.53) (26.51) (18.87) (1.32) -- (0.63) (52.63) (45.78) (49.06) (27.63) (14.46) (20.75) (7.89) (13.25) (10.69) (100) (100) (100)
Natepute 39 70 113 2 2 4 118 86 214 19 1 20 21 15 42 199 174 393
(19.60) (40.23) (28.75) (1.01) (1.15) (1.02) (59.30) (49.43) (54.45) (9.55) (0.57) (5.09) (10.55) (8.62) (10.69) (100) (100) (100)
Piliv 33 56 89 3 0 3 68 60 129 12 5 18 10 16 26 126 137 265
(26.19) (40.88) (33.58) (2.38) -- (1.13) (53.97) (43.80) (48.68) (9.52) (3.65) (6.79) (7.94) (11.68) (9.81) (100) (100) (100)
Velapur
16 25 41 1 0 1 45 32 78 14 3 17 10 12 22 86 72 159 (18.60) (34.72) (25.79) (1.16) -- (0.63) (52.33) (44.44) (49.06) (16.28) (4.17) (10.69) (11.63) (16.67) (13.84) (100) (100) (100)
Total 185 329 518 14 11 27 612 477 1101 147 43 191 126 127 259 1084 987 2096
(17.07) (33.33) (24.71) (1.29) (1.11) (1.29) (56.46) (48.33) (52.53) (13.56) (4.36) (9.11) (11.62) (12.87) (12.36) (100) (100) (100) Figures in parentheses denote percentages.

96
Table 5.5 : Distribution of population according to occupation
Circle Akluj Dahigaon Mahalung Malshiras Natepute Piliv Velapur Total
Agriculture M 62 (24.03) 59 (28.37) 47 (26.11) 14 (16.28) 71 (32.13) 46 (30.46) 27 (28.13) 326 (27.17) F 28 (11.76) 29 (14.50) 34 (21.12) 12 (12.37) 54 (23.48) 25 (15.34) 12 (13.64) 194 (16.48) T 90 (18.15) 88 (21.57) 81 (23.62) 26 (14.21) 125 (27.72) 73 (23.10) 39 (21.08) 522 (21.91)
Agricultural & wage labour
M 45 (17.44) 23 (11.06) 33 (18.33) 14 (16.28) 31 (14.03) 36 (23.84) 15 (15.63) 197 (16.42) F 30 (12.61) 16 (8.00) 20 (12.42) 7 (7.22) 28 (12.17) 30 (18.40) 10 (11.36) 141 (11.98) T 75 (15.12) 39 (9.56) 55 (16.03) 21 (11.48) 59 (13.08) 66 (20.89) 26 (14.05) 341 (14.32)
Artisanal work
M 5 (1.94) 4 (1.92) 6 (3.33) -- 1 (0.45) 1 (0.66) 3 (3.13) 20 (1.67) F 1 (0.42) 0 -- 1 (0.62) -- 0 -- 1 (0.61) 1 (1.14) 4 (0.34) T 6 (1.21) 4 (0.98) 7 (2.04) -- 1 (0.22) 2 (0.63) 4 (2.16) 24 (1.01)
Salaried employment
M 18 (6.98) 8 (3.85) 7 (3.89) 7 (8.14) 8 (3.62) 6 (3.97) 7 (7.29) 61 (5.08) F 2 (0.84) 2 (1.00) 0 -- 2 (2.06) 1 (0.43) 0 -- 0 -- 7 (0.59) T 20 (4.03) 10 (2.45) 7 (2.04) 9 (4.92) 9 (2.00) 6 (1.90) 7 (3.78) 68 (2.85)
Housework
M 4 (1.55) 7 (3.37) 3 (1.67) 1 (1.16) 1 (0.45) 1 (0.66) 2 (2.08) 19 (1.58) F 79 (33.19) 84 (42.00) 51 (31.68) 35 (36.08) 70 (30.43) 41 (25.15) 34 (38.64) 394 (33.47) T 83 (16.73) 91 (22.30) 54 (15.74) 36 (19.67) 71 (15.74) 42 (13.29) 36 (19.46) 413 (17.34)
Other work
M 12 (4.65) 19 (9.13) 8 (4.44) 13 (15.12) 11 (4.98) 4 (2.65) 7 (7.29) 74 (6.17) F 0 -- 1 (0.50) 1 (0.62) 1 (1.03) 0 -- 0 -- 2 (2.27) 5 (0.42) T 12 (2.42) 20 (4.90) 9 (2.62) 14 (7.65) 11 (2.44) 4 (1.27) 9 (4.86) 79 (3.32)
Not Applicable
M 112 (43.41) 88 (42.31) 76 (42.22) 37 (43.02) 98 (44.34) 57 (37.75) 35 (36.46) 503 (41.92) F 98 (41.18) 68 (34.00) 54 (33.54) 40 (41.24) 77 (33.48) 66 (40.49) 29 (32.95) 432 (36.70) T 210 (42.34) 156 (38.24) 130 (37.90) 77 (42.08) 175 (38.80) 123 (38.92) 64 (34.59) 935 (39.25)
Total
M 258 (100) 208 (100) 180 (100) 86 (100) 221 (100) 151 (100) 96 (100) 1200 (100) F 238 (100) 200 (100) 161 (100) 97 (100) 230 (100) 163 (100) 88 (100) 1177 (100) T 496 (100) 408 (100) 343 (100) 183 (100) 451 (100) 316 (100) 185 (100) 2382 (100)
Not applicable refers to small children, students, old people and the disabled. Figures in parentheses denote percentages.

97
Table 5.6 : Distribution of households according to Non-Agricultural Income (NAI)
Circle No NAI NAI less than 10 thousand NAI between 10 and 20 thousand
NAI more than 20 thousand Total
No. of HH No. of HH NAI No. of HH NAI No. of HH NAI No. of HH NAI
Akluj 10 2 17,250.00 15 217,360.00 26 1,526,730.00 53 1,761,340.00
(18.87) (3.77) (8,625.00) (28.30) (14,490.67) (49.06) (58,720.38) (100.00) (33,232.83)
Dahigaon 6 8 51,420.00 17 253,810.00 17 1,026,030.00 48 1,331,260.00
(12.50) (16.67) (6,427.50) (35.42) (14,930.00) (35.42) (60,354.71) (100.00) (27,734.58)
Mahalung 18 8 46,400.00 10 141,080.00 15 758,995.00 51 946,475.00
(35.29) (15.69) (5,800.00) (19.61) (14,108.00) (29.41) (50,599.67) (100.00) (18,558.33)
Malshiras 4 6 30,100.00 1 19,500.00 15 774,600.00 26 824,200.00
(15.38) (23.08) (5,016.67) (3.85) (19,500.00) (57.69) (51,640.00) (100.00) (31,700.00)
Natepute 13 11 72,240.00 11 173,680.00 15 768,990.00 50 1,014,910.00
(26.00) (22.00) (6,567.27) (22.00) (15,789.09) (30.00) (51,266.00) (100.00) (20,298.20)
Piliv 8 19 117,250.00 15 226,330.00 10 490,500.00 52 834,080.00
(15.38) (36.54) (6,171.05) (28.85) (15,088.67) (19.23) (49,050.00) (100.00) (16,040.00)
Velapur 2 4 19,440.00 6 97,400.00 14 596,037.50 26 712,877.50
(7.69) (15.38) (4,860.00) (23.08) (16,233.33) (53.85) (42,574.11) (100.00) (27,418.37)
Total 61 58 354,100.00 75 1,129,160.00 112 5,941,882.50 306 7,425,142.50
(19.93) (18.95) (6,105.17) (24.51) (15,055.47) (36.60) (53,052.52) (100.00) (24,265.17) Figures in parentheses denote percentages and NAI per reporting families.

98
Table 5.7 : Distribution of households according to landholding
Circle Landless Less than 0.5 ha Between 0.5 and 2 ha Between 2 and 4 ha More than 4 ha Total
No. of HH No. of HH Land (ha) No. of HH Land (ha) No. of HH Land (ha) No. of HH Land (ha) No. of HH Land (ha)
Akluj 19 5 2 17 18.43 7 20 5 37.2 53 77.63
(35.85) (9.43) (0.40) (32.08) (1.08) (13.21) (2.86) (9.43) (7.44) (100.00) (1.46)
Dahigaon 20 3 0.8 12 15.66 5 13.4 8 72 48 101.86
(41.67) (6.25) (0.27) (25.00) (1.31) (10.42) (2.68) (16.67) (9.00) (100.00) (2.12)
Mahalung 22 5 1.8 10 15.24 2 7.8 12 167.6 51 192.44
(43.14) (9.80) (0.36) (19.61) (1.52) (3.92) (3.90) (23.53) (13.97) (100.00) (3.77)
Malshiras 14 1 0.4 7 8.4 2 6.2 2 14 26 29
(53.85) (3.85) (0.40) (26.92) (1.20) (7.69) (3.10) (7.69) (7.00) (100.00) (1.12)
Natepute 6 6 1.88 19 24.62 6 17 13 102.8 50 146.3
(12.00) (12.00) (0.31) (38.00) (1.30) (12.00) (2.83) (26.00) (7.91) (100.00) (2.93)
Piliv 13 1 0.4 17 18.36 13 41.4 8 54.4 52 114.56
(25.00) (1.92) (0.40) (32.69) (1.08) (25.00) (3.18) (15.38) (6.80) (100.00) (2.20)
Velapur 9 1 0.3 8 8.93 4 13.3 4 24.4 26 46.93
(34.62) (3.85) (0.30) (30.77) (1.12) (15.38) (3.33) (15.38) (6.10) (100.00) (1.81)
Total 103 22 7.58 90 109.64 39 119.1 52 472.4 306 708.72
(33.66) (7.19) (0.34) (29.41) (1.22) (12.75) (3.05) (16.99) (9.08) (100.00) (2.32) Figures in parentheses denote percentage of households and average landholding per household for that circle.

99
Table 5.8 : Crop patterns and irrigation status All fiures are in ha
Crops Bajara Jowar Wheat Maize Other cereals
Tur Matki Other pulses
Groundnut
Other Oil-seeds
Vege-tables & spiceses
Onion Frutis Sugar-cane
Cotton Fodder Other crops
Total
Akluj
Unirrigat. 14.8 (47.60)
5.2 (16.75)
-- 3(9.66)
0.4(1.28)
1.00(3.22)
0.702.25)
2.2(7.08)
- - 0.03(0.09)
- - 0.40(1.28)
0.40(1.28)
0.90(2.70)
2(6.44)
31.03(100)
Irrigated 1.40 (2.09)
14.4 (37.80)
6.55 (14.38)
2.45(5.4)
0.4(0.88)
- 0.80(1.76)
- - 1.00(2.21)
0.80(1.76)
1.6(3.53)
11.90(26.3)
- 3.90(8.62)
- 45.2(100)
Total 16.2 (21.25)
19.6 (25.79)
6.55 (8.52)
5.45(7.14)
0.4(0.52)
1.4(1.83)
0.40(0.52)
3(3.93)
- - 1.03(1.35)
0.80(1.04)
1.60(2.09)
12.30(16.5)
0.40(0.47)
4.80(6.21)
2.00(5.24)
76.23(100)
Dahigaon
Unirrigat. 12.9 (62)
3.2 (15.38)
- 0.80(3.84)
- - 1.8(8.65)
0.20(0.96)
0.60(2.88)
- - 0.10(0.4)
- - 0.6(2.88)
0.6(2.88)
- 20.8(100)
Irrigated 3.2 (5.10)
8.4 (13.3)
14.4 (22.9)
2.20(3.5)
- - - 2.10(3.34)
0.50(0.79)
- 0.50(0.79)
- 3.2(5.10)
20.7(33.0)
- 7.5(11.96)
- 62.7(100)
Total 16.10 (19.28)
11.6 (13.8)
14.4 (17.2)
3(3.5)
- - 1.8(2.15)
2.3(2.75)
- - 0.50(0.59)
0.10(0.1)
3.2(3.83)
20.7(24.7)
0.6(0.7)
8.10(9.7)
- 83.5(100)
Mahalung
Unirrigat. 14.8 (32.17)
8.3 (18.0)
- 2.2(4.77)
- 0.6(1.30)
- 1.2(2.6)
1.2(2.6)
0.10 (0.2)
0.10(0.2)
- - 0.20(0.43)
- 3.4(7.37)
14(30.3)
46.1(100)
Irrigated -- 24.8 (21.8)
17.9 (15.79)
3.2(2.82)
1(0.88)
- 0.4(0.35)
0.7(0.61)
- - 1.04(0.9)
0.08(0.7)
15.6(13.76)
43.7(38.5)
- 4.85(4.27)
0.08(0.07)
113.35(100)
Total 14.8 (9.28)
33.10 (20.7)
17.9 (11.22)
5.4(3.38)
1(0.62)
0.6(0.37)
0.4(0.25)
1.9(1.19)
1.2(0.75)
0.10 (0.06)
1.14(0.71)
0.08(0.50)
15.6(9.78)
43.90(27.5)
- 8.25(5.17)
14.08(8.83)
159.45(100)
Malshiras
Unirrigat. 6.4 (50.5)
- - 1.9(15)
- - - - 2(15.8)
- 0.15(1.18)
- - - - 1.40(11.06)
0.80(6.32)
12.65(100)
Irrigated - 5.6 (32.18)
3.5 (20.1)
0.20(1.14)
- - - - - - 0.10(0.5)
0.40 (2.2)
0.40(2.2)
4.6(26.4)
0.40(2.2)
2.20(12.6)
- 17.40(100)
Total 6.4 (21.2)
5.6 (18.6)
3.5 (11.6)
2.10(6.98)
- - - - 2(6.6)
- 0.25(0.83)
0.40(1.33)
0.40(1.33)
4.6(15.3)
0.40(1.33)
3.60(11.9)
0.80(2.6)
30.05(100)
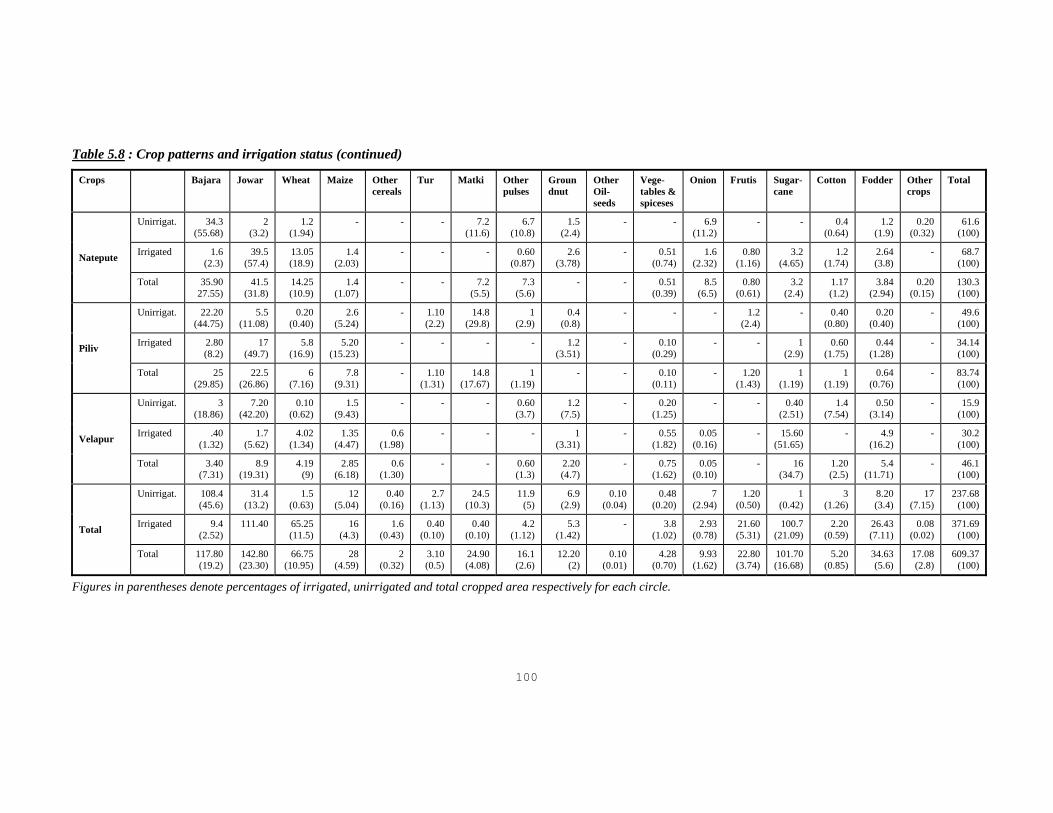
100
Table 5.8 : Crop patterns and irrigation status (continued)
Crops Bajara Jowar Wheat Maize Other cereals
Tur Matki Other pulses
Groundnut
Other Oil-seeds
Vege-tables & spiceses
Onion Frutis Sugar-cane
Cotton Fodder Other crops
Total
Natepute
Unirrigat. 34.3 (55.68)
2 (3.2)
1.2 (1.94)
- - - 7.2(11.6)
6.7(10.8)
1.5(2.4)
- - 6.9(11.2)
- - 0.4(0.64)
1.2(1.9)
0.20(0.32)
61.6(100)
Irrigated 1.6 (2.3)
39.5 (57.4)
13.05 (18.9)
1.4(2.03)
- - - 0.60(0.87)
2.6(3.78)
- 0.51(0.74)
1.6(2.32)
0.80(1.16)
3.2(4.65)
1.2(1.74)
2.64(3.8)
- 68.7(100)
Total 35.90 27.55)
41.5 (31.8)
14.25 (10.9)
1.4(1.07)
- - 7.2(5.5)
7.3(5.6)
- - 0.51(0.39)
8.5(6.5)
0.80(0.61)
3.2(2.4)
1.17(1.2)
3.84(2.94)
0.20(0.15)
130.3(100)
Piliv
Unirrigat. 22.20 (44.75)
5.5 (11.08)
0.20 (0.40)
2.6(5.24)
- 1.10(2.2)
14.8(29.8)
1(2.9)
0.4(0.8)
- - - 1.2(2.4)
- 0.40(0.80)
0.20(0.40)
- 49.6(100)
Irrigated 2.80 (8.2)
17 (49.7)
5.8 (16.9)
5.20(15.23)
- - - - 1.2(3.51)
- 0.10(0.29)
- - 1(2.9)
0.60(1.75)
0.44(1.28)
- 34.14(100)
Total 25 (29.85)
22.5 (26.86)
6 (7.16)
7.8(9.31)
- 1.10(1.31)
14.8(17.67)
1(1.19)
- - 0.10(0.11)
- 1.20(1.43)
1(1.19)
1(1.19)
0.64(0.76)
- 83.74(100)
Velapur
Unirrigat. 3 (18.86)
7.20 (42.20)
0.10 (0.62)
1.5(9.43)
- - - 0.60(3.7)
1.2(7.5)
- 0.20(1.25)
- - 0.40 (2.51)
1.4(7.54)
0.50(3.14)
- 15.9(100)
Irrigated .40 (1.32)
1.7 (5.62)
4.02 (1.34)
1.35(4.47)
0.6(1.98)
- - - 1(3.31)
- 0.55(1.82)
0.05(0.16)
- 15.60(51.65)
- 4.9(16.2)
- 30.2(100)
Total 3.40 (7.31)
8.9 (19.31)
4.19 (9)
2.85(6.18)
0.6(1.30)
- - 0.60(1.3)
2.20(4.7)
- 0.75(1.62)
0.05(0.10)
- 16(34.7)
1.20(2.5)
5.4(11.71)
- 46.1(100)
Total
Unirrigat. 108.4 (45.6)
31.4 (13.2)
1.5 (0.63)
12(5.04)
0.40(0.16)
2.7(1.13)
24.5(10.3)
11.9(5)
6.9(2.9)
0.10 (0.04)
0.48(0.20)
7(2.94)
1.20(0.50)
1(0.42)
3(1.26)
8.20(3.4)
17(7.15)
237.68(100)
Irrigated 9.4 (2.52)
111.40 65.25 (11.5)
16(4.3)
1.6(0.43)
0.40(0.10)
0.40(0.10)
4.2(1.12)
5.3(1.42)
- 3.8(1.02)
2.93(0.78)
21.60(5.31)
100.7(21.09)
2.20(0.59)
26.43(7.11)
0.08(0.02)
371.69(100)
Total 117.80 (19.2)
142.80 (23.30)
66.75 (10.95)
28(4.59)
2(0.32)
3.10(0.5)
24.90(4.08)
16.1(2.6)
12.20(2)
0.10 (0.01)
4.28(0.70)
9.93(1.62)
22.80(3.74)
101.70(16.68)
5.20(0.85)
34.63(5.6)
17.08(2.8)
609.37(100)
Figures in parentheses denote percentages of irrigated, unirrigated and total cropped area respectively for each circle.

101
Table 5.9 : Annual agricultural biomass production and biomass use from crop area All figures are in tons Crop Bajri Jowar Wheat Maize Other
cereals Tur Matki Other
Pulses Ground-
nut Other
oilseeds Vege-
tables & spices
Onion Fruits Sugar-cane
Cotton Fodder Other crops
Total
Akluj Production 28.73 17.65 12.85 15.30 0.50 0.83 1.15 0.72 -- -- 41.98 15.00 30.00 1,870.00 1.50 -- 1.50 2,037.70Fodder 25.62 52.35 -- 11.95 0.25 0.23 0.20 0.30 -- -- -- -- -- 78.90 -- 104.60 0.30 274.70Fuel 7.23 4.16 0.10 3.83 0.13 0.88 -- 05 -- -- -- -- -- 45.50 1.50 -- 0.30 63.67
Dahigaon Production 29.20 9.80 30.26 1.50 -- -- 0.10 0.71 1.81 -- 1.40 0.75 1.50 2,070.00 0.82 0.05 -- 2,147.90Fodder 19.80 55.10 0.40 73.00 -- -- -- 1.02 0.97 -- -- -- -- 65.33 -- 243.48 -- 459.09Fuel 7.30 4.33 -- 0.38 -- -- -- -- 0.50 -- -- -- -- 53.08 1.10 -- -- 66.68
Mahalung Production 20.10 29.20 33.75 19.65 2.50 1.00 0.15 0.40 1.80 0.01 4.48 0.20 75.23 3,976.00 -- -- 0.10 4,164.77Fodder 25.90 140.72 1.60 12.53 -- 0.25 -- 0.20 2.05 -- -- -- -- 181.65 -- 301.35 -- 365.9Fuel 6.15 8.80 -- 3.34 2.50 4.00 -- 0.15 -- -- 0.05 -- 1.68 95.15 -- -- -- 121.82
Malshiras Production 7.68 6.54 6.10 4.20 -- -- -- -- 1.88 -- 3.02 1.00 1.40 390.00 0.20 -- 0.80 422.82Fodder 5.44 22.75 -- 6.55 -- -- -- -- -- -- -- 4.00 -- 34.50 -- 81.84 -- 155.08Fuel 1.92 1.64 -- 1.02 -- -- -- -- -- -- -- 0.80 8.65 0.40 -- -- 14.43
Natepute Production 39.70 30.90 22.65 3.33 -- -- 0.55 0.95 9.00 -- 3.11 29.20 8.00 234.00 1.75 -- 0.10 383.19Fodder 45.83 81.47 1.50 6.13 -- -- 4.30 5.7 4.18 -- -- 0.60 -- 8.70 1.00 59.80 -- 219.20Fuel 9.93 7.81 -- 0.83 -- -- -- -- -- -- -- -- -- 5.85 3.00 -- -- 27.42
Piliv Production 25.00 18.25 10.25 15.73 -- 1.00 1.13 0.09 1.30 -- 0.10 -- 2.00 100.00 1.60 -- -- 176.45Fodder 49.20 35.60 0.40 9.05 -- 2.00 2.10 -- 0.20 -- -- -- -- 3.80 0.20 4.50 -- 107.05Fuel 6.25 4.56 -- 3.93 -- 1.70 -- -- -- -- -- -- -- 2.50 0.78 -- -- 19.73
Velapur Production 3.55 4.73 7.55 8.64 0.40 -- -- 0.06 0.95 -- 6.85 0.60 -- 1,339.50 0.60 1.20 -- 1,374.63Fodder 5.55 16.80 0.50 20.35 -- -- -- -- 1.00 -- -- -- -- 54.18 1.00 181.50 -- 280.88Fuel 0.89 1.18 -- 2.00 -- -- -- -- -- -- -- -- -- 34.61 0.60 -- 2.50 41.78
Total Production 153.96 117.07 123.41 68.35 3.40 2.83 3.08 2.86 16.74 0.01 60.94 46.75 118.13 9,979.50 6.47 1.25 2.50 10,707.25Fodder 177.33 404.79 4.40 139.55 0.25 2.48 6.60 7.22 8.40 -- -- 4.60 -- 427.05 2.20 977.07 0.30 2,162.23Fuel 39.67 32.48 0.10 15.32 2.63 6.58 -- 0.2 0.50 -- 0.05 -- 2.48 245.34 7.38 -- 2.80 355.51
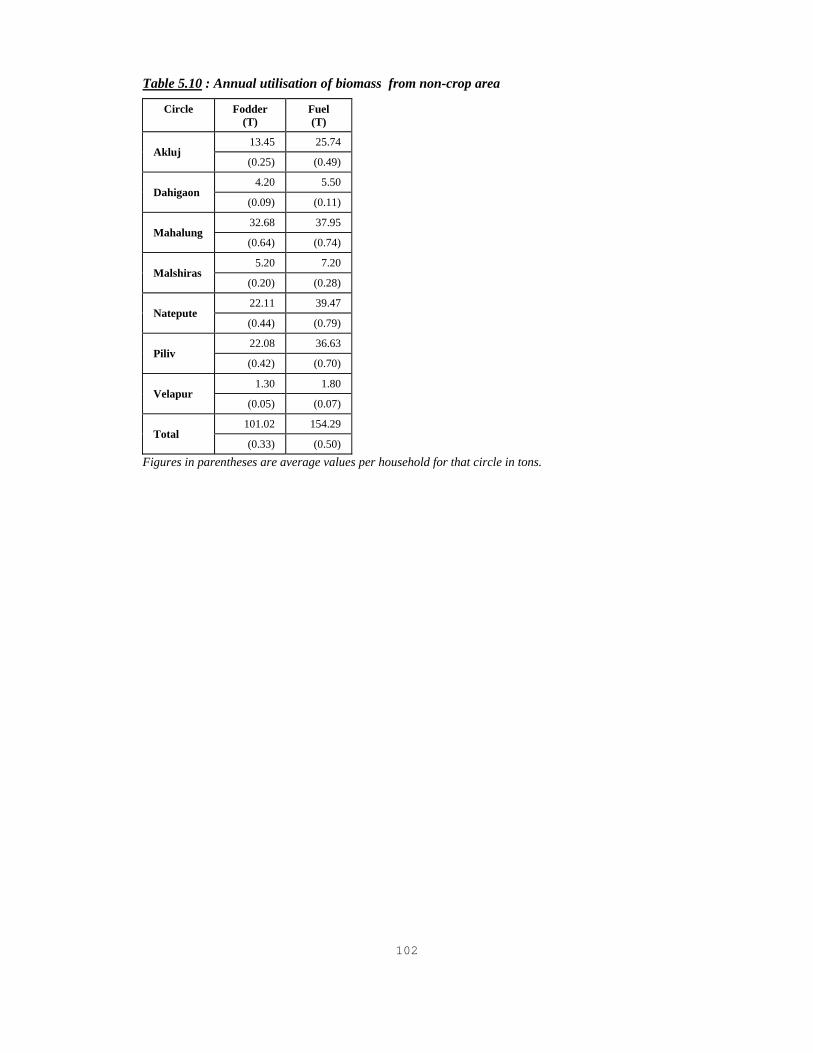
102
Table 5.10 : Annual utilisation of biomass from non-crop area
Circle Fodder (T)
Fuel (T)
Akluj 13.45 25.74
(0.25) (0.49)
Dahigaon 4.20 5.50
(0.09) (0.11)
Mahalung 32.68 37.95
(0.64) (0.74)
Malshiras 5.20 7.20
(0.20) (0.28)
Natepute 22.11 39.47
(0.44) (0.79)
Piliv 22.08 36.63
(0.42) (0.70)
Velapur 1.30 1.80
(0.05) (0.07)
Total 101.02 154.29
(0.33) (0.50) Figures in parentheses are average values per household for that circle in tons.

103
Table 5.11 : Trees owned by sample households
Circle Fodder, timber & fuel yielding trees
Fruit trees Other trees Total
Akluj 374 378 246 998
(7.1) (7.1) (4.6) (18.8)
Dahigaon 452 184 70 706
(9.4) (3.8) (1.5) (14.7)
Mahalung 560 351 73 984
(11.0) (6.9) (1.4) (19.3)
Malshiras 330 130 6 466
(12.7) (5.0) (0.2) (17.9)
Natepute 1,254 76 127 1,457
(25.1) (1.5) (2.5) (29.1)
Piliv 457 79 111 647
(8.8) (1.5) (2.1) (12.4)
Velapur 740 89 12 841
(28.5) (3.4) (0.5) (32.3)
Total 4,167 1,287 645 6,099
(13.6) (4.2) (2.1) (19.9)

104

105
Table 5.12 : Animals owned by sample households
Type of animal Akluj Dahigaon Mahalung Malshiras Natepute Piliv Velapur Total
No. of animals
Animal units
No. of animals
Animal units
No. of animals
Animal units
No. of animals
Animal units
No. of animals
Animal units
No. of animals
Animal units
No. of animals
Animal units
No. of animals
Animal units
Milch Cows (crossbred) 47 117.50 40 100.00 16 40.00 8 20.00 19 47.50 22 55.00 15 37.50 167 417.50
Other Milch Cows 6 6.00 9 9.00 27 27.00 4 4.00 16 16.00 12 12.00 7 7.00 81 81.00
Other Cows 5 3.00 2 1.20 5 3.00 3 1.80 10 6.00 11 6.60 6 3.60 42 25.20
Calves 31 18.60 21 12.60 27 16.20 8 4.80 28 16.80 29 17.40 11 6.60 155 93.00
Bullocks 16 16.00 27 27.00 18 18.00 3 3.00 37 37.00 17 17.00 15 15.00 133 133.00
Milch Buffaloes 33 46.20 17 23.80 40 56.00 10 14.00 18 25.20 17 23.80 20 28.00 155 217.00
Other Female buffaloes 9 7.20 10 8.00 4 3.20 3 2.40 11 8.80 6 4.80 2 1.60 45 36.00
He-buffaloes 17 17.00 6 6.00 12 12.00 9 9.00 4 4.00 11 11.00 4 4.00 63 63.00
Buffalo Calves 9 5.40 7 3.75 13 7.80 1 0.60 7 4.20 6 3.60 9 5.40 52 30.75
Goats 58 8.70 72 10.80 99 14.85 11 1.65 153 22.95 100 15.00 44 6.60 537 80.55
Sheep 47 7.05 1 0.15 62 9.30 150 22.50 260 39.00
Fowl 271 -- 171 -- 175 -- 99 -- 242 -- 227 -- 51 -- 1236 --
Total 549 252.65 382 202.15 436 198.05 160 61.40 607 197.75 608 188.70 184 115.30 2926 1,216.00

106
Table 5.13 : Annual fodder and feed consumption and dung production for the sample households
All figures are in tons Circle No. of animal
units Green Fodder Dry Fodder Animal Feed Dung
gross weight dry weight gross weight dry weight gross weight dry weight gross weight dry weight
Akluj 252.65 208.69 104.35 125.83 100.66 43.53 39.18 249.08 99.63 (0.83) (0.41) (0.50) (0.40) (0.17) (0.16) (0.99) 0.39
Dahigaon 202.15 216.86 108.43 56.47 45.17 33.52 30.16 223.27 89.31 (1.07) (0.54) (0.28) (0.22) (0.17) (0.15) (1.10) 0.44
Mahalung 198.05 144.13 72.06 77.58 62.06 18.28 16.45 264.70 105.88 (0.73) (0.36) (0.39) (0.31) (0.09) (0.08) (1.34) 0.53
Malshiras 61.40 65.66 32.83 28.19 22.55 8.45 7.61 78.69 31.48 (1.07) (0.53) (0.46) (0.37) (0.14) (0.12) (1.28) 0.51
Natepute 197.75 146.68 73.34 105.07 84.05 17.35 15.62 221.81 88.72 (0.74) (0.37) (0.53) (0.43 (0.09) (0.08) (1.12) 0.45
Piliv 188.70 120.64 60.32 95.04 76.03 39.75 35.78 167.57 67.03 (0.64) (0.32) (0.50) (0.40) (0.21) (0.19) (0.89) 0.36
Velapur 115.30 94.61 47.30 33.82 27.06 23.63 21.27 146.22 58.49 (0.82) (0.41) (0.29) (0.23) (0.20) (0.18) (1.27) 0.51
Total 1,216.00 997.27 498.64 521.99 417.59 184.51 166.05 1351.34 540.54 (0.82) (0.41) (0.43) (0.34) (0.15) (0.14) (1.11) 0.44
Figures in parentheses are average values per animal unit for that circle.

107
Table 5.14 : Annual use of draught power for the sample households All figures are in animal days
Circle Agricultural operations Transport Total
Owned Rented Total Owned Rented Total Owned Rented Total
Akluj 590.00 497.00 1,087.00 168.00 137.00 305.00 758.00 634.00 1,392.00
(6.88) (5.80) (12.68) (1.96) (1.60) (3.56) (8.84) (7.40) (16.24)
Dahigaon 1,901.00 531.00 2,432.00 577.00 211.00 788.00 2,478.00 742.00 3,220.00
(18.66) (5.21) (23.87) (5.66) (2.07) (7.73) (24.32) (7.28) (31.60)
Mahalung 946.00 540.00 1,486.00 492.00 118.00 610.00 1,438.00 658.00 2,096.00
(5.79) (3.30) (9.09) (3.01) (0.72) (3.73) (8.80) (4.03) (12.82)
Malshiras 300.00 264.00 564.00 200.00 32.00 232.00 500.00 296.00 796.00
(9.98) (8.79) (18.77) (6.66) (1.06) (7.72) (16.64) (9.85) (26.49)
Natepute 1,751.00 565.00 2,316.00 1,725.00 85.00 1,810.00 3,476.00 650.00 4,126.00
(12.83) (4.14) (16.97) (12.64) (0.62) (13.26) (25.47) (4.76) (30.23)
Piliv 386.00 644.00 1,030.00 59.00 119.00 178.00 445.00 763.00 1,208.00
(4.45) (7.42) (11.87) (0.68) (1.37) (2.05) (5.13) (8.80) (13.93)
Velapur 850.00 304.00 1,154.00 97.00 352.00 449.00 947.00 656.00 1,603.00
(17.53) (6.27) (23.79) (2.00) (7.26) (9.26) (19.53) (13.53) (33.05)
Total 6,724.00 3,345.00 10,069.00 3,318.00 1,054.00 4,372.00 10,042.00 4,399.00 14,441.00
(10.30) (5.12) (15.42) (5.08) (1.61) (6.70) (15.38) (6.74) (22.12) Figures in parentheses are average values per cropped area for that circle

108
Table 5.15 : Annual use of mechanical equipment for the sample households All figures are in equipment hours
Circle Tractors owned
Tractor use Threshers owned
Thresher use
Agricultural operations Transport Total
Owned Rented in Total Owned Rented in Total Owned Rented in Total Owned Rented in Total
Akluj 5 128 211 339 165 37 202 293 248 541
3 19 166 185
(1.65) (2.71) (4.36) (2.13) (0.48) (2.60) (3.77) (3.19) (6.96) (0.24) (2.13) (2.38)
Dahigaon 4 88 121 209 210 23 233 298 144 442
3 18 153 171
(0.86) (1.19) (2.05) (2.06) (0.22) (2.28) (2.93) (1.41) (4.33) (0.18) (1.50) (1.68)
Mahalung 7 357 115 472 360 48 408 717 163 880
1 1 172 173
(1.86) (0.60) (2.45) (1.87) (0.25) (2.12) (3.73) (0.85) (4.57) (0.01) (0.89) (0.90)
Malshiras 3 56 56 112 185 2 187 241 58 299
84 84
(1.93) (1.91) (3.84) (6.38) (0.07) (6.45) (8.31) (1.98) (10.29) -- (2.88) (2.88)
Natepute 4 72 85 157 194 25 219 266 110 376
3 52 152 204
(0.49) (0.58) (1.07) (1.33) (0.17) (1.50) (1.82) (0.75) (2.57) (0.36) (1.04) (1.39)
Piliv 0 8 176 184 18 6 24 26 182 208
2 6 485 491
(0.07) (1.53) (1.60) (0.16) (0.05) (0.21) (0.23) (1.58) (1.81) (0.05) (4.23) (4.29)
Velapur 0 -- 105 105 -- 1 1 -- 106 106
2 2 105 107
-- (2.23) (2.23) -- (0.02) (0.02) -- (2.25) (2.25) (0.04) (2.24) (2.28)
Total 23 709 867 1,576 1,132 142 1,274 1,841 1,009 2,850
14 98 1,315 1,413
(1.00) (1.22) (2.22) (1.60) (0.20) (1.80) (2.60) (1.42) (4.02) (0.14) (1.86) (1.99) Figures in parentheses are average values per cropped area for that circle.

109
Table 5.16 : Annual pumping energy for the sample households
Circle Electric pumpsets Diesel pumpsets
No. of pumpsets
Capacity (hp)
Annual hours of use (hrs)
Energy use (kWh)
No. of pumpsets
Capacity (hp) Annual hours of use (hrs)
Energy use (kWh)
Akluj 31 138.5 24,857 91,861.69
-- -- -- --
(4.47) (801.84) (2,963.28) -- -- --
Dahigaon 28 132.5 19,166 69,549.58
1 3 192 429.70
(4.73) (684.50) (2,483.91) (3.00) (192.00) (429.70)
Mahalung 24 132.0 19,730 88,941.85
1 5 1,920 7,161.60
(5.50) (822.08) (3,705.91) (5.00) (1,920.00) (7,161.60)
Malshiras 8 34.0 10,298 36,510.73
-- -- -- --
(4.25) (1,287.25) (4,563.84) -- -- --
Natepute 36 160.0 27,362 103,080.79
14 68 2,356 8,644.65
(4.44) (760.06) (2,863.36) (4.86) (168.29) (617.47)
Piliv 19 84.0 6,069 19,676.50
5 25 652 2,431.96
(4.42) (319.42) (1,035.61) (5.00) (130.40) (486.39)
Velapur 17 81.0 13,748 59,653.14
-- -- -- --
(4.76) (808.71) (3,509.01) -- -- --
Total 163 762.0 121,230 469,274.28
21 101 5,120 18,667.90
(4.67) (743.74) (2,878.98) (4.81) (243.81) (888.95) Figures in parentheses are per pumpset values for that circle.

110
Table 5.17a : Daily domestic per household fuel use (except electricity) for the sample households
Circle Firewood (kg)
Dungcake (kg)
Kerosene (l)
LPG (kg)
Biogas (Nm3)
Akluj 572.30 35.25 10.05 2.18 32
(10.80) (0.67) (0.19) (0.04) (0.60)
Dahigaon 447.00 10.63 7.15 2.09 14.4
(9.31) (0.22) (0.15) (0.04) (0.30)
Mahalung 370.30 57.20 10.62 0.97 10.8
(7.26) (1.12) (0.21) (0.02) (0.21)
Malshiras 189.50 12.50 8.92 2.29 0
(7.29) (0.48) (0.34) (0.09) --
Natepute 551.50 10.25 9.60 0.27 0
(11.03) (0.21) (0.19) (0.01) --
Piliv 386.00 27.40 10.20 0.00 0
(7.42) (0.53) (0.20) -- --
Velapur 207.30 22.50 5.38 0.48 6
(7.97) (0.87) (0.21) (0.02) (0.23)
Total 2,723.90 175.73 61.92 8.28 63.2
(8.90) (0.57) (0.20) (0.03) (0.21) Figures in parentheses are average values per household for that circle.

111
Table 5.17b : Daily domestic per capita fuel use (except electricity) for the sample households
Circle Firewood (kg)
Dungcake (kg)
Kerosene (l)
LPG (kg)
Biogas (Nm3)
Akluj 572.30 35.25 10.05 2.18 32
(1.30) (0.08) (0.02) (0.00) (0.07)
Dahigaon 447.00 10.63 7.15 2.09 14.4
(1.22) (0.03) (0.02) (0.01) (0.04)
Mahalung 370.30 57.20 10.62 0.97 10.8
(1.18) (0.18) (0.03) (0.00) (0.03)
Malshiras 189.50 12.50 8.92 2.29 --
(1.19) (0.08) (0.06) (0.01) --
Natepute 551.50 10.25 9.60 0.27 0
(1.40) (0.03) (0.02) (0.00) --
Piliv 386.00 27.40 10.20 0.00 0
(1.46) (0.10) (0.04) -- --
Velapur 207.30 22.50 5.38 0.48 6
(1.30) (0.14) (0.03) (0.00) (0.04)
Total 2,723.90 175.73 61.92 8.28 63.2
(1.30) (0.08) (0.03) (0.00) (0.03) Figures in parentheses are average values per capita for that circle.

112
Table 5.17c : Annual domestic per household fuel use (except electricity) for the sample households
Circle Firewood (T)
Dungcake (T)
Kerosene (kl)
LPG (T)
Biogas ('000 Nm3)
Akluj 208.89 12.87 3.67 0.79 11.68
(3.94) (0.24) (0.07) (0.01) (0.22)
Dahigaon 163.16 3.88 2.61 0.76 5.26
(3.40) (0.08) (0.05) (0.02) (0.11)
Mahalung 135.16 20.88 3.88 0.35 3.94
(2.65) (0.41) (0.08) (0.01) (0.08)
Malshiras 69.17 4.56 3.25 0.84 0.00
(2.66) (0.18) (0.13) (0.03) --
Natepute 201.30 3.74 3.50 0.10 0.00
(4.03) (0.07) (0.07) (0.00) --
Piliv 140.89 10.00 3.72 0.00 0.00
(2.71) (0.19) (0.07) -- --
Velapur 75.66 8.21 1.96 0.18 2.19
(2.91) (0.32) (0.08) (0.01) (0.08)
Total 994.22 64.14 22.60 3.02 23.07
(3.25) (0.21) (0.07) (0.01) (0.08) Figures in parentheses are average values per household for that circle.

113
Table 5.17d : Annual domestic per capita fuel use (except electricity) for the sample households
Circle Firewood (T)
Dungcake (T)
Kerosene (kl)
LPG (T)
Biogas ('000 Nm3)
Akluj 208.89 12.87 3.67 0.79 11.68
(0.48) (0.03) (0.01) (0.00) (0.03)
Dahigaon 163.16 3.88 2.61 0.76 5.26
(0.44) (0.01) (0.01) (0.00) (0.01)
Mahalung 135.16 20.88 3.88 0.35 3.94
(0.43) (0.07) (0.01) (0.00) (0.01)
Malshiras 69.17 4.56 3.25 0.84 0.00
(0.44) (0.03) (0.02) (0.01) --
Natepute 201.30 3.74 3.50 0.10 0.00
(0.51) (0.01) (0.01) (0.00) --
Piliv 140.89 10.00 3.72 0.00 0.00
(0.53) (0.04) (0.01) -- --
Velapur 75.66 8.21 1.96 0.18 2.19
(0.48) (0.05) (0.01) (0.00) (0.01)
Total 994.22 64.14 22.60 3.02 23.07
(0.47) (0.03) (0.01) (0.00) (0.01) Figures in parentheses are average values per capita for that circle.

114
Table 5.18 : Annual fuel value of domestic fuel used (except electricity) for the sample households All figures are in '000 kcal/year
Circle Firewood Dungcake Kerosene LPG Biogas Total
Akluj 835,558.00 32,165.63 29,346.00 9,526.50 54,896.00 961,492.13
(1,903.32) (73.27) (66.85) (21.70) (125.05) (2,190.19)
Dahigaon 652,620.00 9,695.31 20,878.00 9,163.59 24,703.20 717,060.10
(1,778.26) (26.42) (56.89) (24.97) (67.31) (1,953.84)
Mahalung 540,638.00 52,195.00 31,013.32 4,234.00 18,527.40 646,607.72
(1,721.78) (166.23) (98.77) (13.48) (59.00) (2,059.26)
Malshiras 276,670.00 11,406.25 26,036.67 10,020.47 -- 324,133.38
(1,740.06) (71.74) (163.75) (63.02) -- (2,038.57)
Natepute 805,190.00 9,353.13 28,032.00 1,199.63 -- 843,774.76
(2,048.83) (23.80) (71.33) (3.05) -- (2,147.01)
Piliv 563,560.00 25,002.50 29,784.00 -- -- 618,346.50
(2,126.64) (94.35) (112.39) -- -- (2,333.38)
Velapur 302,658.00 20,531.25 15,719.33 2,117.00 10,293.00 351,318.58
(1,903.51) (129.13) (98.86) (13.31) (64.74) (2,209.55)
Total 3,976,894.00 160,349.06 180,809.32 36,261.19 108,419.60 4,462,733.17
(1,897.37) (76.50) (86.26) (17.30) (51.73) (2,129.17) Figures in parentheses are average values per capita for that circle.

115
Table 5.19 : Annual delivered heat of domestic fuel used (except electricity) for the sample households All figures are in '000 kcal/year
Circle Firewood Dungcake Kerosene LPG Biogas Total
Akluj 83,555.80 3,216.56 13,205.70 6,192.23 32,937.60 139,107.89
(190.33) (7.33) (30.08) (14.11) (75.03) (316.87)
Dahigaon 65,262.00 969.53 9,395.10 5,956.33 14,821.92 96,404.88
(177.83) (2.64) (25.60) (16.23) (40.39) (262.68)
Mahalung 54,063.80 5,219.50 13,955.99 2,752.10 11,116.44 87,107.83
(172.18) (16.62) (44.45) (8.76) (35.40) (277.41)
Malshiras 27,667.00 1,140.63 11,716.50 6,513.30 0.00 47,037.43
(174.01) (7.17) (73.69) (40.96) -- (295.83)
Natepute 80,519.00 935.31 12,614.40 779.76 0.00 94,848.47
(204.88) (2.38) (32.10) (1.98) -- (241.34)
Piliv 56,356.00 2,500.25 13,402.80 0.00 0.00 72,259.05
(212.66) (9.43) (50.58) -- -- (272.68)
Velapur 30,265.80 2,053.13 7,073.70 1,376.05 6,175.80 46,944.48
(190.35) (12.91) (44.49) (8.65) (38.84) (295.25)
Total 397,689.40 16,034.91 81,364.19 23,569.77 65,051.76 583,710.03
(189.74) (7.65) (38.82) (11.25) (31.04) (278.49) Figures in parentheses are average values per capita for that circle.
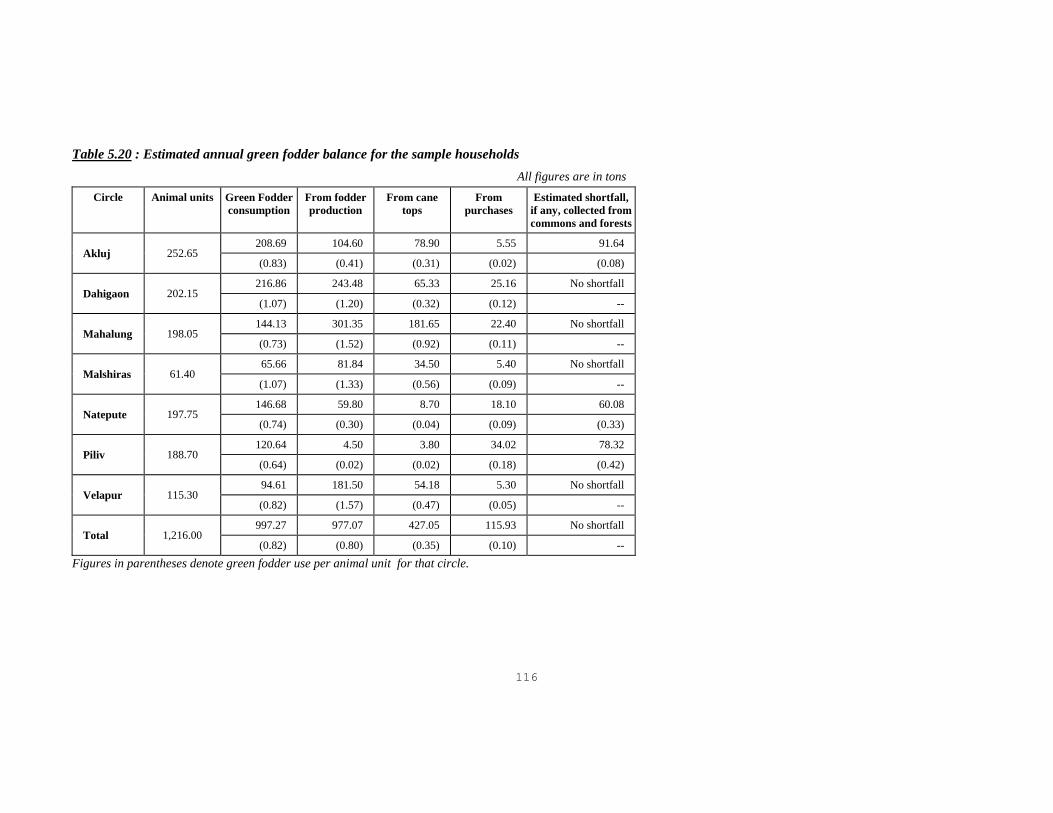
116
Table 5.20 : Estimated annual green fodder balance for the sample households All figures are in tons
Circle Animal units Green Fodder consumption
From fodder production
From cane tops
From purchases
Estimated shortfall, if any, collected from commons and forests
Akluj 252.65 208.69 104.60 78.90 5.55 91.64
(0.83) (0.41) (0.31) (0.02) (0.08)
Dahigaon 202.15 216.86 243.48 65.33 25.16 No shortfall
(1.07) (1.20) (0.32) (0.12) --
Mahalung 198.05 144.13 301.35 181.65 22.40 No shortfall
(0.73) (1.52) (0.92) (0.11) --
Malshiras 61.40 65.66 81.84 34.50 5.40 No shortfall
(1.07) (1.33) (0.56) (0.09) --
Natepute 197.75 146.68 59.80 8.70 18.10 60.08
(0.74) (0.30) (0.04) (0.09) (0.33)
Piliv 188.70 120.64 4.50 3.80 34.02 78.32
(0.64) (0.02) (0.02) (0.18) (0.42)
Velapur 115.30 94.61 181.50 54.18 5.30 No shortfall
(0.82) (1.57) (0.47) (0.05) --
Total 1,216.00 997.27 977.07 427.05 115.93 No shortfall
(0.82) (0.80) (0.35) (0.10) -- Figures in parentheses denote green fodder use per animal unit for that circle.

117
Table 5.21 : Estimated annual dry fodder balance for the sample households All figures are in tons
Circle Animal units Dry fodder consumption
From fodder residues
From non-crop land
From purchases
Estimated shortfall, if any collected from commons and forests
Akluj 252.65 125.83 195.80 13.45 39.15 No shortfall
(0.50) (0.77) (0.05) (0.15)
Dahigaon 202.15 56.47 393.77 4.20 15.40 No shortfall
(0.28) (1.95) (0.02) (0.08)
Mahalung 198.05 77.58 485.60 32.68 13.65 No shortfall
(0.39) (2.45) (0.16) (0.07)
Malshiras 61.40 28.19 120.58 5.20 19.40 No shortfall
(0.46) (1.96) (0.08) (0.32)
Natepute 197.75 105.07 210.50 22.11 31.60 No shortfall
(0.53) (1.06) (0.11) (0.16)
Piliv 188.70 95.04 103.25 22.08 58.00 No shortfall
(0.50) (0.55) (0.12) (0.31)
Velapur 115.30 33.83 226.70 1.30 13.20 No shortfall
(0.29) (1.97) (0.01) (0.11)
Total 1,216.00 521.99 1,736.18 101.02 190.40 No shortfall
(0.43) (1.43) (0.08) (0.16) Figures in parentheses denote dry fodder use per animal unit for that circle.

118
Table 5.22 : Estimated annual free grazing component All values in tons
Circles Akluj Dahigaon Mahalung Malshiras Natepute Piliv Velapur Total
Animal units 252.65 202.15 198.05 61.40 197.75 188.70 115.30 1,216.00
Dung produced 249.08 223.27 264.70 78.69 221.81 167.57 146.22 1351.34
(0.99) (1.10) (1.34) (1.28) (1.12) (0.89) (1.27) (1.11)
Dung (dry weight) 99.63 89.31 105.88 31.48 88.72 67.03 58.49 540.54
(0.39) (0.44) (0.53) (0.51) (0.45) (0.36) (0.51) (0.44)
Estimated fodder consumption (dry weight) 249.08 223.27 264.70 78.69 221.81 167.57 146.22 1351.34
(0.99) (1.10) (1.34) (1.28) (1.12) (0.89) (1.27) (1.11)
Green fodder consumption (gross weight) 208.69 216.86 144.13 65.66 146.68 120.64 94.61 997.27
(0.83) (1.07) (0.73) (1.07) (0.74) (0.64) (0.82) (0.82)
Green fodder consumption (dry weight) 104.35 108.43 72.06 32.83 73.74 60.32 47.30 498.64
(0.41) (0.54) (0.36) (0.53) (0.37) (0.32) (0.41) (0.41)
Dry fodder consumption (gross weight) 125.83 56.47 77.58 28.19 105.07 95.04 33.82 521.99
(0.50) (0.28) (0.39) (0.46) (0.53) (0.50) (0.29) (0.43)
Dry fodder consumption (dry weight) 100.66 45.17 62.06 22.55 84.05 76.03 27.06 417.59
(0.40) (0.22) (0.31) (0.37) (0.43) (0.40) (0.23) (0.34)
Feed and concentrates consumption (gross weight) 43.53 33.52 18.28 8.45 17.35 39.75 23.63 184.51
(0.17) (0.17) (0.09) (0.14) (0.09) (0.21) (0.20) (0.15)
Feed and concentrates consumption (dry weight) 39.18 30.16 16.45 7.61 15.62 35.78 21.27 166.05
(0.16) (0.15) (0.08) (0.12) (0.08) (0.19) (0.18) (0.14)
Estimated free grazing component (dry weight) 4.89 39.50 114.12 15.71 48.80None - 50.59 269.06
(0.02) (0.20) (0.58) (0.26) (0.25) - (0.44) (0.22)
Figures in parantheses denote values per animal unit for that circle.

119
Table 5.23 : Estimated annual dung use for the sample households
All values in tons
Circle Animal units Dung production Dung used for Dungcake
(dry weight)
Dung used for biogas
(dry weight)
Estimated dung use for manure
(dry weight) gross weight dry weight
Akluj 253 249.08 99.63 12.87 23.36 63.40
(0.99) (0.41) (0.05) (0.09) (0.25)
Dahigaon 202 223.27 89.31 3.88 10.51 74.92
(1.10) (0.44) (0.02) (0.05) (0.37)
Mahalung 198 264.70 105.88 20.88 4.42 80.59
(1.34) (0.53) (0.11) (0.02) (0.41)
Malshiras 61 78.69 31.48 4.56 -- 26.92
(1.28) (0.51) (0.07) -- (0.44)
Natepute 198 221.81 88.72 3.74 -- 84.98
(1.12) (0.45) (0.02) -- (0.53)
Piliv 189 167.57 67.03 10.00 -- 57.03
(0.89) (0.36) (0.05) -- (0.30)
Velapur 115 146.22 58.49 8.21 4.38 45.90
(1.27) (0.51) (0.07) (0.04) (0.40)
Total 1,216 1351.34 540.54 64.14 42.67 433.73
(1.11) (0.44) (0.05) (0.04) (0.36)
Figures in parantheses denote per animal unit values for that circle.

120
Table 5.24 : Estimated annual firewood balance for the sample population All figures in tons
Circle Population Annual wood fuel
consumption (T)
Annual firewood
purchase (T)
Annual firewood from non-crop land
Annual fuel from crop stalks and residue(T)
Estimated fuel extraction from commons and
forests (T)
Estimated fuel extraction from commons and forests (T dry)
Akluj 439.00 208.89 2.50 25.74 127.35 53.30 42.64
(0.48) (0.01) (0.06) (0.29) (0.12) (0.10)
Dahigaon 367.00 163.16 5.76 5.50 133.35 18.55 14.84
(0.44) (0.02) (0.01) (0.36) (0.05) (0.04)
Mahalung 314.00 135.16 11.66 37.95 243.64 None None
(0.43) (0.04) (0.12) (0.78) -- --
Malshiras 159.00 69.17 36.70 7.20 28.85 None None
(0.44) (0.23) (0.05) (0.18) -- --
Natepute 393.00 201.30 29.40 39.47 54.84 77.59 62.07
(0.51) (0.07) (0.10) (0.14) (0.20) (0.16)
Piliv 265.00 140.89 22.16 36.63 39.45 42.65 34.12
(0.53) (0.08) (0.14) (0.15) (0.16) (0.13)
Velapur 159.00 75.66 10.52 1.80 83.55 None None
(0.48) (0.07) (0.01) (0.53) -- --
Total 2,096.00 994.22 118.70 154.29 711.02 10.21 8.17
(0.47) (0.06) (0.07) (0.34) (0.00) (0.00)
Figures in parantheses denote per capita values for that circle.

121
Table 5.25 : Households reporting no electricity by circles for the sample households
Akluj Dahigaon Mahalung Malshiras Natepute Piliv Velapur Total
Households reporting no electricity 21 6 15 3 19 33 7 104
Total No. of households 53 48 51 26 50 52 26 306
% households reporting no electricity 40 13 29 12 38 63 27 34

122
Table 5.26 : Domestic electricity use by type of equipment and circles for the sample households
Equipment type
Akluj Dahigaon Mahalung Malshiras Natepute Piliv Velapur Total Total
Wattage (W)
Annual Electricity use (kWh)
Total Wattage
(W)
Annual Electricity use (kWh)
Total Wattage
(W)
Annual Electricity use (kWh)
Total Wattage
(W)
Annual Electricity use (kWh)
Total Wattage
(W)
Annual Electricity use (kWh)
Total Wattage
(W)
Annual Electricity use (kWh)
Total Wattage
(W)
Annual Electricity use (kWh)
Total Wattage
(W)
Annual Electricity use (kWh)
Electric bulbs 6,062.00 15,493.89 6,965.00 15,129.62 5,950.00 20,820.33 3,485.00 10,367.83 5,095.00 10,571.13 2,220.00 5,697.65 2,970.00 8,663.82 32,747.00 86,744.26
(23.83) (48.55) (18.15) (46.65) (21.46) (58.64) (19.22) (48.68) (19.06) (57.04) (30.96) (75.11) (14.92) (42.61) (20.03) (51.75)
Tubelights 480.00 744.60 680.00 1,080.40 440.00 525.60 900.00 1,379.70 520.00 350.40 200.00 438.00 530.00 781.10 3,750.00 5,299.80 (1.89) (2.33) (1.77) (3.33) (1.59) (1.48) (4.96) (6.48) (1.95) (1.89) (2.79) (5.77) (2.66) (3.84) (2.29) (3.16)
Energy saving lamps
-- -- -- -- -- -- 10.00 7.30 10.00 7.30 -- -- -- -- 20.00 14.60 -- -- -- -- -- -- (0.06) (0.03) (0.04) (0.04) -- -- -- -- (0.01) (0.01)
Electric irons 6,750.00 1,450.33 9,000.00 542.30 6,980.00 905.20 7,548.00 1,035.11 9,750.00 889.69 3,750.00 974.55 7,500.00 1,004.66 51,278.00 6,801.84
(26.53) (4.54) (23.45) (1.67) (25.18) (2.55) (41.63) (4.86) (36.48) (4.80) (52.30) (12.85) (37.69) (4.94) (31.37) (4.06)
Radios etc. 350.00 118.63 730.00 378.87 700.00 340.55 500.00 331.06 700.00 424.31 200.00 109.50 600.00 401.50 3,780.00 2,104.41 (1.38) (0.37) (1.90) (1.17) (2.53) (0.96) (2.76) (1.55) (2.62) (2.29) (2.79) (1.44) (3.02) (1.97) (2.31) (1.26)
TV, VCRs etc.
2,100.00 2,628.00 3,450.00 3,066.00 3,000.00 2,425.43 1,890.00 1,854.20 2,550.00 2,370.68 300.00 191.63 1,550.00 1,679.00 14,840.00 14,214.93 (8.25) (8.23) (8.99) (9.45) (10.82) (6.83) (10.42) (8.71) (9.54) (12.79) (4.18) (2.53) (7.79) (8.26) (9.08) (8.48)
Refrigerators 400.00 2,847.00 400.00 1,752.00 400.00 1,022.00 200.00 1,752.00 200.00 219.00 -- -- 200.00 1,022.00 1,800.00 8,614.00 (1.57) (8.92) (1.04) (5.40) (1.44) (2.88) (1.10) (8.23) (0.75) (1.18) -- -- (1.01) (5.03) (1.10) (5.14)
Geysers 4,000.00 2,920.00 10,000.00 4,015.00 6,000.00 2,920.00 2,000.00 2,190.00 4,000.00 1,460.00 -- -- 2,000.00 1,460.00 28,000.00 14,965.00
(15.72) (9.15) (26.06) (12.38) (21.65) (8.22) (11.03) (10.28) (14.97) (7.88) -- -- (10.05) (7.18) (17.13) (8.93)
Electric stoves
2,000.00 1,460.00 3,000.00 1,460.00 1,000.00 730.00 -- -- 2,000.00 730.00 -- -- 3,000.00 959.95 11,000.00 5,339.95 (7.86) (4.57) (7.82) (4.50) (3.61) (2.06) -- -- (7.48) (3.94) -- -- (15.08) (4.72) (6.73) (3.19)
Fans 2,700.00 4,161.00 3,750.00 4,982.25 3,000.00 5,803.50 1,200.00 2,381.63 1,500.00 1,500.15 300.00 164.25 1,350.00 4,352.63 13,800.00 23,345.40
(10.61) (13.04) (9.77) (15.36) (10.82) (16.34) (6.62) (11.18) (5.61) (8.09) (4.18) (2.17) (6.78) (21.40) (8.44) (13.93)
Mixers 600.00 91.25 400.00 28.47 200.00 5.11 400.00 -- 400.00 11.68 200.00 10.22 200.00 10.22 2,400.00 156.95 (2.36) (0.29) (1.04) (0.09) (0.72) (0.01) (2.21) -- (1.50) (0.06) (2.79) (0.13) (1.01) (0.05) (1.47) (0.09)
Total 25,442.00 31,914.69 38,375.00 32,434.90 27,720.00 35,506.84 18,133.00 21,298.82 26,725.00 18,534.34 7,170.00 7,585.80 19,900.00 20,334.88 163,465.00 167,610.26
(100.00) (100.00) (100.00) (100.00) (100.00) (100.00) (100.00) (100.00) (100.00) (100.00) (100.00) (100.00) (100.00) (100.00) (100.00) (100.00)
Figures in parentheses are percentage of wattage and annual electricity use for each item for each circle.

123
Table 5.27 : Number of pressure cookers, biogas plants and improved chulhas in the sample households
Name of villages No. of HH Pressure cookers
Biogas plants Improved chulhas
Tambewadi 26 11 4 4
Kalamboli 22 4 5 1
Dahigaon 48 15 9 5
Karunde 25 6 0 0
Pimpari 25 4 0 1
Natepute 50 10 0 1
Malshiras 26 9 3 1
Malshiras 26 9 3 1
Kusmod 27 0 0 2
Salmukhwadi 25 2 0 0
Piliv 52 2 0 2
Tondale 26 8 2 0
Velapur 26 8 2 0
Chakore 27 6 6 0
Bijwadi 26 7 2 0
Akluj 53 13 8 0
Khandali 26 11 4 1
Mire 25 2 0 0
Mahalung 51 13 4 1
Total 306 70 26 10

124
Table 5.28 : Status of biogas plants in sample households
Circle No. of plants No. of plants in use
No. reporting capacity
Combined capacity (Nm3)
No. of plants not in use
Expected cost of bringing into
use (Rs.)
Cost household ready to bear
(Rs.)
Akluj 8 6 6 36.00 2 6,000 2,500
Dahigaon 9 4 4 26.00 5 16,000 4,700
Mahalung 4 3 1 6.00 1 3,000 1,500
Malshiras 3 -- 3 49.00 3 6,000 2,500
Natepute -- -- -- -- -- -- --
Piliv -- -- -- -- -- -- --
Velapur 2 2 2 8.50 -- -- --
Total 26 15 16 125.50 11 31,000 11,200

125
Table 5.29 : Status of improved chulhas in sample households
Circle No. of chulhas
No. reporting inadequate information
No. in use
Akluj -- -- --
Dahigaon 5 2 1
Mahalung -- -- --
Malshiras 2 -- 1
Natepute 1 -- --
Piliv 2 -- 2
Velapur -- -- --
Total 10 2 4
Table 5.30 : User response to improved chulhas
Response Change in Smoke
Change in Fuel use
Change in cooking time
Large increase 1 1 1
Small increase -- 1 1
No change -- 1 --
Small decrease 2 1 --
Large decease 1 -- 2
No response -- -- --
Chulhas in use 4 4 4

126
Table 5.31 : Energy saving devices used in the sample households
Akluj Dahigaon Mahalung Malshiras Natepute Piliv Velapur Total
Improved lantern
No. -- -- -- 2 1 -- -- 3
No. in use -- -- -- 2 1 -- -- 3
Pressure cooker No. -- -- 1 -- -- -- -- 1
No. in use -- -- 1 -- -- -- -- 1
Solar cooker No. -- -- -- -- -- -- -- --
No. in use -- -- -- -- -- -- -- --
Energy saving lamp
No. -- -- -- -- 1 -- -- 1
No. in use -- -- -- -- 1 -- -- 1
Wick stove No. -- -- 1 -- -- -- -- 1
No. in use -- -- 1 -- -- -- -- 1

127
Solar batteries No. -- -- -- -- -- -- -- --
No. in use -- -- -- -- -- -- -- --
Total devices No. -- -- 2 2 2 -- -- 6
No. in use -- -- 2 2 2 -- -- 6

128
Table 5.32 : Use pattern of different energy saving devices in the sample households
No. of devices
No. in use In constant use
In use occasionally
Rarely in use
Used when power fails
use unspecified
Improved Lantern 3 3 1 -- -- 2 --
Pressure Cooker 1 1 1 -- -- -- --
Solar Cooker -- -- -- -- -- --
Energy Saving Lamp
1 1 1 -- -- -- --
Wick Stove -- -- -- -- -- -- --
Solar Batteries -- -- -- -- -- -- --

129
Table 5.33 : Reported number of establishments in the village and sample units by type of establishment
Establishment type
Akluj
Dahigaon
Mahalung
Malshiras
Natepute
Piliv
Velapur
Total
No. of units
reported
No. of units in sample
No. of units
reported
No. of units in sample
No. of units
reported
No. of units in sample
No. of units
reported
No. of units in sample
No. of units
reported
No. of units in sample
No. of units
reported
No. of units in sample
No. of units
reported
No. of units in sample
No. of units
reported
No. of units in sample
Artisanal establishments
7 2 8 1 15 2 65 2 4 1 2 0 6 0 107 8
Brick kilns 2 0 1 1 0 0 6 1 1 1 0 0 0 0 10 3
Flour and masala mills
8 2 6 3 17 4 35 2 11 3 4 2 2 1 83 17
Food products 0 0 1 1 6 3 71 2 1 0 0 0 0 0 79 6
Poultry and goatery
0 0 1 0 2 0 4 1 0 0 0 0 0 0 7 1
Shops and small establishments
32 2 26 3 52 7 276 11 27 1 21 1 14 2 448 27
Small industrial establishments
0 0 1 0 2 2 23 3 1 0 0 0 1 1 28 6
Total 49 6 44 9 94 18 480 22 45 6 27 3 23 4 762 68

130
Table 5.34 : Employment pattern in sample establishments by type of establishment
Establishment type
No. of units
Permanent Temporary Total
HH members Others HH members Others HH members Others
No. of persons
Person-days No. of persons
Person-days No. of persons
Person-days No. of persons
Person-days No. of persons
Person-days No. of persons
Person-days
Artisanal establishments
8 21 6,450 4 1,200 8 1,920 -- -- 29 8,370 4 1,200
Brick kilns 3 1 300 -- -- 7 1,260 25 3,750 8 1,560 25 3,750
Flour and masala mills
17 22 6,400 3 850 -- -- -- -- 22 6,400 3 850
Food products 6 10 2,695 10 2,365 3 1,095 -- -- 13 3,790 10 2,365
Poultry and goatery
1 1 365 1 365 -- -- -- -- 1 365 1 365
Shops & small establishments
27 31 9,931 82 17,596 -- -- 42 9,015 31 9,931 124 26,611
Small industrial establishments
6 5 1,500 5 1,400 5 525 -- -- 10 2,025 5 1,400
Total 68 91 27,641 105 23,776 23 4,800 67 12,765 114 32,441 172 36,541

131
Table 5.35 : Annual fuel use in sample establishments by type of fuel and type of establishment
Establishment type
Annual coal use (T)
Annual diesel use (kl)
Annual firewood use
(T)
Annual firewood
purchase (T)
Annual crop residue use (T)
Annual crop residue
purchase (T)
Annual dungcake use
(T)
Annual dungcake
purchase (T)
Annual LPG use (kg)
Annual kerosene use (kl)
Total lighting Heating
Artisanal establishments 0.05 -- 161.28 1.20 -- -- 0.40 0.30 -- 0.01 0.01 0.01
Brick kilns 1.63 -- 10.50 10.00 15.00 15.00 -- -- -- 0.08 0.06 0.02
Flour and masala mills -- 6.66 -- -- -- -- -- -- -- 0.48 0.06 2.58
Food products -- -- 35.20 31.04 -- -- -- -- -- 1.65 0.01 1.64
Poultry and goatery -- -- -- -- -- -- -- -- -- 2.70 -- --
Shops and small establishments -- 15.25 -- -- -- -- -- -- 1,363.00 0.76 0.22 0.06
Small industrial establishments 0.00 -- -- -- -- -- 115.40 10.95 -- 0.22 0.02 0.19
Total 1.69 21.91 206.98 42.24 15.00 15.00 115.80 11.25 1,363.00 5.90 0.39 4.49

132
Table 5.36 : Fuel value of annual fuel use in sample establishments by type of fuel and type of establishment All values in '000 kcal
Establishment type Annual coal use (T)
Annual diesel use (kl)
Annual firewood use
(T)
Annual firewood
purchase (T)
Annual crop residue use
(T)
Annual crop residue
purchase (T)
Annual dungcake use
(T)
Annual dungcake
purchase (T)
Annual LPG use (kg)
Annual kerosene use (kl) Total
Total lighting heating
Artisanal establishments 358.40 -- 645,120.00 4,800.00 -- -- 1,000.00 750.00 -- 96.00 40.00 40.00 646,574.40
Brick kilns 11,410.00 -- 42,000.00 40,000.00 37,500.00 37,500.00 -- -- -- 600.00 480.00 120.00 91,510.00
Flour and masala mills -- 53,280.00 -- -- -- -- -- -- -- 3,840.00 480.00 20,640.00 57,120.00
Food products -- -- 140,800.00 124,176.00 -- -- -- -- -- 13,200.00 112.00 13,088.00 154,000.00
Poultry and goatery -- -- -- -- -- -- -- -- -- 21,600.00 -- -- 21,600.00
Shops and small establishments -- 122,016.00 -- -- -- -- -- -- 16,356.00 6,096.00 1,776.00 480.00 144,468.00
Small industrial establishments 27.02 -- -- -- -- -- 288,500.00 27,375.00 -- 1,728.00 192.00 1,536.00 290,255.02
Total 11,795.42 175,296.00 827,920.00 168,976.00 37,500.00 37,500.00 289,500.00 28,125.00 16,356.00 47,160.00 3,080.00 35,904.00 1,405,527.42

133
Table 5.37 : Annual electricity use in sample establishments by type of establishment and type of equipment All values in kWh
Type of equipment
Artisanal establishments
Brick kilns Flour and masala mills
Food products Poultry and goatery
Shops & small establishments
Small industrial establishments
Total
Bulbs 192.84 720.00 2,570.55 1,001.90 788.40 6,082.68 307.20 11,663.57
(19.22) (26.33) (4.23) (36.01) (100.00) (15.57) (3.86) (10.14)
Tubelights 3.60 90.00 132.23 -- 6,757.20 36.00 7,019.03
(0.36) -- (0.15) (4.75) -- (17.29) (0.45) (6.10)
Motors -- 2,014.20 58,038.80 272.29 -- 17,456.40 783.30 78,564.99
-- (73.67) (95.62) (9.79) -- (44.67) (9.85) (68.29)
TV, etc. -- -- -- 53.98 -- 705.00 -- 758.98
-- -- -- (1.94) -- (1.80) -- (0.66)
Refrigerator -- -- -- 252.50 -- -- -- 252.50
-- -- -- (9.08) -- -- -- (0.22)
Fan -- -- -- 808.20 -- 6,120.00 -- 6,928.20
-- -- -- (29.05) -- (15.66) -- (6.02)
Tape recorder 90.00 -- -- 261.00 -- 15.00 -- 366.00
(8.97) -- -- (9.38) -- (0.04) -- (0.32)
Other 716.85 -- -- -- -- 1,942.80 6,825.90 9,485.55
(71.45) -- -- -- -- (4.97) (85.83) (8.25)
Total 1,003.29 2,734.20 60,699.35 2,782.10 788.40 39,079.08 7,952.40 115,038.82
(100.00) (100.00) (100.00) (100.00) (100.00) (100.00) (100.00) (100.00)

134
Table 5.38 : Table of parameters and conversion factors
Wattage
Unspecified filament lamp 60 W
Unspecified tubelight 40 W
CFL 9 W
Electric iron 750 W
Radio, etc. 50 W
TV, VCR, etc. 150 W
Fridge 200 W
Geyser 1000 W
Fan 150 W
Mixer 200 W
Fuel Values
Firewood 4000 kcal/kg
Dungcake 2500 kcal/kg
Kerosene 8000 kcal/kg
Coal 7000 kcal/kg
LPG 12000 kcal/kg
Diesel 8000 kcal/kg
Biogas 4700 kcal/Nm3
Efficiencies
Traditional chulha 10%
Improved chulha 25%
Biogas stove 60%
Kerosene stove 45%
Improved kerosene stove 65%
LPG stove 65%
Moisture content
Firewood 20%
Dungcake 10%
Green fodder 50%
Fresh dung 60%
Dry fodder 80%

135
Chapter 6 Energy Consumption Scenario for Malshiras Block
In this chapter a scenario is developed for the purposes of estimation of the energy needs of
Malshiras block for the next 10 years. This scenario, which we shall call the BAU scenario (short
for `business as usual'), is based on present trends which are expected to continue so far as there
are no significant interventions aimed at affecting these trends. This scenario serves as the
reference point for developing an IREP plan, which will aim at modifying some of the BAU
trends in order to arrive at a more sustainable pattern of energy use. How energy saving options
will modify this scenario is developed and detailed in the next chapter.
6.1 Population projections Population projections are based on the average trend for the last three decennial trends. This
shows a decennial increase of 19.35%. Based on these trends, the population projections are as
follows:
Year Population
2010 527,228
2005 473,465
2000 425,184
1991 350,346
The projections show that the total population and the total number of households would be about
473,465 and 84,776 respectively in 2005. These figures are expected to rise to 527,228 and
94,402 respectively by the year 2010. Annual projections are given in Table 6.1.
6.2 Domestic fuel use Domestic fuel use has been estimated on the basis of the survey findings presented in Chapter 5.
For the purposes of the BAU scenario, it has been assumed that the consumption levels and the
fuel composition are constant.

136
Domestic fuel use projections for firewood, dungcake, kerosene, LPG and biogas have been
presented in Tables 6.2, 6.3 and 6.4. Besides fuel use, the calorific value of fuel use and estimated
useful heat delivered are also important. These projections have been estimated in terms of actual
fuel use, fuel value and delivered useful heat in the three tables, respectively.
Table 6.2 shows that in the year 2005 Malshiras block would require 224,580 T of firewood,
14,490 T of dungcake, 5,110 kl kerosene, 680 T LPG, and 5,210 MNm3 to meet its domestic fuel
needs. The projections for the year 2010 indicate that the requirements would increase to 250,090
T (firewood), 16,130 T (dungcake), 5,690 kl (kerosene), 760 T (LPG), and 5,800 MNm3 (biogas).
6.3 Domestic and commercial electricity supply needs Estimation of domestic electric supply needs at the block level is compounded by many factors.
Firstly, MSEB categorisation of domestic electricity is not coterminous with household
consumption. It often includes small establishments and offices. Secondly, though Malshiras
block has been technically classified as fully rural, there are distinct semi-urban sectors in the
block. For example, even though the Taluka headquarters of Malshiras and some of the villages
like Akluj have been technically classed as rural, both of them have a strong urbanised sector.
However, this factor has to a certain extent, been taken care of because Malshiras village has been
included in the sample itself. Thirdly, these `semi-urban' sectors include industrial establishments,
which cannot be treated on a sampling basis in the same way. Fourthly, an allowance has to be
made for the transmission and distribution losses, which in the rural areas can be very high.
Lastly, there is the problem of unauthorised drawal of electricity, which can also be significant.
For an estimation of these factors, we have preferred to lump together the industrial, commercial
and domestic sectors as reported by MSEB in order to compare it with the survey data. The
aggregation of the data on an assumption of 20% T&D losses leads us to an estimate of 4.6% of
the total consumption being accounted for by the semi-urban sector. (Table 6.7). The reason for
this low figure for the semi-urban sector is that, as mentioned earlier, Malshiras -- the most
urbanised village and the Taluka headquarter -- has been included in the sample.
For purposes of the BAU, therefore, it is assumed that the ratio of electricity supply and the
present domestic and small rural establishment electricity use is constant. Consumption is
assumed to grow in proportion to the population increase along with a projected per household
increase of 20% over the decade, leading to a pro-rata increase in electric supply needs.
The projections for domestic and small rural establishment electricity supply are presented in
Tables 6.5, 6.6 and 6.7. Table 6.5 shows that the projected annual domestic electricity use for all
the domestic electric equipment and gadgets together would be 25,722,537 kWh and 31,377,183
kWh for years 2005 and 2010 respectively.

137
According to Table 6.6 the projected annual electricity use by small rural establishments for the
block would be 17,195,898 kWh and 19,148,541 kWh for the years 2005 and 2010 respectively.
The projected annual electricity supply need for rural household consumption, small rural
establishment consumption and the consumption needs of the semi-urban sector together comes to
58,253,975 kWh and 71,060,085 kWh for the years 2005 and 2010 respectively. (Table 6.7).
6.4 Agriculture Projections for the agriculture sector need to be based on projection of present trends in
agriculture. The main determinant for the BAU scenario for agriculture in Malshiras block is
assumed to be the extent of irrigation and the extent of fallow land being brought under cropped
land. The trend indicates that irrigation is getting extended (and would continue to increase
because of the further utilisation of water from the Krishna basin (Bhima is part of Krishna basin)
because of the Krishna Water Tribunal Award and the specially set-up Krishna Valley
Development Corporation as it is keen to utilise the share of Maharashtra as quickly as possible.
The other important emerging trend is that people are bringing in more and more fallow (both
current and permanent) under cultivation. Thus the increase in cropped land is going to be at the
expense of the fallow lands and also to some extent the commons. We have assumed that in the
next 10 years nearly half of the present fallow lands would be brought under cultivation. Thus the
net cropped area would get increased by 50% of the present fallow land. The projected irrigated
area would thus constitute of the present irrigated area, plus an equivalent area (50% of the
present fallow) that would be brought under cultivation and another 20% of this to take care of the
trend so far.

138
Projections for irrigated and unirrigated area are presented in Table 6.8. According to this table
the gross cropped area would be about 134,264 ha and 138,941 ha in the years 2005 and 2010
respectively. The projected gross irrigated area for these years would be 59,064 ha and 63,244 ha
respectively. The projections for unirigated area come to 75,199 ha and 75697 ha for the years
2005 and 2010 respectively.
6.5 Animal power and equipment use in agriculture Animal power and equipment use is assumed to be proportional to gross cropped area. Estimates
for the year 2000 are estimated on the basis of reported data. These are then extrapolated for later
years according to projected gross cropped area.
Projections for animal power and equipment use are presented in Tables 6.9 and 6.10. Table 6.9
gives the projected annual draught power use in agricultural operations and transport for the next
ten years. The table also gives the break-up between owned and rented animals supplying draught
power. The table indicates that the total draught power required for both agricultural operations
and transport together would be 2,969,902 and 3,073,360 bullocks-days for the years 2005 and
2010 respectively.
The projected annual tractor use for both agricultural operations and transport would be 2,426,864
and 2,511,404 equipment hours for the years 2005 and 2010 respectively. The projected thresher
use would be 270,440 and 279,861 equipment hours respectively (Table 6.10).
6.6 Pumping energy We have taken the data of 1998-99 as the basis for estimating the pumping energy requirements
for 2000 to 2010. This is mainly because the statistics reported in the socio-economic abstracts for
more recent years for the block in respect of number of electrical pumpsets seem to be
inconsistent. The inconsistencies are of the order of 2 or 3 times specially in the case of number
electrical motors for the recent years. The data for 1998-99 give both the total irrigated area and
the number of pumpsets and the area irrigated by wells. So we have taken the proportionate share
of irrigation by wells in the total irrigated area to estimate the number of irrigation pumpsets. In
1998-99 the total number of pumpsets were 3,075 and the irrigated areas was 36,262 ha. In the
year 2000 the estimated irrigation area is 53,798 and on the basis of this the estimated number of
pumpsets is 4,562. Thus, the estimates for the year 2000 are thus worked out on the basis of a
capacity equivalent to 4,562 pumpsets. On this assumption, the estimated pumping energy
consumed by electrical pumpsets for the year 2000 works out to 2,878.98 x 4562 = 13,133,906
kWh.

139
Later projections are related to the increase in irrigated area and all increase in pumping energy
consumption is assumed to come from electrical pumpsets and is assumed to be proportional to
increase in gross irrigated area. These projections are presented in Table 6.11. According to this
table the projected electricity consumption by agricultural pumpsets would 14,419,471 kWh and
15,439,824 kWh for the years 2005 and 2010 respectively.
6.7 Pressure on the forests, commons and wastelands The largest utilised renewable energy resource in the area is biomass and we need to assess the
different components of the biomass balance and determine what their implications are. As in the
earlier chapter, balances are worked out to determine the pressure on forests, commons and
wasteland.
This needs estimates of production for the fodder and fuel components from different sources as
well as an estimate of the livestock and other animal population and their requirements. For the
purposes of the BAU scenario, the projected irrigated area assessments are combined with the
district and survey productivity figures to arrive at estimates of fodder and fuel availability.
Growth of livestock in terms of animal units is assumed to keep pace with the growth of gross
irrigated area and fodder needs as well as dung availability are calculated on those counts.
Projected livestock fodder needs and dung availability are presented in Table 6.12, and the
biomass fuel and green and dry fodder balances and the estimated free grazing components are
presented in Tables 6.13, 6.14, 6.15 and 6.16 respectively.
According to Table 6.12 the projected number of animal units for the years 2005 and 2010 would
be 230,638 and 238,672 respectively. The projected green fodder, dry fodder, feed and
concentrates requirement would be 189,152 T, 99,006 T and 34,995 T for the year 2005 and
195,741 T, 102,455 T and 36,214 T for the year 2010 respectively. The projected dung production
for these years would be 256,308 T and 265,236 T respectively.
Table 6.13 shows that the projected annual firewood collection from non-crop land, commons and
forest would be 100,480 T and 116,980 T for the years 2005 and 2010 respectively. According to
Table 6.14 there would not be any shortfall. The same is the case with dry fodder (Table 6.15).
The projected estimate for the free grazing component is given in Table 6.16. As per this table the
projected free grazing component would be to the tune of 51,030 T and 52,810 T respectively for
the years 2005 and 2010.
6.8 Annual increment and accumulated stock Table 6.17 shows that the pressure on the commons is of the order of 4.35 T/ha at the moment,
and is likely to increase to about 5.5 T/ha in the next ten years according to the BAU scenario. Of

140
this projected 5.5 T/ha extraction rate, about 3.78 T/ha constitutes the firewood component and
1.72 T/ha constitutes the fodder component of extraction. The fodder component comes almost
solely out of the annual biomass increment, and though it does affect subsequent growth potential,
it does not cut into accumulated stock. The firewood component however need not come from the
annual increment. In view of the fact that unmanaged stands would rarely show productivities
greater than 12 kg/ha-mm of water use and that in degraded conditions actual water use is likely
to be of the order of 200 to 250 mm, we have an annual estimated increment of 2.5 to 3 T/ha. This
indicates that we are cutting into accumulated biomass stock at the rate of about 2.5 T/ha,
certainly a situation that calls for urgent rectification measures.
6.9 Total domestic and rural establishment energy consumption The total energy consumption by rural households and small rural establishments is summarised
in Table 6.18. The table makes it quite clear that firewood (inclusive of brushwood and small
shrubs) forms the major component of the aggregated energy equivalent of their fuel use.
Dungcake comes next followed by biogas. Fossil fuels are as yet not a major component of the
total fuel value used by rural establishments. This is a double edged situation, even while the high
extraction rates of biomass derived materials from the ecosystem present an immediate danger to
the integrity of the ecosystem, at the same time it presents an opportunity of modifying,
optimising and restructuring biomass use to fulfil livelihood needs for the rural population.
6.10 Solar energy Solar energy, as elsewhere in most of India is the most abundant source of renewable energy.
However it is marred by the same variability which has proved to be the bane of solar energy
development, especially for the domestic sector.
Solar energy has not been monitored anywhere in Malshiras block. The closest figures available
are for the Pune region. The available data are summarised in Tables 6.19, 6.20 and 6.21. The data
incidentally, are from a study that compares theoretically calculated and observed values and
show that even though the agreement between them is quite close for global radiation, it is
variable in case of diffuse radiation, showing a variation of up to 25% in some months.
Except for July and August, values for global radiation are above 5kWh/sq.m. /day, which shows
that there is good potential for solar energy. The mean daily hours of sunshine however are not
very well distributed and are consistently low for the four monsoon months.
Harnessing of solar energy would however require a different approach towards renewable
sources, which is described in the next chapter.

141
6.11 Wind energy Wind energy is not being monitored at any site in Malshiras as part of the study of wind energy
sites being taken up all over Maharashtra. So there is no data available to assess the potential for
wind energy in the block. Even if any future study indicates wind energy potential or partial
potential for the block (on any site in the block) we would advocate a hybridisation approach in
harnessing that potential. For this, see Datye (1997) and Paranjape and Joy (1995).
6.12 Hydro power Malshiras block being situated in the drought-prone region, the annual rainfall is only about 500
mm. Analysis of the rainfall series data shows that there would not be significant dependable
flows within the block. The terrain of the block is also relatively flat. Thus, Malshiras block will
not have a significant hydro potential.
Table 6.1 : Projected population and households for Malshiras block (2000 to 2010)
Year Population Households
1991 350,346 62,731
2000 425,184 76,131
2001 434,429 77,786
2002 443,875 79,478
2003 453,527 81,206
2004 463,389 82,972
2005 473,465 84,776
2006 483,760 86,619
2007 494,279 88,503
2008 505,026 90,427
2009 516,008 92,393
2010 527,228 94,402

142
Table 6.2 : Projected annual domestic fuel use for Malshiras block (2000 To 2010)
Year Firewood ('000 T)
Dungcake ('000 T)
Kerosene ('000 kl)
LPG ('000 T)
Biogas ('000 MNm3)
2000 201.68 13.01 4.58 0.61 4.68
2001 206.07 13.29 4.68 0.63 4.78
2002 210.55 13.58 4.79 0.64 4.89
2003 215.13 13.88 4.89 0.65 4.99
2004 219.81 14.18 5.00 0.67 5.10
2005 224.58 14.49 5.11 0.68 5.21
2006 229.47 14.80 5.22 0.70 5.32
2007 234.46 15.13 5.33 0.71 5.44
2008 239.56 15.45 5.45 0.73 5.56
2009 244.76 15.79 5.56 0.74 5.68
2010 250.09 16.13 5.69 0.76 5.80
Table 6.3 : Fuel value of projected annual domestic fuel use for Malshiras block (2000 to 2010)
All values in '000 Mkcal Year Firewood Dungcake Kerosene LPG Biogas Total
2000 806.73 32.53 36.68 7.36 21.99 905.29
2001 824.27 33.23 37.48 7.52 22.47 924.97
2002 842.20 33.96 38.29 7.68 22.96 945.08
2003 860.51 34.70 39.12 7.85 23.46 965.63
2004 879.22 35.45 39.97 8.02 23.97 986.63
2005 898.34 36.22 40.84 8.19 24.49 1,008.09
2006 917.87 37.01 41.73 8.37 25.02 1,030.01
2007 937.83 37.81 42.64 8.55 25.57 1,052.40
2008 958.22 38.64 43.57 8.74 26.12 1,075.29
2009 979.06 39.48 44.51 8.93 26.69 1,098.67
2010 1,000.35 40.33 45.48 9.12 27.27 1,122.56

143
Table 6.4 : Delivered useful heat of projected annual domestic fuel use for Malshiras block (2000 To 2010)
All values in'000 Mkcal Year Firewood Dungcake Kerosene LPG Biogas Total
2000 80.67 3.25 16.51 4.78 13.20 118.41
2001 82.43 3.32 16.86 4.89 13.48 120.98
2002 84.22 3.40 17.23 4.99 13.78 123.61
2003 86.05 3.47 17.61 5.10 14.08 126.30
2004 87.92 3.55 17.99 5.21 14.38 129.05
2005 89.83 3.62 18.38 5.32 14.69 131.85
2006 91.79 3.70 18.78 5.44 15.01 134.72
2007 93.78 3.78 19.19 5.56 15.34 137.65
2008 95.82 3.86 19.60 5.68 15.67 140.64
2009 97.91 3.95 20.03 5.80 16.01 143.70
2010 100.03 4.03 20.47 5.93 16.36 146.83

144
Table 6.5 : Projected annual domestic electricity use by households for Malshiras block (2000 to 2010) All values in kWh
Year Electric bulbs
Tubelights Energy saving lamps
Electric irons
Radios etc. TV, tape recorders, VCRs etc.
Refrigerators Geysers Electric stoves
Fans Mixers Total
2000 12,194,702 919,602 2,962 489,113 426,889 2,883,567 1,140,247 888,504 935,151 1,649,514 31,838 21,086,943
2001 12,689,112 956,885 3,082 508,944 444,197 3,000,475 1,186,476 924,527 973,065 1,716,390 33,129 21,941,871
2002 13,203,567 995,680 3,207 529,578 462,206 3,122,123 1,234,579 962,010 1,012,516 1,785,978 34,472 22,831,461
2003 13,738,879 1,036,048 3,337 551,048 480,945 3,248,703 1,284,633 1,001,013 1,053,566 1,858,387 35,870 23,757,117
2004 14,295,894 1,078,053 3,472 573,389 500,444 3,380,416 1,336,716 1,041,597 1,096,281 1,933,732 37,324 24,720,301
2005 14,875,493 1,121,760 3,613 596,636 520,733 3,517,468 1,390,910 1,083,826 1,140,727 2,012,131 38,837 25,722,537
2006 15,478,590 1,167,240 3,759 620,826 541,845 3,660,077 1,447,302 1,127,768 1,186,976 2,093,709 40,412 26,765,405
2007 16,106,138 1,214,563 3,912 645,996 563,813 3,808,467 1,505,980 1,173,491 1,235,099 2,178,594 42,050 27,850,555
2008 16,759,129 1,263,805 4,070 672,187 586,672 3,962,874 1,567,037 1,221,068 1,285,174 2,266,921 43,755 28,979,700
2009 17,438,595 1,315,044 4,235 699,439 610,458 4,123,540 1,630,569 1,270,574 1,337,279 2,358,828 45,529 30,154,624
2010 18,145,608 1,368,359 4,407 727,796 635,207 4,290,721 1,696,678 1,322,086 1,391,496 2,454,462 47,375 31,377,183

145
Table 6.6 : Projected annual electricity use by small rural establishments for Malshiras block (2000 to 2010) All values in kWh
Year Electric bulbs Tubelights Motors TVs, tape recorders, etc.
Refrigerators Fans Other Total
2000 2,182,200 1,188,487 12,057,566 77,618 53,548 53,548 2,011,606 15,442,372
2001 2,229,650 1,214,329 12,319,748 79,306 54,712 54,712 2,055,346 15,778,153
2002 2,278,132 1,240,734 12,587,630 81,030 55,902 55,902 2,100,038 16,121,236
2003 2,327,668 1,267,713 12,861,338 82,792 57,117 57,117 2,145,702 16,471,779
2004 2,378,281 1,295,278 13,140,997 84,592 58,359 58,359 2,192,358 16,829,944
2005 2,429,995 1,323,443 13,426,737 86,432 59,628 59,628 2,240,029 17,195,898
2006 2,482,833 1,352,220 13,718,690 88,311 60,925 60,925 2,288,737 17,569,808
2007 2,536,820 1,381,623 14,016,992 90,231 62,250 62,250 2,338,504 17,951,849
2008 2,591,981 1,411,665 14,321,780 92,193 63,603 63,603 2,389,353 18,342,197
2009 2,648,341 1,442,361 14,633,195 94,198 64,986 64,986 2,441,307 18,741,033
2010 2,705,927 1,473,724 14,951,382 96,246 66,399 66,399 2,494,391 19,148,541

146
Table 6.7 : Projected annual electricity supply need for domestic and non-agricultural sector for Malshiras block (2000 to 2010) All values in kWh
Year Rural household consumption
Small rural establishment consumption
Semi-urban sector
Estimated supply need
2000 21,086,943 15,442,372 1,675,261 47,755,721
2001 21,941,871 15,778,153 2,033,480 49,691,881
2002 22,831,461 16,121,236 2,412,534 51,706,539
2003 23,757,117 16,471,779 2,813,406 53,802,877
2004 24,720,301 16,829,944 3,237,120 55,984,207
2005 25,722,537 17,195,898 3,684,746 58,253,975
2006 26,765,405 17,569,808 4,157,399 60,615,766
2007 27,850,555 17,951,849 4,656,245 63,073,311
2008 28,979,700 18,342,197 5,182,496 65,630,492
2009 30,154,624 18,741,033 5,737,422 68,291,349
2010 31,377,183 19,148,541 6,322,344 71,060,085

147
Table 6.8 : Projected gross irrigated area for Malshiras block (2000 To 2010) All values in hectares
Year Gross Irrigated area
Unirrigated area
Gross Cropped area
Double Cropped
area
Net cropped area
2000 53,798.59 74,572.26 128,370.85 15,371.03 112,999.83
2001 54,951.28 74,709.49 129,660.76 15,700.37 113,960.40
2002 56,051.91 74,840.51 130,892.42 16,014.83 114,877.59
2003 57,102.84 74,965.62 132,068.46 16,315.10 115,753.37
2004 58,106.31 75,085.08 133,191.40 16,601.80 116,589.59
2005 59,064.47 75,199.15 134,263.62 16,875.56 117,388.06
2006 59,979.36 75,308.07 135,287.42 17,136.96 118,150.46
2007 60,852.93 75,412.06 136,264.99 17,386.55 118,878.44
2008 61,687.05 75,511.36 137,198.42 17,624.87 119,573.55
2009 62,483.51 75,606.18 138,089.69 17,852.43 120,237.26
2010 63,244.00 75,696.71 138,940.71 18,069.71 120,871.00

148
Table 6.9 : Projected annual draught power for Malshiras block (2000 To 2010) All values in bullock days
Year Agricultural operations Transport Total
Owned Rented Owned Rented Owned Rented
2000 1,322,150 657,732 652,423 207,250 1,974,573 864,982
2001 1,335,435 664,341 658,979 209,332 1,994,414 873,673
2002 1,348,121 670,652 665,239 211,321 2,013,359 881,973
2003 1,360,233 676,678 671,216 213,219 2,031,449 889,897
2004 1,371,799 682,431 676,923 215,032 2,048,722 897,463
2005 1,382,842 687,925 682,372 216,763 2,065,214 904,688
2006 1,393,387 693,171 687,576 218,416 2,080,962 911,587
2007 1,403,455 698,179 692,544 219,994 2,095,999 918,174
2008 1,413,069 702,962 697,288 221,501 2,110,357 924,463
2009 1,422,249 707,529 701,818 222,940 2,124,066 930,469
2010 1,431,014 711,889 706,143 224,314 2,137,157 936,203

149
Table 6.10 : Projected annual mechanical agricultural equipment use for Malshiras block (2000 To 2010) All values in equipment hours
Year
Tractor Thresher
Agricultural operations Transport Total Total use
owned rented in owned rented in owned rented in owned rented in
2,000 1,217,935 251,688 545,062 27,823 1,782,268 538,082 2,320,350 19,270 258,570
2,001 1,230,173 254,217 550,539 28,103 1,800,176 543,489 2,343,665 19,464 261,169
2,002 1,241,859 256,632 555,769 28,370 1,817,276 548,651 2,365,928 19,648 263,649
2,003 1,253,017 258,938 560,762 28,625 1,833,604 553,581 2,387,185 19,825 266,018
2,004 1,263,671 261,140 565,530 28,868 1,849,195 558,288 2,407,483 19,994 268,280
2,005 1,273,844 263,242 570,083 29,101 1,864,081 562,782 2,426,864 20,154 270,440
2,006 1,283,557 265,249 574,430 29,322 1,878,295 567,074 2,445,369 20,308 272,502
2,007 1,292,832 267,166 578,581 29,534 1,891,868 571,171 2,463,039 20,455 274,471
2,008 1,301,688 268,996 582,544 29,737 1,904,827 575,084 2,479,911 20,595 276,351
2,009 1,310,144 270,743 586,329 29,930 1,917,201 578,820 2,496,021 20,729 278,147
2,010 1,318,218 272,412 589,942 30,114 1,929,017 582,387 2,511,404 20,857 279,861

150
Table 6.11 : Projected annual electricity consumption by agricultural pumpsets for Malshiras block (2000 To 2010)
All values in kWh Year Elecricity consumption
by agricultural pumpsets
2000 13,133,907
2001 13,415,313
2002 13,684,012
2003 13,940,577
2004 14,185,555
2005 14,419,471
2006 14,642,824
2007 14,856,090
2008 15,059,726
2009 15,254,165
2010 15,439,824 Table 6.12 : Projected livestock population, annual fodder and feed needs and dung
availability for Malshiras block (2000 To 2010)
Year Animal units (#)
Green fodder(T)
Dry fodder (T)
Feed and concentrates
(T)
Dung (T)
2000 220,515 180,850 94,660 33,459 245,058
2001 222,731 182,667 95,612 33,795 247,521
2002 224,847 184,403 96,520 34,116 249,872
2003 226,867 186,059 97,387 34,423 252,117
2004 228,796 187,641 98,215 34,715 254,261
2005 230,638 189,152 99,006 34,995 256,308
2006 232,397 190,594 99,761 35,262 258,262
2007 234,076 191,971 100,481 35,517 260,128
2008 235,679 193,286 101,170 35,760 261,910
2009 237,210 194,542 101,827 35,992 263,612
2010 238,672 195,741 102,455 36,214 265,236

151
Table 6.13 : Projected domestic firewood balance for Malshiras block (2000 To 2010) All values in '000 T
Year Annual firewood
consumption
Annual Firewood purchase
Annual firewood from crop residue
Annual firewood
from non-crop land
Estimated annual firewood
collection from commons and
forests
Estimated annual firewood
collection from commons and
forests (dry wt.)
2000 201.68 24.08 59.12 10.74 107.74 86.19
2001 206.07 24.60 60.11 10.26 111.10 88.88
2002 210.55 25.14 61.06 9.79 114.56 91.65
2003 215.13 25.68 61.96 9.35 118.13 94.51
2004 219.81 26.24 62.82 8.93 121.81 97.45
2005 224.58 26.81 63.64 8.53 125.60 100.48
2006 229.47 27.40 64.43 8.14 129.50 103.60
2007 234.46 27.99 65.18 7.78 133.51 106.81
2008 239.56 28.60 65.90 7.43 137.63 110.11
2009 244.76 29.22 66.58 7.09 141.87 113.50
2010 250.09 29.86 67.23 6.77 146.23 116.98 Table 6.14 : Projected green fodder balance for Malshiras block (2000 To 2010)
All values in '000 T Year Green fodder
requirement From fodder production
and cane tops
Annual purchase
Estimated shortfall collected
from commons and forests
Estimated shortfall collected
from commons and forests (dry
weight
2000 180.85 285.71 21.02 None None
2001 182.67 291.61 21.23 None None
2002 184.40 297.24 21.44 None None
2003 186.06 302.62 21.63 None None
2004 187.64 307.75 21.81 None None
2005 189.15 312.65 21.99 None None
2006 190.59 317.33 22.16 None None
2007 191.97 321.80 22.32 None None
2008 193.29 326.07 22.47 None None
2009 194.54 330.14 22.61 None None
2010 195.74 334.04 22.75 None None

152
Table 6.15 : Projected dry fodder balance for Malshiras block (2000 To 2010) All values in '000 T
Year Dry fodder requirement
From crop residues
From non crop area
From purchase Estimated shortfall collected
from commons
Estimated shortfall collected
from commons (dry biomass)
2000 94.66 162.13 7.03 35.28 None None
2001 95.61 162.83 6.71 35.64 None None
2002 96.52 163.50 6.41 35.98 None None
2003 97.39 164.14 6.12 36.30 None None
2004 98.22 164.75 5.84 36.61 None None
2005 99.01 165.33 5.58 36.90 None None
2006 99.76 165.89 5.33 37.18 None None
2007 100.48 166.42 5.09 37.45 None None
2008 101.17 166.92 4.86 37.71 None None
2009 101.83 167.41 4.64 37.95 None None
2010 102.45 167.87 4.43 38.19 None None

153

154
Table 6.16 : Projected estimate for free grazing component in Malshiras block (2000 to 2010)
Animal units in #, all other values in '000 T Year Animal units Dung
(gross wt.) Dung
(dry wt.) Estimated
fodder cons. (dry wt.)
Green fodder cons. (gross wt.)
Green fodder cons.
(dry wt.)
Dry fodder cons.
(gross wt.)
Dry fodder cons.
(dry wt.)
Feed and concentrates (gross wt.)
Feed and concentrates
(dry wt.)
Estimated free grazing component
(dry wt.)
2000 220.52 245.06 98.02 245.06 180.85 90.43 94.66 75.73 33.46 30.11 48.79
2001 222.73 247.52 99.01 247.52 182.67 91.33 95.61 76.49 33.80 30.42 49.28
2002 224.85 249.87 99.95 249.87 184.40 92.20 96.52 77.22 34.12 30.70 49.75
2003 226.87 252.12 100.85 252.12 186.06 93.03 97.39 77.91 34.42 30.98 50.20
2004 228.80 254.26 101.70 254.26 187.64 93.82 98.22 78.57 34.72 31.24 50.62
2005 230.64 256.31 102.52 256.31 189.15 94.58 99.01 79.20 34.99 31.50 51.03
2006 232.40 258.26 103.30 258.26 190.59 95.30 99.76 79.81 35.26 31.74 51.42
2007 234.08 260.13 104.05 260.13 191.97 95.99 100.48 80.39 35.52 31.96 51.79
2008 235.68 261.91 104.76 261.91 193.29 96.64 101.17 80.94 35.76 32.18 52.15
2009 237.21 263.61 105.44 263.61 194.54 97.27 101.83 81.46 35.99 32.39 52.49
2010 238.67 265.24 106.09 265.24 195.74 97.87 102.45 81.96 36.21 32.59 52.81

155
Table 6.17 : Projected estimate of pressure on the forest, commons and wastelands for Malshiras block (2000 to 2010)
Year Firewood dry wt ('000T)
Free grazing dry wt ('000T)
Total extraction dry wt ('000T)
Estimated area of commons
(ha)
Extraction rate dry wt (T/ha)
2000 86.19 48.79 134.98 31,000 4.35
2001 88.88 49.28 138.16 31,001 4.46
2002 91.65 49.75 141.40 31,002 4.56
2003 94.51 50.20 144.70 31,003 4.67
2004 97.45 50.62 148.07 31,004 4.78
2005 100.48 51.03 151.51 31,005 4.89
2006 103.60 51.42 155.02 31,006 5.00
2007 106.81 51.79 158.60 31,007 5.11
2008 110.11 52.15 162.25 31,008 5.23
2009 113.50 52.49 165.98 31,009 5.35
2010 116.98 52.81 169.79 31,010 5.48
Table 6.18 : Summary for various kinds of energy use for Malshiras block (2000)
Kinds of energy use
Units Total Annual Consumption
Energy equivalent Percentage
'000 Mkcal '000 GJ
Firewood '000 T 201.68 806.73 3,372.14 84.77
Dungcake '000 T 13.01 32.53 135.97 3.42
Kerosene '000 kl 4.58 3.67 15.33 0.39
LPG '000 T 0.61 7.36 30.75 0.77
Biogas MNm3 4.68 21.99 91.93 2.31
Diesel '000 kl 2.03 16.24 67.88 1.71
Electricity MU 51.34 44.14 184.53 4.64
Bullocks '000 days 3,070.00 11.86 49.57 1.25
Total 951.72 3948.11 100.00

156

157
Table 6.19 : Comparison of computed and observed values of global solar radiation for Pune region
Jan Feb Mar Apr May Jun Jul Aug Sept Oct Nov Dec
Calculated 5.32 6.10 6.53 6.91 6.99 5.74 4.57 4.68 5.19 5.60 5.35 5.03
Observed 5.30 6.17 6.81 7.16 7.30 5.88 4.54 4.58 5.31 5.67 5.24 4.93
% Diff. 0.4 1.1 4.1 3.5 4.3 2.4 0.7 2.2 2.3 1.2 2.1 2.0
Source : Mani, A. and Rangarajan S., Solar radiation over India
Table 6.20 : Comparison of computed and observed values of diffuse solar radiation for Pune region
Jan Feb Mar Apr May Jun Jul Aug Sept Oct Nov Dec
Calculated 1.23 1.32 1.83 2.11 2.29 3.21 3.37 3.37 3.02 2.18 1.51 1.28
Observed 1.11 1.19 1.59 2.07 2.24 3.32 3.49 3.49 2.93 1.73 1.22 1.14
% Diff. 10.2 10.6 15.1 2.0 2.4 3.3 3.6 3.6 3.2 25.5 23.1 12.5
Source : Mani, A. and Rangarajan S., Solar radiation over India
Table 6.21 : Mean Daily hours of sunshine - estimated for Malshiras block
Month Jan Feb Mar Apr May Jun Jul Aug Sept Oct Nov Dec
Mean daily hrs of sunshine 9.75 10.25 9.75 9.75 9.5 6.25 3 4 5.5 8 9.25 9.75
Based on : Mani, A. and Rangarajan S., Solar radiation over India

158
Chapter 7 IREP and Beyond
This chapter starts with the broad objectives of an IREP programme. It then discusses the various
energy saving devices and implements and proposes a programme for their dissemination. This
part concentrates on devices, which can be propagated independently, discusses their pros and
cons, their potential reach, the requirements for their successful dissemination and their energy
saving potential at the block level. It proposes a programme based on their full potential and
investigates the implications of the programme at different levels of achievement. The chapter
also discusses supplementary measures, which need to be taken to stabilise the gains of the
programme and put them on a sustainable footing. Finally the chapter ends with a brief discussion
about the long term question of the mass utilisation of renewable resources and what needs to be
done in the next ten years in order to move towards sustainable, energy self-reliant options.
7.1 Objectives of IREP programme An IREP programme cannot remain confined to any one sphere of activity and has a very broad
set of objectives which may be summarised as follows:
• Ensuring that all rural households are provided with basic household energy needs like
energy for cooking, heating and lighting;
• Ensuring that the energy required for fulfilling livelihood needs of the population on an
equitable and sustainable basis are adequately met;
• Ensuring that the disparities in access to energy necessary for improving the quality of
life between different sections of the population (between the landed and the landless,
men and women, rural and urban populations, etc.) progressively decrease;
• Ensuring that the pressure on common pool resources in the rural areas and the
consequent process of environmental degradation be firstly, arrested and then reversed, so
that a sustainable eco-system enhancement takes place, and last but not least, that the
rural population becomes self-reliant (not to be confused with self-sufficient) in energy
needs.

159
Energy saving devices and measures
7.2 Improved chulhas Firewood accounts for a lion’s share of the fuel value of domestic fuel use and the low efficiency
of traditional chulhas in which firewood is burnt has long been recognised. Any improvement in
chulha efficiency is therefore expected to bring about large savings in domestic fuel use and with
this in mind, a number of improved chulha designs have been evolved over the years. However,
though a very large number of improved chulhas have been installed so far, the programme has
not really been able to bring about a mass utilisation of improved chulhas by the rural population.
There is a need to discuss the possible reasons for this before moving on to evolve a programme
for their mass propagation.
For example, of the 306 households surveyed, only 10 had improved chulhas installed, and of
these, only 4 chulhas were in use. The difficulties reported in respect of the improved chulha have
been summarised in an earlier chapter. Many of the problems relate to a lack of adequate
information on chulha use and also of sufficient repair and maintenance back up and advice.
Some of the other problems (which, in our experience, have also been reported in other areas) are:
limitations of size and kind of fuel, unsuitability of the mouth of the chulha and insufficient heat
delivery for the cooking needs of the family, and also increase in the consumption of firewood.
Know your adversary -- the traditional chulha The important point is that these problems and consequent perceptions exist, not because of
`faulty’ design, but in spite of good design. And that these perceptions are rooted not simply in
ignorance or unconcern for fuel efficiency, but in real difficulties faced by the users. The starting
point is to know the advantages offered by the adversary -- the traditional chulha.
Domestic fuel for the rural households comes in different sizes and quality. The paucity of
firewood compels households to utilise all kinds of fuel -- crop residues, thorns, small stalks,
straw -- households have to make do with any kind of fuel that is available. The traditional chulha
is a device that can take all these kinds of fuel in its stride -- though efficiency may be impaired,
ways can always be found to utilise the fuel in these chulhas. Secondly, it is possible to change
rapidly to different scales of heat delivery in the traditional chulhas. In this respect, traditional
chulhas represent somewhat of a robust, `general purpose’ combustion device, which can handle
the range of situations and needs faced by rural households.

160
Problems inherent in changing from `general purpose’ to `special purpose’ devices In contrast, in order to increase efficiency, improved chulhas incorporate many design aspects,
which act to limit their use to a subset of the situations, faced by rural households. These are
problems inherent in changing over from `general purpose’ to `special purpose’ combustion
devices and this needs to be taken into account in planning a programme for improved chulhas.
Many of the difficulties reported in respect of improved chulhas can be understood if placed in
this context. For example, it is much more difficult to extract higher than design heat deliveries
from improved chulhas and attempts to do so would normally result in diminishing air supply,
increased smoke and lowered efficiency, and any household that has attempted to do this would,
contrary to expectation, report increased smoke, cooking time and fuel consumption.
Implications for IREP programmes The first implication is that the programme should not attempt, and as importantly, should not
attempt to propagate, improved chulhas as full replacement devices for the traditional chulha.
They should be looked at as additional devices, which will reduce and limit traditional chulha use
without necessarily eliminating its use. For the purposes of the programme, we suggest that they
be viewed as devices, which bring about a 50% replacement of traditional chulha use.
Energy savings It should be emphasised that even at half replacement level, improved chulhas can bring about
considerable fuel savings. For example, sample households show an annual consumption of 3.25
T of firewood per household supplying about 1.90 Mkcal of useful heat. If half of this heat is
supplied by improved chulhas, assuming an average efficiency of 10% for the traditional and 25%
for the improved chulha, the resultant annual firewood saving is 0.925 T. Considering an
improved chulha cost of Rs. 180, the potential saving is very large indeed. Considering firewood
cost as low as 0.5 Rs/kg, the return on investment in terms of fuel saved comes to about 260%. In
fact, the chulha gives a 100% return at a replacement rate of around 20%.
The second implication is that greater attention needs to be given to matching household needs
and the kind and quantity of fuel when making a choice between different improved chulha
design. There is now fairly detailed information on technical specifications and efficiency
requirements for standard chulha designs chosen for propagation. This needs to be brought to bear
on prevalent cooking practices and translated into specific recommendations in respect of
replacement by improved chulhas.

161
Additional information required is the scale of heat delivery by the chulha within its range of
efficiency. This information is not routinely reported at the moment. It would also be useful to
have developers study and report on adapting the design to different heat loads, etc.
The third implication is that there needs to be a two-way communication between users and
MEDA and MEDA suppliers, whether they are government agencies or other institutions. There
is often an element of change in well established cooking practices and food preferences if
improved chulha efficiencies are to be achieved. For example, in the bhakri areas, cooking
practice and food preference is to roast the half cooked bhakri on an open fire. This involves
considerable losses and can lower efficiencies to levels where the fuel saving gains do not make
an impact. We also need to keep in mind that `user’ here does not signify the household, but very
specifically, the rural women who are the actual users.
In short, we feel that the issue of propagation of improved chulhas, which has the greatest
immediate potential for fuel saving needs to be given much more attention than it presently
receives. The implications for the underlying institutional arrangements are further discussed in
the separate section on the institutional requirements of the programme.
7.3 Family bio-gas plants Biogas plants may be classified as fixed dome and floating dome, as family plants and community
plants, and as those based primarily on dung, night soil or crop residue and leaf litter according to
different criteria. Almost all the plants reported in the sample households were fixed dome family
plants based on dung and night soil. The sample survey reported 26 biogas plants and though only
about a little more than half the plants were reported to be in use, the users of biogas plants in use
were well satisfied by their performance. The less than half that were not in use had fallen into
disuse mainly due to disrepair. There was also greater awareness about the usefulness of biogas
plants in the sample households. The plants reporting capacity showed an average capacity of
about 7.8 Nm3. The households owning plants that had fallen into disuse, reported an assessed
expenditure of about 2,800 Rs/plant in order to bring them back into use, and together they were
ready to contribute about 30% of the cost.
Our discussions show that there is considerable scope for developing biogas fuel systems in the
block. Three types of programmes are suggested below for different sections.
2Nm3 optimised Deenbandhu model The first type of programme is targeted at the middle farmer household and above with daily
access to a minimum of 10 kg of dung. A 2m3 to 4 m3 capacity plant is suggested as optimal. The
optimised design of such a plant based on the Deenbandhu model, developed by Shri V. N. Gore

162
and later adopted by the Vivekananda Kendra and CAPART as the Vincap model is suggested as
the basis. This model uses natural material and is specifically designed to help eliminate the
common leakage, settlement and uplift problems, which often cause failure in biogas plants. The
Vivekananda Kendra has built the standardised model in many places in Tamil Nadu. The cost
comparison in 1995 prices of the conventional and optimised Deenbandhu model shows that the
optimised model costs Rs. 3,000 as compared to Rs. 5,000 for the conventional model. This
would allow the state to bear a larger proportion of the cost within the same rate of subsidy
burden per Nm3 capacity.
Assessment of energy saving and reach Analysis of sample household data shows that 104 out of 306 families had a dung availability of
over 2 kg per capita per day. Thus the reach of the programme may be taken to cover about one-
third of the population.
A 2Nm3 plant delivers 2.06 Mkcal and a 4Nm3 plant 4.12 Mkcal annually as useful heat. The
average total useful heat annually utilised per household is about 2 Mkcal of which 1.36 comes
from biofuels excluding biogas. Estimated cost of optimised Deenbandhu model in 2000 would
come to Rs. 4,760 or say Rs. 5,000.
7.4 Community biogas plants Biogas is an ideal fuel in more than one ways. However, family biogas plants presuppose access
to adequate quantities of dung, and this excludes most marginal farmers and the landless.
Improved chulhas would go some way towards meeting the needs of these sections, but there are
many difficulties in the way. One way out is that of community biogas plants, which are based on
night soil and optionally on dung, supplement. In fact in Malshiras village MEDA has taken the
initiative to install a community biogas plant and it is yet to become operational.
Purely as an illustrative example, considering all the 202 households in the sample who either do
not have access to dung or have a per household access less than 2 kg per capita per day, they
constitute 1392 persons and together have a daily dung availability of 914 kg. If this `community’
pools their dung and nightsoil resources, they have an availability of 230 Nm3 of biogas or about
62% of the delivered heat they require for their domestic fuels. If ways and means are found of
brining this about, these resources have the ability to save above 2 T of firewood per household.
The main bottleneck in case of community biogas plants is the organisational effort and the
institutional arrangements, which are required. Unlike the chulha and the family biogas
programmes, a programme for community biogas plants cannot be taken to a mass scale in the

163
same manner. Considerations of spatial contiguity also affect the realisable reach of the
programme.
Suggested modifications for the existing community biogas programmes MEDA has already taken up a programme of community biogas plants based on night soil. This is
an important programme, which also has its own importance as a health programme in its own
right. We would however suggest that groups be based on bringing together two kinds of
households: a) households with no cattle comprising mainly the landless and b) households whose
daily dung access is less than the quantity which would make family biogas plant viable. The
latter would participate in the programme and would receive fertiliser as consideration for their
dung contribution. As shown above, if an appropriate mix is maintained, the programme is
capable of meeting 62% of delivered useful heat requirement of all the households. Without the
participation of the latter group, the programme would be able to meet at most 15% of the
delivered useful heat requirement of the participating households. It is unlikely that interest would
be sustained at this level of replacement. Moreover, the problem of contiguity would also be
eased somewhat because of increased coverage.
It is suggested that in the first instance, over the first five years, the attempt should be to set up
about five such plants in each circle in the block, that is, about 40 plants over the next 5 years. A
minimum plant size of 15 Nm3 with half of the contribution coming from dung and half from
night soil is recommended. This implies a total group of about 40 to 50 households comprising at
least 300 persons and a daily dung availability of about 100 kg per day. On the basis of the
learning of the first five year period, it is assumed that it would be possible to extend the coverage
so that on an average there is one community biogas plant per village, implying the setting up of
about 160 plants in the next five years which gives a total of about 200 plants over the next 10
years period.
7.5 Leaf litter, brushwood and biowaste based biogas plants Leaf litter, brushwood and other crop and biowastes are manifold more abundantly available than
dung or night soil. If dung or night soil resources could be supplemented by such biowastes, the
constraint on resource availability for the poorer sections could be substantially overcome.
Assuming that fuel extraction from biowastes is half as efficient as that for dung in terms of dry
matter, about 5 to 6 kg of dry biowaste would be required per Nm3 of biogas.
A workable design had been developed by ASTRA at the Indian Institute of Science, Bangalore
which worked on a substantial component of leaf litter, brushwood and biowastes in the feed. The
plant had been installed at Pura village and the gas was utilised to generate electricity to meet the

164
lighting requirement and the drinking water pumping requirement for the village. The electricity
generation plant ran for a few years and has since got into institutional difficulties and the facility
is no longer in use. However, the biogas component was a demonstrated success and there is a
need to adapt that design for similar requirements.
We suggest that in the first five years three trial plants be set up in the block. The locations of
these plants can be chosen in such a way that it has the best demonstration effect. The plants
could be set up in three sizes ranging from 20 to 100 Nm3 (the estimated requirements for each of
these sizes may be worked out on the basis of a module of 150 persons contributing nightsoil, 50
kg daily dung and 50 kg dry litter per 10 Nm3 capacity). Based on the learning of that experience,
a programme may be taken up to establish 30 more plants in the entire block in the next five years
of 2005 to 2010.
7.6 Energy saving lamps
Tubelights with electronic chokes It is well established that tubelights provide greater luminosity per watt and that one of the main
constraints on acceptance of tubelights is the lack of adequate chokes, which can work at less than
rated voltages prevalent in the rural area. This is also a well-accepted programme.
However, there is a need to estimate the potential scale of the programme. A simulation was
carried out on the basis of the survey data. The simulation shows that if all bulbs up to 40 W
replaced by one 20 W tubelight with electronic choke, and 60 and above by one 40 W tubelight,
there is a resultant saving of more than 35% of electricity consumed for lighting. If we take into
account the fact that the electricity consumed in lighting forms a major share of domestic electric
use, substantial savings are possible. For the sample households, 612 lamps would be replaced
and the resultant annual energy saving per lamp would be about 32 kWh per lamp along with a
similar reduction in connected load.
According to the slogan that every unit saved is a unit generated, the energy saved could be costed
at the marginal cost of new power generation, which stands at more than Rs. 3/kWh. This does
not take into account the considerable benefit derived from a reduction in connected load during
peak hours.
Compact Fluorescent Lamps (CFLs) Replacing electric filament lamps by compact fluorescent lamps (CFL) is another option that has
even greater benefit in the long run. However, CFLs have not been all that acceptable as general
lighting devices and it is doubtful whether simple replacement of filament lamps by CFLs would
be effective. For effective use and acceptance, CFLs require that space lighting needs and their

165
pattern is studied and the lamps accordingly placed. Used in this manner they have the potential
of greatly reducing electricity need for lighting even while increasing the quality of lighting. We
would recommend a study along these lines be taken up and guidelines evolved for the
replacement of filament lamps by CFLs in the next two years and a programme be taken up on the
basis of these studies.
Assuming for the time being that two CFL lamps will be required for every 60 W filament lamp
to be replaced, we still have here an energy saving that is substantially more than that possible
with electronic chokes and conventional tubelights. For our sample, proceeding along the same
lines, if we assume that all filament lamps of up to 40 W are replaced by one, those up to 60 W
with two and those above 60 W with three, then with a standard CFL wattage of 9 W, we have a
reduction in energy consumption by about 70% and a corresponding reduction in connected load.
The energy saving per CFL installed is about 44 kWh. Costing as above, with a CFL cost of 325
Rs., we have a rate of return of more than 33%. The total investment in replacement however
involves replacement of 612 filament lamps with 1,106 CFLs. We should also take into account
the very considerable reduction in connected load, and the fact that CFL costs are at the time
mainly constrained by lack of an adequate mass market. The main bottleneck here is the
acceptance and the scale of investment, which we believe, should improve over time. The
programme therefore provides for an increasing component of CFL instead of conventional
tubelight with electronic choke in the later phases.
7.7 Kerosene saving devices
Improved kerosene stoves and improved lanterns Since stoves and lanterns are the two main kerosene devices in use, improved kerosene stoves and
lanterns are aimed at improving the efficiency of these devices. These devices are already a well-
established part of MEDA programmes. With a rise in efficiency from around 40 to 45% to 60 to
65%, there is a fuel saving of 30 to 33%, thus one litre of kerosene out of every three could be
saved by these devices.
Kerosene and the landless labourers and marginal farmers The landless labourers are the section, which is most vulnerable to fuel shortage. They have no
access to firewood resources of their own and their dependence on kerosene is high. Though they
have a somewhat better access to firewood and biofuels, marginal farmers face practically the
same situation. For these sections therefore there is a twofold need in respect of kerosene: a) they
should be the first target for dissemination of kerosene saving devices at a higher rate of subsidy,
and b) they should have expanded access to kerosene supply. It is unfortunate that kerosene

166
quotas for the block have been consistently declining and most households have demanded an
increase in kerosene supplies.
7.8 Institutional issues Besides its technical component, any programme must take account of the social mechanisms
through which the programme objectives are to be achieved. Whether it is left to the market
mechanism or the state machinery, every programme presupposes a social mechanism through
which the objectives are to be achieved and this mechanism always leaves a profound mark on the
programme.
Presently, government personnel who are already burdened with their own departmental
responsibilities administer the programmes. They are not in a position to fulfil the multifarious
functions that such a comprehensive programme demands. While targets are achieved, the gains
are not sustainable, and the potential reach is constrained. Users often do not receive adequate
information and there is no mechanism by which they can communicate their difficulties and get
adequate advice or help. The government personnel implementing the programme often do not
have the necessary technical expertise or the time to go into the issues and resolve them
adequately. Moreover for far too long they have been used to one-way communication (best
described in the term -- delivery system) and are not adequately equipped to handle the needs of
two-way communication.
All this can be summed up in a short phrase -- lack of participation and an adequate institutional
mechanism to ensure participation. For this reason, we propose here an alternative institutional
mechanism for handling the multifarious needs that an IREP programme demands. The two main
elements in it are the user groups and the service organisation/group.
User Groups User groups are now a well-recognised institutional measure for ensuring participation. User
groups should be formed villagewise around each component as the programme progresses. User
groups should be formed before the programme implementation. Prospective users should be
organised into groups, the programme and its importance explained to them, measures necessary
for ensuring efficiency of devices and any difficulties in this regard should be fully discussed, and
choice of appropriate device made with their consent.
The users of the two major energy devices -- the improved chulhas and biogas plants -- are
women, and it is proposed that these user groups should be formed from the women in the
household. It has also been found that women on the whole respond much better and carry out the
functions of the user groups much better than men. Besides it is important to see that women gain

167
an independent voice in collective affairs. Periodic consultations with the village men folk can
also be arranged to keep the men involved in these programmes.
Wherever possible, programmes should feed into SHG activities and those SHGs themselves can
become user groups for the programme. The advantage is that a homogeneous well functioning
group with some empowerment and good communication can become a medium for the two-way
communication needed by the programme. This will also help convergence of different
government schemes.
Support services Any such programme cannot be taken up on a mass scale without ensuring effective support
service mechanisms. There re three main types of support services, which are needed: a)
Awareness creation, information dissemination and motivation, b) Provision of technical services
and c) preparing guidelines, recommendations and improvements.
Awareness creation, information dissemination and motivation The programmes described above, especially the improved chulha and biogas programmes, have
aspects which are relevant for many other government programmes like community health,
women’s programmes, watershed and wasteland development programmes, etc. These support
services can therefore be combined with similar activities carried out in all these other
programmes. In fact, many of these programmes can be taken up as part of other programmes.
However, MEDA should see to it that this is done, and should secondly, provide material and
train persons for this task and provide a roster of trainers and speakers for this purpose.

168
Provision of technical services One of the major bottlenecks in these programmes is the timely provision of technical services
involving troubleshooting, as well as repairs and modifications. Our discussions reveal that if
such help is available in time and users are aware beforehand of the cost they will have to bear,
they are ready to pay such costs. What generally seems to happen is that lack of timely
intervention leads to aggravation and finally disuse of the equipment leading to a situation where
cost of re-mobilising the equipment becomes too large for users to bear.
An equally important aspect is the quality control at the time of construction/installation itself.
This need not require extensive technical knowledge in most cases; someone who has some
technical understanding could monitor a simple checklist. This aspect is as important as the first
one, and is quite clear in the case of biogas plants.
The government machinery is not in a position to fulfil these functions today. It will also not be
helpful to entrust the task entirely to NGOs, because though they can carry out support activity for
this aspect, except for a very few blocks, there do not exist NGOs with sufficient technical
background and personnel.
Team of para-professionals It is proposed that MEDA should take up the task of forming and training a team of para-
professionals at the block level, somewhat along the lines of a village health worker. The para-
professional should be resident in the area, should have studied up to matriculation, and should
have some technical aptitude. The person would need to be trained specifically in the devices
propagated under the IREP. The person should receive training about making an appropriate
choice of device, constructing/installing the devices, and handling the routine repairs and advise
on and monitor maintenance. The person should be entitled to a reasonable fee from the users for
actual repairs and construction/installation and should also be able to act as the conduit for a two-
way communication between users and the government as well as support scientific institutions.
It is suggested that the person be paid a stipend for a five-year period after training and should be
able to get significant supplementary income during that period. The stipend would be mainly for
the services rendered to the programme in terms of helping form user groups, helping user groups
to carry out their activities in a regular manner and act as the communication link between users
and the government.
It is suggested that there should be one such para-professional for approximately 500 households
(about 3000 population).

169
7.9 Funds As pointed out above, IREP has a component that can form part of many other programmes. At
present MEDA supported IREP programmes and distribution is being carried out independently
of other programmes. This constrains both the IREP programmes as well as the other
programmes. It is suggested that each of these other programmes should have an energy saving
component of its own which would be supplemented by IREP programmes. There are two types
of funds, which need to be considered a) the programme funds and b) funds for the support
services.
Programme funds It is suggested that each of the other relevant programmes take up energy saving devices and
measures as part of its own programme and that IREP should match that share with its funds.
For example, let us take watershed development programmes. In the block, we have an average of
a little more than 2.50 ha watershed area per household. Thus a typical 400 to 500 ha micro-
watershed would have at least about 150 households. Providing for the optimised Deenbandhu
biogas plant for an estimated one-third of the households and improved chulhas and kerosene
stoves for the other two thirds would cost, 50 x 5000 + 100 x 180 + 100 x 185 = 2,50,000 +
18,000 + 18,500 = 2,86,000 Rs, say 3,00,000 Rs. This measure would go a long way towards
reducing the pressure on the commons with an immediate effect, which would greatly help the
watershed programme. Of the 3,00,000 a three-way division is possible, with the users paying for
1,00,000, the watershed programme bearing the burden of 1,00,000 and the IREP contributing
1,00,000. It should also be pointed out that since the users as a whole would gain substantial
immediate benefits as wages as well as long term benefits from the watershed programme, users
would be ready to bear a larger share of the cost than otherwise. In the projections, which follow
the proportions of one-third each for chulhas, stoves, and biogas plants (except for community
biogas plants) is assumed.
7.10 Projection, phasing and distribution of the programme It is necessary to take into account that the programme may not always be able to provide the full
potential coverage. Projection estimates of the programme are worked out below on the basis of
100, 50, 25 and 10% of the potential recommended coverage of the programme.
Programmes designed to ensure participation have to follow a learning curve and cannot be just
distributed evenly among all the years. In what follows, the learning curve is assumed to be
completed by the second year, with the exception of the community biogas programmes which
are expected to take a longer period of gestation. Therefore it is assumed that 4% of the

170
programme is covered during the first, 8% during the second and then onwards 11% every year
till the tenth year.
Village as a basis In the distribution of the programme the following points need to taken into account: a) it is
important to cover a substantial section of a village and proceed villagewise, so that the combined
effect of the measures makes a noticeable impact; b) the more vulnerable sections like the landless
and marginal farmers need to be given a multiple device benefit if the devices are to make an
impact significant enough for replication (for example an improved chulha and an improved
kerosene stove and an improved lantern are much more likely to make a perceptible difference
and sustain the benefit of each of the device), and c) special care must be taken to ensure the
participation of women, for two independent reasons -- empowerment of women as well as better
and more efficient implementation of the programme.
7.11 The suggested programme details and its resultant energy savings
Family biogas plants As mentioned earlier, the survey findings show that family biogas plants are viable for roughly
one-third of the households. Thus, the full potential (100%) of this programme is assumed to
cover one-third of the total projected number of households in 2010. Since we are dealing with
broad estimates all figures are rounded to the nearest convenient unit. The full potential for the
family biogas programme is thus taken to be 30,000 households. The programme details at
different levels of potential reached are presented in Tables 7.2 and the resultant fuel savings are
presented in Table 7.10. This programme shows an energy saving of about 2700 kcal per Re
invested (in coal equivalents at 1 Re/kg, this gives a gross return of about 40%).
Improved chulhas The largest savings are of course shown in the improved chulha programme. The potential of this
programme is calculated on the assumption that most of the households not covered by the family
biogas programme would have to be covered by the other programme nets. Thus excluding
10,000 better off households from the rest, 50,000 households are assumed to form the full
potential of the improved chulha programme. The programme details at different levels of
potential reached are presented in Tables 7.1 and the resultant fuel savings are presented in Table
7.9. This programme expectedly shows a very large energy saving of almost 22,500 kcal per Re
invested (in coal equivalents at 1 Re/kg, this gives a gross return of almost 320%) even at half
replacement.

171
Improved kerosene stoves As pointed out earlier, multiple coverage in the net should not be excluded if significant impact is
aimed at and accordingly, it is assumed that the same 50,000 households also constitute the full
potential for the improved kerosene stove programme. The programme details at different levels
of potential reached are presented in Tables 7.3 and the resultant fuel savings are presented in
Table 7.11. This programme shows an energy saving of about 700 kcal per Re invested (in coal
equivalents at 1 Re/kg, this gives a gross return of almost 10%). The pattern of energy
consumption is such that the per Re energy saved is very less and hence gadgets aimed at
kerosene saving could get a low priority in the over all programme of MEDA. As we would see
later the same holds true for improved kerosene lanterns.
Community biogas plants based on dung and night soil As discussed earlier, each plant of 15 m3 is assumed to serve 50 households with about 40% of
their cooking needs. The programme, because of its more stringent requirements, is limited to a
coverage of about one plant per village (may be two in bigger villages). The programme thus
assumes the installation of 200 plants of 1,50,000 unit cost at 100% potential and the programme
details at different levels of potential reached are presented in Tables 7.4 and the resultant fuel
savings are presented in Table 7.12. This programme shows an energy saving of almost 3,200
kcal per Re invested (in coal equivalents at 1 Re/kg, this gives a gross return of almost 45%).
Community biogas plants based on dung and night soil and leaf litter/biowaste supplement This programme is mainly an experimental programme in the first phase of five years and it
assumes that the plants would serve 50 families and supply 60% of their cooking energy at the
same cost. The programme details at different levels of potential reached are presented in Tables
7.5 and the resultant fuel savings are presented in Table 7.13. This programme shows an energy
saving of almost 4,600 kcal per Re invested (in coal equivalents at 1 Re/kg, this gives a gross
return of about 65%).
Improved kerosene lanterns Insufficient reach of electricity to all households as well as frequent power failure has made this
an important item of fuel use. The potential households for these devices are again assumed to be
the bottom 50,000 families. Unit cost is assumed to be Rs. 105. The programme details at
different levels of potential reached are presented in Tables 7.6 and the resultant fuel savings are
presented in Table 7.14. This programme shows an energy saving of about 410 kcal per Re
invested (in coal equivalents at 1 Re/kg, this gives a gross return of only about 6%).

172
Electronic chokes with tubelights and CFLs An estimated eighty thousand filament lamps are assumed to be converted half to electronic coke
and tubelights and half to CFLs as described earlier. Unit costs are assumed respectively to be Rs.
400 and Rs. 325 for the electronic choke and tubelight assembly and Rs. 325 for CFL. The
programme details at different levels of potential reached are presented in Tables 7.7 and the
resultant fuel savings are presented in Table 7.15 for electronic chokes and tubelights and in
Tables 7.8 and 7.16 respectively for CFLs. This programme shows an electricity saving of about
0.08 kWh and 0.11 kWh per Re invested respectively for electronic choke and tube and CFLs (in
marginal electricity cost at Rs. 3/kWh, this gives a gross return of almost 24% and 33%
respectively).
Para professional core and its costs As has been emphasised earlier, the programme requires a core of trained para professionals and
that related cost must be provided for in the costs of the programme. It is suggested that there be
one para professional for every 500 households (approximately 3000 persons). This means a total
of about 180 para professionals to be inducted for the block.
The para professional will receive on-job as well as separate training. It is suggested that the
person get a stipend of Rs. 750 p.m. during the first year which shall be considered a training
period. However, the person will have to begin the work of organising around ongoing
programmes immediately on induction.
After training, the person will be entitled to a stipend of Rs. 1000 p.m. for another four years,
during which he or she shall be responsible for the targets to be achieved within the person's
designated area/group. Since as emphasised earlier, the programme should not disperse its efforts
but should concentrate on covering an area progressively but intensively, it is assumed that the
para professionals are inducted in a phased manner. Thus every year for the first six years, 30 para
professionals will be inducted and trained. The costs are presented in Table 7.17. It may be seen
that, distributed over the entire range of IREP activity, they are not very high, even at 10%
coverage, but provide a vital and important missing link in the programme.
7.12 Total fuel saving and the impact of the programme on the pressure on the commons The total impact of the programme at full potential on fuel consumption in the block is presented
in Table 7.18 and the fuel value of fuel saving is presented in Table 7.19. At full potential the
saving in fuel comes to 174,710 T of firewood, 11,300 T of dungcake, 2,630 kl of kerosene with a
total fuel value of 748,110 Mkcal. Savings in electricity come to about 6,444,900 kWh.

173
One of the most important criteria is the reduction of pressure that such a programme can bring
about on the commons. The estimation of this impact of the programme of projected pressure on
the commons is presented in Table 7.20. It may be seen that there is a substantial reduction in
pressure on the commons when the programme operates at full potential. In fact, we may assess
this reduction in two ways:
Projections show that the pressure on the commons in the BAU scenario would increase from
4.35 T/ha in 2000 to 5.48 T/ha in 2010. One of the minimum conditions for an energy programme
would be that it succeeds in arresting the increase in pressure on the commons. This implies that
the programme should be successful in maintaining the 2010 pressure at 4.35 T/ha or less. From
the table one may see that the even if the programme is aimed at achieving 10% potential the
above mentioned objective could be achieved. This sets a minimum target for the programme.
The second important landmark would be when the extraction from the commons falls below the
estimated annual biomass increment of about 3 T/ha. From the table it may be seen that the 2010
extraction rate from the commons falls below 3 T/ha when the programme reaches an
achievement level of about 60% achievement of the full potential. This sets a target for what
should be the desirable coverage. Suggested scale of programmes
The estimates above are based on equal coverage for each programme. It is possible to arrive at an
alternative programme based on a coverage, which gives greater priority to those programmes,
which show a higher energy gain per Rupee invested in the programme. From this point of view it
is suggested that an acceptable scale of programme would be to take up the improved chulha
programme which has the largest energy gain per Re at a coverage of 50% and all other
programmes at a coverage of 10%. With this programme composition, the programme would be
just able to maintain the pressure on the commons at the present level and show a small saving.
This also brings out the necessity of other complementary measures if IREP gains are to be
consolidated.
7.13 Convergence and complementary activity The IREP by itself cannot hope to achieve the objective of sustainability and energy self reliance,
and this becomes quite clear from the table showing pressure on the commons. The importance of
convergence cannot be over emphasised in this respect. It is only by acting in concert and by
complementing each other's efforts that the sum total of government schemes can bring about the
desired effect. As mentioned earlier, IREP should seek convergence with other related schemes.
Some of these areas of convergence are: a) Watershed and wasteland development programme, b)
Integrated fodder and livestock programmes, c) Social forestry programmes, d) Programmes
related to more efficient utilisation of crop wastes, e) Health and hygiene programmes involving

174
night soil and solid waste management, f) Pasture development programmes, g) Programmes for
improving habitats and living conditions of disadvantaged sections.
In this respect, the newly emerging importance given to participation as well as convergence is a
favourable context. However, it needs to be backed up by active search of areas of convergence.
Self-Help Groups and User Groups have an important role to play in this as do NGOs and other
voluntary agencies.
The defining parameters for sustainable and equitable productivity enhancement have been
described in detail in Datye (1997) and Paranjape and Joy (1995). Without convergence with
sustainable productivity enhancement and equitable access to water and biomass resources, it will
not be possible to fully eliminate the pressure on the environment while ensuring livelihood needs
of all in the rural areas.
7.14 Beyond IREP -- Towards mass utilisation of renewable energy In the preceding sections we have dealt with IREP programmes related to energy saving devices
and measures related to biofuels like firewood and biogas, and towards mainly non renewable
sources like kerosene and electricity (most electricity today comes from coal based thermal plants
and the proportion of hydro power has secularly decreased). We have not covered the solar and
other renewable energy options that are being propagated under the IREP. This is because there
are major problems with the IREP direction in respect of renewable energy.
Solar cookers, solar water heaters, solar photo voltaic devices For example, solar cookers, solar water heaters, solar photovoltaic devices are the three main
groups of solar devices being propagated under the IREP. All of them have received lukewarm
response, and at best have a demonstration and awareness value. They have found little
acceptance in the rural areas. Any programme that tries to propagate these devices in a similar
manner is bound to face the same problems because there is a fundamental shift in the approach
towards renewable energy if renewable energy sources are to be utilised on a mass scale and
become the basis for energy self reliance in the rural areas.
There are a host of problems associated with domestic solar devices. Because of their seasonal
nature, users have to maintain other energy systems to take care of periods when solar does not
satisfy the requirements. They do not represent savings in establishment costs, but in additional
costs. Secondly, for the rural poor, labour represents a non-cash input, which is within their
control, and so they prefer prolonged periods of foraging and collection to cash and monetary
investments. Thirdly, solar devices do not sit well with the cycle of activities they carry out where

175
they often have to cook early and carry their food with them. Fourthly, in non-rice areas, solar
devices are at a distinct disadvantage because of the higher cooking temperatures needed. All
these reasons lie behind their poor acceptance in rural areas, and especially by the rural poor.
However, they do have a demonstration and awareness creation value. For this reason it is
suggested that they should be taken up on that scale, for example, as part of Urja Grams. SPV
street lighting is also one of the possible demonstration devices, provided there is a service back
up.
Realising the specific nature of renewable resources, especially solar energy, wind energy and hydropower It is necessary to realise first that though renewable energy sources are the only hope of the future,
except for biomass to some degree, they all suffer from specific limitations. Realising these
limitations is the first step in overcoming them. It is well recognised that renewable energy
sources are dispersed, difficult to store, do not lend themselves easily to aggregation and are
subject to large temporal and spatial variation.
The next step involves a perspective about how to overcome these limitations. The present
direction in this respect is an attempt to upgrade a given renewable resource, individually, to a
level where they can compete with non-renewable sources. As soon as this is accepted, the cost of
harnessing the resource begins to increase and the higher up the upgradation scale one goes, the
steeper is the increase.
Though, frontier area research like those in photovoltaics does seem to promise abundant energy
in the future, that future is still far off. Even solar devices like solar cookers, which on the face of
it, should have been very popular, have not been able to satisfy domestic requirements. Anyone
with a solar cooker has to maintain a double cooking establishment so to speak, because of the
unreliability of solar insulation. Adding a storage element to it would increase what is already
perceived as a very high cost. Hence, we have not included any of these devices in the
programme. Their role as demonstration units and awareness creation devices can continue at a
low key.
From individual sources to systems The perspective pointed out above pertains not only to the harnessing of renewable energy
sources for domestic use, but also in larger use, including their use in industry and in power
generation. A change in perspective is needed here from energy sources to energy systems.
The non-systemic thinking which thinks of each individual source as an independent energy
source is rooted in the fossil fuel era. Since fossil fuels have been widely available on a large

176
scale, are capable of aggregation on virtually any scale, can be stored and conveniently handled,
they are each capable of being looked upon as independent sources and has led to a thinking
which exploits each source independently. As indicated earlier individual sources like solar, wind
and hydro have serious limitations in Malshiras block.
With an energy systems approach, it becomes possible to turn limitations into strengths. One way
is to go for hybridisation. Serious efforts are being made in the field of solar, thermal and biomass
hybrid systems and wind-hydro systems. This is specially needed if exploitation renewable
sources of energy to become viable and also for the mass utilisation of renewable energy.
Mass utilisation of renewable energy as basis for sustainable prosperity Many of these possibilities are examined in greater detail in Datye (1997) and Paranjape and Joy
(1995). A note, which lays out some of the main ideas, is annexed (Annexure7.1). Subsequent
work is mentioned in the References. At present, crop wastes surpluses as well as other utilisable
biomass surpluses are not readily available. If IREP is treated as a supplementary part of
associated convergent schemes for sustainable productivity enhancement, biomass surpluses will
be generated and can be integrated into sustainable energy systems described in the annexed note.
Most of the programmes flowing out of these fall outside the current scope and nature of IREP.
Moreover, without supplementing IREP with a programme on that scale, IREP might only prove
to be symptomatic relief; but joined with it, it can become a part of a synergetic energy system
that ensures an enhanced quality of life for the rural population without compromising on
sustainability and equity. That however requires a separate study focussed on evolving a pilot
project for this purpose.

177

178
Table 7.1 : Projected programme for improved chulha
Year 2001 2002 2003 2004 2005 2006 2007 2008 2009 2010 Total
100% potential
Target (no. of chulhas) 2,000 4,000 5,500 5,500 5,500 5,500 5,500 5,500 5,500 5,500 50,000
Cost (Rs. '000) 360 720 990 990 990 990 990 990 990 990 9,000
Suggested contribution to cost
IREP (Rs. '000) 120 240 330 330 330 330 330 330 330 330 3,000
Other Govt. schemes 120 240 330 330 330 330 330 330 330 330 3,000
User contribution 120 240 330 330 330 330 330 330 330 330 3,000
50% potential
Target (no. of chulhas) 1,000 2,000 2,750 2,750 2,750 2,750 2,750 2,750 2,750 2,750 25,000
Cost (Rs. '000) 180 360 495 495 495 495 495 495 495 495 4,500
Suggested contribution to cost
IREP (Rs. '000) 60 120 165 165 165 165 165 165 165 165 1,500
Other Govt. schemes 60 120 165 165 165 165 165 165 165 165 1,500
User contribution 60 120 165 165 165 165 165 165 165 165 1,500
25% potential
Target (no. of chulhas) 500 1,000 1,375 1,375 1,375 1,375 1,375 1,375 1,375 1,375 12,500
Cost (Rs. '000) 90 180 248 248 248 248 248 248 248 248 2,250
Suggested contribution to cost
IREP (Rs. '000) 30 60 83 83 83 83 83 83 83 83 750
Other Govt. schemes 30 60 83 83 83 83 83 83 83 83 750
User contribution 30 60 83 83 83 83 83 83 83 83 750
10% potential
Target (no. of chulhas) 200 400 550 550 550 550 550 550 550 550 5,000
Cost (Rs. '000) 36 72 99 99 99 99 99 99 99 99 900
Suggested contribution to cost
IREP (Rs. '000) 12 24 33 33 33 33 33 33 33 33 300

179
Other Govt. schemes 12 24 33 33 33 33 33 33 33 33 300
User contribution 12 24 33 33 33 33 33 33 33 33 300
Table 7.2 : Projected programme for optimised Deenbandhu type biogas plants
Year 2001 2002 2003 2004 2005 2006 2007 2008 2009 2010 Total
100% potential
Target (no. of plants) 1,200 2,400 3,300 3,300 3,300 3,300 3,300 3,300 3,300 3,300 30,000
Cost (Rs. '000) 6,000 12,000 16,500 16,500 16,500 16,500 16,500 16,500 16,500 16,500 150,000
Suggested contribution to cost
IREP (Rs. '000) 2,000 4,000 5,500 5,500 5,500 5,500 5,500 5,500 5,500 5,500 50,000
Other Govt. schemes 2,000 4,000 5,500 5,500 5,500 5,500 5,500 5,500 5,500 5,500 50,000
User contribution 2,000 4,000 5,500 5,500 5,500 5,500 5,500 5,500 5,500 5,500 50,000
50% potential
Target (no. of plants) 600 1,200 1,650 1,650 1,650 1,650 1,650 1,650 1,650 1,650 15,000
Cost (Rs. '000) 3,000 6,000 8,250 8,250 8,250 8,250 8,250 8,250 8,250 8,250 75,000
Suggested contribution to cost
IREP (Rs. '000) 1,000 2,000 2,750 2,750 2,750 2,750 2,750 2,750 2,750 2,750 25,000
Other Govt. schemes 1,000 2,000 2,750 2,750 2,750 2,750 2,750 2,750 2,750 2,750 25,000
User contribution 1,000 2,000 2,750 2,750 2,750 2,750 2,750 2,750 2,750 2,750 25,000
25% potential
Target (no. of plants) 300 600 825 825 825 825 825 825 825 825 7,500
Cost (Rs. '000) 1,500 3,000 4,125 4,125 4,125 4,125 4,125 4,125 4,125 4,125 37,500
Suggested contribution to cost
IREP (Rs. '000) 500 1,000 1,375 1,375 1,375 1,375 1,375 1,375 1,375 1,375 12,500
Other Govt. schemes 500 1,000 1,375 1,375 1,375 1,375 1,375 1,375 1,375 1,375 12,500
User contribution 500 1,000 1,375 1,375 1,375 1,375 1,375 1,375 1,375 1,375 12,500
10% potential
Target (no. of plants) 120 240 330 330 330 330 330 330 330 330 3,000
Cost (Rs. '000) 600 1,200 1,650 1,650 1,650 1,650 1,650 1,650 1,650 1,650 15,000

180
Suggested contribution to cost
IREP (Rs. '000) 200 400 550 550 550 550 550 550 550 550 5,000
Other Govt. schemes 200 400 550 550 550 550 550 550 550 550 5,000
User contribution 200 400 550 550 550 550 550 550 550 550 5,000 Table 7.3 : Projected programme for improved kerosene stoves
Year 2001 2002 2003 2004 2005 2006 2007 2008 2009 2010 Total
100% potential
Target (no. of stovess) 2,000 4,000 5,500 5,500 5,500 5,500 5,500 5,500 5,500 5,500 50,000
Cost (Rs. '000) 370 740 1,018 1,018 1,018 1,018 1,018 1,018 1,018 1,018 9,250
Suggested contribution to cost
IREP (Rs. '000) 185 370 509 509 509 509 509 509 509 509 4,625
User contribution 185 370 509 509 509 509 509 509 509 509 4,625
50% potential
Target (no. of stovess) 1,000 2,000 2,750 2,750 2,750 2,750 2,750 2,750 2,750 2,750 25,000
Cost (Rs. '000) 185 370 509 509 509 509 509 509 509 509 4,625
Suggested contribution to cost
IREP (Rs. '000) 93 123 170 170 170 170 170 170 170 170 1,542
User contribution 93 123 170 170 170 170 170 170 170 170 1,542
25% potential
Target (no. of stovess) 500 1,000 1,375 1,375 1,375 1,375 1,375 1,375 1,375 1,375 12,500
Cost (Rs. '000) 93 185 254 254 254 254 254 254 254 254 2,313
Suggested contribution to cost
IREP (Rs. '000) 46 93 127 127 127 127 127 127 127 127 1,156
User contribution 46 93 127 127 127 127 127 127 127 127 1,156
10% potential
Target (no. of stovess) 200 400 550 550 550 550 550 550 550 550 5,000
Cost (Rs. '000) 37 74 102 102 102 102 102 102 102 102 925

181
Suggested contribution to cost
IREP (Rs. '000) 19 37 51 51 51 51 51 51 51 51 463
User contribution 19 37 51 51 51 51 51 51 51 51 463

182
Table 7.4 : Projected programme for nightsoil and dung based community biogas plants
Year 2001 2002 2003 2004 2005 2006 2007 2008 2009 2010 Total
100% potential
Target (no. of plants) 8 8 8 8 8 32 32 32 32 32 200
Cost (Rs. '000) 1,200 1,200 1,200 1,200 1,200 4,800 4,800 4,800 4,800 4,800 30,000
Suggested contribution to cost
IREP (Rs. '000) 400 400 400 400 400 1,600 1,600 1,600 1,600 1,600 10,000
Other Govt. schemes 400 400 400 400 400 1,600 1,600 1,600 1,600 1,600 10,000
User contribution 400 400 400 400 400 1,600 1,600 1,600 1,600 1,600 10,000
50% potential
Target (no. of plants) 4 4 4 4 4 16 16 16 16 16 100
Cost (Rs. '000) 600 600 600 600 600 2,400 2,400 2,400 2,400 2,400 15,000
Suggested contribution to cost
IREP (Rs. '000) 200 200 200 200 200 800 800 800 800 800 5,000
Other Govt. schemes 200 200 200 200 200 800 800 800 800 800 5,000
User contribution 200 200 200 200 200 800 800 800 800 800 5,000
25% potential
Target (no. of plants) 2 2 2 2 2 8 8 8 8 8 50
Cost (Rs. '000) 300 300 300 300 300 1,200 1,200 1,200 1,200 1,200 7,500
Suggested contribution to cost
IREP (Rs. '000) 100 100 100 100 100 400 400 400 400 400 2,500
Other Govt. schemes 100 100 100 100 100 400 400 400 400 400 2,500
User contribution 100 100 100 100 100 400 400 400 400 400 2,500
10% potential
Target (no. of plants) 1 1 1 1 1 3 3 3 3 3 20
Cost (Rs. '000) 150 150 150 150 150 450 450 450 450 450 3,000
Suggested contribution to cost
IREP (Rs. '000) 50 50 50 50 50 150 150 150 150 150 1,000

183
Other Govt. schemes 50 50 50 50 50 150 150 150 150 150 1,000
User contribution 50 50 50 50 50 150 150 150 150 150 1,000 Table 7.5 : Projected programme for leaf litter/biowaste, nightsoil and dung based community biogas plants
Year 2001 2002 2003 2004 2005 2006 2007 2008 2009 2010 Total Target (no. of plants) -- -- 1 1 1 6 6 6 6 6 33
Cost (Rs. '000) -- -- 150 150 150 900 900 900 900 900 4,950
Suggested contribution to cost
IREP (Rs. '000) -- -- 50 50 50 300 300 300 300 300 1,650
Other Govt. schemes -- -- 50 50 50 300 300 300 300 300 1,650
User contribution -- -- 50 50 50 300 300 300 300 300 1,650

184
Table 7.6 : Projected programme for improved kerosene lanterns
Year 2001 2002 2003 2004 2005 2006 2007 2008 2009 2010 Total
100% potential
Target (no. of lanternss) 2,000 4,000 5,500 5,500 5,500 5,500 5,500 5,500 5,500 5,500 50,000
Cost (Rs. '000) 210 420 578 578 578 578 578 578 578 578 5,250
Suggested contribution to cost
IREP (Rs. '000) 105 210 289 289 289 289 289 289 289 289 2,625
User contribution 105 210 289 289 289 289 289 289 289 289 2,625
50% potential
Target (no. of lanternss) 1,000 2,000 2,750 2,750 2,750 2,750 2,750 2,750 2,750 2,750 25,000
Cost (Rs. '000) 105 210 289 289 289 289 289 289 289 289 2,625
Suggested contribution to cost
IREP (Rs. '000) 53 70 96 96 96 96 96 96 96 96 875
User contribution 53 70 96 96 96 96 96 96 96 96 875
25% potential
Target (no. of lanternss) 500 1,000 1,375 1,375 1,375 1,375 1,375 1,375 1,375 1,375 12,500
Cost (Rs. '000) 53 105 144 144 144 144 144 144 144 144 1,313
Suggested contribution to cost
IREP (Rs. '000) 26 53 72 72 72 72 72 72 72 72 656
User contribution 26 53 72 72 72 72 72 72 72 72 656
10% potential
Target (no. of lanternss) 200 400 550 550 550 550 550 550 550 550 5,000
Cost (Rs. '000) 21 42 58 58 58 58 58 58 58 58 525
Suggested contribution to cost
IREP (Rs. '000) 11 21 29 29 29 29 29 29 29 29 263
User contribution 11 21 29 29 29 29 29 29 29 29 263

185
Table 7.7 : Projected programme for replacement of filament lamps by electronic choke and tubelights
Year 2001 2002 2003 2004 2005 2006 2007 2008 2009 2010 Total
100% potential
Target (no. of lampss) 3,600 7,200 9,900 9,900 9,900 9,900 9,900 9,900 9,900 9,900 90,000
Cost (Rs. '000) 1,440 2,880 3,960 3,960 3,960 3,960 3,960 3,960 3,960 3,960 36,000
Suggested contribution to cost
IREP (Rs. '000) 720 1,440 1,980 1,980 1,980 1,980 1,980 1,980 1,980 1,980 18,000
User contribution 720 1,440 1,980 1,980 1,980 1,980 1,980 1,980 1,980 1,980 18,000
50% potential
Target (no. of lampss) 1,800 3,600 4,950 4,950 4,950 4,950 4,950 4,950 4,950 4,950 45,000
Cost (Rs. '000) 720 1,440 1,980 1,980 1,980 1,980 1,980 1,980 1,980 1,980 18,000
Suggested contribution to cost
IREP (Rs. '000) 360 480 660 660 660 660 660 660 660 660 6,000
User contribution 360 480 660 660 660 660 660 660 660 660 6,000
25% potential
Target (no. of lampss) 900 1,800 2,475 2,475 2,475 2,475 2,475 2,475 2,475 2,475 22,500
Cost (Rs. '000) 360 720 990 990 990 990 990 990 990 990 9,000
Suggested contribution to cost
IREP (Rs. '000) 180 360 495 495 495 495 495 495 495 495 4,500
User contribution 180 360 495 495 495 495 495 495 495 495 4,500
10% potential
Target (no. of lampss) 360 720 990 990 990 990 990 990 990 990 9,000
Cost (Rs. '000) 144 288 396 396 396 396 396 396 396 396 3,600
Suggested contribution to cost
IREP (Rs. '000) 72 144 198 198 198 198 198 198 198 198 1,800
User contribution 72 144 198 198 198 198 198 198 198 198 1,800

186
Table 7.8 : Projected programme for replacement of filament lamps by CFL
Year 2001 2002 2003 2004 2005 2006 2007 2008 2009 2010 Total
100% potential Target (no. of lampss) 6,400 12,800 17,600 17,600 17,600 17,600 17,600 17,600 17,600 17,600 160,000
Cost (Rs. '000) 2,080 4,160 5,720 5,720 5,720 5,720 5,720 5,720 5,720 5,720 52,000
Suggested contribution to cost
IREP (Rs. '000) 1,040 2,080 2,860 2,860 2,860 2,860 2,860 2,860 2,860 2,860 26,000
User contribution 1,040 2,080 2,860 2,860 2,860 2,860 2,860 2,860 2,860 2,860 26,000
50% potential Target (no. of lampss) 3,200 6,400 8,800 8,800 8,800 8,800 8,800 8,800 8,800 8,800 80,000
Cost (Rs. '000) 1,040 2,080 2,860 2,860 2,860 2,860 2,860 2,860 2,860 2,860 26,000
Suggested contribution to cost
IREP (Rs. '000) 520 693 953 953 953 953 953 953 953 953 8,667
User contribution 520 693 953 953 953 953 953 953 953 953 8,667
25% potential Target (no. of lampss) 1,600 3,200 4,400 4,400 4,400 4,400 4,400 4,400 4,400 4,400 40,000
Cost (Rs. '000) 520 1,040 1,430 1,430 1,430 1,430 1,430 1,430 1,430 1,430 13,000
Suggested contribution to cost
IREP (Rs. '000) 260 520 715 715 715 715 715 715 715 715 6,500
User contribution 260 520 715 715 715 715 715 715 715 715 6,500
10% potential Target (no. of lampss) 640 1,280 1,760 1,760 1,760 1,760 1,760 1,760 1,760 1,760 16,000
Cost (Rs. '000) 208 416 572 572 572 572 572 572 572 572 5,200
Suggested contribution to cost
IREP (Rs. '000) 104 208 286 286 286 286 286 286 286 286 2,600
User contribution 104 208 286 286 286 286 286 286 286 286 2,600

187

188
Table 7.9 : Projected fuel savings from the programme for improved chulha
No. of Households
Firewood ('000 T)
Dungcake ('000 T)
Total
Fuel saving 100% potential 50000 48.75 3.15 -- 050% potential 25000 24.38 1.58 -- 025% potential 12500 12.19 0.79 -- 10% potential 5000 4.88 0.32 -- Fuel value saved ('000 Mkcal) 100% potential 50000 195.00 7.88 202.88 050% potential 25000 97.50 3.94 101.44 025% potential 12500 48.75 1.97 50.72 10% potential 5000 19.50 0.79 20.29 Annual fuel value saved per Re (kcal/Re)
21,666.67 875.00 22,541.67 Table 7.10 : Projected fuel saving from the programme for Deenbandhu type biogas plants
No. of households
Firewood ('000 T)
Dungcake ('000 T)
Kerosene cooking fuel
('000 kl)
Total
Fuel saving 100% potential 30000 97.50 6.30 1.47 --
050% potential 15000 48.75 3.15 0.74 --
025% potential 7500 24.38 1.58 0.37 --
10% potential 3000 9.75 0.63 0.15 --
Fuel value saved ('000 Mkcal) 100% potential 30000 390.00 15.75 10.80 416.55
050% potential 15000 195.00 7.88 5.40 208.28
025% potential 7500 97.50 3.94 2.70 104.14
10% potential 3000 39.00 1.58 1.08 41.66
Annual fuel value saved per Re (kcal/Re) 2,600.00 105.00 72.00 2,777.00
Table 7.11 : Projected fuel saving for the programme for improved kerosene stoves
Hh Kerosene cooking fuel
('000 kl)
Total
Fuel saving 100% potential 50000 0.81 -- 050% potential 25000 0.40 -- 025% potential 12500 0.20 -- 10% potential 5000 0.08 -- Fuel value saved ('000 Mkcal) 100% potential 50000 6.46 6.46 050% potential 25000 3.23 3.23 025% potential 12500 1.62 1.62 10% potential 5000 0.65 0.65 Annual fuel value saved per Re (kcal/Re)

189
702.70 702.70 Table 7.12 : Projected fuel savings from the programme for nightsoil and dung based community biogas plants
Hh Firewood ('000 T)
Dungcake ('000 T)
Kerosene (‘000 kl)
Total
Fuel saving 100% potential 10000 23.10 1.50 0.35 -- 050% potential 5000 11.55 0.75 0.18 -- 025% potential 2500 5.78 0.38 0.09 -- 10% potential 1000 2.31 0.15 0.04 -- Fuel value saved ('000 Mkcal) 100% potential 10000 92.40 3.75 2.57 98.72 050% potential 5000 46.20 1.88 1.29 49.37 025% potential 2500 23.10 0.94 0.64 24.68 10% potential 1000 9.24 0.38 0.26 9.88 Annual fuel value saved per Re (kcal/Re)
3,080.00 125.00 86.67 3,378.34 Table 7.13 : Projected fuel saving for the programme for leaf litter/biowaste, night soil
and dung based community biogas plants
Hh Firewood ('000 T)
Dungcake ('000 T)
Kerosene cooking fuel
('000 kl)
Total
Fuel saved 1650 5.36 0.35 0.08 --
Fuel value saved ('000 Mkcal) 1650 21.45 0.87 0.65 22.96
Annual fuel value saved per Re (kcal/Re) 4,333.33 175.00 130.67 4,639.00
Table 7.14 : Projected fuel savings for the programme for improved kerosene lanterns
Hh Kerosene lighting fuel
('000 kl)
Total
Fuel saving 100% potential 50000 0.27 --
050% potential 25000 0.13 --
025% potential 12500 0.07 --
10% potential 5000 0.03 --
Fuel value saved ('000 Mkcal) 100% potential 50000 2.15 2.15
050% potential 25000 1.08 1.08
025% potential 12500 0.54 0.54
10% potential 5000 0.22 0.22
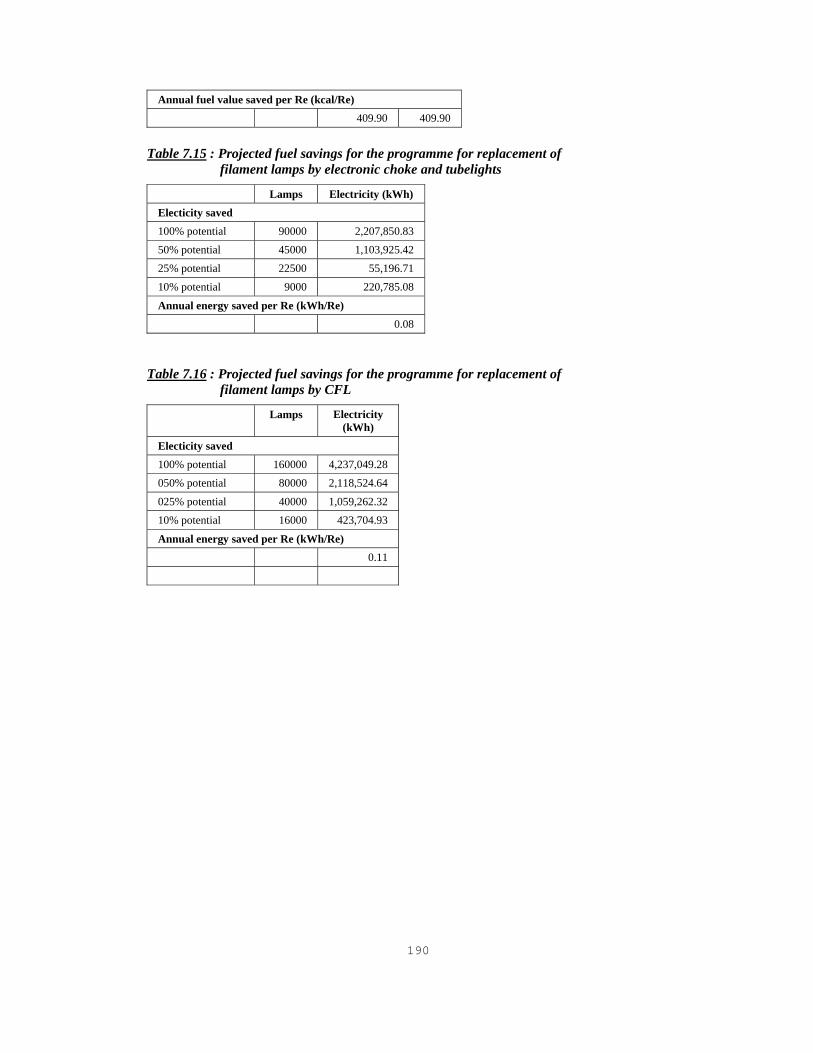
190
Annual fuel value saved per Re (kcal/Re) 409.90 409.90
Table 7.15 : Projected fuel savings for the programme for replacement of
filament lamps by electronic choke and tubelights
Lamps Electricity (kWh)
Electicity saved 100% potential 90000 2,207,850.83
50% potential 45000 1,103,925.42
25% potential 22500 55,196.71
10% potential 9000 220,785.08
Annual energy saved per Re (kWh/Re) 0.08
Table 7.16 : Projected fuel savings for the programme for replacement of
filament lamps by CFL
Lamps Electricity (kWh)
Electicity saved 100% potential 160000 4,237,049.28
050% potential 80000 2,118,524.64
025% potential 40000 1,059,262.32
10% potential 16000 423,704.93
Annual energy saved per Re (kWh/Re) 0.11

191
Table 7.17 : Expenditure on training and stipend of para professionals
Year 2001 2002 2003 2004 2005 2006 2007 2008 2009 2010 Total
Stipend 270,000 630,000 990,000 1,350,000 1,710,000 1,710,000 1,440,000 1,080,000 720,000 360,000 10,260,000
Training expenses 90,000 90,000 90,000 90,000 90,000 90,000 -- -- -- -- 540,000
Persons inducted 30 30 30 30 30 30 -- -- -- -- 180
Total expenses 360,000 720,000 1,080,000 1,440,000 1,800,000 1,800,000 1,440,000 1,080,000 720,000 360,000 10,800,000

192
Table 7.18 : Projected fuel savings for the entire programme at 100% potential
Firewood ('000 T)
Dungcake ('000 T)
Kerosene cooking fuel
('000 kl)
Kerosene lighting fuel
('000 kl)
Electricity ('000 kWh)
Improved chulha 48.75 3.15 -- -- --
Family biogas plants 97.50 6.30 1.47 -- --
Improved kerosene stove -- -- 0.81 -- --
Community biogas plant (night soil and dung)
23.10 1.50 -- -- --
Community biogas plant (night soil and dung with litter/biowaste)
5.36 0.35 0.08 -- --
Improved kerosene lantern -- -- -- 0.27 --
Electronic choke and tube -- -- -- -- 2,207.85
CFL -- -- -- -- 4,237.05
Total 174.71 11.30 2.36 0.27 6,444.90 Table 7.19 : Fuel value of projected fuel savings for the entire programme at 100% potential
Firewood (‘000 Mkcal)
Dungcake(‘000 Mkcal)
Kerosene cooking
(‘000 Mkcal)
Kerosene lighting
(‘000 Mkcal)
Total fuel (‘000 Mkcal)
Electricity('000 kWh)
Improved chulha 195.00 7.88 -- -- 202.88 --
Family biogas plants 390.00 15.75 11.76 -- 417.51 --
Improved kerosene stove -- -- 6.46 -- 6.46 --
Community biogas plant (night soil and dung)
92.40 3.75 -- -- 96.15 --
Community biogas plant (night soil and dung with litter/biowaste)
21.45 0.87 0.65 -- 22.96 --
Improved kerosene lantern -- -- -- 2.15 2.15 --
Electronic choke and tube -- -- -- -- -- 2,207.85
CFL -- -- -- -- -- 4,237.05
Total 698.85 28.24 18.87 2.15 748.11 6,444.90 Table 7.20 : Impact of entire biofuel programme on the pressure on the commons at different levels of achievement of potential
Programme coverage as %
of potential
Projected 2010 dry biomass
extraction from the commons
('000 T)
Estimated firewood saving from the entire
programme ('000 T)
Dry weight of estimated
firewood saving from the entire
programme ('000 T)
Estimated area of forests and
commons (ha)
Extraction rate from commons (T dry biomass
per ha)
Reduction in extraction rate
due to programme
(T dry biomass per ha)
100% 169.79 174.10 139.28 39.50 0.77 4.50
50% 169.79 87.05 69.64 39.50 2.54 2.25
25% 169.79 43.53 34.82 39.50 3.42 1.12
10% 169.79 17.41 13.93 39.50 3.95 0.45

193
Annexure 7.1
Sustainable and Affordable Energy in Rural and Small Town Communities
K. R. Datye
Abstract
The paper presents an energy perspective based on mass utilisation of renewable
energy a paradigm change is foreseen which aims at energy self reliance. Energy will be
affordable for poor while the availability of energy will be rapidly improved with improved
cost recovery so that adequate finance can be mobilised.
With a systemic synergy between energy and materials input constraints will be
overcomed. Advances in material technology based on biomass and renewable energy
will contribute to cost reduction in construction of facilities and fabrication of equipment.
By use of biomass fuel in conjunction with hydro and wind energy system biomass fuel
requirement will be reduced and further with cogeneration the energy generation will
become competitive with conventional options.
The result of parametric studies are presented, cost of generation for replicable system
of 6.5 MW to serve a variety covering the whole range of users including small producers
irrigation and lightening needs in isolated locations through user participation in
management with internal cross subsidies through differential tariff have been worked
out. The energy will be affordable to poor because irrigation cost of proposed system will
be competitive with conventional options based on supply from grid of electricity
generated in mega projects based on imported fuel and yet cost recovery obligation will
be made for capital investment with commercial rates of interest. By availing the interest
subsidy the user producers community would become entitled to low interest rate finance
which would further contribute to cost reduction.
A methodology of water balance and biomass balance study is described and results of
on going studies with participation of rural communities are presented which serve to
establish how the competition with regards to land and water required for agriculture will
be avoided.
==================================================================

194
1.0 Introduction Biomass is an input to serve various end uses of energy such as fuel and material for
construction or equipment fabrication. Biomass use can be reduced by use of solar
thermal energy, hydro - power in hybrid systems. Biomass can also be used for the
productions of liquid fuels, intermediates and fine chemicals. An important consideration
in energy planning, is the generation and sustenance of biomass surplus after meeting
the subsistence need of fodder and fuel. It can be seen from the overview presented
later that various biomass inputs such as wood bamboo fibers, starch from tubers and
produce from forest trees and trunks such as oil resins and latex can be produced from
waste lands unsuitable for agriculture production.
The waste land which would be developed with labour intensive technologies using very
limited quantity of irrigation water supplied from local storage reservoirs. Preliminary
water balance studies show that the required water doesn't create allocation problem
since it is not needed in the good years for agriculture. This variable water when
acquired over the hydrological cycle can be sufficient for the yield consumption needed
to generate the desired biomass surplus.
2.0 Technology assessment criterion. We propose the following parameters for assessment of technologies for renewable energy generation and biomass utilisation. Energy Gain Ratio (EGR) Energy Gain Ratio (EGR) is defined as the ratio of net energy generated over the service life of plant and equipment to the energy invested in the installation. Energy required, to produce and transport equipment must also be included. For example, the solar collector design proposed in this paper require 40kg of steel and would produce heat energy equivalent to 1kg coal per day. Three kilograms of coal are required to manufacture one kilogram of steel. Over a service life of 20 years, use of this solar collector will result in a coal saving of 5000 kg, while investing an energy equivalent of 120 kg of coal. This leads to an energy gain ratio > 40. This is a simple illustration of this parameter, in practice all material and fabrication energy inputs will be need to be considered.
Coal Replacement Value Multiplier (CRV) This parameter reflects the energy conservation benefits of the materials technologies. The goal of these technologies is to add use or market value to biomass by processing. Otherwise, unprocessed biomass is only equivalent to 1 kg of coal. For example, the preservative treated wood and reconstituted wood can replace 1 to 2 kg of steel with equal structural capability. Since 1 kg of steel requires 3 kg of coal energy input, we obtain a CRV multiplier of 3 to 6. Similar

195
value addition prospects exist when biomass is used to produce chemical intermediates, liquid fuels, resins and pesticides.
Energy Self Reliance The strategic goal is to balance the exchange between the rural and small town population and the urban, industrial economy. This would be measured in monetary as well as energy terms. The goals would be accomplished by having net excess in the coal replacement value of locally produced biomass and renewable energy over external inputs. The exchange should be balanced in monetary as well as energy terms. Energy Self reliance can be achieved by giving a priority to the development of techniques with a high Energy Gain Ratio(EGR) and the use of materials with a high CRV Multiplier. If the EGR and CRV values for specific technology are higher than the minimum values established through energy growth rate analysis the availability biomass and fossil energy would not be a constraint. Benefit of trade is recognised in the concept of self - reliance. Hence it would not suffer the rigidity of a closed economy based on self - sufficiency. Thus consumption need not be restricted to material or energy from local sources. 3.0 Energy end-use Usually energy demand is considered in terms of fuel supply or electricity. In developing
countries investment needs for infrastructure and development of energy sector should
take a priority over consumption needs. Renewable sources have an advantage of
saving of fuel inputs for energy generation and material inputs for construction and
fabrication of equipment. However they have been significant investment liability. It is
often not recognised that process energy is a major end use and supply where demand
options exists with regard to the form of energy i.e. heat and mechanical versus
electricity. Conversion transmission and distribution losses add to the cost of energy. If
renewable energy can be used locally in the form in which it is produced investment cost
for transmission and transport can be reduced and conversion losses can be minimised.
The following grouping of end uses was done to facilitate demand management by
consideration of energy generation and supply options. It was seen from energy growth
analysis presented later that the sustenance of biomass surplus may become a major
constraint if it is directly used as a fuel to substitute conventional fuel sources.
Alternatively if biomass is a material input supply constraints can be minimised with right
technology choices.
There is a second order benefit when biomass is used to fabricate renewable energy
generation equipment. Further through demand management renewable energy can be

196
used in various forms as process energy. In hybrid systems such as solar thermal and
mechanical to save fossil fuel and electricity a matrix analysis will be peresented in the
next paragraph and which will help understand feed back loop and to evaluate second
order benefits.
The major end uses are grouped in four categories -
Materials:
Inputs for development of water resources energy generation and infrastructure facilities
to serve various needs like building sanitation water supply and roads.
Electricity:
Electricity for domestic, commercial, light industry and irrigation pumping needs etc.
Process Energy:
Mainly heat and mechanical energy in conventional industries such as biomass
processing, i.e. agro and forest products industries, local mineral processing such as
rock, sand, clay, lime, waste recycling. Advanced medium temperature processes would
also be considered such methane reforming pyrolysis, chemical processes such as
distillation concentration, separation, mechanical processes for small industrial units like
wire drawing forging etc.
Over a long term electricity from renewable sources can be used in conjunction with
solar thermal and gasified low grade fuel can be used for high temperature furnaces
closed control on frequency and voltage would be required and energy generation costs
could be brought down in several applications through coordinated efforts of energy
users and providers.
Chemicals:
Basically organic chemicals produced with biomass input in dispersed industry. Small
quantity of fossil fuel based materials would be blended e.g. phenol formaldehyde with
phenol from biomass. It would be seen from the matrix that CRV multiplier is a important
consideration for achieving desired growth of the energy sector for the demand pattern
presented later in the section 5.0.
4.0 Growth rate analysis. Physical constraints on energy growth rate are considered and scenario has been worked out to examine the impact on growth rate. A high rate of growth in energy and infrastructure sector is foreseen. The growth table shows that energy saving required to

197
produce necessary inputs will not exceed 300 kgcr. With CRV of around 2.4 a biomass of input of only 125 kgcr and a fossil input of 50 kgcr is needed. Thus with the proposed CRV and EGR input constraints can be easily overcomed. It was recognised that the fuel inputs are required. • Availability depends on the rate of saving. • The growth analysis presented in the following table has a preparatory phase of ten
years. In the first five years the process bio resource base will be to build up and in the next five years the technology upgradation will be done to get higher energy gain ratios.
The following table illustrates the growth in per-capita, per-year renewable energy generation that is possible when the initial renewable energy equipment has an EGR of 60, and 10-15% of the energy generated is invested in additional renewable energy generation infrastructure every year. It can be seen that under such conditions, and assuming a service life of 20 years for the equipment, the renewable energy component of about 1300 kgcr that is envisaged in the 2025 scenario can be achieved in about 6 years.
Renewable Energy Growth Table (All values in kgcr/capita/year)
Year Generation # Saving • Increment + Energy Gain
1. 500 50 ---- 1:60 2. 500 50 ---- " 3. 650 65 150 " 4. 650 65 ---- " 5. 845 84.5 195 " 6. 845 84.5 ---- 1:40 7. 1015 155 170 " 8. 1015 155 ---- " 9. 1325 200 310 "
10. 1325 200 ---- " 11. 1625 245 300 1:30 12. 1625 245 ---- " 13. 1995 300 370 " 14. 1995 300 --- " 15. 2445 ---- 450 "
• In the above scenario the rate of saving is 10% for the first five years then the from sixth year
onward the rate of saving is assumed as 15%. • It is assumed that new equipment starts generating after a time loss of two years from the
year of investment. • Annual increment of generation works out to energy gain ratio / service life. Thus , the
investment of 50 Kg in the first year starts giving incremental generation of 150Kg / yr. after two years when energy gain ration is 60.
• With a service life of 20 years multipliers are 3, 2, 5 respectively for energy gain ratio of 60, 40, 30 respectively.
• With growth of energy sector labour cost will rise and hence energy gain ratio will down ,also biomass will become a constraint at high rate of investment hence energy gain ratio reduces.
• It is evident from the above tables that even half of the targeted energy saving and renewable energy usage is incorporated the energy availability considered in the energy production scenario can be easily achieved.

198
• Energy saved is traded with fuel and biomass and invested into renewable energy generation and conservation facilities .
• Even if this entire 300 kgcr invested is fossil fuel it should be possible to obtain the fuel inputs from local sources or imports of cheap low grade fuels. For a five fold increase in the energy generation fuel consumption in India will be within the acceptable norms of the global worming mitigation. Most of the renewable material will be produced in small industries and large industries.
5.0 Scenario 2025 with input output matrix In the scenario it is assumed that technologically the energy gain ratio considered in the following tables are already achieved. The energy scenario for 2025 presented here pre supposes a restructuring of the energy, water, agriculture and allied sectors. Providing a basci service to all at affordable rate will be possible by use of interest subsidies as a insentive for metigaion of C02 emmission and dispersal. Withdrawal of consumption subsidy will be socially acceptable with reduce transportation demand resulting from reduction of distance between workplace and habitation. More specifically, we adopt an integrated view that encompasses biomass production, food processing, and processing of biomass for infrastructure input and chemical intermediate production. It shows that the restructuring makes it possible for India to overcome resource constraints and reach a quality of life comparable to that of post-Second World War Europe on the basis of an energy availability of 2500 Kgcr. The demand assessment is generally on the lines of work Mr. A. K. N. Reddy, Mr. Gustavson The following tables indicate how energy self - reliance can be achieved and various needs can be fulfilled through an optimum combination of biomass, fossil fuel and renewable energy. In fact biomass could play a major role in making renewable energy competitive with fossil energy. The scenario shows how a five fold improvement in the energy availability can be achieved without significant increase in the fossil energy supply. The critical input is biomass and the starting point is therefore creating the essential biomass surplus after fulfilling the basic needs. The study shows how energy in various forms i.e. materials, process energy, chemicals and electrical energy for domestic, commercial and industrial use become available in the optimized hybrid system. The affordability and availability of renewable energy and materials for infrastructure is critically dependent on supply of necessary biomass inputs.

199
Energy Production Scenario for 2025
(All values in kg/capita/year)
END USE
Materials
Electricity
Process Energy
Chemicals*
Biomass 250 100 - 90 350
Fossil (std.) 100 250 80 120
350 std. Coal
Local low grade fuel 100 80 120 300
Renewable (solar, wind, hydro) 100 300 620 300 1320 Energy Availability 600 (kgcr) 900 kWh 700
(kgcr) 300 (kgcr) 2500 (kgcr) C.R.V. Multiplier 2.4 3.3
• 90 Ethanol equivalent. The column chemical includes liquid fuels, chemical intermediates
and fine chemicals. The biomass input required is the input required to produce liquid chemicals have energy equivalent of 90 liters of ethanol.
• Solid fuel energy is taken as standard fuel of 4000 kcal per kg. This is the fuel value of common Indian coal. This is half of petroleum products which is around 10000 kcal per lit. Currently we are considering 500 cc. Petroleum as equivalent to our standard fuel of one kg.
• Chemicals like liquid fuels intermediate chemicals and fine chemicals are considered e.g. ethanol, methane, styrene etc.
• Fuel efficient engines consume per kWh 1250 kcal where as coal based plants of large turbine consume 2500 kcal and that of small turbine 3000 kcal along with this they also have heavy transmission losses. On the other hand chemical based prime movers can be used directly at the workplace. Hence the ratio of coal value multiplier for ethanol is taken as 3.3.
• The energy input figures in materials and chemical by low grade fuels and renewable energy are interchangeable and can be decided on the availability of the sources. This gives a higher flexibility for the functioning of the system. This is possible because of the dispersed nature of the project.
In order to reach the situation presented in the Scenario for 2025. It is clear that the renewable energy infrastructure has to grow considerably. We believe that such growth can be achieved if 10 - 15% of the energy produced every year is invested into building new infrastructure for harnessing renewable energy. This table basically depicts the input output matrix of the energy system. Biomass, Local low grade fuels like fossil (e.g. lignite), Renewable energy sources such as solar, wind and hydro. The outputs for which the energy will be used are grouped in four categories. Group1: Materials used for water and energy resource development and related facilities and infrastructure for transportation and habitat. This will cover the whole range of

200
equipment's and structures for roads and bridges, waterways, pipelines, waste water treatment plants, storage reservoirs, windmills, hydro power and solar thermal energy generation. Biomass to be used in combination with synthetic polymers, metals (steel) and ceramics.
Group 2: Hybrid energy generation systems for domestic, agricultural and commercial use. Group 3: Process heat and electricity used for processing local minerals, waste recycling and production of advanced materials. Group 4: Biomass based chemicals and liquid fuels with a blend of coal or petroleum based chemicals.
The figures in the table are equivalent Kilograms of coal having calorific value as 4000 Kcal/kg. 'Kgcr' indicates replacement values of 'Coal Equivalent Kg' of products with equal use or market values. The figures in the table are 'per capita'.
6.0 Parametric Study of Energy Generation Costs. A widely replicable hybrid system with solar biofuel, fossil fuel and hydropower is considered in the table below. The values may be scaled up according to the size of installation. A 6.5 MW system is expected to serve 6000 rural and small town households (Values in the following table are based on requirement of six households -- 24000 KWh per year as against present availability of only 6000 KWh). One U.S. $ = Rs. 43/- (subject to variation)
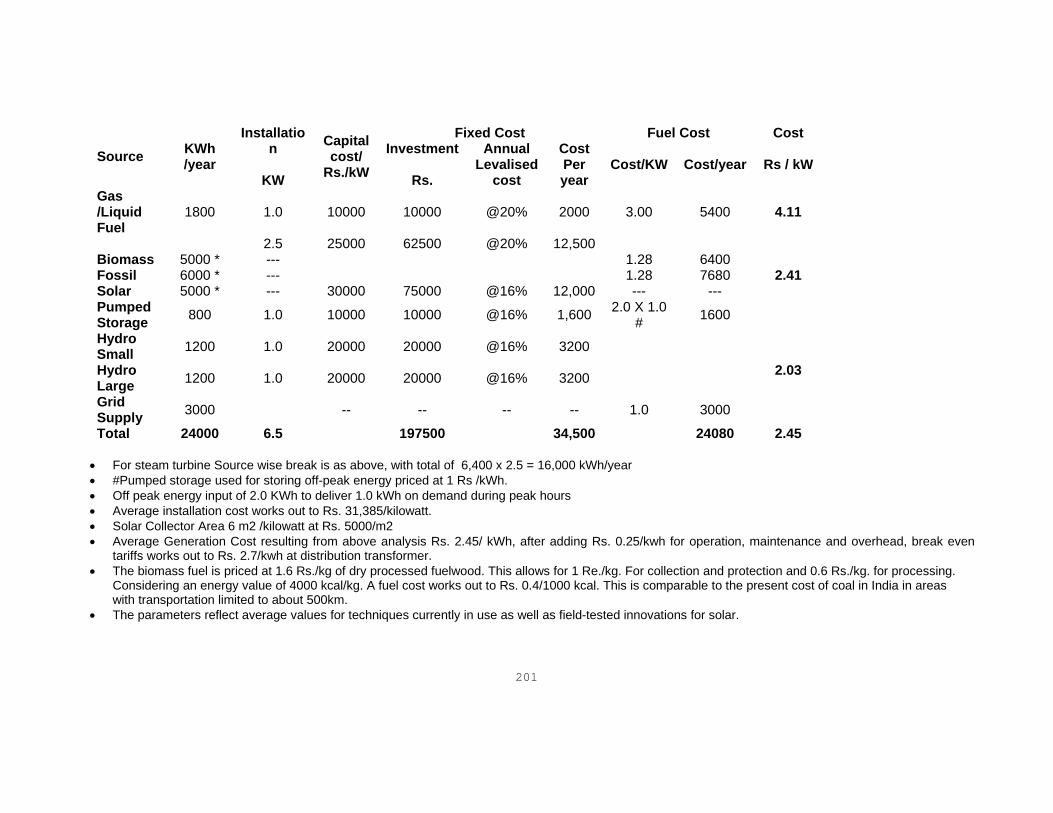
201
Source KWh /year
Installation
KW
Capital cost/
Rs./kW
Fixed Cost Fuel Cost Cost Investment
Rs.
Annual Levalised
cost
Cost Per year
Cost/KW Cost/year Rs / kW
Gas /Liquid Fuel
1800 1.0 10000 10000 @20% 2000 3.00 5400 4.11
2.5 25000 62500 @20% 12,500
2.41 Biomass 5000 * --- 1.28 6400 Fossil 6000 * --- 1.28 7680 Solar 5000 * --- 30000 75000 @16% 12,000 --- --- Pumped Storage 800 1.0 10000 10000 @16% 1,600 2.0 X 1.0
# 1600
2.03
Hydro Small 1200 1.0 20000 20000 @16% 3200
Hydro Large 1200 1.0 20000 20000 @16% 3200
Grid Supply 3000 -- -- -- -- 1.0 3000
Total 24000 6.5 197500 34,500 24080 2.45 • For steam turbine Source wise break is as above, with total of 6,400 x 2.5 = 16,000 kWh/year • #Pumped storage used for storing off-peak energy priced at 1 Rs /kWh. • Off peak energy input of 2.0 KWh to deliver 1.0 kWh on demand during peak hours • Average installation cost works out to Rs. 31,385/kilowatt. • Solar Collector Area 6 m2 /kilowatt at Rs. 5000/m2 • Average Generation Cost resulting from above analysis Rs. 2.45/ kWh, after adding Rs. 0.25/kwh for operation, maintenance and overhead, break even
tariffs works out to Rs. 2.7/kwh at distribution transformer. • The biomass fuel is priced at 1.6 Rs./kg of dry processed fuelwood. This allows for 1 Re./kg. For collection and protection and 0.6 Rs./kg. for processing.
Considering an energy value of 4000 kcal/kg. A fuel cost works out to Rs. 0.4/1000 kcal. This is comparable to the present cost of coal in India in areas with transportation limited to about 500km.
• The parameters reflect average values for techniques currently in use as well as field-tested innovations for solar.

202
The solar biomass hybrid system cost and grid integrated with small and large hydro are viable and competitive with mega project options. They have no liability for transmission, since new generation will be mostly near the demand centers. within economic The average generation cost is competitive with mega projects. There is a margin of 10% for average selling price of Rs. 3 per kWh. 7.0 Overview of technology development (Materials and Hydro) The technology development is simultaneously done in the three major renewable
sources of energy viz. solar thermal, small hydro and wind energy. Along with these
developments, developments also have been done in the field of wood bamboo
composite structures which can be used in the infrastructure development.
It has been found that the development work in the composites has been competitive
with the existing infrastructure facilities available in the market.
It is established that the solar thermal equipment can be fabricated in small
workshops which doesn't require spcialised manufacturing facilities in a very
economical price. The existing manufacturing prices of one sq. meter area is 7500
Rs which is competitive as compared to the international coated prices of solar
dishes which are around 9000 Rs. It has also been realised that with optimisation
with composite materials the cost of fabrications can be brought down to 4500 Rs.
Currently the energy gain ratio available from solar thermal dishes is around 30
which can be raised up to 60 by composite optimisation.
8.0 Details of chemicals HIGH VALUE CHEMICALS AND LIQUID BIOFUEL PRODUCTION Chemical intermediates having an equal energy value such as butanol isopropanol, acetone and ethanol have higher market values as compared to diesel or fuel oil. Production of ethanol and chemical intermediates per hectare of land in the common property domain can easily be taken at 2000 liter/ha/year for plots of sweet sorghum, sugarcane, cassava (Table and 3). Assuming consumption of 500 Kwh/family/year or 150 litre of liquid petroleum fuel/year, requirement of 100 families of liquid fuel works out to 15 kiloliters of diesel. This can profitably be exchanged with equal quantity ethanol and chemicals at market prices. In watershed projects preference should be given to allocation of funds to the enterprises of the poor for production of inputs into the liquid fuel or chemical intermediates production. For land producing biomass input such as cassava, sweet sorghum, Brazilian average is 2000 litres of ethanol ha/year. With Prayog arriver techniques this can be increased to 3000 litres/ha/year (Annex 1). The requirement of land then reduces to 5.0 ha for 100 families. There are several other products which have a high energy and market value such as pesticides, latex, oils, resins (Table 1). Usually their plantations have longer

203
periods of yield realisation. There is no hazard of market saturation as a wide range of application possibilities exist. Diversity of biomass production can be maintained and a mix can be chosen of early maturing species and other which requires longer period for yield realisation/establishment. This will enable a strategy to be worked out for phased development where by overall availability of bioenergy can be raised progressively (Tables 1,2 and 3).

204
Table 1
High Value Biomass Products. Inputs for Liquid Fuel and Chemical Intermediate Production.
- Starch - various tubers including tapioca, cassava, sweet potato - Sugary juices - sweet sorghum, sugarcane and palms - Various oils essentially as energy or chemical intermediates - Jatropha - Valuable oils with preservative and pesticides value such as neem, Karanj Latex
including Jatropha - Acrylic resins - from latex yielding dryland species - Phenols including cashewnut shell and Bhilava nut (Bibba) - Tannin - Bark and Harda
The above list does not include items which have very specific uses and therefore difficult to market such as medicinal herbs, and consumer products such as perfumes, essential oils, flowers with hazard of market saturation.
Table 2
Ethanol Yields of Various Crops,
Based on Average Yields in Brazil
Two crops a year are possible in some areas. Cassava yields could be boosted to 3600 liter/ha/year by improved cultivation technologies (except for corn which is based on US yields).
Ethanol yield from crop Crop (lit/T)
Crop yield (T/ha/yr)
Ethanol yield (lit/ha/yr.)
Sugarcane 70 50# 3500 Cassava 180 12# 2160
Sweet Sorghum 86 35* 3010 Sweet Potato 125 15 1875 Corn (maize) 370 6 2220
Wood 160 20 3200
Ref: John W. Twidell, Anthony D.Weir, 'Renewable Energy Resources'
Table 3 Types of Raw Materials Potentially Useful for Microbial Conversion to fuels Ethanol Acetone-Butanol Butanol-Isopropanol Acetone-Ethanol
Molasses Molasses Molasses Molasses Sulfite liquors Sulfite liquors Sugarcane Potatoes Cellulose pulp Corn cobs Sulfite liquors Peanut Hulls
Potato products Wood sugars Starchy products Corn cobs Citrus waste Cassava Sweet potato
Ref : National Academy of Sciences 'Energy for Rural Development'

205
Table 4 Ethanol Production
Energy analysis of ethanol production from various crop substrates Data refer to the gross energy requirement for the crop input and each component of manufacture : unit MJ/kg of anhydrous ethanol produced. The heat of combustion of the output ethanol is 30 MJ/kg.
Sr. No. Sugarcane Cassava 1. Substrate 7.3 19.2 2. Chemicals 0.6 0.9 3. Water pumping Rs. 1/kwh 0.3 0.4 4. Electricity Rs. 1/kwh 7.0 10.5 5. Fuel oil Rs. 1/kwh 8.0 29 6. Machinery and Buildings 0.5 1.2 7. Total (1 to 6) : MJ/kg 24 61 8. Net Energy : 30 MJ/kg - (7) +8 -31 9. Total (1 + 2 + 6) 8.4 21
10. Net Energy : 30 MJ/kg - (9) +21 +9 Ref: John W. Twidell, Anthony D. Weir, 'Renewable Energy Resources Materials, Energy, Fuels and Biomass System Sustainable Options for conventional Fossil Energy Technology.
Various end-uses • Liquid and soil fuels, and solar thermal energy use in hybrid systems for
electricity and heat energy production and dispersed materials production. • Allocation of 0.1 hectare to produce inputs for liquid fuel and chemicals
intermediate production. When combined with entitlement to water and assistance for education and employment. The production potential would be at least 300 litres of ethanol or equivalent energy value as butaneol acetone or high value oils such as Jatropha, phenolic resins, latex as acrylic substitute.
• The energy value would be equivalent of 1500 kg coal replacement value. Pesticides and medicinal herbs would be high value item requiring for production, an extended period of 5 to 8 years. Care and attention will be needed to the tree crop areas a whole range of consumer products, herbs cosmetics can also be produced and this being supplementary item of income livelihood would not depend on production and marketing of this consumer items. Biomass based materials such as wood, bamboo fibres will provide inputs for a whole range of infrastructure needs i.e. buildings, habitat infrastructure and transportation, pipelines, waterways, bridges, roads, containers, barges. Equipment and facilities for water and energy production would also use biomass based materials and solar thermal processed energy based inputs. This will contribute to raising of the energy gain ratio. With inter connection and hybrid energy use (wind/hydro) based electricity in conjunction with high temperature solar equipment would provide process energy for energy intensive conversion of methane into high value fuels and chemicals. This solar aided production of water - gas and methane reforming will provide inputs for chemical industry. Methane could be natural gas or derived from biomass. The

206
renewable energy hybrid system can as well be used for high-tech production of ceramic carbon fibre glass fibre. 9.0 Land use modeling It is necessary to take up studies of an energy input output, water balance and
productivity of land to access the potential for biomass use. Market mechanism can
be used to optimise the allocation of land and water to biomass production and their
by to augment the biomass supply. There is a very good prospect of overcoming the
supply constraints through value addition by availing advances in materials and
renewable energy generation technology.
However, it is necessary to ensure that the market mechanism doesn't not result in
encroachment on the subsistence base of the poor. The main objective of the land
use, water balance and productivity studies would be determine decide the policy on
regulations of trade in water and restriction of private ownership of land. The
regulation and land legislation should result in building common resources pool of
water and biomass and ensure access for the poor to this pool.
The land use and water balance studies should be performed to establish the
minimum water requirement for household food security and to provide fodder and
fuel to satisfy basic domestic and cattle needs.
Water for the minimum needs should be exclude from the tradable component and
the biomass market would also have to be regulated by allocating the share of the
produce to the resource poor families which can be determined on the basis of the
regional needs of material input requirements of the biomass based material
production systems.
In areas of water scarcity and population pressure interest subsidies for the solar
energy system and supply of low grade fuels through a public distribution systems
would contribute to overcoming fuel shortages.
This will help to overcome the short term distress of the poor when due to restriction
imposed that rural communities are subjected to the poor on grazing and fuel
collection on common lands and degraded private wastelands.
Pilot projects can be taken up based on the technology for wood bamboo and fiber
processing which is in advanced state of development to validate the income
generation potential assessment for the dispersed material production units.

207
Domestic fuel needs of 2 ton biomass can easily be met from low grade fuel of only
about 500 kg in conjunction with solar thermal energy, biomass to meet the domestic
needs.
The briquetting technology for low grade fuel has a very good market potential and
the cost of briquetting can be brought down by using the waste heat of solar thermal
energy based equipment for electricity generation and mechanical energy supply.
Just about a ton of biomass supply to each household for value added processing
would generate income of 5000 Rs. which will make the low grade fuel affordable
since its cost is not likely to exceed 1000 Rs/household.
This opens up the avenue of immediate shift to interest subsidy to make withdrawal
of subsidies for electricity and water and reallocating public funds to create incentives
for technology which could be used to enhance biomass production on wasteland by
ensuring early establishment, high survival rates and yield improvement with very
optimal use of chemical inputs.
By combination of scientific and participative approach the studies should aim at
identifying areas. The studies can also be used for identification of area where pilot
projects can be taken up. Overall objective would be to test the validity of the
postulations of this paper that use of biomass as an energy input will not compete
with agriculture and would not thereby encroach on the livelihood of the poor.

208
Annexure 7.2
List of NGOs and their addresses
Given below is a list of NGOs and organisations, along with their addresses, working in
Solapur district and the nearby areas who could be associated with the energy programme in
the block.
e) Mahatma Phule Samaj Seva Mandal Niyojan nagar Jamkhed Road P.B.No 9 Karmala District Solapur 413203 Contact person: Shri Pramod Zinjade Tel. No. 02182-20609
f) Model Action for Rural Change
'Nimbonichamala' At post Kem Taluka Karmala District Solapur 413223 Contact person: Shri Shivaji Talekar Tel. No. 02182-40760/40778
g) Nisarg Yatri 20, Pundaliknagar, Pandharpur District Solapur 413304 Contact person: Shri R. Govind Sabnis Tel. No. 020-6870957, 6878243
h) Vanashthali Rural Development Centre 318/19 B Canal Road Shivajinagar Pune, 411016 Contact person: Prof. Nirmala Purandare Phone 020-5651550

209
References 1. Appropriate Rural Technology Institute (ARTI), "Sarkarmanya Sudharit Chulhi", Pune,
Undated. 2. Asian Development Bank, "Energy End Use : An Environmentally Sound Pathway". 3. Athawale Sunil, "Wind Energy", National Book Trust, 1994. 4. Baldwin S, "Biomass Stoves : Engineering Design, Development, and Dissemination",
Princeton University Center for Energy and Environmental Studies, Princeton University and Volunteers in Technical Assistance, Arlington, VA, 1987.
5. Baliga B.N., S. Dasappa, et al, "Gasifier Based Power Generation: Technology and
Economics", ASTRA, Indian Institute of Science, Bangalore, 1990. 6. Banergy R. and Parikh J., "Demand Side Management in Power Planning : An Exercise
for HT Industries in Maharashtra", Economic and Political Weekly, XXVIII: (32,33), 1993.
7. Bhatia R., "Diffusion of Renewable Energy Technologies in Developing Countries : A
Case Study of Biogas Engines in India", World Development,, 18 (4)575-590, April 1990. 8. Bramhe Sulbha & Paranjape Suhas, "Rural Energy Uitlisation: Case Study of
Marathawada Region, Maharashtra : Part - I Domestic Energy Utilisation", Gokhale Institute of Politics and Economics, Pune, 1985.
9. CEA (Central Electricity Authority), "Fourteenth Electric Power Survey of India", New
Delhi, 1991. 10. CEA, "General Review : Annual Statistics of the Indian Power Sector", New Delhi, 1993. 11. Census of India 1991, "District Census Handbook" , Solapur District, Village and Town
Directory, Director Printing and Stationery, Mumbai, 1995. 12. Datye K.R., "Banking on Biomass: A News Strategy for Sustainable Prosperity based on
Renewable Energy and Dispersed Industrialisation", Centre for Environment Education, Ahmedabad, 1997.
13. Department of Economics and Statistics, "District Social and Economic Review", Solapur
District for 1990-91, 1997-98 and 1998-99, Government of Maharashtra, Mumbai. 14. Dhawan A.S., R.B. Mahajan, et al, "Constraints in the Functioning of Biogas Programme
in Maharashtra State", Energy Management,, July-September 1989. 15. Energy Management Centre, "Energy Conservation Measures in the Domestic Sector",
New Delhi, India. 16. ECON, Pollution control Pvt. Ltd. Integrated Rural Energy Plan for Gadhinglaj, Kolhapur
District, Maharashtra

210
17. Geller H.S., and G.S. Dutt, "Measuring Cooking Fuel Economy", Wood Fuel Surveys, Report GCP/INT/365/SWE, FAO Programme for Local Community Development, Rome, 1983.
18. GoM, "Approach Paper : 8th Five year Plan - Energy Sector", Study Group on Energy,
Government of Maharashtra, Mumbai, 1989. 19. India Meteorological Department; "Monthly and Annual Rainfall and Number of Rainy
Days ; Period 1901 - 1950", Part IV B, Government of India Press, Nasik, 1970. 20. Joshi V., "Rural Energy Demand and Role of Improved Chulha", Energy Policy Issues,
4:23-35, Tata Energy Research Institute, New Delhi, 1988. 21. Kishore V.V.N., "Cooking Energy Systems - A Comparative Study", Energy Policy
Issues, 4:37-45, Tata Energy Research Institute, New Delhi, 1988. 22. Lokras S.S., D.S.S. Babu., et al, Development of an Improved Three-Pan Cookstove,
pp13-17 in Procedure of the ASTRA Seminar, Indian Institute of Science, Bangalore, 1983.
23. Mani A., and Rangarajan S., "Solar Radiation Over India", Allied Publishers Pvt. Ltd.,
New Delhi, 1982. 24. Ministry for Non-conventional Energy Sources, "Rashtriy Unnath Chulha Karyakram",
New Delhi, 1996. 25. Nadel S.; Gopinath S. and Kothari V., "Opportunities for Improving End-use Electricity
Efficiency in India", USAID, Washington DC, 1991. 26. Nadal Steven, Shepard Michael et al, "Energy Efficient Motor Systems", Council for an
Energy Efficient Economy, 1991. 27. Natarajan, I., Domestic Fuel Survey with Special reference to Kerosene, National Council
for Applied Economics Research, New Delhi, 1985. 28. ORG (Operation Research Group), "Improving Efficiency of Agricultural Pumping
Systems for Energy Conservation", Vadodara, India, 1991. 29. Paranjape Suhas and Joy K..J., ."Sustainable Technology; Making the Sardar Sarovar
Project Viable", Centre for Environment Education, Ahmedabad, 1995. 30. Parikh et. al., " Planning for demand side management in the electricity sector", Indira
Gandhi Institute for Development Research, B0mbay, 1994. 31. Patel S., "Low Cost and Quick Measures for Energy Conservation in Agricultural
Pumps", TERI Information Digest on Energy, 1(4):25-133, New Delhi, 1991. 32. Progressive research Aids Pvt. Ltd, "Report on integrated rural energy plan of
Mandangad block" August 1994. 33. Rajadhakshaya Committee Report, Government of Maharashtra, 1997. 34. Rajashekar P Mandi, et.al., "Energy Conservation in a 7.5 kW Agricultural Pumpset - A
Case Study", Energy Resource Center, Central Power Research Institute,

211
Thiruvanthapuram. National Seminar on Conservation of Energy in Agricultural Pumping Systems, Organised by Central Institute for Rural Electrification, Hyderabad. 1994.
35. Rao, G., Dutt, G. and Phillips, M., "The Least-Cost Energy Path for India: Energy
Efficient Investments for Multilateral Development Banks", Washington D.C., International Institute for Energy Conversion, 1991.
36. Ravindranath, H.N. Chanakya, Biomass-based Energy System for a South Indian Village,
Biomas, 9:215-33, 1986. 37. Reddy A.K.N., P. Balachandra, and A. D'Sa, "A Programme for the Replacement of
Incandescent Bulbs with Compact Fluorescent Lamps in the Domestic Electric Connections of Karnataka", Draft Report, Dept. of Management Studies, Indian Institute of Science, Bangalore, 1990.
38. Reddy, A.K.N., G.D. Sumithra, et al, "Scenarios for the Evolution of the Pura Energy
Centre", Report of ASTRA, Indian Institute of Science, Bangalore, 1988. 39. Sant, G., "Survey of Water-Heating Practices in City of Pune, India", (unpublished
paper), 1991. 40. Sant Girish, Dixit Shantanu, "Agricultural Pumping Efficiency in India: The Role of
Standards", Energy for Sustainable Development , Vol. III, No.1, May 1996. 41. Sant Girish and Dixit Shantanu, "Least Cost Power Planning: Case Study of Maharashtra
State", paper submitted to Energy for Sustainable World , 1996. 42. TERI, "TERI Energy Data Directory and Yearbook", Tata Energy Research Institute,
New Delhi, 1989. 43. TERI, "TERI Energy Data Directory and Yearbook", New Delhi, 1991. 44. WREB (Western Regional Electricity Board), "Annual Report 1991-92", Bombay, 1991.