energy technology landscape: one indian …. ajit sapre reliance technology group 10th october, 2012...
TRANSCRIPT

Dr. Ajit Sapre
Reliance Technology Group
10th October, 2012
Energy Technology Landscape: One Indian Perspective
2
Outline
1. Strategic Drivers & Challenges
2. Climate Outlook
3. Resource Outlook
4. Role of Natural Gas
5. Role of Biotechnology
6. Inclusive Innovation – Gandhian Engineering
7. Academia Industry Interaction
1 2 3 4 5 6 7
Copyright © 2012 Reliance: All rights reserved.

3
Global
Green
Strategic
drivers
Growth
Emerging chemical leaders
from ME and Asia
Increasingly global supply
chain in fuels/ petrochemicals
Favoring Asia and ME
Commoditization of
specialties
Designer materials
Alternate feed-stocks
Carbon risk
Advancing “green wave”
Long-term Strategic Drivers & Challenges
Global “Green” Global Growth
“Green” Growth ?
Sustainability &/ or
Energy Security
Challenges
In the uncertain world innovation key to meet future global challenges
1 2 3 4 5 6 7
Copyright © 2012 Reliance: All rights reserved.

4
Climate Is Changing
Need collective action to mitigate potential disastrous consequences
Globally, June 2012 was:
36th consecutive warmest June
Mean temperature is on the rise, decade
over decade
Longer and hotter summers; more intense
heat waves
Higher temperatures lead to lower crop
fertility
More instances of weather deviations from
mean of the decade
In 1951-61 extreme weather happened
1/8% of time, now it happens 8% of time
Source: Bell Weather, The Economist, Aug 11, 2012; Hansen et al. PNAS
1 2 3 4 5 6 7
Copyright © 2012 Reliance: All rights reserved.

5 1 2 3 4 5 6 7
Replace with Arctic
Arctic Melting has accelerated
Global warming effect – More melting in summers would shrink the size over time Copyright © 2012 Reliance: All rights reserved.

6 1 2 3 4 5 6 7
Replace with Arctic
Arctic Melting has accelerated
Global warming effect – More melting in summers would shrink the size over time
Himalayan Glaciers are Retreating at 0.6% Area Reduction Annually
India at the risk of losing its major rivers,
source of drinking water and irrigation for more than one billion people
Copyright © 2012 Reliance: All rights reserved.

7
Global Action on Climate Mitigation – Moving Slowly
Advanced countries’ emissions increased in recent years,
both absolute and per capita, failing to meet Kyoto
protocol targets
Advanced countries have not done enough
“Durban Platform” agreement in Dec 2011 – Legally
binding for all countries – Terms to be agreed by 2015, to
come into effect by 2020
Goal is to ensure less than 2°C temperature rise
Specifics on the targets and aid money to developing
countries
Shale gas boom in the US – Is it a blue bridge to green
future or death of nuclear & renewables?
Need urgency in action by the world political leaders
“Okay – it’s agreed; we announce
– ‘to do nothing is not an option!’
then we wait and see how things
pan out. . . ” www.private-eye.co.uk
1 2 3 4 5 6 7
Copyright © 2012 Reliance: All rights reserved.

8
GHG Emissions Rose Dramatically since
1850 with Accelerating Industrial Revolution
However, since 1850, India contributed only 2.4% to global cumulative emissions,
and 4% since 1990
Region /
Country
Population
(million
GDP
(billion
2000 US $)
CO2
Emissions
(MTCO2)
Per-Capita
CO2
Emission
(tonnes)
World 7041 39493 28962 4.38
China 1347 2623 6071 4.58
India 1210 771 1146 1.18
Japan 128 5205 1236 9.68
USA 314 11468 5769 19.10
Germany 82 2065 798 9.71
1 2 3 4 5 6 7
Copyright © 2012 Reliance: All rights reserved.

9
Consumers in the West also Responsible for Emissions increase in the East
Today, emissions in a country accounted
through production and transportation of
goods there
Carbon leakage – Emissions in producing
countries to supply goods for consuming
countries
Consumption based CO2 accounting may
be more equitable?
Asia, particularly China, is a factory to the world
1 2 3 4 5 6 7
Copyright © 2012 Reliance: All rights reserved.

10
Equity Principle: Common but Differentiated Responsibilities
Emissions in Advanced Countries affect
the climate in Developing Countries
After 1850, ~70% CO2 emissions came
from US, EU, Russia, Japan and Canada,
with US leading the pack with 30%
Finite safe capacity of the atmosphere to
absorb greenhouse gases is a common
resource that belongs to all human
beings but was ‘expropriated’ in large
part by the Advanced Counties
Developing Countries provide a fertile ground for implementing novel climate
mitigation technologies, and innovative infrastructure development opportunities,
e.g., distributed power, bio-fuels, etc.
Developing countries cannot be expected to take on a disproportionate burden
Pic source: www.itsgettinghotinhere.org, A youth climate movement
1 2 3 4 5 6 7
Copyright © 2012 Reliance: All rights reserved.
11
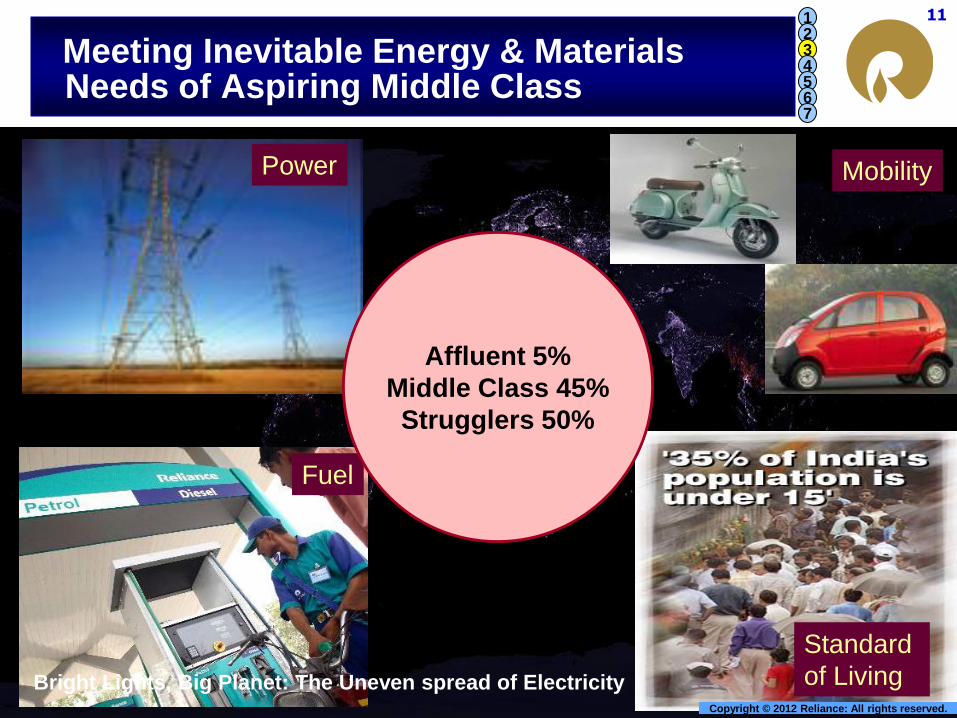
Meeting Inevitable Energy & Materials Needs of Aspiring Middle Class
Sustainability has to
account for well being
Of “Aspiring Middle
Class”
Power Mobility
Fuel
Standard
of Living
Sustainability has to
account for well being
of “Aspiring Middle Class”
Bright Lights, Big Planet: The Uneven spread of Electricity
Affluent 5%
Middle Class 45%
Strugglers 50%
1 2 3 4 5 6 7
Copyright © 2012 Reliance: All rights reserved.

12
The Global Energy Challenge
3,000 10,000 15,000 25,000
En
erg
y d
em
an
d
Industrialization
and personal
mobility take off
Services dominate
growth and basic
households energy
needs are met
Urbanization
Economic growth
requires little
additional energy
GDP/Capita in constant PPP terms
Demand for energy is growing rapidly as countries like India enter the most
energy-intensive phase of economic development
India
China
OECD (17% world population)
1 2 3 4 5 6 7
Non-OECD (83% world population)
Copyright © 2012 Reliance: All rights reserved.

13
The Global Energy Challenge
3,000 10,000 15,000 25,000
En
erg
y d
em
an
d
Urbanization
GDP/Capita in constant PPP terms
Demand for energy is growing rapidly as countries like India enter the most
energy-intensive phase of economic development
India
China
OECD (17% world population)
Leapfrogging
Efficient
Technology
Development
& Deployment
- - Sustainable
Path
More, Secure and Responsible energy technology for the growing world
Traditional
1 2 3 4 5 6 7
Non-OECD (83% world population)
Unsustainable
Copyright © 2012 Reliance: All rights reserved.

14
Indian Energy Demand & Supply
Energy efficient clean coal conversion technologies needed
Annual Energy Demand to increase from 590
Mtoe in 2009 to about 1,299 Mtoe by 2030
Today India imports ~70% crude oil and ~30%
natural gas (>$ 80 billion revenue outgo)
Today India has
0.6 % of World’s Gas reserves
0.4 % of Worlds Oil reserves
7% of World’s Coal reserves
Coal has a major role to meet India’s energy
needs
Coal demand will grow at a rate of ~8%/ yr
Indigenous production + imports
Carbon Capture & Sequestration critical
technology with growth of coal burning
Current
Source- Integrated Energy Policy- Planning Commission, Govt. of India
India is 5th largest energy consumer in the world 2030
India scenario (MMTPA) 2010 2015
Coal consumption 656 878
Coal imports 73 240
Petcoke capacity 7 16
1 2 3 4 5 6 7
Copyright © 2012 Reliance: All rights reserved.

15
Shale Gas Rapidly Replacing Coal in US
Shale gas emits 50% less carbon
dioxide than coal
If large scale projects in major growth
economies e.g. India and China, shift
to shale gas, carbon emission trends
could be reversed
In US, shale gas went from 1% of gas
production in 2001 to 37% in 2011
China plans shale gas output rise from
6.5 billion cubic meters in 2015 to 100
billion cubic meters in 2020
Cheap shale gas has taken a big bite
out of coal very quickly
Build a successful worldwide cooperation on shale gas technologies to help
near-term reduction in CO2
US Electricity Fuel mix
1 2 3 4 5 6 7
Copyright © 2012 Reliance: All rights reserved.

16
Shale Gas in India
Demand is outpacing supply, India has been a net
importer of natural gas since 2004
In 2010, 1.4 tcf produced and 0.5 tcf imported, with
1.5 tcf of unmet demand
Technically recoverable shale gas resources in
India at 63 tcf, compared with 1,275 tcf in China,
and 1,250 tcf in US and Canada
– ONGC & Schlumberger have started exploration
US-India MOU “Shale Gas Work Plan” to help India move in the right direction – Part
of Joint Clean Energy R&D center in India
India faces large gap in water supply and projected demand, 50% shortfall by 2030, at
~1,500 bcm demand with current supply of 740 bcm
Water-less technologies are needed, e.g., propane fracturing instead of hydraulic
fracturing
Advanced fracking technology needed to exploit shale gas resources in India
1 2 3 4 5 6 7
Copyright © 2012 Reliance: All rights reserved.
17
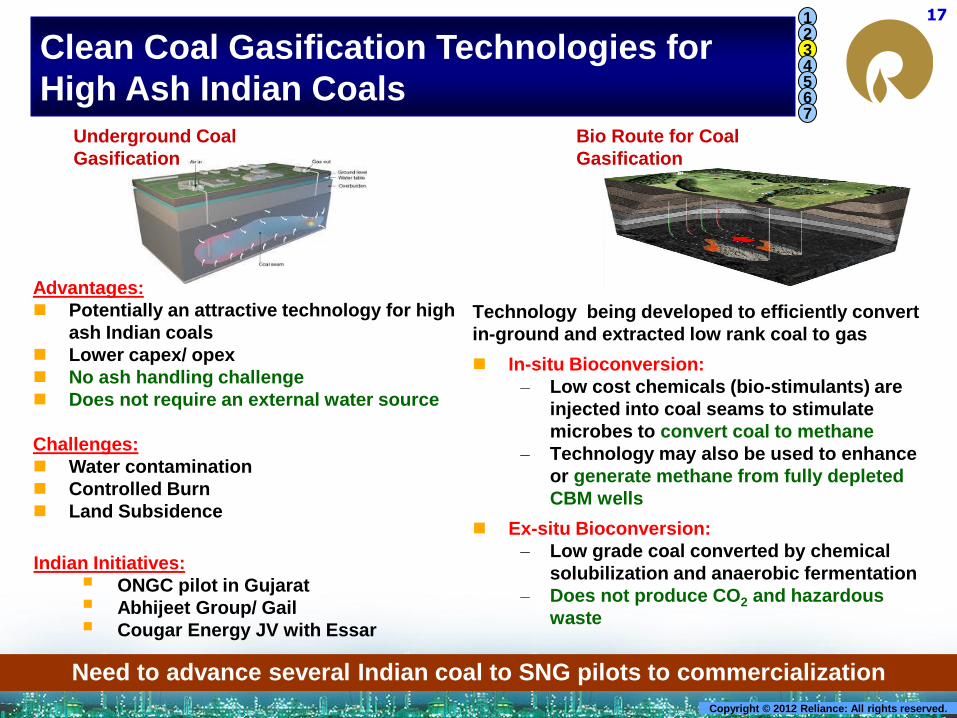
Clean Coal Gasification Technologies for
High Ash Indian Coals
Need to advance several Indian coal to SNG pilots to commercialization
Indian Initiatives:
ONGC pilot in Gujarat
Abhijeet Group/ Gail
Cougar Energy JV with Essar
Technology being developed to efficiently convert
in-ground and extracted low rank coal to gas
In-situ Bioconversion:
– Low cost chemicals (bio-stimulants) are
injected into coal seams to stimulate
microbes to convert coal to methane
– Technology may also be used to enhance
or generate methane from fully depleted
CBM wells
Ex-situ Bioconversion:
– Low grade coal converted by chemical
solubilization and anaerobic fermentation
– Does not produce CO2 and hazardous
waste
Underground Coal
Gasification
Bio Route for Coal
Gasification
1 2 3 4 5 6 7
Advantages:
Potentially an attractive technology for high
ash Indian coals
Lower capex/ opex
No ash handling challenge
Does not require an external water source
Challenges:
Water contamination
Controlled Burn
Land Subsidence
Copyright © 2012 Reliance: All rights reserved.

18
Reliance Petcoke Gasification Project – Deeper Integration of Refinery with Petrochemicals
Largest Pet-coke Gasification Project in the World – Future Ready for CO2 Mitigation
Largest refinery in the world with 1.4 MM bbl/day capacity, produces 6.4 MMT/yr petcoke
Petcoke gasification with 12 gasifiers – Kick off in May 2012, start-up by May 2015
Ultra clean refinery on path to become a bottomless refinery
CPP = cogen power plant
PSA = pressure swing adsorption Conoco-Philips gasifier
1 2 3 4 5 6 7
Copyright © 2012 Reliance: All rights reserved.

19
Sustainability and Reliance
"We have embraced sustainability as our core business strategy. We believe
sustainability is the very foundation of lasting success. We will use sustainability
principles to drive process innovation, new product development, improving
manufacturing efficiencies and reducing material and energy consumption. This
commitment is backed by active initiatives on the ground.“
Mukesh D. Ambani
CMD Reliance Industries
RIL’s Sustainability Objectives:
• Energy Security • Energy Efficiency • Renewable Energy • Socially Responsible Operations • Poverty Eradication
RIL's sustainability reporting quality has been rated as “Good" (highest rank) by
International Finance Corporation (World Bank Group)
1 2 3 4 5 6 7
Copyright © 2012 Reliance: All rights reserved.

20
Change in Energy Resources with Time
Will the world go back to biomass era to meet sustainability goals?
Will Biomass increase in the energy mix?
Will coal usage go up?
Post Fukushima what is the future of nuclear energy?
Will NG remain bridge to renewable energy?
20
10
1 2 3 4 5 6 7
Copyright © 2012 Reliance: All rights reserved.

21
Nuclear Energy Potential Future
Thorium – More abundant and safer than Uranium
Thorium waste has shorter half-life
Environmental friendly extraction with less CO2
emissions when compared to Uranium
India plans to start constructing a 300 MW Thorium
reactor in 2016-17
India has 25% of world’s Thorium reserves, and plans
to meet 30% of its energy demand with thorium-based
reactors by 2050
Need to develop safer, modular, scalable nuclear technology options
Need commercialization of latest generation nuclear reactors that addresses major concerns
(safety, uranium utilization, economics, proliferation, waste). Some examples:
Light water reactors – DEER by Radix Power & Energy, mPower by B&W, Russia’s KLT-40S
Fast neutron reactors – G4M by Gen4 Energy, STAR series at Argonne National Lab
Graphite-moderated high temperature reactors – China’s HTR-10, South Africa’s PBMR
Pressurized heavy water reactors – India’s PHWRs, Chashma in Pakistan
Travelling Wave Reactor using spent Uranium, buried deep in the ground – Terra Power
1 2 3 4 5 6 7
Copyright © 2012 Reliance: All rights reserved.
22
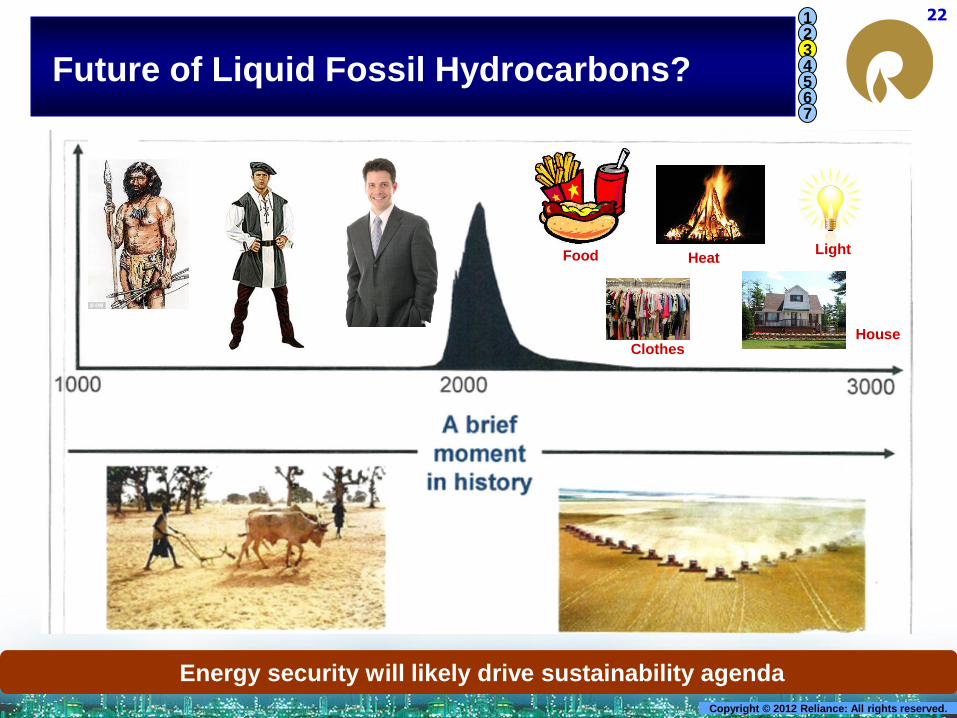
Future of Liquid Fossil Hydrocarbons?
Energy security will likely drive sustainability agenda
Food Heat Light
Clothes House
1 2 3 4 5 6 7
Copyright © 2012 Reliance: All rights reserved.

23
World Energy Mix – One forecast
World markets in fuels/ petrochemicals are interconnected
• Developing economies drive energy
consumption growth accounting for
65% of world consumption
• Fuel substitution happening in
Developed countries while all fuels
expanding in Developing countries
• Largest fuel contribution comes from
natural gas, which is around 31%
• Globally energy intensity is expected to
reduce and converge
• Convergence happening due to connected
world and rapid diffusion of technology
BP Energy Outlook 2012
1 2 3 4 5 6 7
Copyright © 2012 Reliance: All rights reserved.

24
Shale gas – Game changing US Energy/ Petrochemicals Outlook
NG price decoupled from oil in US
• US natural gas prices are under- $3/mmBTU
• Indian LNG marginal cost is as high as $15/mmBTU
• Boost to Petrochemicals due to associated ethane in shale gas
• LNG exports from US likely in the future?
Huge shale gas finds and production has decoupled gas price from oil in US
1 2 3 4 5 6 7
Copyright © 2012 Reliance: All rights reserved.

25
Use of NG in Transportation Sector?
Direct NG usage could have immediate impact on the transportation sector
Cost & Efficiency ?
Battery Technology/ Vehicle cost /
Recharging Infrastructure?
Natural Gas Gas
Infrastructure
• NG vehicles (CNG, LNG) likely to penetrate in heavy duty and fleet applications
• Minor modifications can convert gasoline and diesel engines into NG vehicles
• EV’s remain a technological and infrastructure hurdle
1 2 3 4 5 6 7
India has two million
CNG vehicles &
sector is growing fast
Copyright © 2012 Reliance: All rights reserved.

26
Penetration of Gas in Transport and Hybrids – Reduced Refining Capacity
0
20
40
60
80
100
120
140
160
CNG Diesel Gasoline
Passenger car sales by type Transport fuel demand by energy
type
CNG – Cleanest for vehicles, Lowest
GHG • Significant growth potential for gas in liquid fuels dominated
transport sector
• CNG - cleanest fossil fuel + with low price (especially in US)
• Electric and hybrid vehicles will also have significant share in
new vehicles sold by 2030
• Impact on the demand for refinery liquids will lead to capacity
rationalization and cuts in crude runs
Natural gas could be the next major transportation fuel – CNG/LNG/Electricity
BP Energy Outlook 2012
Transport
Emissions
1 2 3 4 5 6 7
Copyright © 2012 Reliance: All rights reserved.

27
Distributed Generation & Distributed Consumption for Electricity
4
Today’s Grid Electricity …
Power park
Hydrogen Storage
Industrial DG
Tomorrow’s Likely Choices …
Combined Heat and Power
Fuel Cell
e -
e -
Wind Farms
Rooftop Photo-voltaics
Remote Loads
Load as a resource
SMES
Smart Substation
Fuel Cell
Could we economically develop distributed production and consumption infrastructure for liquid fuels -- bio refineries?
Smart grid technology could accelerate distributed generation/consumption
Energy losses 68% for electricity vs. 8%
for natural gas to consumers
Village level mini-grids in India based
on gasifying agricultural waste
1 2 3 4 5 6 7
Copyright © 2012 Reliance: All rights reserved.

28
Growing Importance of Bio-based approach in Three main pillars of Indian Economy
Does bio-refinery concept provide a leap frogging technology opportunity ?
Source : India Brand Equity Foundation
Today’s cooking stove
only 10% energy
efficient
1 2 3 4 5 6 7
Copyright © 2012 Reliance: All rights reserved.

29
0102030405060708090
1992 1994 1996 1998 2000 2002 2004 2006 2008 2010 2012
Wheat $/MWh(t)
Oil $/MWh(t)
Bio-fuels or Renewable Electricity?
1 Ha land – 10 ton wheat/yr –
40 MWh/ha. yr energy
1 Ha land- 100 tons/yr energy crops
400 MWh/ha.yr energy
1Ha land – One 2 MW Wind Mill
Even with only 25% on time
– 4000 MWh/yr
Wind Mill is 10-100 times more
productive
Need on-purpose energy crops orders of magnitude more productive
Today, we have
reached Wheat & Oil
Energy Equilibrium
on Pricing
Oil Calorific value – 12MWht
Wheat Calorific value – 4MWht
US Oil & wheat prices $/MWht
1 2 3 4 5 6 7
Copyright © 2012 Reliance: All rights reserved.
30
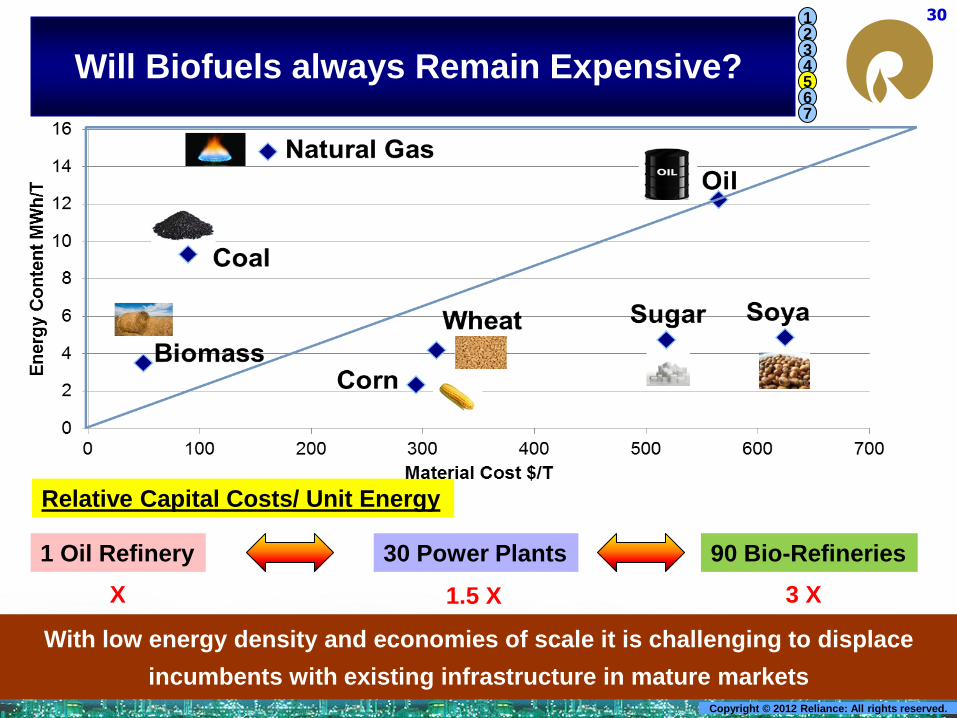
Will Biofuels always Remain Expensive?
With low energy density and economies of scale it is challenging to displace
incumbents with existing infrastructure in mature markets
1 Oil Refinery 90 Bio-Refineries 30 Power Plants
Relative Capital Costs/ Unit Energy
X 3 X 1.5 X
1 2 3 4 5 6 7
Copyright © 2012 Reliance: All rights reserved.

31
18
48
102
127
202
635
10,000
140,000
Transitioning to Low Areal Productivity Resources ?
Pumpjack
Algae farm
Jatropha
Corn
Do we need a distributed production/ consumption model for transportation fuel?
Require:
Large area to support the current
demand level
Overhaul of energy distribution
infrastructure to suit the fragmented
energy generation
1 2 3 4 5 6 7
Copyright © 2012 Reliance: All rights reserved.
32
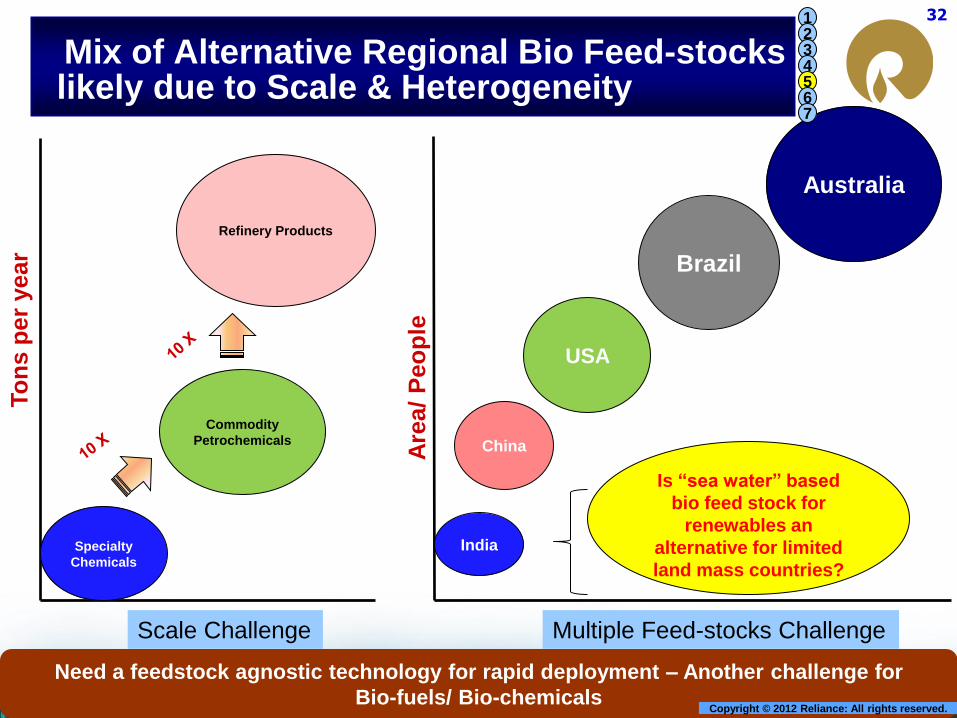
Mix of Alternative Regional Bio Feed-stocks likely due to Scale & Heterogeneity
Need a feedstock agnostic technology for rapid deployment – Another challenge for
Bio-fuels/ Bio-chemicals
To
ns p
er
year
Specialty
Chemicals
Commodity
Petrochemicals
Refinery Products
Scale Challenge
India
China
USA
Brazil
Australia
Are
a/
Peo
ple
Is “sea water” based
bio feed stock for
renewables an
alternative for limited
land mass countries?
Multiple Feed-stocks Challenge
1 2 3 4 5 6 7
Copyright © 2012 Reliance: All rights reserved.

33
Algae & Bio-technology for Energy, Petrochemicals & Wellness Products
Algae fuel can be grown
on marginal land with
non-potable, saline and
even waste water
Every gallon of algal oil produced consumes 12-15 kg of CO2
CO2
~600 kg Algal oil
1 barrel
Plant mass
on Earth
Photosynthesis
on Earth Aquatic plants Terrestrial plants
610
12
Sugarcane Switch
grass Algae
58
Corn
Growth
efficiency
MT/acre/yr
Sun Light + CO2 +Sea Water Bio- Oil, Bio-diesel, Ethanol, Nutraceuticals
Genetic modifications can improve yield, selectivity, tolerance to external factors
Algae are most efficient convertor of sunlight
Biomass Harvesting or Product Secretion ?
Open Pond Or Closed Photo- Bioreactor ?
1 2 3 4 5 6 7
Copyright © 2012 Reliance: All rights reserved.

34
Working through Biology Hierarchy
Genomics/systems biology, Environment
DNA manipulation,
mutation, synthetic biology,
pathway engineering, gene
expression
Kilo Biology
Nano
Biology
Production
Scale-up of biological systems to large scale industrial applications remain a challenge
Circadian rhythm
manipulation?
Is photosynthesis the
ultimate rate limiter for
metabolic pathway
manipulation
(PSI, PSII, etc.) ?
Photosynthesis
Metabolic Pathway
Engineering
1 2 3 4 5 6 7
Copyright © 2012 Reliance: All rights reserved.
35
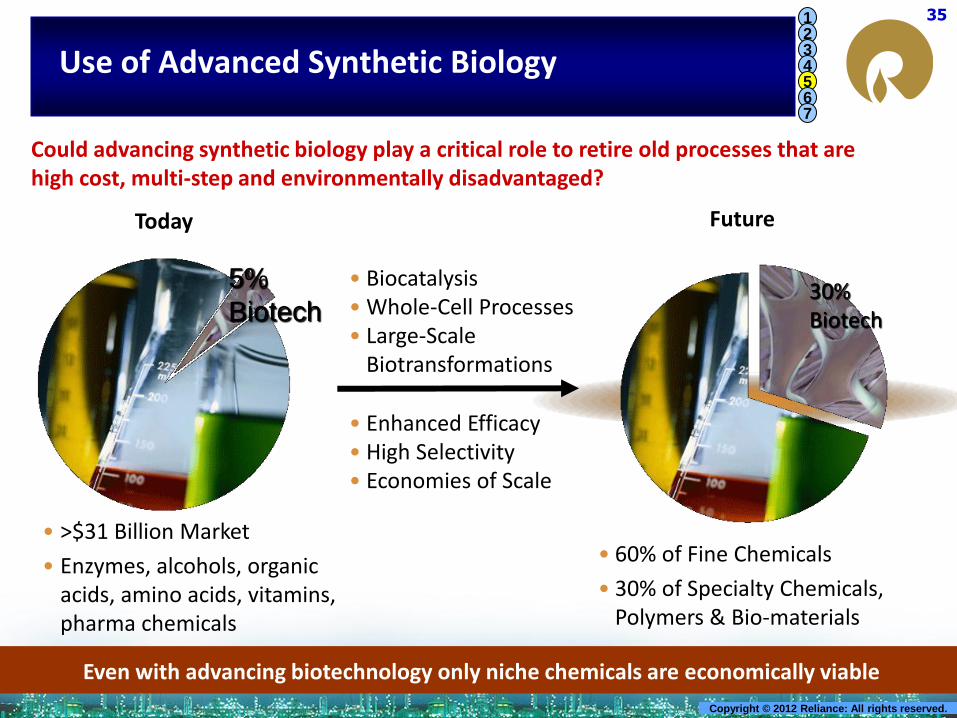
Use of Advanced Synthetic Biology
Even with advancing biotechnology only niche chemicals are economically viable
Could advancing synthetic biology play a critical role to retire old processes that are high cost, multi-step and environmentally disadvantaged?
Today
• >$31 Billion Market
• Enzymes, alcohols, organic acids, amino acids, vitamins, pharma chemicals
• Biocatalysis • Whole-Cell Processes • Large-Scale
Biotransformations
• Enhanced Efficacy • High Selectivity • Economies of Scale
Future
• 60% of Fine Chemicals
• 30% of Specialty Chemicals, Polymers & Bio-materials
30% Biotech
5%
Biotech
Today
1 2 3 4 5 6 7
Copyright © 2012 Reliance: All rights reserved.

36
Future of Bio based Commodity Chemicals – Ethylene to PE
Will cost of production of bio petrochemicals ever match fossil route?
14 40
12
10 30
8
6 20
4
210
0 0
20 40 60 80 100 120 140 160 180
Crude Price ($/bbl)
Su
gar P
rice (c
en
ts/lb
) C
orn
Pri
ce (
$/B
u)
Crude Preferred
Corn or Sugar Preferred
Cellulosic sugars
today
• North America becomes net exporter of energy
• Long-term Crude oil prices could be soft
• Developing countries growth
continues to stress supply
OR
1 2 3 4 5 6 7
Renewables are far too expensive to compete with fossil fuels if their price
is based solely on the cost of energy production
Copyright © 2012 Reliance: All rights reserved.

37
37
Bottles
Filling
Processing
Cleaning
Pillows
Fibers
Flakes
Collection
Recycling: Green Polyester in the Indian context
Business to fulfill societal obligation along with earning adequate returns for shareholders
– Waste bottles collected by unskilled
uneducated manpower - reduces
land fill & provides earning
opportunity for downtrodden
– Processed to produce fibers
– Fibers used to make pillows
– Business earning above cost of
capital – Waste to wealth
Improve quality of life for folks at the bottom of the pyramid by giving them work
opportunity
Bottle to Bottle Recycle of Polyester to same quality is also a reality
Average rate of recycling (in%) excluding re-use
30
47.353
70
0
20
40
60
80
US Germany Japan India
1 2 3 4 5 6 7
Copyright © 2012 Reliance: All rights reserved.

38
The Ethical Question !
40% of US corn is directed to run cars
European commission admits that the
targeted 10% of transportation biofuels
by 2020 would raise cereal prices by 3 –
6%
With every 1% increase in food prices, 16
million people go hungry
By 2021, 14% of world’s maize and other coarse grains, 16% of vegetable oil, and
34% of sugarcane will go to the fuel tank, only partly coming from increase in
production
Radical overhaul needed in policy and food production to ensure food supply for
the world’s poor
Need pragmatic and flexible policies to ensure a holistic perspective
Must the poor go hungry just so the rich can drive? --- The Guardian, Aug 13, 2012
1 2 3 4 5 6 7
Copyright © 2012 Reliance: All rights reserved.

39
Fundamental Belief that Sustainability can be achieved by poverty
eradication and meeting future aspirations of under privileged
It also means that not only to have innovation and passion but also compassion
Gandhian Engineering
“The earth has enough for Everybody’s needs, but not enough for Anybody’s greed”
“Poverty is the worst form of violence”
“More from Less for More and More”
1 2 3 4 5 6 7
Source: C K Prahalad and R A Mashelkar
Copyright © 2012 Reliance: All rights reserved.

40
Gandhian Engineering: Inclusive Innovation
Examples of Disruptive Inclusive
Innovations: – Tata-Nano : Affordable cars for 2000 $ !!! Order of magnitude cheaper with no
compromise of features
– Reliance Cellphones : Phone call for the price of postcard
(i.e. 0.005$/min), Order of magnitude cheaper with advanced features
Need boundary-less global open innovation framework
High Performance at Ultra low cost: Make products affordable to the poor without compromising quality so that even rich will desire these products
Involve the “Bottom of the Pyramid” for sustainability of Self, Society, Country
and the World Gandhian Engineering is as much needed by the rich as by the poor because
ultimately it affects the entire mankind as we run out of non-renewable resources
1 2 3 4 5 6 7
Copyright © 2012 Reliance: All rights reserved.

41
Biogas – An Indian Initiative for Distributed Energy
1897 – First ever anaerobic digester in
Mumbai, India, utilizing human waste to
generate gas for lighting needs
1937 – First successful manure to biogas
plant by S.V. Desai from the Indian
Agricultural Research Institute
Today, close to 5 Million biogas plants
installed in India
100 hotels in Bangalore to set up biofuel
units, to cooperate in implementation of
plastics ban and garbage segregation at
source
SEEPZ-SEZ, Mumbai with zero-waste
policy installed a biogas plant; 5 MT wet-
waste per day
Rural Innovations spreading to the cities
1 2 3 4 5 6 7
Copyright © 2012 Reliance: All rights reserved.

42
Solar Water Purifier
Solar Lantern
Solar Street Light Solar Water pump Solar Air conditioner
Bringing cheer to millions of rural Indians
Solar Energy Revolution for the Masses: 20 GW Solar Power by 2022
Solar Mobile Charger
1 2 3 4 5 6 7
Copyright © 2012 Reliance: All rights reserved.

43
Mix of Traditional & Modern Technology
Gandhian Engineering: 4 min pedaling = 4 hours of light !
The Leg
Power
75 watt
Generator
Most Modern &
Efficient Lighting
Devices – LED !
Most Modern
Energy Storage
Device – Ultra-
Capacitors !
Ray of hope – Gandhian Engineering
1 2 3 4 5 6 7
Copyright © 2012 Reliance: All rights reserved.

44
Energy Technology Deployment
Source: Kramer and Haigh, Nature, 2009
Deployment rates in energy sector is measured in decades
1 2 3 4 5 6 7
Physical limits to energy technology deployment rate – long time to reach materiality
Governments need to design policies to accelerate deployment – R&D and Pilots
Promote technology families and let market forces choose winners
Demand side action to increase efficiency and curtail consumption
Copyright © 2012 Reliance: All rights reserved.

45
Technology Deployment and Development
Slow
Slow
Fast
Fast
Technology Development Speed
Tech
no
log
y D
ep
loym
en
t S
peed
IT &
Communications
Technologies
Energy
Technologies
Characteristics of Energy Sector:
- Slow development/ deployment
- Irreversible nature of investment
- Very high capital intensity
Would biotechnology materially change the energy paradigm?
Biotechnology?
1 2 3 4 5 6 7
More, Secure and Responsible Energy Technology for the Growing World
Copyright © 2012 Reliance: All rights reserved.

46
Structure of Scientific Enterprise Changed in Past 30 Yrs
Industry and University Used to Work Hand in Glove
People/
Resources
Development,
Manufacturing,
Distribution/Sales
Laws, Regulation Money
University Government Industry
Skilled People
Knowledge
Solutions
Products
Skilled People
Chemical science and industry have been closely
intertwined throughout its history
Startups
Venture Capital
Private Equity
Industry and Academia have grown apart since the fall of the Berlin wall
and passing of Bayh-Dole Act
1 2 3 4 5 6 7
Copyright © 2012 Reliance: All rights reserved.

47
47
Is VC/PE Model Working for Cleantech ?
Investors are extra-cautious with long lead high capital technology deployment
Debts are hard to come by
VC/PE lacks the appetite for
scale-up and patience for returns
What is the right investment model?
More governmental support for
long term development with
appropriate IP management
Greater public private partnerships
with patient strategic capital
investments
VC/PE investments in biofuels
Overall VC performance (Source: Kauffman Report)
-40% -35%
-28% -28% -25%
-21% -19%
-2%
11% 2012 YTD Performance
IT Cleantech
1 2 3 4 5 6 7
Copyright © 2012 Reliance: All rights reserved.

48
Derive Maximum Value from all Knowledge
Need to build on collective connected ingenuity in today’s boundary-less world
Economies of
‘Scale’
Economies of
‘Scope’
Economies of
‘Learning’ Benefits of
being
BIGGER
Benefits of
being
BROADER
Benefits of
doing things
SMARTER Boundary-less integration of knowledge
- Universities
- National labs
- Public companies
- Private companies
Knowledge paradigm to energy sector:
Could it achieve leap frogging efficient
Development & Deployment?
1 2 3 4 5 6 7
Source: Alexander Van de Putte
Copyright © 2012 Reliance: All rights reserved.

49
Mind set Change: From Relay Race to Tango
Closer Pubic Private Partnerships Across
International Boundaries Is Required
1 2 3 4 5 6 7
Copyright © 2012 Reliance: All rights reserved.

50
Mind set Change: From Relay Race to Tango
Organizing scientific research on the scale of big operatic and theatrical production is still something new in science and engineering
Closer Pubic Private Partnerships Across
International Boundaries Is Required
1 2 3 4 5 6 7
Copyright © 2012 Reliance: All rights reserved.

51
Process Innovation
Product Innovation
Catalyst Innovation
Raw material
Flexibility
New Creative
Business Models
Public Private
Partnerships
CAPEX
Efficiency OPEX
Efficiency
Fossil Renewable
Labor
Talent
Indianization
Unique RIL
Capital
Project
Execution
Inclusive Innovation = Creativity X Execution
Innovations to meet needs
of Aspiring Middle Class
Collective Mandate:
Science for Solution,
Technology for Transformation, &
Innovation for Impact
1 2 3 4 5 6 7
I would prize every invention of science made for the benefit of all – Mahatma Gandhi
Copyright © 2012 Reliance: All rights reserved.

THANK YOU
Growth is Life
Innovation Led Growth
Copyright © 2012 Reliance: All rights reserved.