energy use in the chilled food sector case study – air blast … · 2009-02-26 · energy use in...
TRANSCRIPT

Energy use in the chilled food sector
Case study – Air blast chilling of solid/liquid food mixtures
(pie fillings)
FRPERC JOB NO. 2006013
Report finalised Feb-2009
Mark J. Swain
Produced by:
Food Refrigeration and Process Engineering Research Centre
(FRPERC),
University of Bristol, Churchill Building, Langford, North Somerset,
BS40 5DU, UK
Tel : ++44 (0)117 928 9239 Fax : ++44 (0)117 928 9314
e-mail [email protected] http://www.frperc.bris.ac.uk
Summary
A study has been carried out of the pie filling air blast chilling operation at a pie
manufacturing plant in the UK. The aim of the case study was to provide data on energy
consumption in the air blast chilling of hot solid/liquid food mixtures (specifically pie
fillings) post cooking under real use conditions in a manufacturing environment.
Detailed data was also required for verification of the LSBU/FRPERC refrigeration
model, which required trials under more controlled conditions (not during normal
production).
The mean specific energy consumption over the sampled production period was 173.3
kWh/tonne. Specific energy consumption was lowest (143.1 kWh/tonne) on the day of
highest production, indicating that once the chiller is switched on and cooled down at the
beginning of the day (fixed overhead) efficiency will be improved the longer it can be
used to usefully chill pie fillings – i.e. short production runs are less efficient in terms of
blast chiller energy consumption.
The mean energy coefficient (EC) of the air blast chilling process was 0.44, which is poor
compared to values up to 1.5 for forced air coolers published in 2001.
A comprehensive set of data for validating the LSBU/FRPERC refrigeration model is
presented, which were obtained under controlled conditions in the factory. It is
anticipated that the model will aid system optimisation of the existing air blast system.
The baseline power consumption required just to keep the air blast chiller cold, without
any food product load was approximately 5 kW. Evaporator fans alone consumed up to
30% of the baseline power consumption.
Analysis of the recorded temperature data revealed lower than expected evaporating
temperatures for a blast chilling process (saturation temperature approximately -15°C).
Increasing the evaporation temperature would offer significant energy savings.
Removing the evaporator fan power (direct and indirect) from the process of cooling hot
products would make a significant contribution to increasing overall energy efficiency.
Both vacuum cooling and some form of direct contact cooling system are two alternative
methods that offer this advantage. However, there appears to be little hard evidence of
direct measurements related to the energy efficiency of food cooling (especially
solid/liquid food mixtures) that can be used with any certainty to provide guidance to the
food industry.

The predicted rate of temperature fall, using the refrigeration model, closely follows the
measured data. The maximum difference between the predicted and measured mean
centre tray temperature at any time is 5.9°C, the average difference is 2.3°C.
The difference between the predicted (58.9 kWh) and measured (64 kWh) overall energy
consumption is 5.1 kWh, an 8 % difference. The base load i.e. the average power used
without any food product was predicted to be 5.1 kW and the measured value 5.6 kW, a 9
% difference.

Contents
Summary .......................................................................................................................2
Introduction...................................................................................................................5
Process description......................................................................................................5
Components of blast chiller ........................................................................................6
Method...........................................................................................................................9
Specific energy consumption ......................................................................................9
Efficiency of air blast chilling process ........................................................................9
Recording of air blast chiller details.........................................................................10
Data collection for model validation.........................................................................10
Results and discussion................................................................................................. 12
Specific energy consumption ....................................................................................12
Efficiency of air blast chilling process ......................................................................13
Data obtained from validation trial..........................................................................14
Baseline power consumption (steady state)..............................................................24
Evaporating temperature .........................................................................................24
Validation 24
Conclusion ................................................................................................................... 27
Specific energy consumption ....................................................................................27
Efficiency of air blast chilling process ......................................................................27
Validation data..........................................................................................................27
Baseline power consumption (steady state)..............................................................27
Evaporating temperature .........................................................................................27
Comparison with model............................................................................................28
References.................................................................................................................... 29
Introduction
The cooked chilled food sector is a major and growing user of energy for refrigeration in
the food industry. After cooking the air blast chilling of hot solid/liquid food mixtures is
common to many processes within the food manufacturing industry, not least the ready
meal and pie manufacturing sectors. However, there is little, if any detailed data
available on the energy consumed by air blast chilling systems under real use conditions
in the UK.
In the first part of this study, the primary aim was to provide data on energy used in the
air blast chilling of hot solid/liquid food mixtures (more specifically a range of hot pie
fillings) post cooking under real use conditions (typical production) in a manufacturing
environment. The data gathered provides a benchmark for comparison with other blast
chilling operations.
In the second part of this study, the primary aim was to collect detailed data of the same
air blast chilling operation to validate the LSBU/FRPERC refrigeration computer model
under more controlled conditions.
The site was chosen for the study as it is an example of an air blast chilling operation of
solid/liquid food mixtures that require cooling post cooking. FRPERC has also a built up
a good relationship with the pie manufacturing company providing the benefit of
unrestricted access to plant and manufacturing data.
Process description
The specification of the pie filling blast chilling operation requires that trays of hot pie
filling mix are cooled immediately post cooking, having reached a minimum temperature
of 75°C, down to a final chilled temperature of below 5°C.
Batches (approximately 60 kg) of a range of different pie fillings are cooked and then
transferred into stainless steel trays, covered with cling film and stacked into trolleys.
Each trolley accommodates two columns of 14 trays. Each tray is filled with
approximately 8 kg of cooked product (mean weight of empty tray = 1.25 kg). Once each
trolley is fully loaded with 28 trays of hot product, it is wheeled into the air blast chiller
for cooling to below 5°C (taking approximately 6 h). The chiller can accommodate up to
three trolleys at a time. Trolleys enter the air blast chilling tunnel through the entrance
door at one end (Figure 1) and are incremented through in single file until they are

removed through the exit door at the other end. Note evaporator coil and fans (covered
by mesh) on left hand side of trolley.
Figure 1. Pie filling air blast chiller entrance door end view
Components of blast chiller
The air blast chiller is a modified Foster unit of a type that is no longer manufactured and
its original specification is unknown. A plan view of the chiller and fan/evaporator coil
configuration are shown in Figure 2. Refrigeration is provided by a remote compressor
(Figure 3), housed in an outside enclosure below the wall-mounted condenser (Figure 4).
Compressor
Prestcold semi-hermetic, R1500/0138 S/D, 380/420VAC, 3-phase, 32 FLA, 40 LRA
Condenser
Dry air cooled condenser unit with a single constant speed fan
Width = 66 cm Height = 77 cm
Depth = 36 cm Coil pipe = 9.7 mm O/D
Coil length = 30 rows by 6 deep Fin spacing = 8 per inch (Aluminium)
Mean face velocity (Air on) = 3.4 m.s-1
Evaporator dimensions
Width = 66 cm Height = 162.5 cm
Depth = 30 cm Coil pipe = 6.4 mm O/D
Coil length = 60 rows by 4 deep Fin spacing = 8 per inch (Aluminium)
Mean face velocity (Air on) = 2.1 m.s-1

Pipe lengths
Evaporator to compressor = 38.5 m x 28.6 mm O/D (Armaflex insulation = 15 mm thick)
Compressor to condenser = 3 m x 28.6
Condenser to receiver = 3 m x 19.1 mm O/D
Receiver to evaporator = 38.5 m x 19.1 mm O/D
Figure 2. Schematic of blast chiller for pie fillings
Figure 3. Top view of the compressor

Figure 4. Compressor and wall mounted condenser fan unit

Method
Specific energy consumption
To obtain the specific energy consumption of the air blast chilling of solid/liquid food
mixtures (pie fillings) the total energy consumption, product throughput and temperature
reduction achieved over the corresponding period are required.
The total energy consumption of the air blast chiller was recorded at two locations; the
blast chiller junction box (in the factory) and the compressor enclosure (outside factory)
using portable energy monitors (Sinergy e-Tracker Mk2, Stockport, UK). The three
phase supply was recorded (Figure 5) using a 1 minute integration period providing a log
of true RMS voltage and current ±2% of reading, Hz, kW, kVAr and power factor.
Figure 5. Three phase energy monitor attachment setup using direct voltage
measurement and three clamp on current transformers (Source: Sinergy, UK)
In order to calculate the specific energy consumption of the air blast chilling operation, a
record of the throughput of product during the energy recording period was maintained.
The quantity and time of transferring trolleys of trays of pie filling in and out of the air
blast chilling tunnel were noted for the monitored production period.
Efficiency of air blast chilling process
One measure of the efficiency of the blast chilling process is the ratio of the heat removed
from the product being cooled to the electrical energy supplied to the entire refrigeration
system - also referred to as energy coefficient (EC). Under production conditions it is
impractical to directly measure the heat removed from the hot pie filling. Therefore, the

heat removed during the cooling process was calculated using a computer model
(FoodProp) (James et al., 2009), based on the ‘COSTHERM’ program (Miles et al.,
1983). The model predicts the enthalpy change during cooling, based on calculations
using the products chemical composition. Using this method and the assumption that the
pie filling is cooled from an average initial temperature of 75°C to an average final
temperature of 5°C, the enthalpy change for each sample days production was calculated.
Recording of air blast chiller details
The air blast chiller refrigeration system comprises of a single compressor, vertical wall
mounted condenser unit and a Foster designed push through rack tunnel with two vertical
banks consisting of three axial electric motor/fan units. The dimensions and specification
details of the blast chiller required by the LSBU/FRPERC refrigeration model developers
were determined and recorded where possible. As the system was built up from some
second hand components (many of which were no longer in production) the
manufacturers specifications were not always available.
Data collection for model validation
In an effort to obtain operational data under more controlled conditions suitable for the
model validation, the factory offered the sole use of the air blast chiller for the trial.
Before starting the trial, all the data loggers were synchronised and set to start recording
all the parameters detailed in Table 1 at one minute intervals. Prior to loading the
trolleys, the blast chiller was switched on and left to cool down and stabilise to a steady
state condition to provide a baseline dataset (no product load), with the doors closed.
Due to logistical constraints the trial was limited to chilling one fully loaded trolley. In
order to reproduce typical air flow conditions of a fully loaded chiller two trolleys (trolley
1 and trolley 2) containing a full complement of empty trays were also placed into the
tunnel (Figure 6). Six trays out of the 28 trays containing pie filling in the test trolley
(trolley 3) were fitted with multipoint thermocouple probes (T-type copper-constantan) to
determine the slowest cooling point near the geometric centre of each tray. Trays 1 and 2
on the top shelf of the trolley, trays 3 and 4 on the shelf halfway down and trays 5 and 6
on the bottom shelf. All thermocouple and RH sensors were recorded at 1-minute
intervals using Comark 2014 loggers. Table 1 provides a list of the parameters measured
throughout all the trials.

Figure 6. View of a full trolley instrumented with multi-point thermocouple
temperature probes and data loggers in position at entry end of air blast chiller
Table 1. Parameters measured throughout trials
Parameter measured Units
Air-off evaporator coil °C
Air-on evaporator coil °C
Evaporator liquid temperature °C
Evaporator saturation temperature °C
Evaporator suction temperature °C
Air relative humidity inside chiller %RH
Air temperature outside chiller °C
Air relative humidity outside chiller %RH
Compressor suction temperature °C
Compressor discharge temperature °C
Compressor crankcase temperature °C
Air-off condenser °C
Air-on condenser °C
Condenser refrigerant temperature in °C
Condensing temperature °C
Condenser refrigerant temperature out °C
External air relative humidity %RH
External air temperature °C

Results and discussion
The energy consumption and all parameters listed in Table 1 of the air blast chiller was
monitored during selected daily and weekly production cycles during a 4 month period
from May to August 2008. Results are presented that cover a typical range of production
conditions observed, from low to high throughput per day.
Specific energy consumption
The mean specific energy consumption, calculated over a daily production cycle, for air
blast cooling hot pie fillings at the factory was 173.3 kWh/tonne and ranged from a
minimum of 143.2 kWh/tonne to a maximum of 208.2 kWh/tonne (Table 2).
The mean daily throughput of product was 708 kg/day ranging from a minimum
throughput of 540 kg/day to a maximum of 900 kg/day.
Energy consumption of the refrigeration system including the compressor, evaporator
fans, condenser fans and defrost heaters ranged from a minimum of 99.1 kWh/day to a
maximum of 137.6 kWh/day with a mean of 120.5 kWh/day over the sample production
period.
Table 2. Daily throughput and energy data for pie filling air blast chilling operation
Sample
No.
Pie filling
throughput
(kg/day)
Daily energy
consumption
(kWh/day)
Specific energy
consumption
(kWh/tonne)
1 780 137.6 176.4
2 780 132.2 169.5
3 660 110.2 167.0
4 900 128.9 143.2
5 540 105.5 195.4
6 720 122.3 169.9
7 600 124.9 208.2
8 540 99.1 183.5
9 840 123.6 147.1
Mean 708 120.5 173.3
SD 130 12.8 20.8
The most efficient production cooling cycle occurred on the day of highest product
throughput. The least efficient cooling cycle occurred on a day of low production
coinciding with the blast chiller being operated for a prolonged period. This indicates
that the scheduling of the batch cooking operation can have a significant knock-on effect

on the subsequent efficiency of the blast cooling operation. It should also be obvious that
turning on the blast chiller too early before the first complete trolley of hot product is
fully assembled will have a detrimental effect on the efficiency of the operation. Equally,
failing to promptly remove trolleys once sufficient cooling has been achieved and
immediately switching off the chiller will increase the specific energy consumption.
Therefore, it is recommended that once the chiller is switched on and cooled down at the
beginning of the day (fixed overhead) efficiency will be improved the longer it can be
used to usefully chill pie fillings – i.e. short production runs are less efficient in terms of
blast chiller energy consumption.
Efficiency of air blast chilling process
The measure of the efficiency of the blast chilling process used was the ratio of the heat
removed from the product being cooled to the electrical energy supplied to the entire
refrigeration system - also referred to as energy coefficient (EC). Assuming that the pie
filling is cooled from an average initial temperature of 75°C to an average final
temperature of 5°C, the enthalpy change for each sample days production was calculated
and is shown in Table 3.
Table 3. Product throughput, enthalpy change and energy coefficient for sample
production days
Sample
No.
Pie filling
throughput
(kg/day)
Enthalpy change
from 75 to 5°C
(kWh)
Enthalpy change/
energy consumption
(kWh/kWh)
1 780 58.8 0.43
2 780 58.8 0.44
3 660 49.7 0.45
4 900 67.8 0.53
5 540 40.7 0.39
6 720 54.3 0.44
7 600 45.2 0.36
8 540 40.7 0.41
9 840 63.3 0.51
Mean 708 53.3 0.44
SD 130 9.8 0.05
The mean ratio of enthalpy change of cooled product to electrical energy supplied (EC) is
0.44. The EC value ranged from a minimum of 0.36 to a maximum value of 0.53. These
are comparable to values of 0.40 and 0.52 obtained by authors Thompson and Chen
(1988) and Chen (1986). However, they appear to be poor in comparison with EC values
of 1.4 to 1.5 for forced air coolers published by one of the same authors more recently
(Thompson, 2001). There is insufficient detail in those publications to determine the
precise source of the efficiency improvement by 2001, other than the indication that more
efficient fans and fan control strategies should be used as fans or pumps are the highest
heat load other than the product load itself. This was also the conclusion of other studies
including those concerning primary air blast chilling of meat carcasses. However, unlike
discreet solid products, solid/liquid food mixtures should lend themselves to more direct
methods of cooling with the potential for energy saving.
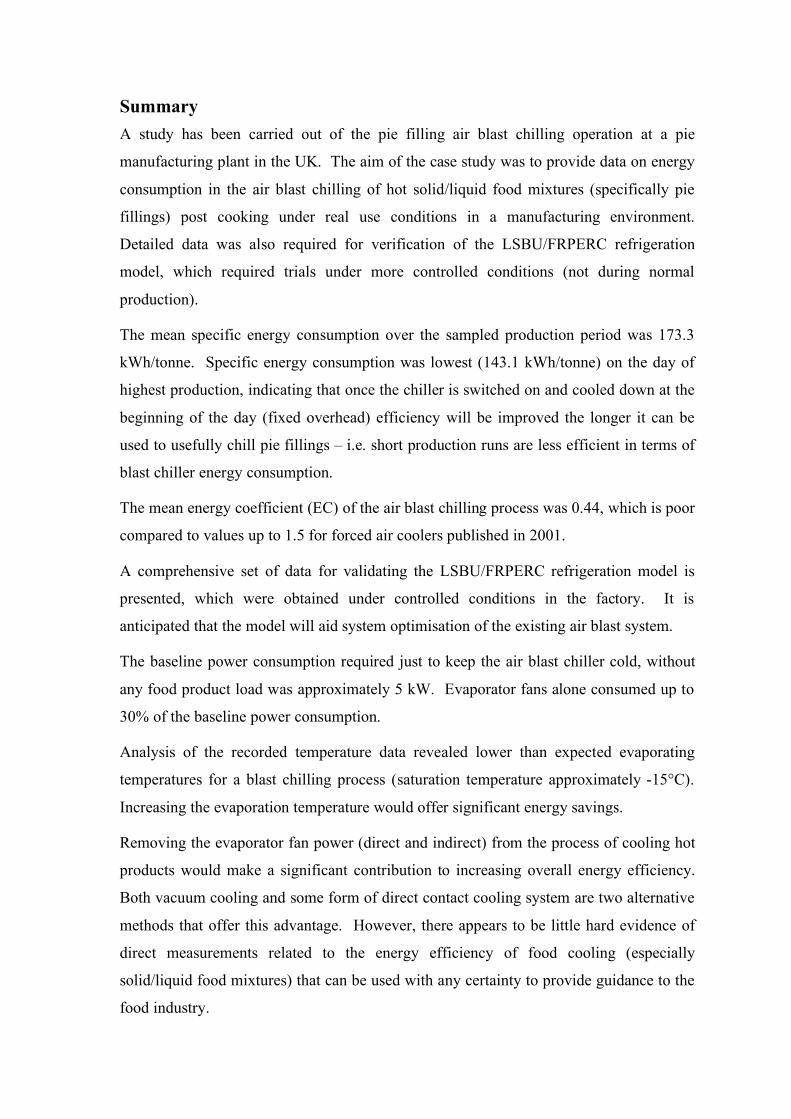
Data obtained from validation trial
Figure 7 to Figure 14 provide plots of the blast chiller, refrigeration system, ambient
temperatures and relative humidities throughout the trial period from cool down, steady
state operation and product cooling.

-15
-5
5
15
25
35
45
55
65
75
85
13-Aug
09:00
13-Aug
10:00
13-Aug
11:00
13-Aug
12:00
13-Aug
13:00
13-Aug
14:00
13-Aug
15:00
13-Aug
16:00
13-Aug
17:00
13-Aug
18:00
13-Aug
19:00
Te
mp
era
ture
(°C
)
Tray 1 centre (°C)
Tray 2 centre (°C)
Tray 3 centre (°C)
Tray 4 centre (°C)
Tray 5 centre (°C)
Tray 6 centre (°C)
Evap air off (°C)
Evap air on (°C)
Trolley into chiller
12:46
Trolley out of chiller
18:41
Chiller switched on
09:08
Figure 7. Plot of pie filling temperatures cooled in Foster blast chiller (centre of trays 1 to 6) and chiller temperatures (air on and air
off)
0
10
20
30
40
50
60
70
80
90
100
13-Aug
09:00
13-Aug
10:00
13-Aug
11:00
13-Aug
12:00
13-Aug
13:00
13-Aug
14:00
13-Aug
15:00
13-Aug
16:00
13-Aug
17:00
13-Aug
18:00
13-Aug
19:00
Rela
tive h
um
idit
y (
%)
RH (%)
Figure 8. Plot of relative humidity (%) in blast chiller from switch on at 09:08 to switch off at 18:41 on 13-Aug-08

0
10
20
30
40
50
60
70
80
90
100
13-Aug
09:00
13-Aug
10:00
13-Aug
11:00
13-Aug
12:00
13-Aug
13:00
13-Aug
14:00
13-Aug
15:00
13-Aug
16:00
13-Aug
17:00
13-Aug
18:00
13-Aug
19:00
Rela
tive h
um
idit
y (
%)
& T
em
pera
ture
(°C
)
RH (%)
Air temp (°C)
Figure 9. Plot of air temperature (°C) and relative humidity (%) in factory production area outside blast chiller during trial

-30
-20
-10
0
10
20
30
40
13-Aug
09:00
13-Aug
10:00
13-Aug
11:00
13-Aug
12:00
13-Aug
13:00
13-Aug
14:00
13-Aug
15:00
13-Aug
16:00
13-Aug
17:00
13-Aug
18:00
13-Aug
19:00
Tem
pera
ture
(°C
)
Evap liquid (°C)
Evap saturation (°C)
Evap suction (°C)
Figure 10. Evaporator liquid, saturation and suction temperatures (°C) during trial

0
5
10
15
20
25
30
35
40
45
13-Aug
09:00
13-Aug
10:00
13-Aug
11:00
13-Aug
12:00
13-Aug
13:00
13-Aug
14:00
13-Aug
15:00
13-Aug
16:00
13-Aug
17:00
13-Aug
18:00
13-Aug
19:00
Tem
pera
ture
(°C
)
Cond air off (°C)
Cond air on (°C)
Ambient air (°C)
Figure 11. Condenser air on, air off and ambient temperatures during trial

0
10
20
30
40
50
60
70
80
90
100
13-Aug
09:00
13-Aug
10:00
13-Aug
11:00
13-Aug
12:00
13-Aug
13:00
13-Aug
14:00
13-Aug
15:00
13-Aug
16:00
13-Aug
17:00
13-Aug
18:00
13-Aug
19:00
Rela
tive h
um
idit
y (
%)
& T
em
pera
ture
(°C
)
RH (%)
Ambient air (°C)
Figure 12. Outside ambient temperature (°C) and relative humidity (%) during trial

0
20
40
60
80
100
120
13-Aug
09:00
13-Aug
10:00
13-Aug
11:00
13-Aug
12:00
13-Aug
13:00
13-Aug
14:00
13-Aug
15:00
13-Aug
16:00
13-Aug
17:00
13-Aug
18:00
13-Aug
19:00
Tem
pera
ture
(°C
)
Cond in (°C)
Cond temp (°C)
Cond out (°C)
Figure 13. Refrigerant temperature in to condenser, condensing temperature and refrigerant temperature out of condenser during trial

-30
-10
10
30
50
70
90
110
130
13-Aug
09:00
13-Aug
10:00
13-Aug
11:00
13-Aug
12:00
13-Aug
13:00
13-Aug
14:00
13-Aug
15:00
13-Aug
16:00
13-Aug
17:00
13-Aug
18:00
13-Aug
19:00
Tem
pera
ture
(°C
)
Comp suction (°C)
Comp discharge(°C)
Comp body (°C)
Comp ambient (°C)
Figure 14. Compressor suction, discharge and compressor body temperatures and air temperature surrounding compressor during
trial

Case study: Pie filling blast chiller energy consumption 23 of 29
0
2
4
6
8
10
12
14
16
18
13-Aug
09:00
13-Aug
10:00
13-Aug
11:00
13-Aug
12:00
13-Aug
13:00
13-Aug
14:00
13-Aug
15:00
13-Aug
16:00
13-Aug
17:00
13-Aug
18:00
13-Aug
19:00
Po
we
r (k
W)
KW 1
Trolley into chiller
12:46
Trolley out of chiller
18:41
Chiller switched on
09:08
Figure 15. Blast chiller power (kW) during trial

Case study: Pie filling blast chiller energy consumption 24 of 29
Figure 15 shows the power consumption over the corresponding period, with the time that the
blast chiller was switched on (9:08), the time the entry door opened and the trolleys pushed in
and the time the exit door opened and the trolleys rolled out overlaid on to it. Note that there
were two electric defrost periods, activated by timer at 4 hourly intervals (13:08 and 17:08).
During defrost the fans and compressor are de-activated, the 7 kW heating elements activated
for 7 minutes followed by a variable length holding period (about 15 minutes in this instance)
with no heaters, fans or compressor power.
Baseline power consumption (steady state)
The baseline power consumption required just to keep the air blast chiller cold, without any
food product load was approximately 5 kW. The evaporator fans alone were consuming
almost 1.5 kW and run continuously at full power (except during defrost), accounting for up
to 30% of the baseline power consumption. In addition to this direct electrical power
consumption they also contribute to an additional heat load on the refrigeration system.
It is clear that minimising (or eliminating) evaporator fan power is key to increasing energy
efficiency.
Evaporating temperature
Analysis of the recorded temperature data reveals that the evaporating temperature appears to
be lower than expected for a blast chilling process (saturation temperature approximately -
15°C). Increasing the evaporation temperature would offer significant energy savings as long
as the product cooling specification could still be maintained. Freezing of the surface and
edges of the pie fillings was noticed on removal of trolleys at the end of the cooling period.
This indicated that the thickness of the product in the trays was probably excessive for
optimum rapid cooling in trays under these conditions. The practicality of using thinner
product and alternative (higher) processing temperatures in the blast chiller are worth
considering.
Validation
London South Bank University have developed a computer based, dynamic simulation
software of a D-X type, air-to-air, vapour compression refrigerator combined with cold-space
and ambient weather model, with the working title of ‘VCRmodel’. This is the type of
system most commonly found in batch chilling and freezing systems in the food industry and
is also found in many chilled and frozen storage rooms.
Case study: Pie filling blast chiller energy consumption 25 of 29
The interactive software allows data to be entered into the model which calculates the time
dependent transient responses of a refrigerator and cold-space to variations in outdoor and
indoor air temperatures and humidity. Transmission and infiltration heat loads through the
structure and doors, internal loads from lighting, people and food-product are all taken into
account. The food-product load is calculated using a food thermal model ‘FoodTemp’ (James
et al., 2009) developed by FRPERC that takes as input the air temperature and flow
determined by the VCRmodel. These data are used to determine the amount of heat removed
from food in the refrigerated space and the rate of cooling in the food. The amount of heat
released by the food is returned as input to the VCRmodel, so that the total energy consumed
at each stage of the process can be determined.
The model was then run after inputting all of the component design data and the measured
parameters, and the predictions in terms of food temperatures and energy used compared with
the measured values.
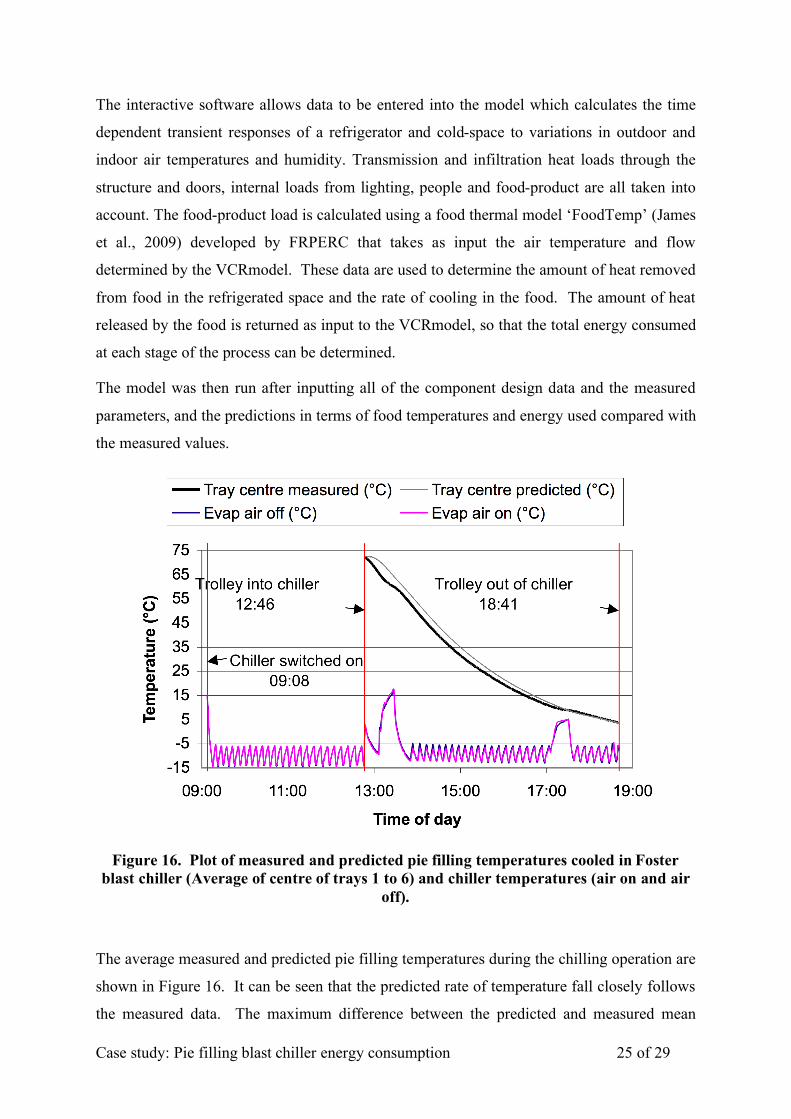
Figure 16. Plot of measured and predicted pie filling temperatures cooled in Foster
blast chiller (Average of centre of trays 1 to 6) and chiller temperatures (air on and air
off).
The average measured and predicted pie filling temperatures during the chilling operation are
shown in Figure 16. It can be seen that the predicted rate of temperature fall closely follows
the measured data. The maximum difference between the predicted and measured mean

Case study: Pie filling blast chiller energy consumption 26 of 29
centre tray temperature at any time is 5.9°C, the average difference is 2.3°C. The measured
and predicted energy consumptions over 15 minute intervals are shown in Figure 17. The
difference between the predicted (58.9 kWh) and measured (64 kWh) overall energy
consumption is 5.1 kWh, an 8 % difference. The base load i.e. the average power used
without any food product was predicted to be 5.1 kW and the measured value 5.6 kW, a 9 %
difference.
Figure 17. Predicted and measured energy consumption over 15 minute intervals.
It is exciting that the initial validation has produced such small errors in the prediction of
food temperatures and energy consumption. During the verification process information
gained from the comprehensive monitoring exercise were available to refine the model.
These data would not normally be available and a considerable amount of time and effort is
now being invested in further verification and development to produce a robust, fully tested
model and to identify its limits of application.
Case study: Pie filling blast chiller energy consumption 27 of 29
Conclusion
This case study provides a benchmark specific energy consumption value for the air blast
cooling of hot solid/liquid food mixtures (specifically hot pie fillings) under ‘actual use’
conditions in a small scale UK chilled pie manufacturing plant.
Specific energy consumption
The mean specific energy consumption over the sampled production period was 173.3
kWh/tonne and ranged from a minimum of 143.1 kWh/tonne to a maximum of 208.2
kWh/tonne.
Specific energy consumption was lowest (143.1 kWh/tonne) on the day of highest
production, indicating that once the chiller is switched on and cooled down at the beginning
of the day (fixed overhead) efficiency will be improved the longer it can be used to usefully
chill pie fillings – i.e. short production runs are less efficient in terms of blast chiller energy
consumption.
Efficiency of air blast chilling process
The mean energy coefficient (EC) of the air blast chilling process was 0.44, ranging from a
minimum of 0.36 to a maximum value of 0.53. These are comparable to some 1980s data but
poor compared to values up to 1.5 for forced air coolers published by the same author more
recently in 2001.
Validation data
A comprehensive set of data for validating the LSBU/FRPERC refrigeration model was
obtained under controlled conditions in the factory. It is planned to use the validated model
to aid the optimisation of the existing air blast chilling system.
Baseline power consumption (steady state)
The baseline power consumption required just to keep the air blast chiller cold, without any
food product load was approximately 5 kW. Evaporator fans alone consumed 1.5 kW and
accounting for up to 30% of the baseline power consumption. In addition to this direct
electrical power consumption they also contribute to an additional heat load on the
refrigeration system.
Evaporating temperature
Analysis of the recorded temperature data revealed lower than expected evaporating
temperatures for a blast chilling process (saturation temperature approximately -15°C).
Increasing the evaporation temperature would offer significant energy savings as long as the
Case study: Pie filling blast chiller energy consumption 28 of 29
product cooling specification could still be maintained. Product surface freezing highlighted
the problem of using too cold air temperatures with too thick a product.
Comparison with model
The predicted rate of temperature fall closely follows the measured data. The maximum
difference between the predicted and measured mean centre tray temperature at any time is
5.9°C, the average difference is 2.3°C.
The difference between the predicted (58.9 kWh) and measured (64 kWh) overall energy
consumption is 5.1 kWh, an 8 % difference. The base load i.e. the average power used
without any food product was predicted to be 5.1 kW and the measured value 5.6 kW, a 9 %
difference.

Case study: Pie filling blast chiller energy consumption 29 of 29
References
Chen, Y.L., 1986. Vacuum cooling and its energy use analysis. Journal of Chinese
Agricultural Engineering 32, pp. 43–50.
James, C., Ketteringham, L., Palpacelli, S. & James, S. J. (2009) Prediction of heat transfer
during food chilling, freezing, thawing and distribution. Chpt 4, pp55-78. Predictive
modelling and risk assessment, edited by Costa, R. & Kristbergsson, K.. Springer
Science+Business Media. ISBN 978-0-387-33512-4.
Miles, C. A., van Beek, G., & Veerkamp, C. H. (1983). Calculation of the thermal properties
of foods. In R. Jowitt, F. Escher, B. Hallstrom, H. F. Th. Me.ert, W. E. L. Speiss, G. Vos,
Physical Properties of Foods (pp. 269-311). New York and London: Applied Science
Publishers.
Thompson, J.F. and Chen, Y.L., (1988). Comparative energy use of vacuum, hydro, and
forced air coolers for fruits and vegetables. ASHRAE Transactions 92, pp. 1427–1433.
Thompson, J. (2001). Energy conservation in cold storage and cooling operations.
Perishable Handling Quarterly, Issue 105. Feb. pp. 7-9.