engaging physicians (and care teams) in providing evidence based … · care teams) in providing...
TRANSCRIPT
Engaging Physicians (and Care Teams) in Providing Evidence Based Care
Don Goldmann, MD
Chief Medical and Scientific Officer
Institute for Healthcare Improvement
Clinical Professor of Pediatrics
Harvard Medical School
@DAGoldmann
NaRCAD 2015
November 10, 2015

My Personal Take on the “Science of
Improvement”
• Scientific regardless of name: – Science of improvement
– Health care delivery science
– Implementation science
– Systems strengthening
– Systems engineering
• Scientific methods include – “Model for improvement” promulgated by IHI
– Lean
– Six Sigma
– Lean Six Sigma
– DMAIC (Design, Measure, Analyze, Improve and Control)
– Value stream maps
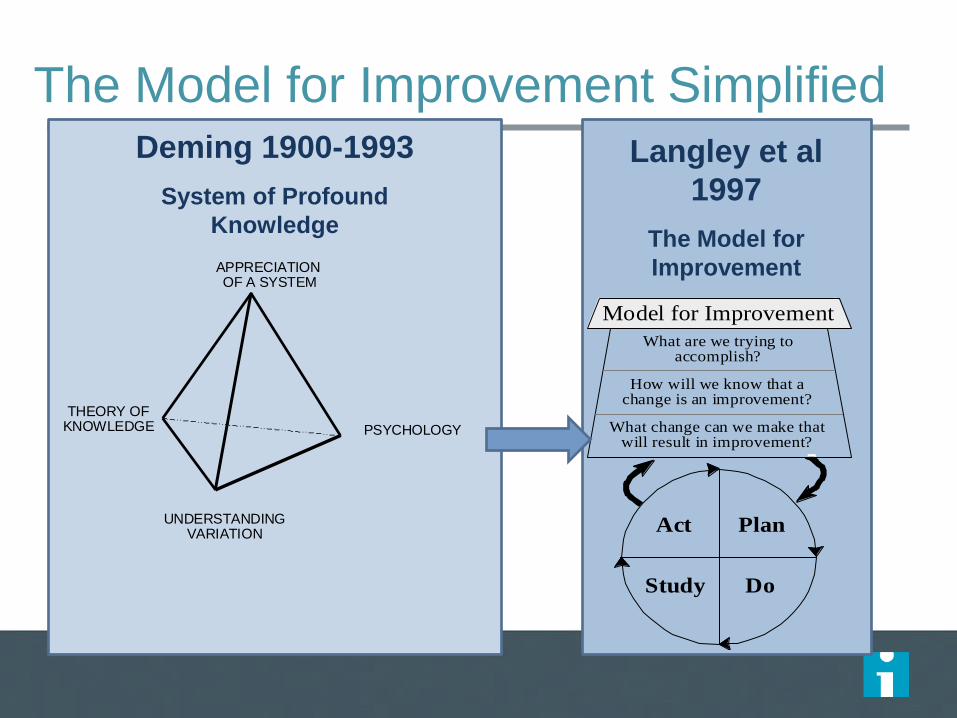
The Model for Improvement Simplified
APPRECIATION OF A SYSTEM
PSYCHOLOGY
UNDERSTANDINGVARIATION
THEORY OFKNOWLEDGE
Deming 1900-1993
System of Profound
Knowledge
What are we trying toaccomplish?
How will we know that achange is an improvement?
What change can we make thatwill result in improvement?
Model for Improvement
PlanAct
DoStudy
Langley et al
1997
The Model for
Improvement
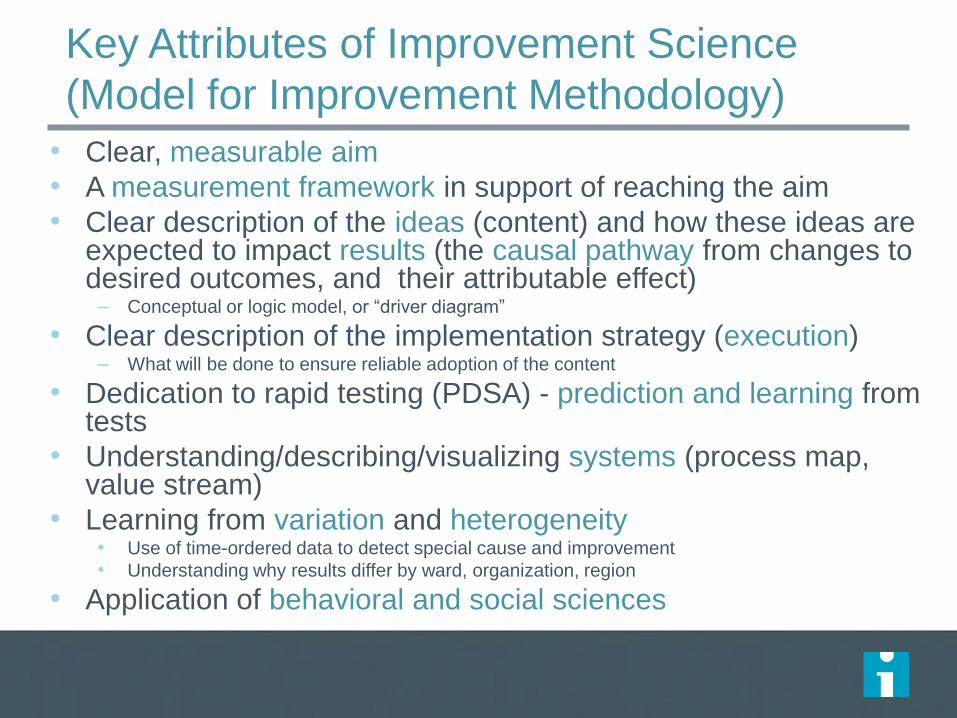
Key Attributes of Improvement Science
(Model for Improvement Methodology)
• Clear, measurable aim
• A measurement framework in support of reaching the aim
• Clear description of the ideas (content) and how these ideas are expected to impact results (the causal pathway from changes to desired outcomes, and their attributable effect)
– Conceptual or logic model, or “driver diagram”
• Clear description of the implementation strategy (execution) – What will be done to ensure reliable adoption of the content
• Dedication to rapid testing (PDSA) - prediction and learning from tests
• Understanding/describing/visualizing systems (process map, value stream)
• Learning from variation and heterogeneity • Use of time-ordered data to detect special cause and improvement
• Understanding why results differ by ward, organization, region
• Application of behavioral and social sciences
Why Physicians who Understand Laboratory and
Translational Science Should be Comfortable with
Rigorous QI
• My ten years working with a PhD scientist to develop a
Staphylococcus vaccine…
• The “experimental method,” mice, theories/hypotheses,
and PDSAs
‒ While the “context” of lab work is far less complex than the
“context” of the hospital or clinic, behavioral and contextual
issues do come into play
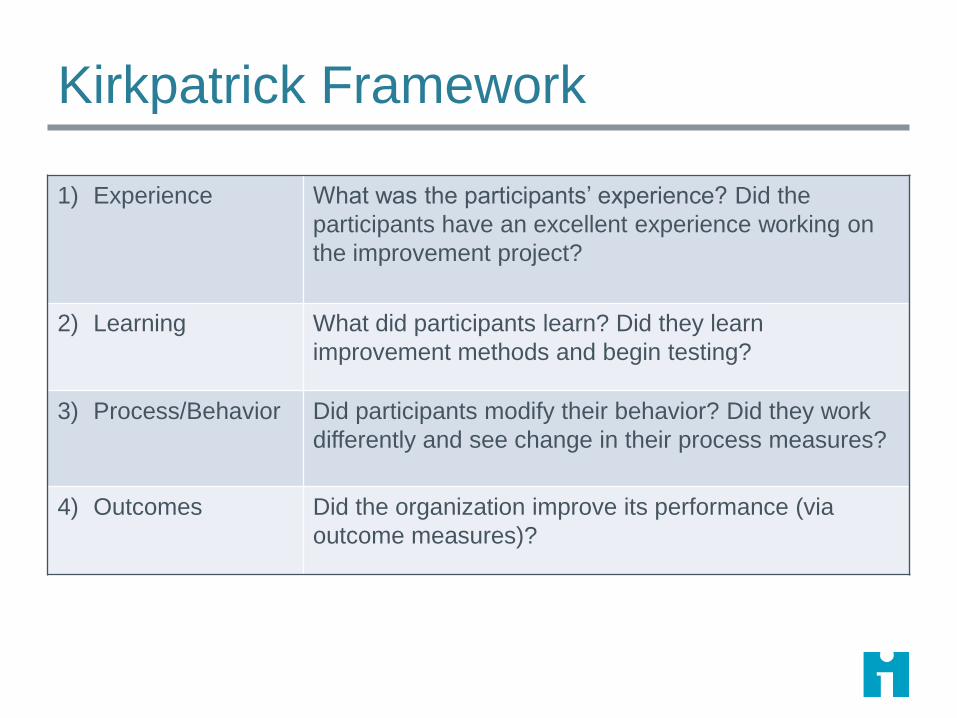
Kirkpatrick Framework
1) Experience What was the participants’ experience? Did the
participants have an excellent experience working on
the improvement project?
2) Learning What did participants learn? Did they learn
improvement methods and begin testing?
3) Process/Behavior Did participants modify their behavior? Did they work
differently and see change in their process measures?
4) Outcomes Did the organization improve its performance (via
outcome measures)?
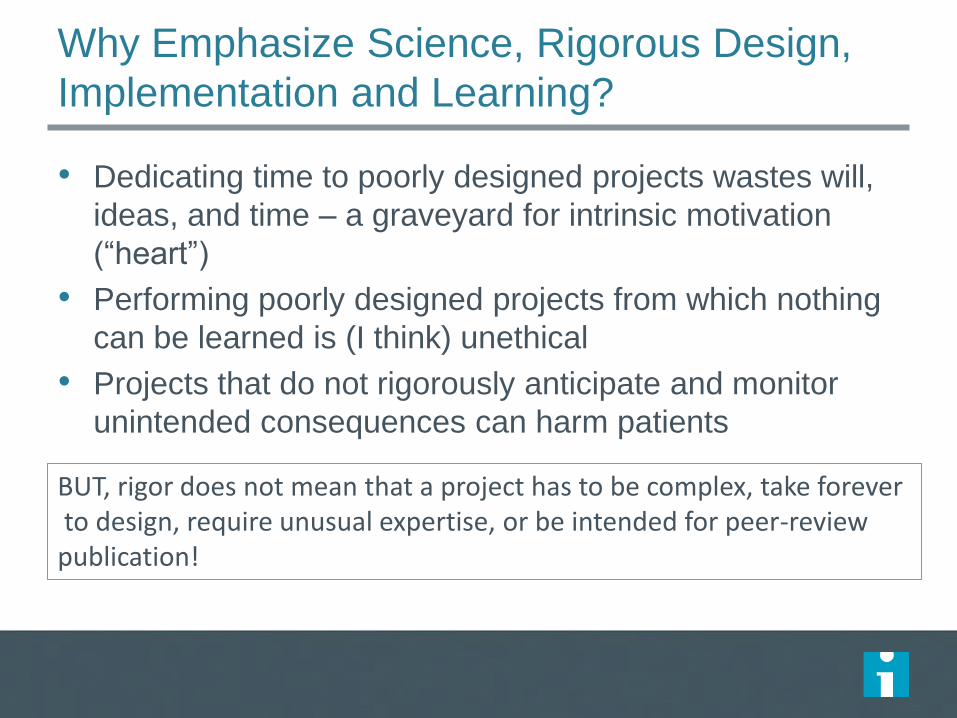
Why Emphasize Science, Rigorous Design,
Implementation and Learning?
• Dedicating time to poorly designed projects wastes will,
ideas, and time – a graveyard for intrinsic motivation
(“heart”)
• Performing poorly designed projects from which nothing
can be learned is (I think) unethical
• Projects that do not rigorously anticipate and monitor
unintended consequences can harm patients
BUT, rigor does not mean that a project has to be complex, take forever to design, require unusual expertise, or be intended for peer-review publication!
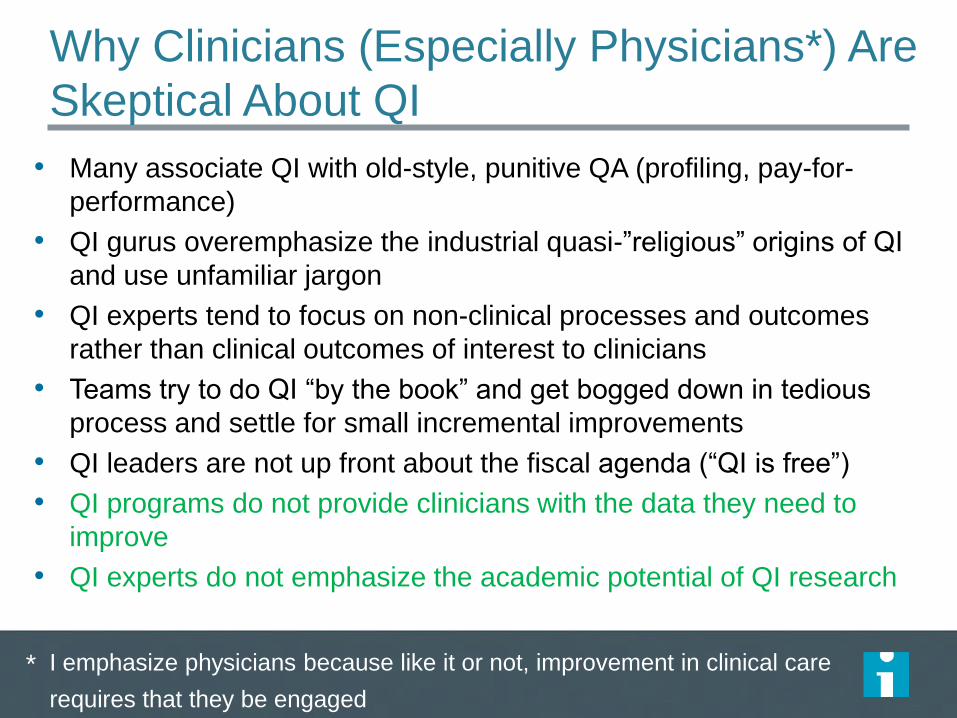
Why Clinicians (Especially Physicians*) Are
Skeptical About QI
• Many associate QI with old-style, punitive QA (profiling, pay-for-
performance)
• QI gurus overemphasize the industrial quasi-”religious” origins of QI
and use unfamiliar jargon
• QI experts tend to focus on non-clinical processes and outcomes
rather than clinical outcomes of interest to clinicians
• Teams try to do QI “by the book” and get bogged down in tedious
process and settle for small incremental improvements
• QI leaders are not up front about the fiscal agenda (“QI is free”)
• QI programs do not provide clinicians with the data they need to
improve
• QI experts do not emphasize the academic potential of QI research
I emphasize physicians because like it or not, improvement in clinical care
requires that they be engaged
*
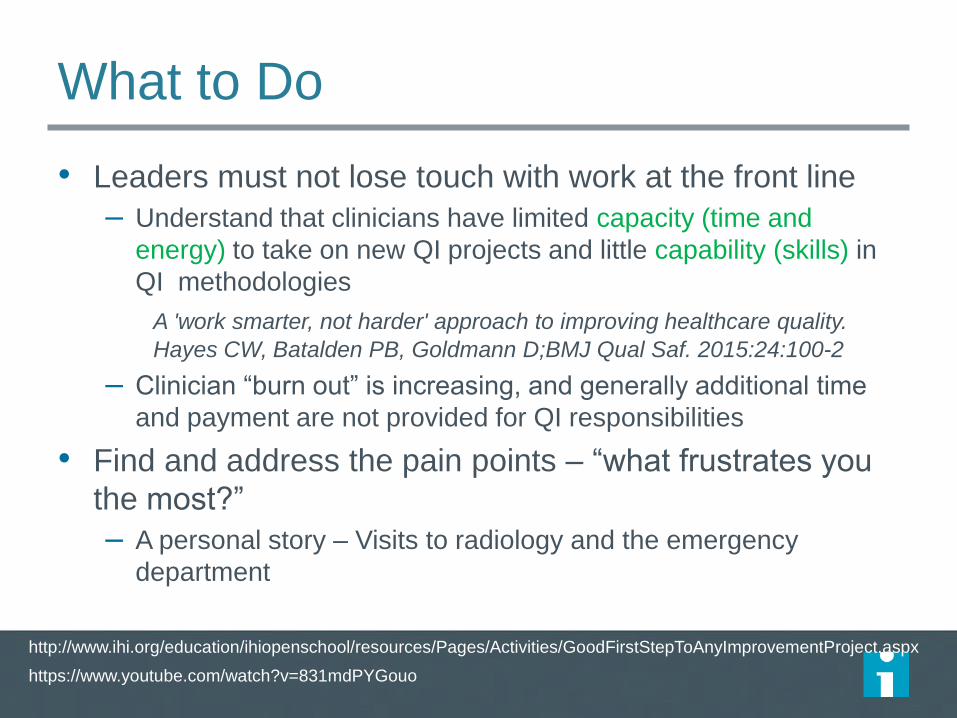
What to Do
• Leaders must not lose touch with work at the front line
‒ Understand that clinicians have limited capacity (time and
energy) to take on new QI projects and little capability (skills) in
QI methodologies
A 'work smarter, not harder' approach to improving healthcare quality.
Hayes CW, Batalden PB, Goldmann D;BMJ Qual Saf. 2015:24:100-2
‒ Clinician “burn out” is increasing, and generally additional time
and payment are not provided for QI responsibilities
• Find and address the pain points – “what frustrates you
the most?”
‒ A personal story – Visits to radiology and the emergency
department
http://www.ihi.org/education/ihiopenschool/resources/Pages/Activities/GoodFirstStepToAnyImprovementProject.aspx
https://www.youtube.com/watch?v=831mdPYGouo
What to Do
• Teamwork is essential
‒ QI is inherently inter-professional, yet clinicians generally are not
trained to work in teams, nurse-physician tensions remain, and
work patterns and schedules are hard to synchronize
‒ A gulf remains between clinicians at the bedside and critical
support personnel, such as pharmacists, physical therapists, and
social workers
• Imbed QI, including data collection, in real work – not
separate and added on
10
How to Implement Credible QI Projects…
Without large grants ….By leveraging inter-professional knowledge and skills ….As part of routine work while learning and even having fun ….Regardless of (or because of) the job descriptions of team members

Personal Experience
Experiential Learning – Making
Rigorous QI Part of Routine Work at
the Point of Care
Monitoring Patient Safety
• Voluntary event reporting
• Morbidity and mortality conferences/reports
• Chart auditing – IHI Global Trigger Tool
• Automated data mining – Patient Safety Indicators (AHRQ PSIs)
– Automated trigger tools
• Random Safety Audit
Random Safety Audit
• Translated from industry (banking and random
process audits via Paul Plesk)
• Real time by the front line
• Data and feedback virtually immediate – Reliability of key safety processes evident immediately
– Motivating, enabling, reinforcing; builds self-efficacy and social norms (key
elements of behavioral change theory)
• Combines audit and feedback with iterative
PDSAs
– Even better than “what can I try by next Tuesday”
Qual Saf Health Care. 2005:14:284-9.
Random Safety Audit
• Systematically monitors a subset of error-prone points
in the system that have the potential to harm patients
• Items selected randomly to be addressed either
– On multi-disciplinary rounds (provider input required)
– Any time during day (provider input not needed)
• Deck can be “packed”
• 20 items developed by expert consensus for testing in
NICU (21st item added later)
• 4X6 “cards” include yes/no data form; trivia question
on back
Staff Perceptions of the Random Safety
Audit
• 84% of staff participated in rounds on which
audit performed
• 100% agreed or strongly agreed that this
improved quality and safety
• 95% agreed/strongly agreed that it increased
knowledge of clinical guidelines and safety goals
• Only 9% agree with statement “asking a safety
question of rounds took up too much time”
Even 3rd-5th Grade Students Can Be Engaged
• Sandora TJ, Shih MC, Goldmann DA. Pediatrics. 2008
121:e1555-62. Reducing absenteeism from
gastrointestinal and respiratory illness in elementary
school students: a randomized, controlled trial of an
infection-control intervention.
• Young students can make their own run charts and do
tests of change…as in a school improvement project in
Chile related to nutrition and obesity..

19
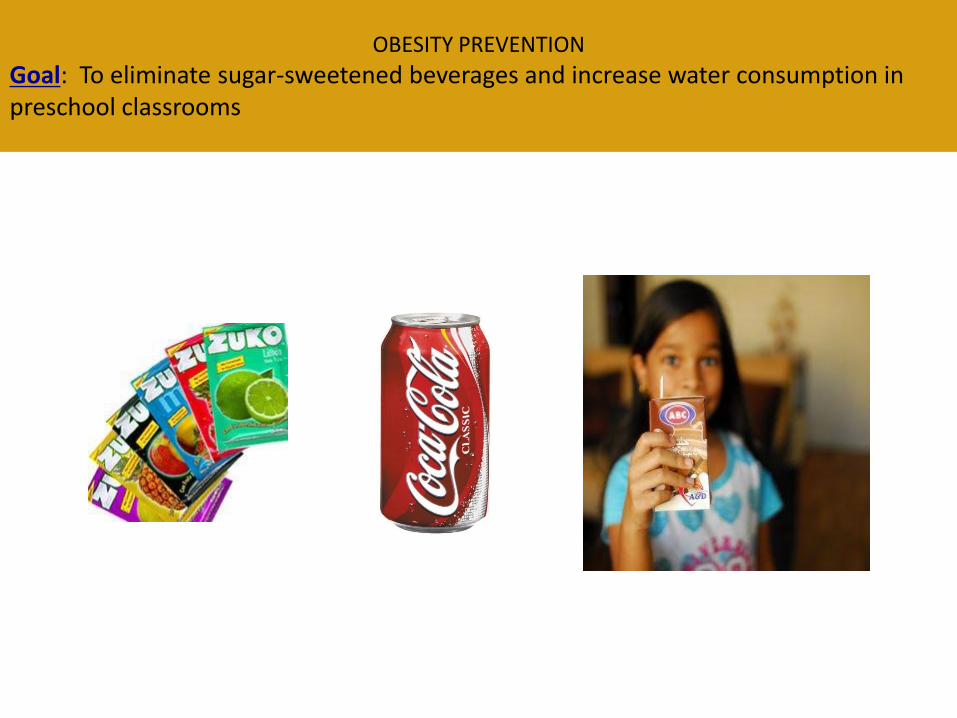
OBESITY PREVENTION
Goal: To eliminate sugar-sweetened beverages and increase water consumption in preschool classrooms
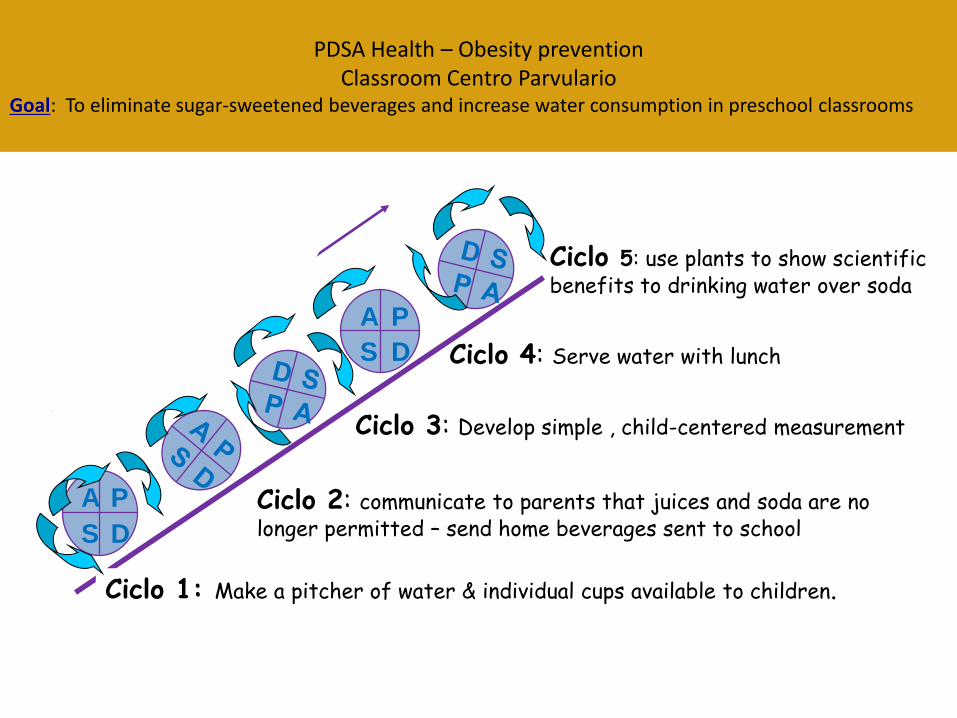
PDSA Health – Obesity prevention Classroom Centro Parvulario
Goal: To eliminate sugar-sweetened beverages and increase water consumption in preschool classrooms
A P
S D
A P
S D
Ciclo 1: Make a pitcher of water & individual cups available to children.
Ciclo 2: communicate to parents that juices and soda are no longer permitted – send home beverages sent to school
Ciclo 4: Serve water with lunch
Ciclo 3: Develop simple , child-centered measurement
Ciclo 5: use plants to show scientific benefits to drinking water over soda


UCL
LCL 0%
10%
20%
30%
40%
50%
60%
4/2
/12
4/3
/12
4/4
/12
4/5
/12
4/9
/12
4/1
0/1
2
4/1
1/1
2
4/1
2/1
2
4/1
3/1
2
4/1
6/1
2
4/1
7/1
2
4/1
8/1
2
4/1
9/1
2
4/2
0/1
2
4/2
3/1
2
4/2
4/1
2
4/2
5/1
2
4/2
6/1
2
4/2
7/1
2
5/2
/12
5/3
/12
5/4
/12
5/5
/12
5/7
/12
5/8
/12
5/9
/12
5/1
0/1
2
5/1
1/1
2
5/1
4/1
2
5/1
5/1
2
5/1
6/1
2
5/1
7/1
2
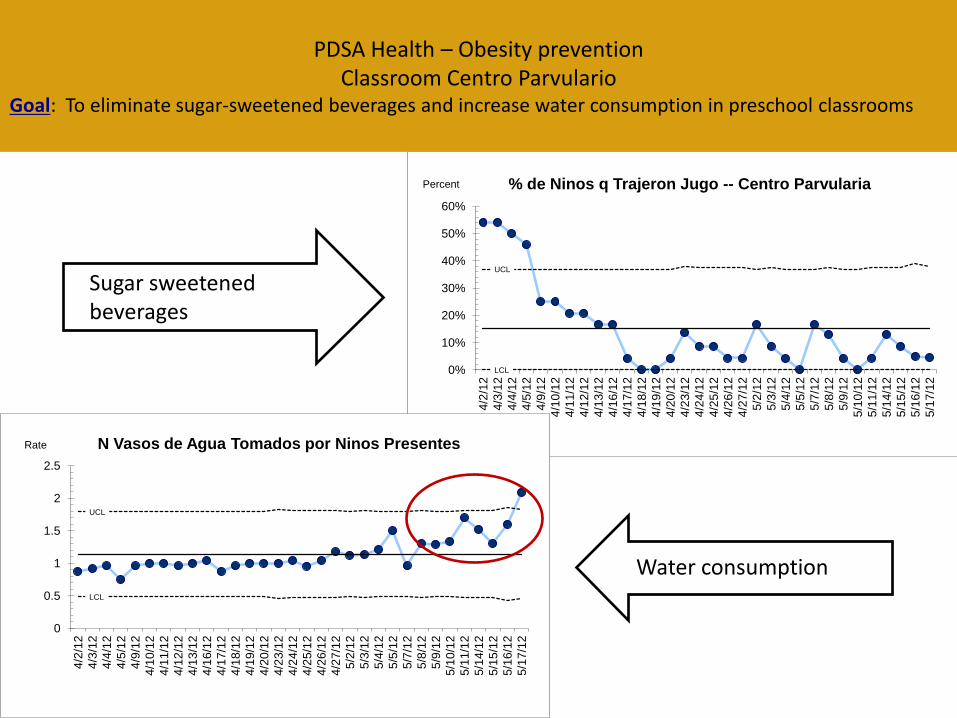
% de Ninos q Trajeron Jugo -- Centro Parvularia Percent
UCL
LCL
0
0.5
1
1.5
2
2.5
4/2
/12
4/3
/12
4/4
/12
4/5
/12
4/9
/12
4/1
0/1
2
4/1
1/1
2
4/1
2/1
2
4/1
3/1
2
4/1
6/1
2
4/1
7/1
2
4/1
8/1
2
4/1
9/1
2
4/2
0/1
2
4/2
3/1
2
4/2
4/1
2
4/2
5/1
2
4/2
6/1
2
4/2
7/1
2
5/2
/12
5/3
/12
5/4
/12
5/5
/12
5/7
/12
5/8
/12
5/9
/12
5/1
0/1
2
5/1
1/1
2
5/1
4/1
2
5/1
5/1
2
5/1
6/1
2
5/1
7/1
2
N Vasos de Agua Tomados por Ninos Presentes Rate
PDSA Health – Obesity prevention Classroom Centro Parvulario
Goal: To eliminate sugar-sweetened beverages and increase water consumption in preschool classrooms
Sugar sweetened beverages
Water consumption
Three Simple Examples of Interprofessional
QI Involving Junior Doctors
• Do you know who your doctor is?
• Understanding drug usage and reducing unnecessary
prescriptions
• Learning how to look for medical errors as part of routine
work
Try Something Yourself
• At work – “You are always late for rounds!”
• At home – avoiding the weed whacker (http://www.ihi.org/education/IHIOpenSchool/resources/P
ages/Activities/PDSACyclesFromCLABSIsToCucumbers.
aspx)

27
http://www.ihi.org/education/IHIOpenSchoo
l/resources/Pages/Activities/PDSACyclesFr
omCLABSIsToCucumbers.aspx
If They Can Do It in Bogotá during
Civil Conflict with Constrained
Resources…
Reducing Post-Caesarian Infections
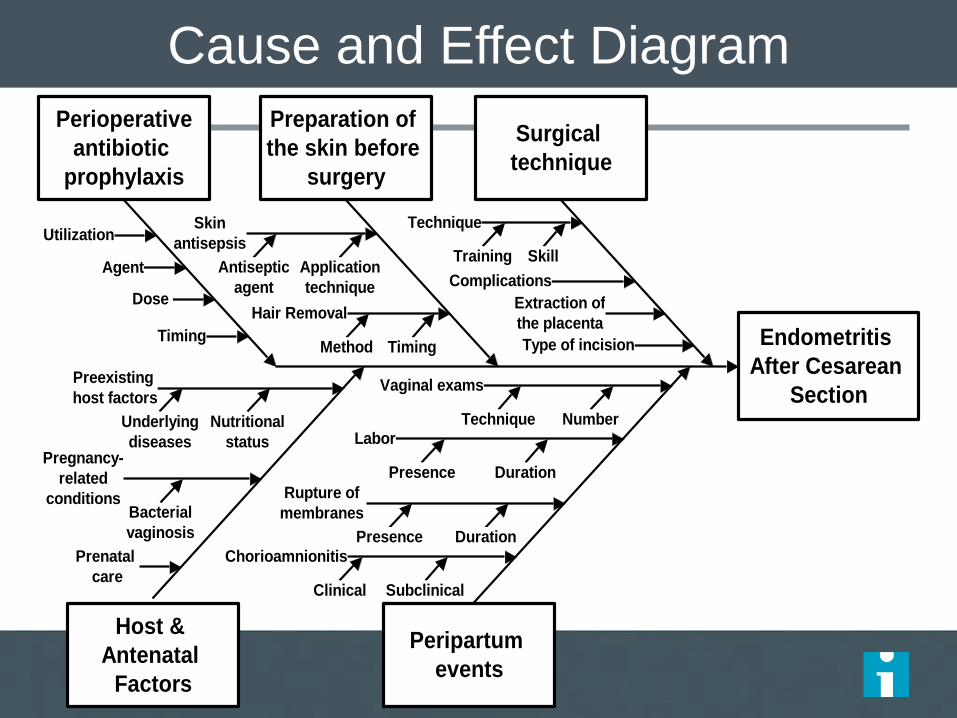
Cause and Effect Diagram
Endometritis
After Cesarean
Section
Peripartum
events
Host &
Antenatal
Factors
Preparation of
the skin before
surgery
Perioperative
antibiotic
prophylaxis
Skin
antisepsis
Hair Removal
Utilization
Timing
Nutritional
statusPregnancy-
related
conditions
Preexisting
host factors
Labor
Chorioamnionitis
Rupture of
membranes
Surgical
technique
Antiseptic
agent
Application
technique
TimingMethod
Complications
Extraction of
the placenta
Technique
Training
Prenatal
care
Vaginal exams
SubclinicalClinical
Number
Skill
Type of incision
Agent
Technique
Dose
Underlying
diseases
Bacterial
vaginosis
DurationPresence
DurationPresence
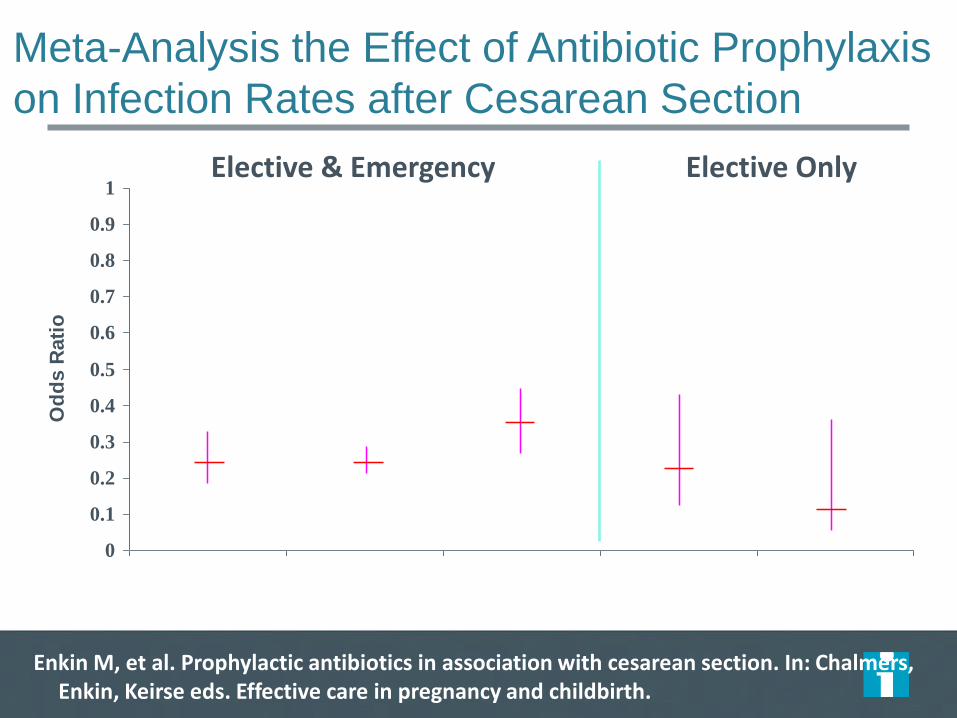
Meta-Analysis the Effect of Antibiotic Prophylaxis
on Infection Rates after Cesarean Section
0
0.1
0.2
0.3
0.4
0.5
0.6
0.7
0.8
0.9
1
Od
ds R
ati
o
Enkin M, et al. Prophylactic antibiotics in association with cesarean section. In: Chalmers, Enkin, Keirse eds. Effective care in pregnancy and childbirth.
Elective & Emergency Elective Only
Any serious infection
Endometritis Wound infection
Endometritis Wound infection
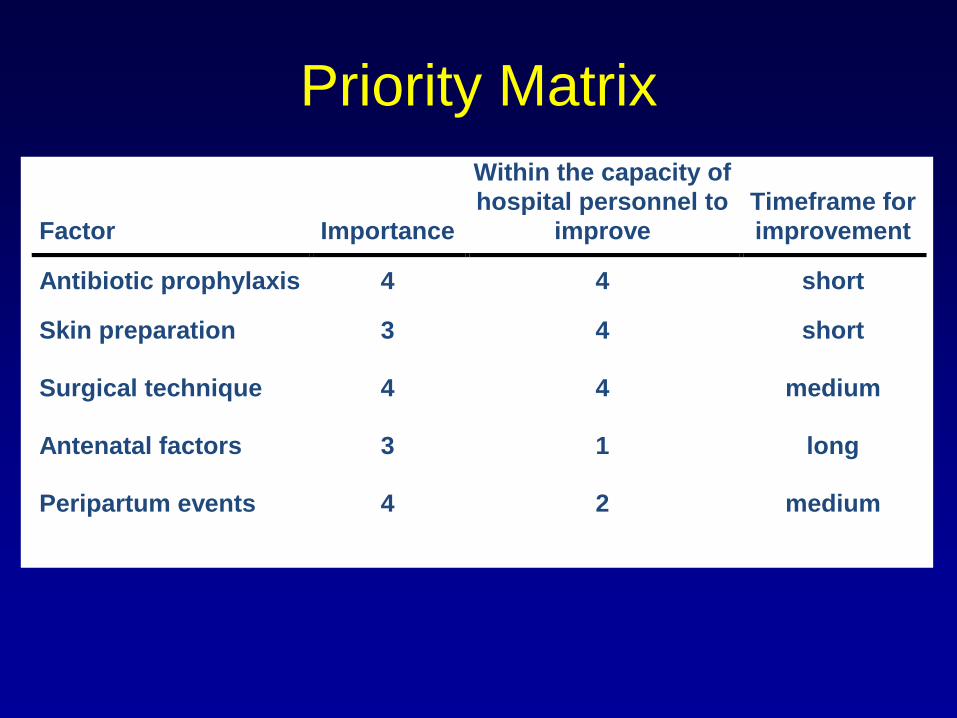
Factor
Importance
Within the capacity of
hospital personnel to
improve
Timeframe for
improvement
Antibiotic prophylaxis 4 4 short
Skin preparation 3 4 short
Surgical technique 4 4 medium
Antenatal factors 3 1 long
Peripartum events 4 2 medium
Priority Matrix
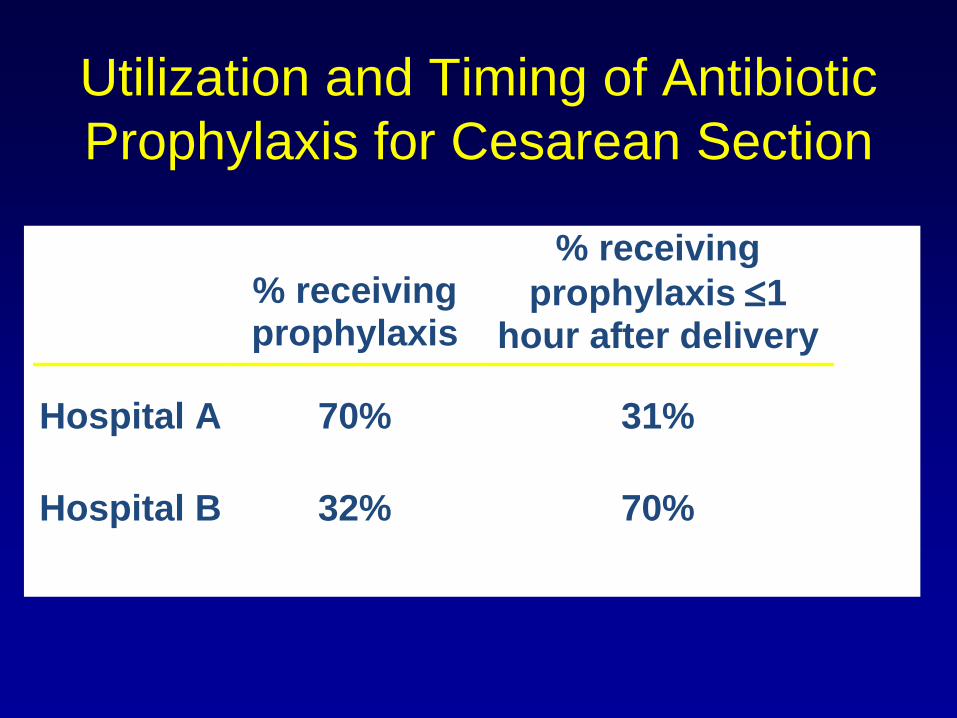
Utilization and Timing of Antibiotic
Prophylaxis for Cesarean Section
% receiving prophylaxis
% receiving
prophylaxis 1 hour after delivery
Hospital A 70% 31%
Hospital B 32% 70%
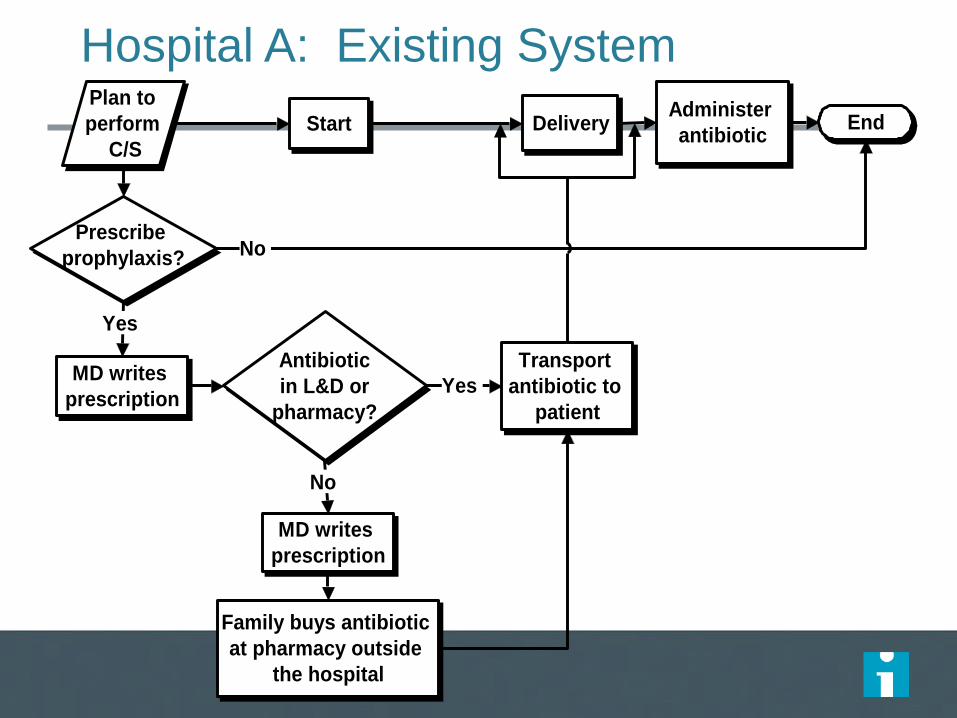
Hospital A: Existing System
Family buys antibiotic
at pharmacy outside
the hospital
Antibiotic
in L&D or
pharmacy?
MD writes
prescription
Administer
antibiotic
MD writes
prescription
Plan to
perform
C/S
Prescribe
prophylaxis?
Delivery EndStart
Transport
antibiotic to
patient
Yes
No
Yes
No
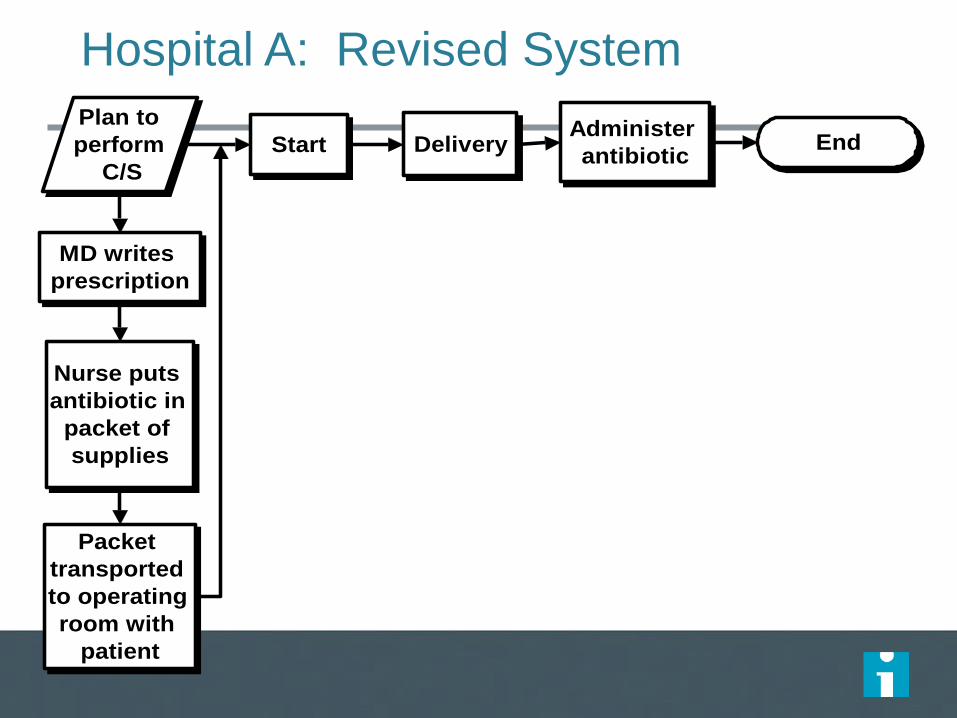
Hospital A: Revised System
Packet
transported
to operating
room with
patient
Administer
antibiotic
MD writes
prescription
Plan to
perform
C/S
DeliveryStart
Nurse puts
antibiotic in
packet of
supplies
End
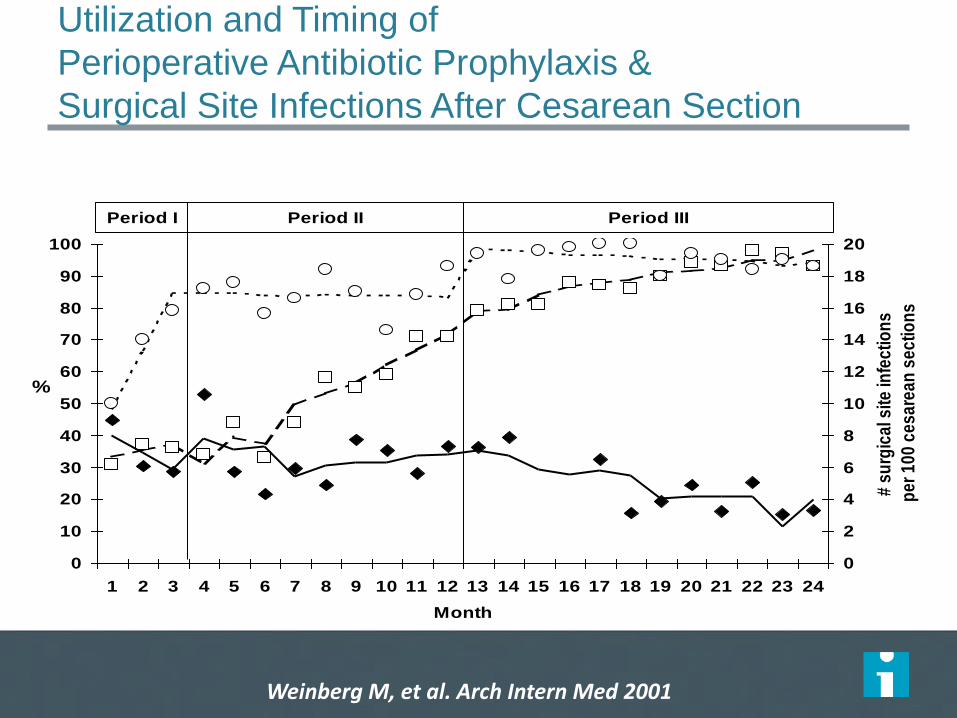
0
10
20
30
40
50
60
70
80
90
100
1 2 3 4 5 6 7 8 9 10 11 12 13 14 15 16 17 18 19 20 21 22 23 24
Month
%
0
2
4
6
8
10
12
14
16
18
20
# s
urg
ica
l sit
e in
fec
tio
ns
pe
r 1
00
ce
sa
rea
n s
ec
tio
ns
Period I Period II Period III
Utilization and Timing of
Perioperative Antibiotic Prophylaxis &
Surgical Site Infections After Cesarean Section
Receipt of antibiotic Receipt of antibiotic <1 hour after delivery Surgical site infection rate
Weinberg M, et al. Arch Intern Med 2001
Ten Tips for Incorporating
Rigorous Quality Improvement
into Everyday Work
BMJ Qual Saf. 2011 Apr;20 Suppl 1:i69-72
Tip 1
• Select projects that really will make a difference
to providers and patients
– Focus on clinically relevant projects that substantially
improve those processes of care that are tightly linked
to the outcomes of interest to providers and patients
– Think of a headline the CEO or CMO would want to
feature on the organization’s website
Tip 2
• Set bold, clear, measureable aims and a specific
timeline for achieving them
– Think of fundamental advances that will measurably
impact care and outcomes and engage clinical staff
Tip 3
• Assemble a multi-disciplinary team including
providers, stakeholders, and methodologists,
tailored to the specific aim of the project
– Be agnostic with respect to disciplines and titles
when assigning roles and rewards
– If publication is anticipated, define roles and
authorships very early on
– Giving appropriate first authorships to non-MDs
does not jeopardize publication in leading
journals
Tip 4
• Be creative in recruiting experts
– Behavioral scientists, sociologists, economists,
epidemiologists, statisticians, qualitative researchers,
and other experts often are looking for opportunities
to partner with clinical researchers, especially if there
is a prospect of co-authorship
Tip 5
• Adopt the most rigorous study design possible
without disrupting routine work unduly
– Incorporate data collection into usual activities of
professional staff (eg: infection control, clinical
pharmacists)
Tip 6
• Do everything possible not to sacrifice data
quality and completeness
– Develop simple data collection tools that also simplify
and increase reliability of daily work
– Checklists and standardized order sets are especially
useful
Tip 7
• Take advantage of emerging certification
requirements for clinical staff and make
improvement academically viable
– MOC requirements can be satisfied by improvement
activities (eg: Vermont Oxford’s NICQ collaborative)
– Morph “good citizen” work, such as CPG
development and evaluation, into publications and
other CV-worthy work products
Tip 8
• Do not assume that substantial external grant
funding is required to perform credible quality
improvement work
– Leverage institutional resources
– Encourage development of institutional small grant
awards for quality improvement
– Consider support from payers, industry, and
professional societies
– Look for “free” hands, such as graduate students
Tip 9
• Pay careful attention to the ethics of quality
improvement work, but try to craft projects that
are unlikely to require formal IRB approval
– Remember
– Poorly designed projects are unlikely to yield
useful knowledge and arguably are not ethical
– Patients have a right to expect that unexpected
consequences will be considered and monitored
Tip 10
• Anticipate publication
– Apply the SQUIRE guidelines
– Right a “dummy” abstract and construct “dummy”
tables and figures
– Be clear about authorships
– Make the most of “negative” studies
Davidoff et al., Qual Saf Health Care 2008;17 (Suppl 1):13-19
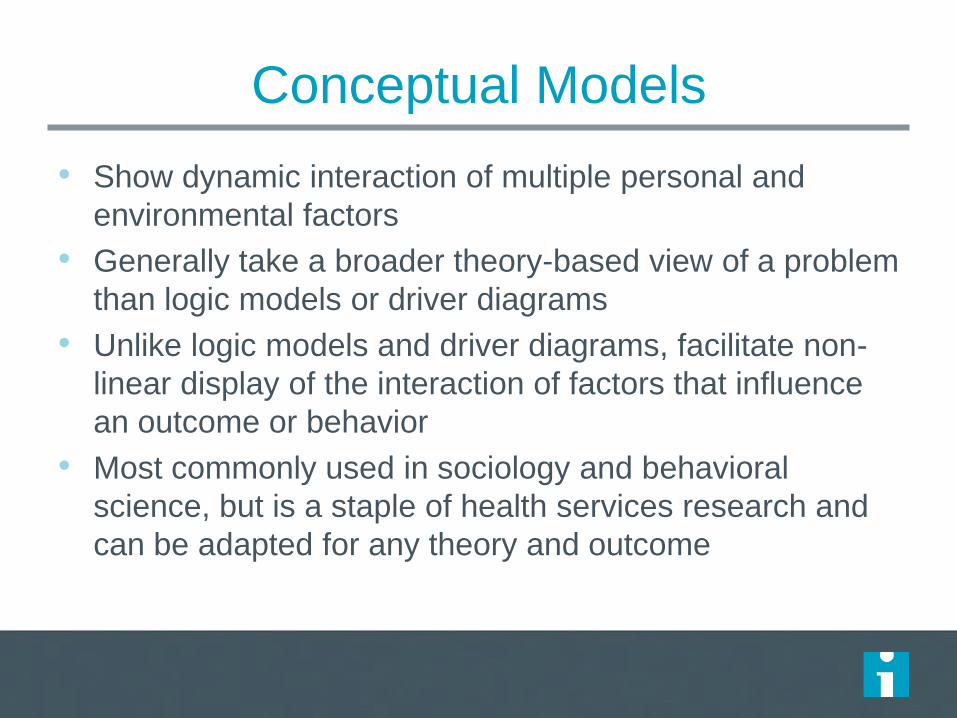
Conceptual Models
• Show dynamic interaction of multiple personal and
environmental factors
• Generally take a broader theory-based view of a problem
than logic models or driver diagrams
• Unlike logic models and driver diagrams, facilitate non-
linear display of the interaction of factors that influence
an outcome or behavior
• Most commonly used in sociology and behavioral
science, but is a staple of health services research and
can be adapted for any theory and outcome
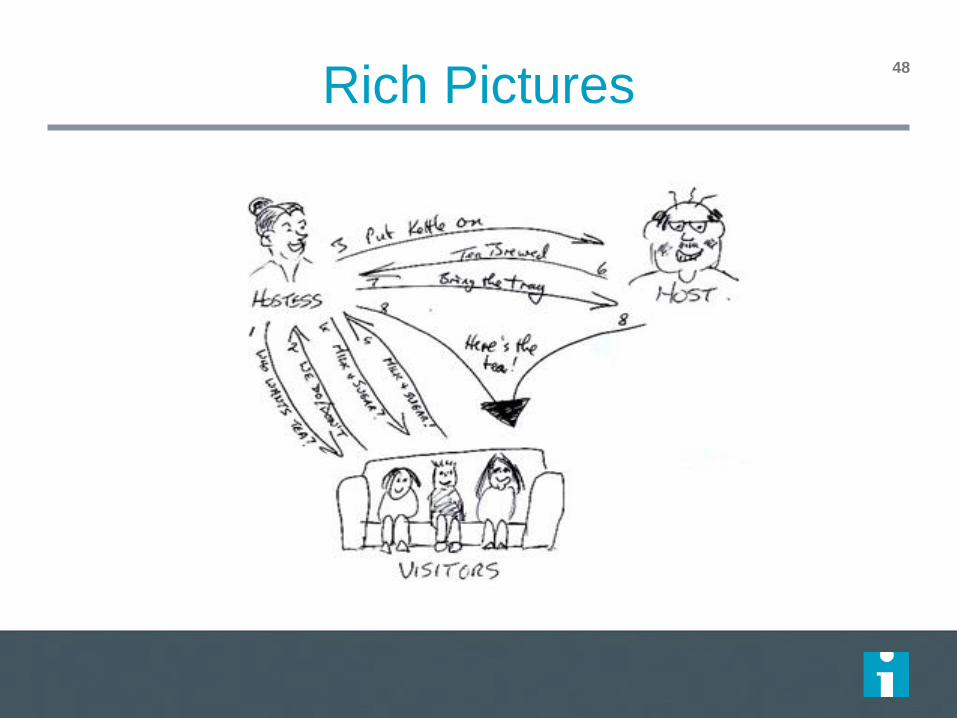
Rich Pictures
48
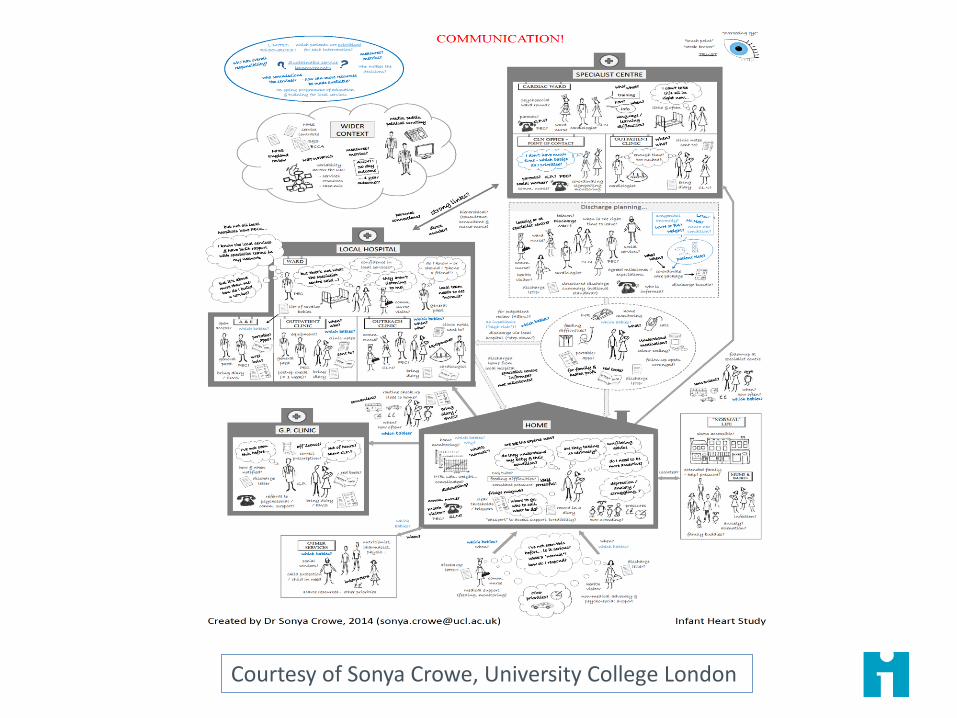
Courtesy of Sonya Crowe, University College London
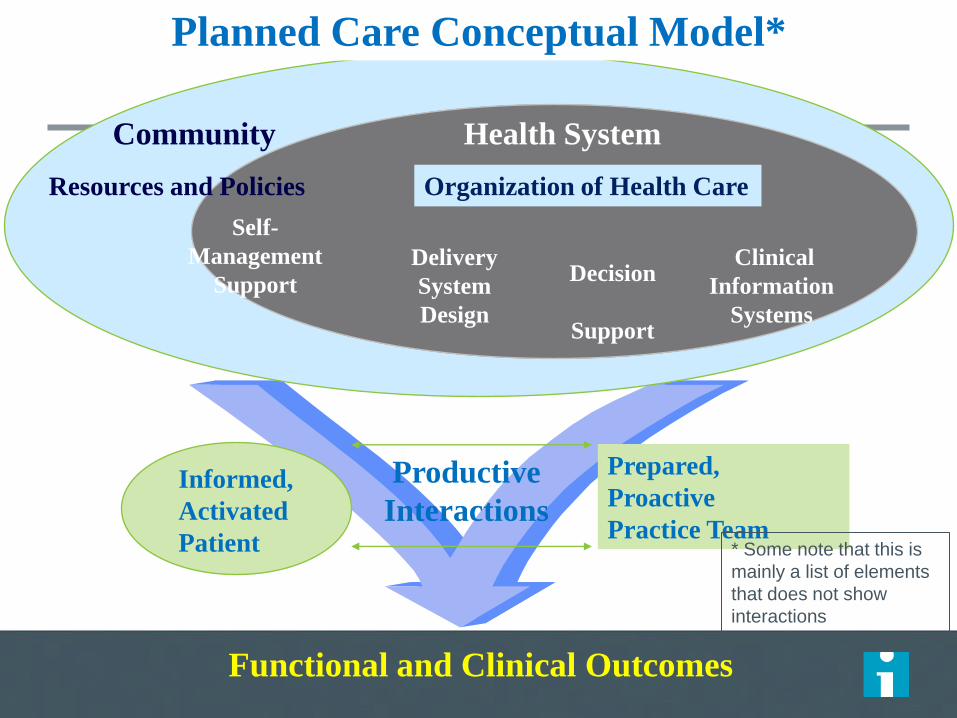
Informed,
Activated
Patient
Productive
Interactions
Prepared,
Proactive
Practice Team
Functional and Clinical Outcomes
Delivery
System
Design
Decision
Support
Clinical
Information
Systems
Self-
Management
Support
Health System
Resources and Policies
Community
Organization of Health Care
Planned Care Conceptual Model*
* Some note that this is
mainly a list of elements
that does not show
interactions
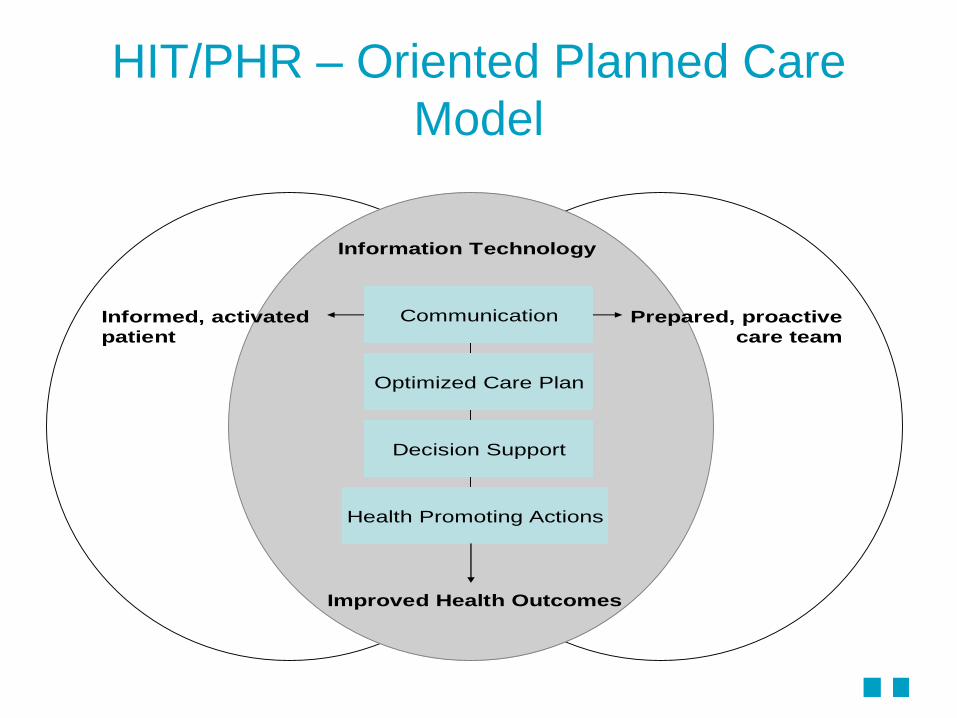
HIT/PHR – Oriented Planned Care
Model
Optimized Care Plan
Decision Support
Health Promoting Actions
CommunicationInformed, activated
patient
Prepared, proactive
care team
Improved Health Outcomes
Information Technology
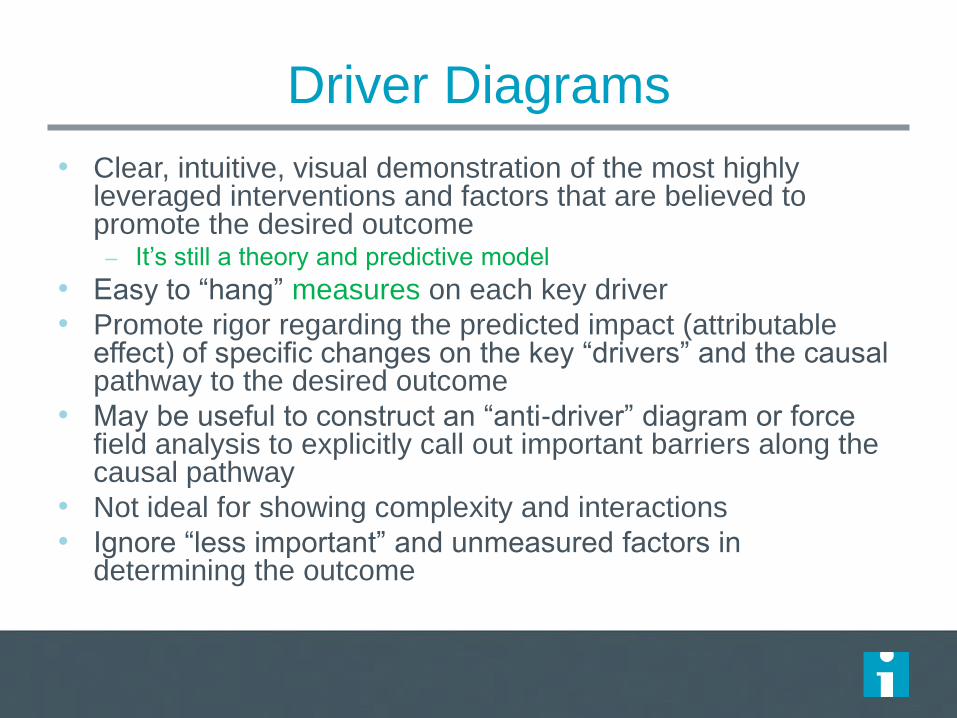
Driver Diagrams
• Clear, intuitive, visual demonstration of the most highly leveraged interventions and factors that are believed to promote the desired outcome – It’s still a theory and predictive model
• Easy to “hang” measures on each key driver
• Promote rigor regarding the predicted impact (attributable effect) of specific changes on the key “drivers” and the causal pathway to the desired outcome
• May be useful to construct an “anti-driver” diagram or force field analysis to explicitly call out important barriers along the causal pathway
• Not ideal for showing complexity and interactions
• Ignore “less important” and unmeasured factors in determining the outcome
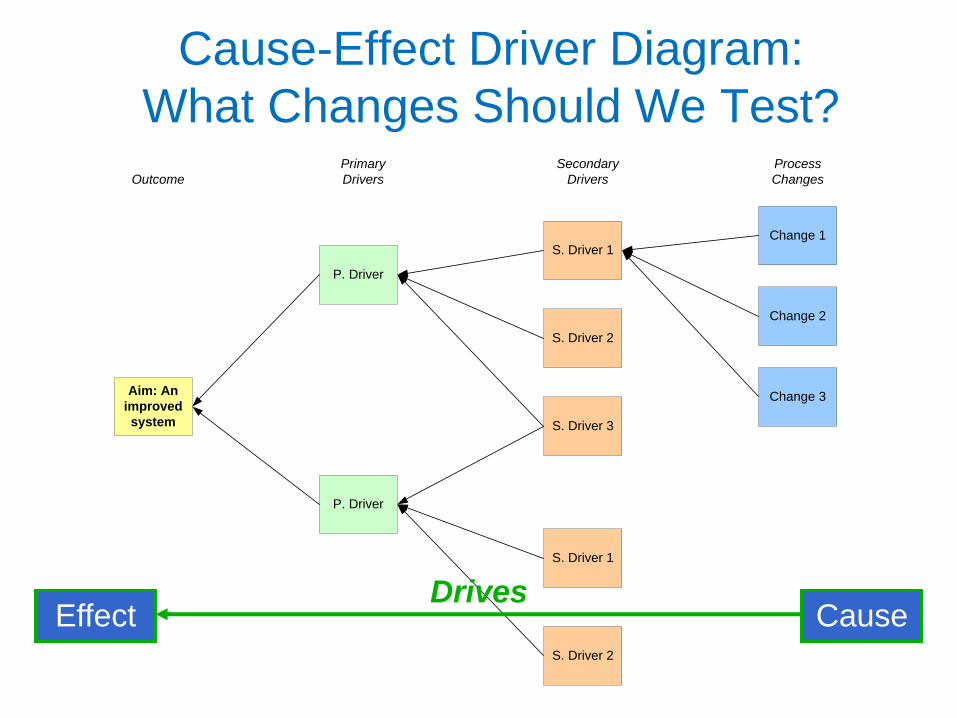
Cause-Effect Driver Diagram:
What Changes Should We Test? Primary
DriversOutcome
Secondary
Drivers
Process
Changes
Aim: An
improved
system
P. Driver
S. Driver 1Change 1
P. Driver
S. Driver 2
S. Driver 3
S. Driver 1
S. Driver 2
Change 2
Change 3
Cause Effect Drives
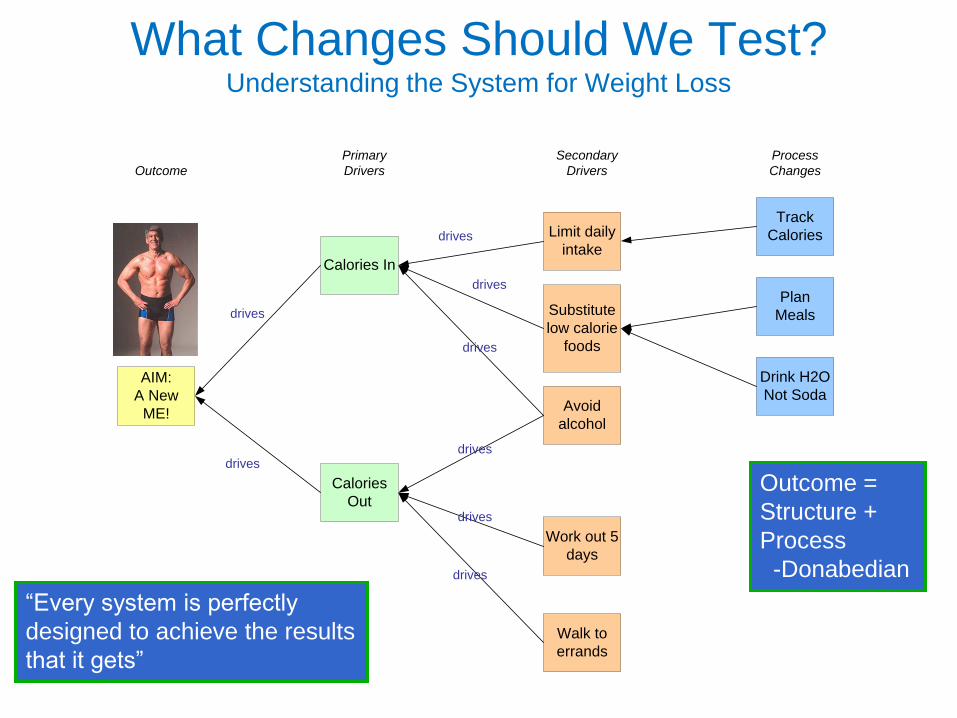
Primary
DriversOutcome
Secondary
Drivers
Process
Changes
AIM:
A New
ME!
Calories In
Limit daily
intake
Track
Calories
Calories
Out
Substitute
low calorie
foods
Avoid
alcohol
Work out 5
days
Walk to
errands
Plan
Meals
Drink H2O
Not Soda
drives
drives
drives
drives
drives
drives
drives
drives
What Changes Should We Test? Understanding the System for Weight Loss
“Every system is perfectly
designed to achieve the results
that it gets”
Outcome =
Structure +
Process
-Donabedian
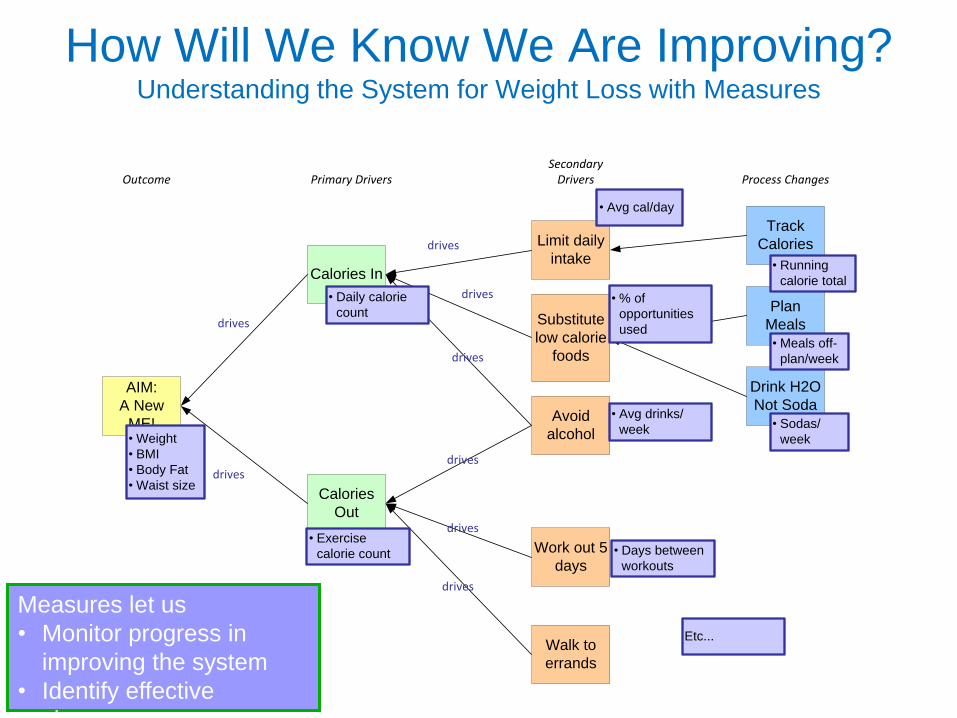
How Will We Know We Are Improving? Understanding the System for Weight Loss with Measures
Primary DriversOutcomeSecondary
Drivers Process Changes
AIM:
A New
ME!
Calories In
Limit daily
intake
Track
Calories
Calories
Out
Substitute
low calorie
foods
Avoid
alcohol
Work out 5
days
Walk to
errands
Plan
Meals
Drink H2O
Not Soda
drives
drives
drives
drives
drives
drives
drives
drives
• Weight
• BMI
• Body Fat
• Waist size
• Daily calorie
count
• Exercise
calorie count • Days between
workouts
• Avg drinks/
week
• Running
calorie total
• % of
opportunities
used
• Sodas/
week
• Meals off-
plan/week
• Avg cal/day
Etc...
Measures let us
• Monitor progress in
improving the system
• Identify effective
changes
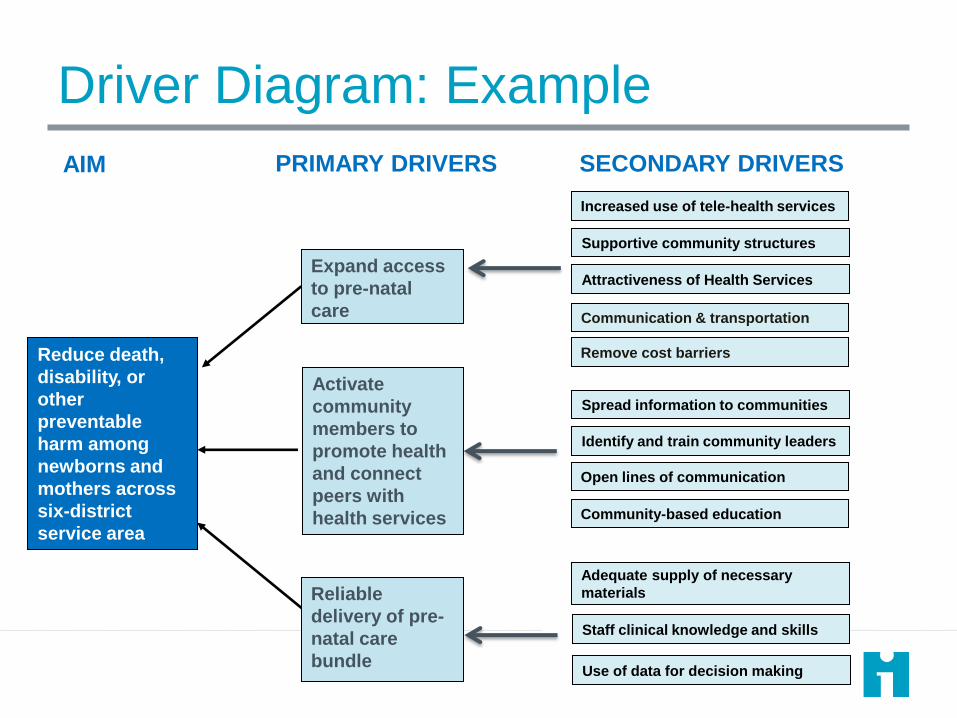
PRIMARY DRIVERS SECONDARY DRIVERS AIM
Increased use of tele-health services
Reduce death,
disability, or
other
preventable
harm among
newborns and
mothers across
six-district
service area
Staff clinical knowledge and skills
Adequate supply of necessary
materials
Use of data for decision making
Expand access
to pre-natal
care
Activate
community
members to
promote health
and connect
peers with
health services
Reliable
delivery of pre-
natal care
bundle
Supportive community structures
Attractiveness of Health Services
Communication & transportation
Remove cost barriers
Spread information to communities
Identify and train community leaders
Open lines of communication
Community-based education
Driver Diagram: Example
Always Understand and Plan for
“Anti-Drivers”
Always Anticipate and Monitor
Unintended Consequences