engine chicken evaluation report...we learned that engine’s household poultry farming project ,...
TRANSCRIPT
Evaluation and Key Lessons on Smallholder Farmers’ Improved Chicken
Supply Chain and Backyard /Local Chicken Performance
By: Green Fact Trading and Consultancy Private Limited Company
June 2018
Addis Ababa, Ethiopia

1
Table of contents
I. Executive Summary ........................................................................................................................ 2
II. Introduction ..................................................................................................................................... 3
2.2. Objectives of the Evaluation ........................................................................................................ 4
III. Methodology ................................................................................................................................... 5
3.1 Research Design ...................................................................................................................... 5
3.2 Sampling Method .................................................................................................................... 5
3.3 Methods of Data Collection .................................................................................................... 6
3.3.1 Survey ................................................................................................................................. 6
3.3.2 Key informant interview ..................................................................................................... 6
3.3.3 Focus group discussions ...................................................................................................... 6
3.3.4 Case studies ......................................................................................................................... 6
3.4 Data analysis and interpretation .............................................................................................. 7
IV. Findings of the Evaluation .......................................................................................................... 7
4.1. Household Characteristics............................................................................................................ 7
4.2. Improved Chicken Distribution Package ..................................................................................... 8
4.3 Husbandry and Management ........................................................................................................ 9
4.4 Health and Bio-security .............................................................................................................. 11
4.5 Extension Service and Technical Support .................................................................................. 12
4.6 Production and Productivity of the Chicken farming ................................................................. 14
4.7 Consumption and income benefits from the improved chicken farming .............................. 16
4.7.1 Nutritional Benefits: Consumption of egg and chicken meat .............................................. 16
4.7.2 Income................................................................................................................................... 17
4.8 Sustainability of the Improved Chicken Support .................................................................. 18
4.9 Challenges of Improved Poultry Production ......................................................................... 20
V Discussion on the Findings ........................................................................................................... 23
VI Conclusion .................................................................................................................................... 26
VII Recommendations ......................................................................................................................... 27
Suggested Scheme ............................................................................................................................ 28
VIII. References ..................................................................................................................................... 28
IX. Annex (Assessment tools) ......................................................................................................... 30

2
I. Executive Summary
Feed the Future Ethiopia Growth through Nutrition Activity, as part of learning from its
forerunner project ENGINE, hired consultants to undertake an assessment on the performance
of ENGINE’s Backyard Improved/Local Chicken Performance, implemented by smallholder
farmers in four regional states. The study used both quantitative and qualitative data. A total of
253 households were selected through convenient sampling from twelve intervention woredas
of the four regions and interviews using structured questions. Focus group discussions (FGD)
and key informant interview (KII), case studies and observation were also conducted to validate
the findings of the assessment. The findings of the assessment showed that 71 percent of
chicken management is conducted by women. Out of the 253 households interviewed, 71
percent of the respondents are engaged in agriculture with work experience between 4 and 9
years. The study indicated that chicken distribution package (chicken, formulated feed,
vaccination, housing and training) was not 100 percent complete and uniform in distribution to
target households. Among respondents interviewed, 99% received training on improved
chicken management. Once ENGINE distributed feed was completed, 99 percent of the
households practiced feed supplementation in the form of formulated feed (70%) and grain
(74). Though it was not regular and uniform in the regions, 84 percent of the respondents got
their chickens vaccinated at least once after receiving the chickens. Similarly, 86 percent of the
respondents have a fenced chicken house and restrict visitors from accessing their farms.
However, abandoning litters and dead chickens in the surrounding was practiced by 65 percent
of the respondents. Reception of extension service at least one time reported by 83 percent of
the respondents. To sustain improved chicken farming, natural hatching using broody local hen
practiced by 70 percent of the respondents. It was reported by 82 percent of the respondents
that disease is the major constraint for improved chicken farming. Out of total respondents,
currently, 45 percent in Tigray, 34 percent in Oromia, 33 percent in Amhara and 3 percent in
SNNP still keep chicken of Koekoek breed. 96 and 73 percent of the respondents respectively
replied consuming egg and chicken meat. Income up to 2,386 Birr per target farmers was
reported earned during the project period. A total of 155 farmers adopted improved chicken
farming from the ENGINE target households as the result of diffusion. In conclusion, target
households improved their consumption and earned economic benefits from the distributed
chicken and the intervention has played important role in disseminating technology appropriate
to farmers. We conclude that farmers targeted by the project have the capacity to keep improved

3
chicken provided that the intervention is supported with extension service on feeding and
veterinary service.
II. Introduction
To further substantiate the benefits of the improved chicken farming to the target households
and to foster learning from previous ENGINE’s work, Land O’Lakes International
Development, the technical lead of Growth through Nutrition activity, has hired a consultant
firm to “Evaluate and draw key Lessons on Improved chicken supply chain and backyard
improved chicken performance at smallholder farmers’ management”. Accordingly, we
undertook a comprehensive study compiled this report.
Family poultry production, which encompasses both extensive and small-scale intensive
management systems, is practiced by most households in low-income food-deficit countries.
Despite low production levels and potentially high losses due to disease, predation and theft,
scavenging systems offer the advantage of requiring minimal land, labour and capital inputs.
Human under nutrition remains a major public health challenge globally, contributing to over
three million preventable maternal and child deaths each year. Animal source foods, including
poultry (meat and organs) and eggs, provide high-quality protein and micronutrients in bio
available forms which, even in small quantities, substantially increase the nutrient adequacy of
traditional diets based on staple crops. Women are recognized as key players in family poultry
production systems and successful engagement with this sector should incorporate gender-
sensitive approaches. Agricultural interventions which target women are more likely to lead to
positive nutritional outcomes without compromising their time for child care practices. A
multi-disciplinary research approach, multi-sectoral involvement within government
institutions and the implementation of policies which target smallholder farmers is needed to
maximize the potential impact of improvements to family poultry systems on food and
nutritional security.
According to the information obtained from the ENGINE office, key informants and
participants of focus group discussions, ENGINE distributed 15,200 chickens to 1080 poor
households in 2012-2015, in the four selected regional states; Amhara, Tigray, Oromia and
SNNP regional states. The households have been selected based on their extreme poverty level
and exposure to nutritional deficiency. ENGINE provide the households with a two-day
comprehensive and “hands-on” training on chicken management. ENGINE also contributed

4
industrial materials for chicken house construction, while the beneficiaries contributed labour
and local materials to construct compartmentalized chicken houses. ENGINE distributed the
Koekoek breed, which is adaptable to sub-standard management conditions, disease and is self-
reproducible. The chickens were vaccinated prior to distribution. ENGINE equipped
households with formulated feed sufficient until the pullets start laying eggs. To ensure post
distribution health management, like vaccination and medical treatments services, the
households were linked to local public veterinary health centres. The number of distributed
chicken per target households varies between the regions based on the package size established
by the respective regions. Each household in all regions, except Amhara, received 12 chickens;
2 cocks and 10 pullets. In Amhara, each HH received 17 heads of chicken, 2 cocks and 15
pullets.
We learned that ENGINE’s household poultry farming project, have created positive outcomes
in improving dietary diversity of the target farmers. However, the above-mentioned package-
base chicken distribution was not assured of scalability as it is appealed to be resource
intensive. Target farmers participating in the improved chicken farming were constrained by
inadequate supply and access to crucial inputs of technical know-how, feed and healthcare
access and/or, affordability of inputs.
2.2. Objectives of the Evaluation
1. To evaluate the effectiveness of the project through investigating how many of the
ENGINE chicken recipient small holder farmers have sustained improved backyard
chicken beyond project life and/or upscale or replicated beyond their family use and its
contribution to nutrition and economic benefits to the target farmers?
2. To assess the sustainability through investigating which specific activities could ensure the
continuity or discontinuity of backyard improved chicken farming activities in the project
area.
3. To evaluate the efficiency of the project by identifying and determining cost implications
for scaling up ENGINE/other agencies chicken supply and distribution to small holder
farmers.
4. To assess whether there are exemplary experiences through checking the evidence for the
presence of other agencies who supply improved chicken and backyard chicken farming
support that have sustained beyond project life and/or copied, scaled up or replicated
beyond the immediate project area?

5
5. To assess the impacts of the project on social, cultural, economic, environmental, and
policy environment that enable or hinder sustained improved chicken supply to and
farming by smallholder farmers? And make recommendation for the project to consider?
6. To draw important lesson learned and forward recommendation for the future on improved
chicken supply and farming by smallholder farmers and define key strategic options for
exit strategy, replication, scaling up and sustainability.
III. Methodology
3.1 Research Design
The study employed both quantitative and qualitative research and employed data collection
methods, such as questioner survey, key informant interview (KII), focus group discussion
(FGD), observation and case studies. Apart from primary information obtained through these
data collection methods, the study consulted secondary sources such as preliminary/progress
reports of the project and published documents of similar interventions by different
organizations.
3.2 Sampling Method
The study population is comprised of project target farmers and agricultural experts selected
from woredas of Tigray, Amhara, Oromia and Southern Nations and Nationalities Peoples
(SNNP) Regional states.
In the four regional states, ENGINE provided improved chicken support for 1081 target
farmers. For this study, it has been planned to take a sample of 25% (270) households based
on convenient sampling (non-probability sampling) in consultation with ENGINE officials. As
the number of target farmers included in the project is different across every region, the total
number of sample households has been assigned proportionally to each region. The target
woredas accommodating the proportional sample size of households in every region were
selected based on purposive or convenient sampling method in consultation with Growth
through Nutrition project staffs. Accordingly, the selected study woredas were Edamehoni and
Tahtay Adiabo (Tigray Region), Dejen, Wonberima, Alefa, Dangila and DebubAchefer
(Amhara Region), Ada’a, JimmaGeneti and Ambo (Oromia Region), and Wondo Genet and
MerabAzernetBerbere (SNNP Region). Finally, all target farmers (270 Households), in these
selected woreda were designed to be included in the study. Accordingly, the lists of all targeted

6
farmers were prepared and from the list of households in the respective sampled woredas 253
were found and interviewed while the rest 17 were not found at time of the interview.
Additionally, four key informant interviews, three focus group discussions, three case studies
and observation of brooding and hatching facilities in Oromia and Amhara Regions, have been
conducted.
3.3 Methods of Data Collection
3.3.1 Survey
Semi-structured questionnaire was prepared, pretested and data were gathered from a total of
253 households by ten trained enumerators. The collected data were focusing on issues related
to ENGINE project chicken support supply such as package of the chicken supply, adoption of
the chicken technology, methods of chicken husbandry and management, extension service and
technical support provided by relevant stakeholders, benefits of the chicken support, and
challenges which the targeted farmers were facing.
3.3.2 Key informant interview
Separate interviews were held, in 2 woredas, with 4 agricultural office experts (2 experts from
Merab Azernet woreda and the other 2 from Ada’a woreda) who have been involved and have
better knowledge on the activities of ENGINE poultry project. The interview focused on
questions that helped to elicit how the chicken support activity was carried out and
benchmarking experiences of other agencies’ improved chicken support supply.
3.3.3 Focus group discussions
A total of 4 focus group discussions were conducted with ENGINE chicken support target
farmers. Of which 2 were conducted at Merab Azernet woreda while the other 2 were at Ada’a
woredas. FGD participants were free and confident to express their opinions. In doing so the
first two groups were entirely women and the other two groups were a mixture of woman and
men participants. The main agendas of discussion in both cases are attached with this report.
3.3.4 Case studies
Successful households were identified based on referral from other members of the chicken
group being successful in chicken farming from the project support. Instances of success are
included in this report.

7
3.4 Data analysis and interpretation
Since the study has employed convenient sampling, the research method applied in this study
is descriptive research. The data collected through different methods were organized into
different categories in accordance with specific objectives of the study. The data collected
through the semi-structured questioner, were entered into computer database and analysed
using Statistical Packages for Social Sciences (SPSS). Descriptive statistic such as percentage,
frequency and mean were processed and interpreted. Data explored through other sources, KII,
FGD, case study and observation) have been organized into major and sub-themes and
appropriate narrations have been made to interpret the information.
IV. Findings of the Evaluation
4.1. Household Characteristics
Most of the respondents were female and fall in young-adult age category. None of the
respondent households had infants less than two years old. Agriculture was the mainstay of the
respondents as reported by 71 percent of the interviewed households. Casual labour in Oromia
and SNNP was found to be 40 and 28 percent respectively. Compared to 2015 national average
adult literacy rate of Ethiopia, the reported illiteracy rate of 68 in Amhara and 71 in Oromia
was found to be high. A high illiteracy rate hinders improved chicken farming as a business
and partly affects sustained chicken farming. Therefore, the chicken management training
needs to focus on adult literacy trainings besides the technical training. Chicken farming
experience ranges between four and nine years as reported by the respondents. Out of the total
respondents, on average 73 percent were married, 11 percent are divorced and widowed
respectively, while six percent are single with observable variation among the regions (Table
1).
Table1.Household Characteristics, by Region
Household Characteristics Total Region
Tigray Amhara Oromia SNNP
Sex of the respondent (%)
Male 1.0 0.0 2.7 0.0 0.0
Female 99.0 100 97.3 100 100

8
Age of the respondent (Mean) 31 29 34 31 31
Household size by age (Mean)
< 2 years old 0.0 0.0 0.0 0.0 0.0 2 - 5 years old 1.0 1.0 0.0 1.0 1.0
5 - 15 years old 2.0 1.0 2.0 2.0 3.0 15 - 49years old 2.0 2.0 2.0 2.0 2.0 > 49 years old 0.0 0.0 0.0 0.0 0.0
Main job of the respondent (%)
Farming 71 84.2 82.9 46.2 69.2
Petty trade 10 13.2 11.7 13.8 2.6
Casual labour 19 2.6 5.4 40.0 28.2
Education status of the respondent (%)
Illiterate 61.2 42.1 68.5 70.8 43.6 Read and write 4.0 2.6 2.7 1.5 12.8 Elementary school 29.6 44.7 21.6 26.2 43.6
Secondary school 5.1 10.5 7.2 1.5 0.0
Chicken farming experience (Mean, years) 7.0 7.0 9.0 4.0 9.0
Marital status (%)
Married 73 57.9 63.1 90.8 79.5 Divorced 11 34.2 5.4 3.1 0.0 Single 6.0 5.3 13.5 1.5 2.6 Widow/widower 11 2.6 18.0 4.6 17.9
4.2. Improved Chicken Distribution Package
The study indicated that chicken distribution package was not 100 percent complete and
uniform in terms of distribution among the targeted households. Poultry feed distribution
appropriates the highest rate, (97%) of the targeted farmers, while veterinary package covers
the least (37%) of the beneficiaries, as indicated in Table 2 below. All chicken had received
vaccination prior to the distribution, but target households perceived that veterinary service
was inadequately included in a package. This is justifiable by the chicken sickness and death
they have encountered. The result of the study also shows that all the poultry farming package
components were not distributed uniformly among the chicken recipient households and
feeding through is the least distributed one covering only 65% of the targeted farmers. Hence,
future programs should consider full package chicken distribution, particularly the post
distribution veterinary service, which requires robust action and commitment from the existing
livestock extension service.
Table 2. The package of chicken supplied to respondents, by Region (%)

9
Region Feed Housing Veterinary service Feeders Drinkers Training
Tigray 92.1 100.0 47.4 0.0 0.0 97.4
Amhara 97.3 99.1 42.3 75.7 99.1 85.6
Oromia 100.0 86.2 20.0 69.2 95.4 70.8
SNNP 94.9 76.9 43.6 89.7 97.4 76.9
Total 96.8 92.5 37.5 64.8 83.0 82.2
Percentage values across each region is greater than 100, multi-response variable
Respondents reported that comprehensive chicken management training was provided prior to
chicken distribution. The finding shows that improved poultry management was covered well
in the training, as reported by 93 percent of the respondents. The least covered topic was
financial management (55%). As financial and adult literacy are crucial for chicken farming as
a business and key to sustaining improved chicken farming, they require due attention both
prior and post project initiation.
Table 3. Topics of training for improved chicken production, by Region
Region
The number of respondents who
have mentioned at least one topic of
training
Topics of training on improved chicken production (N, %)
Improved chicken management
Health Feeds and
feeding Financial
management
Tigray 37 28 (75.7) 36 (97.3) 31 (83.8) 32 (86.5)
Amhara 110 109 (99.1) 101 (91.8) 84 (76.4) 83 (75.5)
Oromia 65 61 (93.8) 31 (47.7) 56 (86.2) 10 (15.4)
SNNP 38 35 (92.1) 29 (76.3) 33 (86.8) 13 (34.2)
Total 250 233 (93.0) 197 (78.8) 204 (81.6) 138 (55.2)
4.3 Husbandry and Management
The feeding situations after the close out of ENGINE support is shown in Table 4. The result
of the study shows that households in all regions used to practice supplementary feeding of
improved chicken after the support from ENGINE has stopped. Scavenging together with
formulated feed supplementation was practiced by 71 percent of the respondents while
scavenging with grain supplement was practiced by 74 percent of the respondents. One of the
ongoing supervision reports produced by the ENGINE office indicates that around 91 percent
of the farmers prepare formulated feed at their houses2. Scavenging was practiced in Amhara
by only two percent of the respondents. This is a good indication of poor farmers’ interest to
invest in their chickens to get better yields and it demonstrates the success of the project in
promoting simple chicken feed formulation techniques using local feed resource bases.

10
Table 4. Methods of feeding after the feed supplies by the project is stopped
Region
The number of respondents who have mentioned at least one feeding method
Methods of feeing chicken feed (N, %) **
Scavenging supplemented with own
formulation/purchased
Scavenging supplemented with grains
Only scavenging
Tigray 38 34 (89.5) 20 (52.6) 0 (0.0)
Amhara 111 71 (64.0) 105 (94.6) 2 (1.8)
Oromia 65 48 (73.8) 39 (60.0) 0 (0.0)
SNNP 39 26 (66.7) 23 (59.0) 0 (0.0)
Total 253 179 (70.7) 187 (73.9) 2 (0.79)
** Percentage values across each region is greater than 100, multi-response variable
As indicated in Table 5 below, 79 percent of the respondents reported that they assign a
household member responsible to manage the chicken. Women attendants were assigned by 81
percent of the respondents while 12.6 and 6 percent of the target farmers have assigned men
and children respectively. This indicates that the project is mostly successful in getting the
women involved in the poultry farm management. Chicken interventions are opportunities for
women’s empowerment and improved nutrition, as women are the decision makers on what
the family should eat. The time spent in managing the improved chicken on average was 68
minutes per day (Table five below). The work load on women due to the chicken activity is
very minimal that makes chicken intervention again more appropriate to improve nutritional
status of vulnerable households. But awareness and family focused training should be provided
so that any work burden because of household chicken farming should be shared among other
family members so that mothers will have time for other tasks.

11
Table 5. Household members managing the chicken and time spent/day, by Region
Region Assigned a household member responsible to
manage the chicken (N, %)
Household members’ given responsibly to manage the chicken (N, %)
Average time spent for managing the chicken
(minutes/day) Men Women Children
Tigray 35 (92.1) 6 (17.1) 29 (82.9) 0 (0.0) 55
Amhara 82 (73.9) 6 (7.3) 70 (85.4) 6 (7.3) 83
Oromia 50 (76.9) 8 (16.0) 42 (84.0) 0 (0.0) 44
SNNP 32 (82.1) 5 (15.6) 21 (65.6) 6 (18.8) 89
Total 199 (78.7) 25 (12.6) 162 (81.4) 12(6.0) 68
4.4 Health and Bio-security
Vaccination: The vaccination practice and frequency by the respondents is shown in Table 6.
It was reported that 84 percent of the respondents get their chicken vaccinated at least once.
The highest proportion was recorded in Amhara (96%) and the lowest in Tigray (63%).
Vaccination frequency of 1 to 2 times was practiced by 49 percent of the respondents while 3-
4 times chicken vaccination reception was reported by 24 percent of the respondents.
Vaccinations of more than four times were practiced only by 11 percent of the respondents, in
Tigray and Amhara Regions. Given the duration that the chickens were reared, the reported
chicken vaccination frequency is very low. Therefore, future chicken distribution should be
implemented based on the standard chicken vaccination program advised by the national
Veterinary Institute (NVI) and the woreda livestock and fishery offices need to be given due
emphasis in the advancement of the provision vaccination services.
Table 6. The vaccination status of chicken after the delivery to participant farmers, by Region
Region Vaccination provided for
their chicken (N, %) Frequency of vaccination provided (N, %)
1 - 2 times 3 - 4 times 4 - 5 times More than five times Tigray 24 (63.2) 15 (65.2) 6 (26.1) 2 (8.7) 0 (0.0)
Amhara 107 (96.4) 43 (41.4) 41 (39.4) 16 (15.4) 4 (3.8)
Oromia 47 (72.3) 44 (93.6) 3(6.4) 0 (0.0) 0 (0.0)
SNNP 35 (89.7) 21 (63.6) 12 (36.4) 0 (0.0) 0 (0.0)
Total 213 (84.2) 123 (48.6) 62 (24.5) 18 (7.1) 4 (1.58)
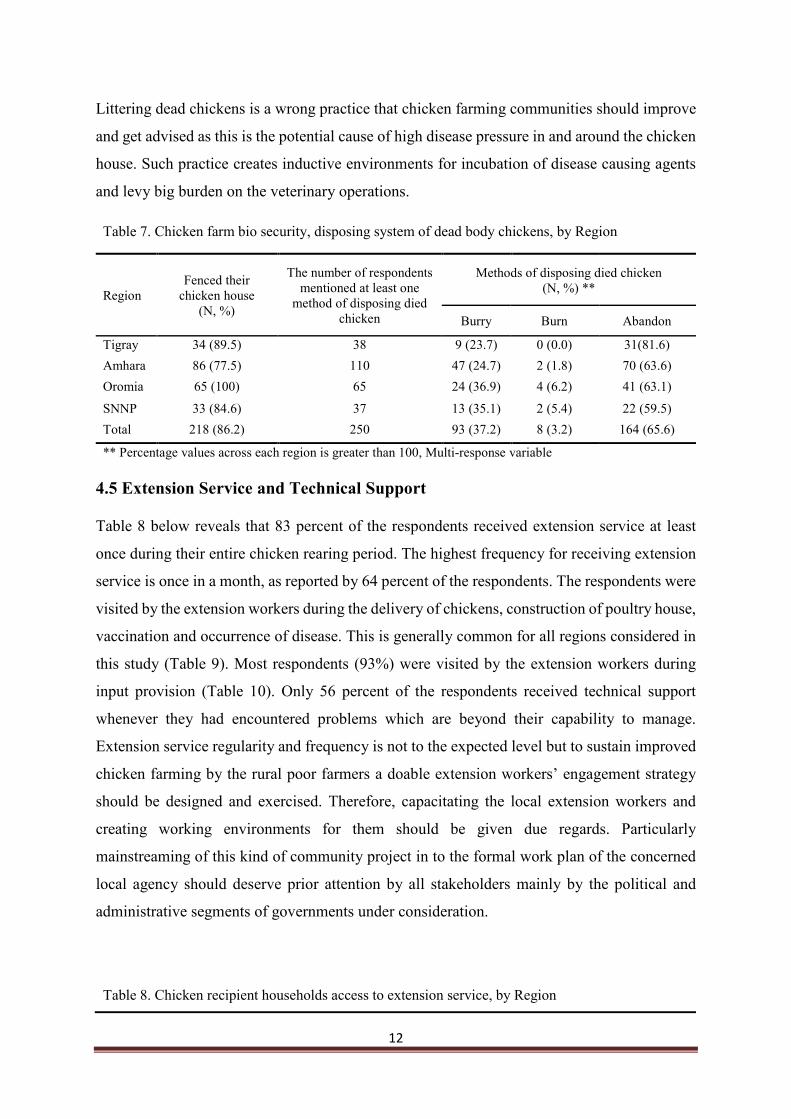
Farm bio-security: Most of the respondents, (86%), have fenced and restricted visitors and
intruders from accessing into their poultry farm yards and tried to avoid contacts with
excrement. However, 67 percent of the respondents littered the dead chicken and 37 percent of
the respondents buried while only 3.2 percent of them have incinerated (Table 7 below).
12
Littering dead chickens is a wrong practice that chicken farming communities should improve
and get advised as this is the potential cause of high disease pressure in and around the chicken
house. Such practice creates inductive environments for incubation of disease causing agents
and levy big burden on the veterinary operations.
Table 7. Chicken farm bio security, disposing system of dead body chickens, by Region
Region Fenced their
chicken house (N, %)
The number of respondents mentioned at least one
method of disposing died chicken
Methods of disposing died chicken (N, %) **
Burry Burn Abandon
Tigray 34 (89.5) 38 9 (23.7) 0 (0.0) 31(81.6) Amhara 86 (77.5) 110 47 (24.7) 2 (1.8) 70 (63.6) Oromia 65 (100) 65 24 (36.9) 4 (6.2) 41 (63.1)
SNNP 33 (84.6) 37 13 (35.1) 2 (5.4) 22 (59.5) Total 218 (86.2) 250 93 (37.2) 8 (3.2) 164 (65.6)
** Percentage values across each region is greater than 100, Multi-response variable
4.5 Extension Service and Technical Support
Table 8 below reveals that 83 percent of the respondents received extension service at least
once during their entire chicken rearing period. The highest frequency for receiving extension
service is once in a month, as reported by 64 percent of the respondents. The respondents were
visited by the extension workers during the delivery of chickens, construction of poultry house,
vaccination and occurrence of disease. This is generally common for all regions considered in
this study (Table 9). Most respondents (93%) were visited by the extension workers during
input provision (Table 10). Only 56 percent of the respondents received technical support
whenever they had encountered problems which are beyond their capability to manage.
Extension service regularity and frequency is not to the expected level but to sustain improved
chicken farming by the rural poor farmers a doable extension workers’ engagement strategy
should be designed and exercised. Therefore, capacitating the local extension workers and
creating working environments for them should be given due regards. Particularly
mainstreaming of this kind of community project in to the formal work plan of the concerned
local agency should deserve prior attention by all stakeholders mainly by the political and
administrative segments of governments under consideration.
Table 8. Chicken recipient households access to extension service, by Region

13
Region Respondents
received extension service (N, %)
Frequency of access to the extension service (N, %)
Once in a year
Once in a month
Twice in a week
Once in a Week
Once in 3 months
Twice in a month
Tigray 26 (68.4) 0 (0.0) 18 (69.2) 3 (11.5) 2 (7.7) 1 (3.8) 2 (7.7)
Amhara 108 (97.3) 0 (0.0) 68 (63.0) 5 (4.6) 19 (17.6) 16 (14.8) 0 (0.0)
Oromia 39 (60.0) 1 (2.6) 32 (82.1) 2 (5.1) 0 (0.0) 4 (10.3) 0 (0.0)
SNNP 37 (94.9) 2 (5.4) 17 (45.9) 2 (5.4) 1 (2.7) 15 (40.5) 0 (0.0)
Total 210 (83.0) 3 (1.4) 135 (64.3) 12 (5.7) 22 (10.5) 36 (17.1) 2 (1.0)
Table 9. Conditions of chicken recipient household extension service reception, by Region
Region
The number of
respondents who have
mentioned at least one
aspect
The time when the target household received extension service (N, %) **
During house
construction
During input
provision
During vaccination
Whenever disease occurs
During credit
collection
Up on request
Tigray 26 4 (15.4) 13 (50) 23 (88.5) 22 (84.6) 1 (3.8) 11 (42.3)
Amhara 108 68 (63.0) 59 (54.6) 62 (57.4) 87 (80.6) 28 (25.9) 26 (24.1)
Oromia 39 30 (76.9) 3 (7.7) 15 (38.5) 11 (28.2) 2 (5.1) 1 (2.6)
SNNP 37 31 (83.8) 26 (70.3) 28 (75.7) 21 (56.8) 0 (0.0) 14 (37.8)
Total 210 133 (63.3) 101 (48.1) 128 (61.0) 141 (67.1) 31 (14.8) 52 (24.8)
** Percentage values across each region is greater than 100, multi-response variable
Table 10. The time when the farmers visit extension workers
The time when farmers visit extension workers Responses
Percent of cases ** N Percent
Planning to start chicken farming 64 25.5 50.8
During input provision 117 46.6 92.9
Any time when there is technical problem 70 27.9 55.6 Total 251 100.0 199.3
** Multiple response variables. 126 out of 253 respondents answered the question the percentage is calculated accordingly
As shown in Table 11 below, 88 percent of the respondents need technical support on chicken
housing seconded by chicken health and management as reported by 73 percent of the
respondents. As indicated in Table 11 below poultry housing, health, feed preparation and
management are the technical gaps felt by the respondents.
Table 11. Areas in which target farmers need technical support, by Region

14
Region
The number of respondents who
have mentioned at least one technical
support
Areas that farmers need technical support (N, %) **
Chicken health
Chicken feeds
Chicken Management
Chicken egg/meat consumption
Chicken marketing
Chicken housing
Tigray 38 36 (94.7) 20 (52.6) 35 (92.1) 3 (7.9) 2 (5.3) 14 (36.8)
Amhara 109 97 (89.0) 84 (77.1) 72 (66.1) 37 (33.9) 52 (47.7) 59 (54.1)
Oromia 63 23 (36.5) 19 (30.2) 46 (73.0) 5 (7.9) 1 (1.6) 1 (1.6)
SNNP 28 18 (64.3) 18 (64.3) 20 (71.4) 2 (7.1) 3 (10.7) 14 (50.0)
Total 238 174 (73.1) 141 (59.2) 173 (72.7) 47 (19.7) 58 (24.4) 88 (37.0)
** Percentage values across each region is greater than 100, multi-response variable
In this study, farmers’ knowledge of where to access crucial inputs after project closure was
assessed. 91percent of the respondents know where to get veterinary service while 61 percent
of them know where to buy poultry feed. Respondents know where to buy the chicken breed is
the lowest one, or 38 percent of the total target farmers. Therefore, engaging private sectors in
poultry feed supply, provision of veterinary service, availing improved chicken should receive
due attention both during the planning and implementation phase of this kinds of community
targeting projects.
Figure 1. Chicken recipient households’ level of information on where to get crucial inputs, by region
4.6 Production and Productivity of the Chicken farming
Age at first egg laying and hatching performance, taken as indicator of overall performance of
the improved chicken farming of ENGINE, is presented in Table 12 and Figure 2 below. The
38.3
97.4
31.5
13.8
41.0
90.197.4
86.593.8
87.2
61.3
100.0
70.3
32.3
46.250.2
5.3
36.9
92.3
61.5
0.010.020.030.040.050.060.070.080.090.0
100.0
Total Tigray Amhara Oromia SNNP
Know where to buy improved chicken breed
Know where to buy veterinary supplies
Know where to buy feed

15
result of the study shows that more than 75 percent of the respondents in Tigray, Oromia and
SNNP have hatched eggs from improved chicken they have received from ENGINE, using
local broody hens while 54 percent of the farmers in Amhara regional state did so. Since the
target farmers were using local broody hens, they could set about 9-12 eggs at a time.
Respondents in all regions set eggs at least twice in a year. The hatchability was more than 70
percent which is comparable to the reported Koekoek breed reproductive parameters of 78
percent hatchability, as reported in the farms of DZARC and South African ARC- Animal
Production Institute (2010). In SNNP Region the hatchability performance was only 58%
which is by far below as compared to the other regions.
According to the result of the study, the pullets distributed to the target farmers started laying
eggs as early as 205 days and as late as 246 days since incubation (Figure 2). It indicates that
there is a considerable delayed in egg laying performance. The data is subject to recalling bias
by farmers since they do not keep record. Therefore, it should be taken with precautions.
Commonly with the Koekoek breed the first egg laying starts 165 days since incubation with
proper management, as reported by DZARC.
Table 12. Hatching and hatching performance, by Region
Region Hatch chicks using local broody hen
(N, %)
Average frequency of eggs
setting/year
Average number eggs set at a time
Average number chicks hatched at a
time
Hatchability (%)
Tigray 29 (76.3) 3 13 9 73.6
Amhara 60 (54.1) 2 13 10 77.0
Oromia 50 (76.9) 2 12 9 73.5
SNNP 29 (74.4) 2 9 5 58.1

16
4.7 Consumption and income benefits from the improved chicken farming
4.7.1 Nutritional Benefits: Consumption of egg and chicken meat
According to Table 13 below, consumption of poultry meat and eggs is common in all regions
of the study. In Tigray, chicken meat consumption is more common (95%) than egg
consumption (92%). In the rest of regions, egg consumption is more common than chicken
meat consumption (table 13). Generally, 96 percent of the respondents have enjoyed the
consumption of eggs. This has also been confirmed from the internal document of
ENGINE2regarding consumption of chicken eggs, children under 5, between 5 - 15 years old
and pregnant women were given priority. However, most households provide chicken meat to
all household members without any distinction (Table 14 and Table 15).
Table 13. Egg and chicken meat consumption, by Region
Region Egg consumption (N, %) Chicken meat consumption (N, %)
Tigray 35 (92.1) 36 (94.7)
Amhara 104(93.7) 91(82.0)
Oromia 65 (100.0) 28 (43.1)
SNNP 39 (100.0) 30 (76.9)
Total 243 (96.0) 185 (73.0)
TigrayAmhara
OromiaSNNP
212205
246
217
Figure 2. Age at first egg laying of the distributed chicken in days by Region
Age of the chicken start laying egg (days)

17
Table 14. Priority of egg consumption among household members
Household members given priority to consume egg Responses Percent of
cases ** N Percent Children under five years 171 30.7 70.4 Children aged 5 -15 years 135 24.2 55.6 Pregnant women 71 12.7 29.2 Lactating women 66 11.8 27.2 Father 61 11 25.1 All household members share without any priority 41 7.4 16.9 The rest household members 12 2.2 4.9 Total 557 100 229.3
** Multiple response variables. 243 out of 253 respondents answered the question
Table 15. Priority chicken meat consumption among household members
Household members given priority to consume chicken meat Responses Percent of cases ** N Percent
All household members share without any priority 106 31.8 57.3 Children under five years 53 15.9 28.6 Children aged 5 -15 years 53 15.9 28.6 Father 37 11.1 20 Lactating women 32 9.6 17.3 Pregnant women 28 8.4 15.1 The rest household members 24 7.2 13 Total 333 100 197.9 ** Multiple response variables. 185 out of 253 respondents answered the question
4.7.2 Income
The result of the study shows that participants of the improved chicken project intervention in
all regions have sold chicken and chicken products. Selling eggs, hens and cockerels is
common as compared to selling of chicks and pullets (Table 16).
Table 16. Selling of chicken and chicken products
Types of chicken products/chicken Responses
Percent of cases ** N Percent
Egg 240 41.8 95.2 Hen 135 23.5 53.6 Cock 111 19.3 44.0 Cockerels 43 7.5 17.1 Pullet 39 6.8 15.5 Chicks 6 1.0 2.4 Total 574 100 227.8
** Multiple response variables. 252 out of 253 respondents answered the question

18
The average income obtained by individual participant household (Ethiopian Birr) in all
regions is shown in Table 17. The income represents the income earned during the intervention
period. The highest source of income was sells of eggs followed by sell of hens and young
cocks (cockerels).
Table 17. Average income earned from sell of chicken and chicken products
Sources of Income Average Income ETB) Egg (N=238) 2386.04
Hen (N=135) 755.19
Cock (N=110) 420.82
Pullets (N=37) 493.11
Cockerels (N=40) 579.19
ETB: Ethiopian birr Note: The total income cannot be calculated as not all households sold each of the products listed
The case study also indicated that the chicken support has been contributed for asset building
as the income obtained from the sale were reinvested in the form of other livestock purchase
and eventually contributed to lift-up the most vulnerable households from poverty.
Case example: W/o. Rehina Shekuralh is living in Woger Jinjibel Kebele, Merab Azernet Berbere
Woreda. She was identified as MVHHs and included in ENGINE chicken distribution scheme. She
received 2 cocks 10 pullets aged three months old. She kept the chicken for about 2 years. After 2
years of rearing the chicken, productivity of the chicken decreased, and she decided to sell them out.
She earned 1800 Ethiopian Birr (ETB). From the sales of the chickens. This revenue was reinvested
on purchasing pregnant sheep for breeding purpose. Luckily enough the sheep gave birth to twins.
When the offspring reached to marketable size, again she sold them out and her total capital hiked to
2800 ETB. Adding extra amount of 1000 ETB from her savings, she bought a heifer. As per socio-
economic stratification owning larger domestic cattle like heifer is a sign of economic betterment.
Maintaining such natural trend of economic growth is appreciated but it should not be in the expense
of chicken farming.
4.8 Sustainability of the Improved Chicken Support
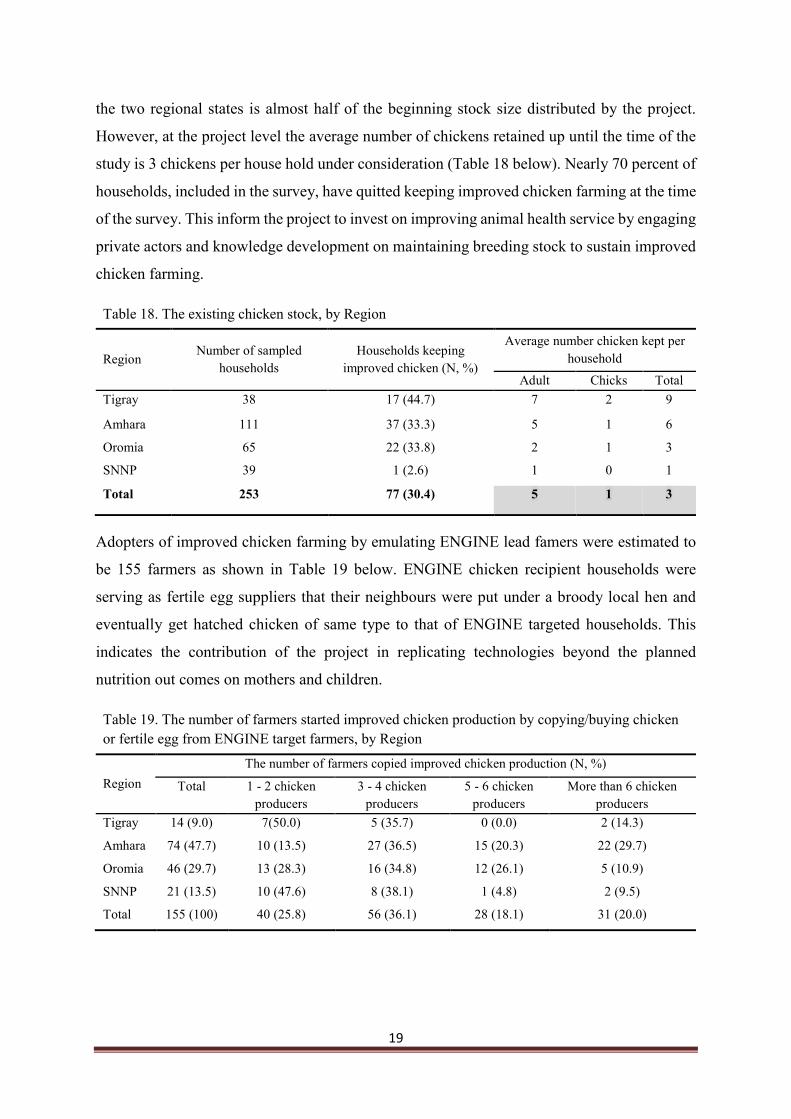
The current holding status of improved chicken by the target farmers is presented in Table 18
below. The proportion of households who are keeping improved chicken out of the total sample
was highest in Tigray (45%), followed by Oromia (34%) and Amhara (33%) and the least in
SNNP (3%). The highest flock size of nine chickens per household followed by six heads of
birds is reported in Tigray and Amhara regions respectively. The current chicken flock size in
19
the two regional states is almost half of the beginning stock size distributed by the project.
However, at the project level the average number of chickens retained up until the time of the
study is 3 chickens per house hold under consideration (Table 18 below). Nearly 70 percent of
households, included in the survey, have quitted keeping improved chicken farming at the time
of the survey. This inform the project to invest on improving animal health service by engaging
private actors and knowledge development on maintaining breeding stock to sustain improved
chicken farming.
Table 18. The existing chicken stock, by Region
Region Number of sampled
households Households keeping
improved chicken (N, %)
Average number chicken kept per household
Adult Chicks Total Tigray 38 17 (44.7) 7 2 9
Amhara 111 37 (33.3) 5 1 6
Oromia 65 22 (33.8) 2 1 3
SNNP 39 1 (2.6) 1 0 1
Total 253 77 (30.4) 5 1 3
Adopters of improved chicken farming by emulating ENGINE lead famers were estimated to
be 155 farmers as shown in Table 19 below. ENGINE chicken recipient households were
serving as fertile egg suppliers that their neighbours were put under a broody local hen and
eventually get hatched chicken of same type to that of ENGINE targeted households. This
indicates the contribution of the project in replicating technologies beyond the planned
nutrition out comes on mothers and children.
Table 19. The number of farmers started improved chicken production by copying/buying chicken or fertile egg from ENGINE target farmers, by Region
Region The number of farmers copied improved chicken production (N, %)
Total 1 - 2 chicken producers
3 - 4 chicken producers
5 - 6 chicken producers
More than 6 chicken producers
Tigray 14 (9.0) 7(50.0) 5 (35.7) 0 (0.0) 2 (14.3)
Amhara 74 (47.7) 10 (13.5) 27 (36.5) 15 (20.3) 22 (29.7)
Oromia 46 (29.7) 13 (28.3) 16 (34.8) 12 (26.1) 5 (10.9)
SNNP 21 (13.5) 10 (47.6) 8 (38.1) 1 (4.8) 2 (9.5)
Total 155 (100) 40 (25.8) 56 (36.1) 28 (18.1) 31 (20.0)

20
4.9 Challenges of Improved Poultry Production
The challenges that hindered respondents from further expanding improved chicken farming
are shown in Table 24 below. The result of the study shows frequent occurrence of disease, as
reported by 82 percent of the respondents, was the main constraint hampering chicken farming
seconded by predation as reported by 24 percent of the respondents. Failure to multiply the
stock and selling out of improved chickens to replace them with other livestock are the third
and fourth main reasons for gradual downsizing and ultimate termination of improved chicken
farming by the target households. Beyond the reported challenges that the chicken recipient
households have encountered, the inadequate extension service have also contributed for the
observed failure as it is substantiated by the KII findings from SNNP (see below).
One of the key informants from office of agriculture in Mierab Azernet woreda of SNNP regional
state has witnessed that the chicken distribution was not fully institutionalized or well mainstreamed
along with the routine development activities of the agricultural office of the woreda, kebele and
village level government structures. Unless paid or participated in the project in different forms,
experts see the project chicken work as “project business”. Earlier said key informant was the
ENGINE focal person and in the middle of his interview he quoted what people were saying in
Amharic to person in charge of supporting the chicken recipient households when project staff came
to her was “SewocheshMetulsh” which is equivalent to saying “‘your people are coming.” Again, as
conformed by the KII respondent frequent occurrence of disease was found to be the main reason for
farmers to stop keeping improved chicken farming.
Table 24. Reasons for stopping improved chicken production, by Region
Region Reasons for stopping improved chicken production (N, %) **

21
The number of respondents mentioned at least one reason
Failure to multiply the breed at hand
Shortage of knowledge
Insufficiency of extension support
Frequent occurrence of disease
Frequent predator attack
Sold & changed to other livestock
Tigray 21 1 (4.8) 1 (4.8) 0 (0.0) 15 (71.4) 6 (28.6) 0 (0.0)
Amhara 74 11 (14.9) 11 (14.9) 7 (9.5) 65 (87.8) 17 (23.0) 2 (2.7)
Oromia 43 0 (0.0) 3 (7.0) 2 (4.7) 43 (100.0) 1 (2.3) 0 (0.0)
SNNP 38 8 (21.1) 2 (5.3) 8 (21.1) 22.(57.9) 19 (50.0) 14 (36.8)
Total 176 20 (11.4) 17 (9.7) 17 (9.7) 145 (82.4) 43 (24.4) 16 (9.1)
** Percentage values across each region is greater than 100, multi-response variable
Further, the other challenges of the improved chicken production at farmers’ household level,
as reported by the respondents, is the ever-growing hike in the price of poultry farm inputs as
outlined in Table 25 below. Improved chicken breed followed by commercial chicken feed is
the first highest ranked inputs. Housing seconded by medication are the third and fourth costly
inputs reported by the respondents, but vaccination of chicken were the least costly but the
most non-available input. This indicate that preventable diseases of chicken that was reported
as the major hindrance of improved chicken farming can be prevented by employing proper
chicken vaccination given that there was effective community vaccination program in the
country.
Table 25. Ranking of improved chicken production inputs in the order of their comparative
expensiveness
Type of chicken support inputs Score Rank
Improved chicken breed 178 1
Formulated feed 172 2
Drugs 124 4
Chicken house 167 3
Vaccine 98 5
Poultry feed being one of the most important inputs; the critical season of the shortage of supply
is given in Table 26 below. In all regions of the study, the households have reported that poultry
feed shortage is critical during Ethiopian winter (from June to August). During this season the
will, be critical shortage of grain to support the supply poultry feeds. Therefore, sufficient care
must be taken not in order that the productive age of the layers match to the slack season
mentioned in here.

22
Table 26. Critical seasons of feed shortage by region, by Region lean
Region
The number of respondents who have mentioned at least one season of feed shortage
Seasons of the year when feed shortage is critical (N, %) **
Autumn (September – November) Summer (June - August)
Tigray 8 0 (0.0) 8 (100.0)
Amhara 40 12 (30.0) 39 (97.5)
Oromia 22 8 (36.4) 14 (63.4)
SNNP 25 8 (32.0) 24 (96.0)
Total 95 28 (29.5) 85 (89.5)
** Percentage values across each region is greater than 100, multi-response variable
In this study the perceptions of the farmers towards the distributed chicken breed were assessed
and the result is indicated in Figure 3 below. Above 70 percent of the respondents except in
Oromia which is 54 percent, have indicated that the chicken breed is not adoptable to their local
condition. Farmers believed that the chicken strain they received was not the right type for their
environment. The main reason, according to the response of the farmers, was low disease
resistance of the breed coupled by inadequate quality chicken healthcare service. This farmers’
observation contradicts against the scientific knowledge on the attributes of Koekoek natural
performance at low inputs and high disease pressure. Hence, further investigation must be done
in this area and the future chicken distribution should focus on introducing the breed to the
farmers with full packages and proper consultation with the target farmers.

23
V. Discussion on the Findings
Significant numbers of the respondents in this study are female headed and female head of
household; beyond a manager and caretaker of the chicken they are the principal decision
makers on eggs/live animal sales and/or consumption. This has created an important
opportunity for the project to impact household nutrition and economic betterment. The reason
behind is that women are the custodians of what the family should eat from the poultry
production and manage them properly as compared to their male counterparts. According to
the findings, management of chickens, particularly in village production system, was mainly
left to women.8,9However, the time spent in managing chickens is minimal; otherwise it is an
additional work load and needs to be shared among other family members. Continuous
nutrition education coupled with gender awareness remains instrumental in addressing this
challenge. Otherwise, men will take over the role of women when the chicken flock size is
growing.
We found out that for respondent households who were engaged in on-farm and off-farm
related activities and experienced in agriculture, this activity served as main/or additional
sources of income. Poultry project participants, however, were mainly illiterate, hindering the
70.0
52.6
8.7 3.2
71.177.8
22.2
0.0
77.5 80.2
14.05.8
53.8
97.1
2.9 0.0
74.4
31.034.5 34.5
0.0
10.0
20.0
30.0
40.0
50.0
60.0
70.0
80.0
90.0
100.0
Not disease Resistant Not resistant to badWeather
Require more feed
The chicken do notadapted to our
evironment
Reasons for not adapting to the environment
Figure 3. Farmers observation why the chicken do not adapt to their environment, by Region
Total Tigray Amhara Oromia SNNP

24
transfer of information of published materials that require reading. Therefore, in the
forthcoming program, it is worth mentioning that a well-designed business and adult literacy
training in comprehensive chicken management training should be coherently worked out and
implemented. Visual aids (pictures and small clips) can be more effective in disseminating the
information to the illiterate farmers.
From this study, it was understood that not all package components (feed, vaccination, housing
etc.) were fully supplied or uniformly supplied across the villages. Feed, being the most
important input was delivered almost fully, but post chicken distribution veterinary support in
the form of vaccinations and treatment was inadequately accessed and utilized by the chicken
producers. Eventually, more than half of the target households remained with no chickens.
Hence, post distribution veterinary service access and utilization requires robust planning and
implementation.
Based on the survey findings, the coverage of the training both the topics and content, was
effective. 50% of the respondents received pictorial poultry vaccination program, but the
message from published material for illiterate farmers will not been fully understood unless the
training is combined with continued refreshment training and on-site advise in their backyard
observing the progress against the expected changes.
According to the findings of the study, the respondents adopted the practice of homemade feed
preparation and feeding along with the termination of poultry feed support of ENGINE. This
can serve as evidence as to how far the farmers are committed and willing to invest on their
chicken farming despite the lack of favourable environments.
The findings have shown that vaccinations have been practiced by the project. This is the first
step to protect chickens from being attacked by diseases. However, coverage alone is not
enough unless it is augmented by timely provision using quality vaccine and experienced
person. Proper chicken vaccination protocols against the major chicken diseases in the project
areas should be designed and implemented. The fight towards the establishment of legal and
official community vaccination programs at the national level should be a priority concern to
all those who are involved in this kind of community-based projects. The findings of the study
show that farmers control the movement of visitors/intruders into their farms. However, they
also abandon dead chickens and litter around the farm. This can be one of the reasons for
frequent occurrence of diseases and attracting predators which initially feed on chicken corpses

25
and later move to the live chicken in case of shortage of dead ones. Hence common practices
of bio security measures coupled with controlling the spread of disease causing agents around
the chicken farm yards play an indispensable role toward sustainability.
Active livestock extension service is very important for successful improved chicken
production at farmers’ household level. The findings of the study indicate that the extension
service being provided by the livestock office lacks both regularity and consistency. Woreda
Livestock office experts and Animal production and health development agents (DAs) assigned
at Kebele level visit farmers vary in quality, mainly when they are over-burdeedn like during
the delivery of chickens and other input provision or occasionally during the occurrences of
poultry diseases. It is not only the frequency of extension service, but the quality also matters
for the service seekers.
Farmers’ knowledge on sources of poultry inputs is very important factor in maintaining
improved chicken project in the future without dependency on aid from third party. To this
end, the project should coach private input suppliers and create functional linkage among the
extension agents, backyard chicken producers and private input suppliers.
The ENGINE project should receive acknowledgement and recognition for promoting
adaptable and suitable chicken breed of dual purpose (egg and meat) and self-reproducing
Koekoek breed. In this type of chicken breeding, hatching is crucial to maintain or add up to
their flock. Attempts by the target farmers to hatching were considerably high but with minimal
success rate due to the death of hatched chicken from preventable disease. Again, this heralds
the importance of giving due emphasis on chicken vaccination programming.
The success of the current intervention was revealed by the evidence that the participants or
target farmers used egg and meat from their improved chicken production to supplement the
caloric food. In addition, they have sold poultry products to generate additional income to
answer other needs. They have also developed a good perception and gentility in identifying
most needy members of their family in terms of protein rich diets. In general, the intervention
benefited the households both nutritionally and economically.
The presence of improved chicken, still up to the time of the survey, with those of the
participant, indicates that the type of the breed distributed to the farmers can reproduce itself
and some of the farmers are still successful in multiplying their flock. However, majority of

26
the participants have failed to maintain their stock or at least few of them due to one or more
of the factors identified earlier in this paper and they are left with their squalid poultry houses.
The project assisted the dissemination technology by promoting improved chicken breed and
packages. Beyond the project targets, 155 adopters have tried to copy improved poultry keeping
by learning from those involved in ENGINE intervention. These 155 farmers represent 61% of
the sample. It is expected that other would decide to follow suit and adopt the improved poultry
farming. This would ultimately contribute to support the government’s effort in increasing
poultry productivity at national level through household improved chicken farming.3
In conclusion the challenges identified by participants in this study will be the real challenges
to theses adopters and majority of them may discontinue in some future time to come. Those
target farmers who dropped the Koekoek breed have considered this breed to be as less resistant
to diseases and harsh weather. This is of course quite contrary to the reports about Koekoek in
Ethiopia and elsewhere6. The breed being regarded as best solution to the farmers in Ethiopia
and elsewhere has failed to meet the expectations of non-adopters or drop outs. They might
have not followed the recommendations given with the package.
VI. Conclusion
The result of this study shows that the ENGINE intervention was positive for vulnerable
household farmers. Participants that raised chickens, consumed and sold their products. Even
though only 30 percent of the farmers could manage to retain some of the stocks, the benefit
that was obtained from the sale and consumption was significant. The intervention has played
an important role in disseminating the technology to nearby farmers. Improved chicken
requires better management.
Nevertheless, the package of the intervention was not fully distributed and applied, and farmers
were in shortage of some information regarding the sources of inputs and technical support.
The public extension system could have played an important role if they had had the capacity
and considered the project as part of their routine extension service rather than as a part time
activity. The village poultry system is mainly based on poor performing chicken types that
produce low with minimal or no inputs. The need for more eggs and meat is vital in villages
where an animal product from ruminants is very expensive.

27
This study revealed that farmers have the capacity to keep improved chickens. The proportion
of early adopters can be further expanded given that the pioneer farmers remain successful in
poultry farming.
Delivery of inputs on time and provision of continuous follow up are crucial. The study
revealed that it is not only the availability of inputs and their coverage, but proper
implementation should be in place for the success of an intervention that involve poor farmers.
The exemplary role of other poultry farm developing agents should be closely investigated and
more lessons should be drawn.
During site visiting, possession of land, at least sufficient to undertake poultry farming, was
found to be one of the most important factor in determining the success or failure of the
vulnerable household farmers in maintaining improved chicken farming.
VII. Recommendations
Even though only 30 percent of the farmers have retained the stock so far, this figure is not
to be underestimated. There have been robust follow-ups and continuous supervision by all
concerned bodies coupled with the provision of necessary technical and logistical
assistance, such as vaccination for home based hatched chicks and market availability for
ingredients of formulated feed.
The improved poultry intervention should be continued at a similar level with all
improvements mentioned here in this study and informed by the experiences of other
countries.
The Koekoek strain was the most appropriate dual-purpose chicken available in the
country. The evidence from the study showed a lot should be improved for better outcome.
All challenges faced by the non-adopters should be considered. The recommended size of
chickens per household is 25 Koekoek layer/household along with all necessary packages
(refer suggested Scheme). (N.B: 5 chickens (20%) are expected to die during the brooding
period. The remaining 20 will reach grower stage and 50% of them (males) will be sold out
for meat. The rest, 10 will be kept for egg production. The money from the sale of 10 males
will be used to buy start up feed for laying hens)
Instead of a blanket recommendation, thorough investigation must be carried out to vet
those farmers who consider improved chickens as their priority.

28
Continuous and robust follow up and supervision is a fundamental prerequisite for
successful implementation of this kind of project. Therefore, proper project planning and
strategy of project supervision and evaluation must be included in the initial planning
phase.
Suggested Scheme
1. Breed: Koekoek (dual purpose)
2. Chicken number: 25 Day-old chicks (DOCs)
3. Equipment: Hay box chicken brooder, Drinker and feeder
4. Housing: Night shelter or partial confinement
5. Vaccination: As per the NVI recommendation
6. Training: Tailor made
7. Monitoring: Biweekly
8. Feeding: Formulated feed
9. Data recording: On sell of products and purchase of inputs, hatchability
As Growth through Nutrition is targeting most vulnerable households of the community, any
cost associated with improved chicken support should be covered by the project until they gain
income from the sale of eggs and/or adult chicken. Farmers will be given vaccinated 25-day
old chickens from a known source. Farmers will be provided hay box brooder, drinker and
feeder. They will also be provided formulated feed until the chickens start to lay eggs. Hay box
chicken brooder will be used to keep young chicks during day time and at night. This hay box
has been proven to reduce mortality significantly by protecting chickens from predators and
disease. Important vaccinations will be given. At around 11-16 weeks, close to 50% of the total
flock (roughly 12) will be removed from the flock by selling. This would bring some income
to the household to cover the cost of feed for the remaining flock and make the flock size
manageable. Few cocks will be maintained to produce fertile eggs for future day-old chicken
production. Regular follow up and technical back stopping should be carried out by the
appropriate experts.
VIII. References
1. Aklilu Hailemicheal. 2007. Village Poultry in Ethiopia; Socio-technical analysis and control of HPAI. FAO, Rome, Italy.

29
2. Empowering New Generation to Improve Nutrition and Economic Opportunities (ENGINE) Project 20 July 2015
3. Livestock and Fisheries Research Strategies (2015), Poultry, Fisheries, Apiculture and Sericulture, Ethiopian Institute of Agricultural Research, Addis Ababa Ethiopia.
4. Shapiro, B. I., G. Gebru, S. Desta, A. Negassa, K. Nigussie, G. Aboset, and H. Mechal. 2015. Ethiopian Livestock Master Plan. ILRI project report. Nairobi, Kenya: International Livestock Research Institute (ILRI).
5. Tadelle D., 2003. Phenotypic and genetic characterization of local chicken ecotypes in Ethiopia. PhD Thesis. Humboldt University of Berlin, Germany.
6. Udo, H., Asgedom, A. &Viets, T. 2002. Modelling the impact of interventions in village poultry systems.
7. Wondmeneh, E., Dawud, I., Alemayehu, A., Meskerem, A., Tadios, A. 2012. Enhancing the genetic basis of the Commercial layer industry through introduction and Evaluation of Dual purpose chicken (PotchfstroomKoekeokBrred). Proceedings of the 19th Annual Conference of the Ethiopian Society of Animal Production (ESAP) held in Addis Ababa, Ethiopia, December 15-17, 2011
8. Wondmeneh, E., E H Van Der Waaij, D Tadelle, H M J Udo, Jam Van Arendonk. 2015. Adoption of exotic chicken breeds by rural poultry keepers in Ethiopia. ActaAgriculturaeScandinavica, Section A-Animal Science: 64(4). DOI:10.1080/09064702.2015.1005658.
9. Wondmeneh, E., Van Arendonk, Jam., Van Der Waaij, EH. H, Udo, Tadelle, D. 2015. Comparison of different poultry breeds under station and on- farm conditions in Ethiopia. Livestock Science.183, 72 – 77

30
IX. Annex (Assessment tools)
Survey Questionnaire to Evaluate ENGINE Poultry Intervention in Four Regions of Ethiopia
Instruction Start with greetings in local language. Then explain objective of the study ‘to identify key factors affecting or enabling sustainability of backyard improved chicken farming by smallholder farmers. Hence, to address this objective relevant information is being collected from ENGINE target households in selected weredas of Amhara, Oromiya, Tigray and SNNP regions of Ethiopia.
Date _______________________________ (DD/MM/YYYY) Interviewer’s name ______________________________ Geographic location: Latitude: ________________ Longitude: _________________
1. Demography 1. Respondent’s name: _________________________________ 2. Respondent’s relationship to the household head: 1. Household head 2. Spouse
3. Son/daughter 4. Other (Specify)______________________________ 3. Main job of the respondent (multiple response is possible)
1. Farmer 2. Petty trade 3. Government employee 4. Casual labor 5. Other (Specify) _____
4. Sex of the respondent? 1. Male 2. Female 5. Marital status of the owner/respondent? 1. Married 2. Single 3. Widow/widower 4.
Divorced 6. Age of the respondent _____________ (years) 7. Education status of the respondent? 1. Illiterate 2. Read and write 3. Elementary
school 4. Secondary School 5. Higher education 8. Household size Sex <2 years 2 - 5 years 5 -15 years 15 - 49 year >49 years Male Female Total
II. Adoption of the Technology
9. What type of chicken breed did you receive? 1. Koekoek 2. Lohmann brown 3. ISA brown 4. Bovan Brown 5. White leghorn 6. I do not know
10. Did you have a choice on the chicken type that you received? 1. Yes 2. No 11. Do you know the date you receive the chicken? 1. Yes 2. No 12. If yes for Qn. #11, when did you receive the chicken? ___________________
(DD/MM/YYYY) 13. Did you know your roles and responsibilities when were targeted for chicken support?
1. Yes 2. No

31
14. Was the chicken project you received your priority? 1. Yes 2 No 15. If yes for Qn. # 14, what was the benefit? 1. Consumption 2. Income 3. Employment
4. Other (specify) _______________________________ 16. Do you keep chicken you received and/or get hatched from ENGINE chicken?
1. Yes 2. No 17. If no for Qn. #16, what was the reason for stopping improved chicken? (Multiple
response is possible): 1. Lack of credit access 2. Lack of supply of the breed 3. Lack of knowledge 4. Lack of extension support 5. Lack of market for my products 6. Disease 7. Other (specify) _____
18. If yes for Qn. #16, what is the stock size that you currently have? 1. Cock _______ 2. Hen _______ 3. Pullet _______ 4. Cockerels _______ 5. Chick _______
19. Did you hatch chicks using local broody hen? 1 Yes 2. No 20. If yes for Qn. # 19, how often did you hatch per year (number of hatching per year):
_____ 21. If yes for Qn. # 19, on average how many eggs you put under a broody hen? _____ (# of
eggs) 22. If yes for Qn. # 19, how many hatched chicks you got? _______________ (# of chicken
you got from eggs you put under a broody hen) 23. If yes for Qn. # 19, what was the purpose of hatching? (multiple response is possible) 1.
Sale 2. Own replacement/expansion 3. Other (specify) ________________________ 24. If your answer to question # 16 above is no, when did you stop the chicken farming?
_______ (DD/MM/YYYY) 25. On average, after how long the chicken you received from ENGINE start laying egg?
_____________ (in months)? 26. On average, for how long the chicken you received from ENGINE laid eggs?
____________ (in months)? 27. How many of your hens were laying eggs a month before you stopped poultry farming?
________________ (# of laying hens) 28. What was (is) the average number of egg(s) you were collecting? ________ (# of
eggs/week) 29. Have you encountered high death of chicken after you received from ENGINE? 1. Yes
2. No 30. If yes for Qn. # 29, specify the number of chicken: 1. Diseases ______ 2. Predator
_______ 3. Physical damage __________ 4. Extreme whether _______ 5. Other (specify) __________
31. When has the highest death occurred (multiple response is possible) 1. In the 1st week after reception 2. In the first 1 month after reception 3. In the 1st 3-6 months after reception 4.In the 1st 7-12 months after reception 5. After 12 months of rearing 6. Other (specify)___________________
32. Was the chicken you received from ENGINE resistant to diseases? 1. Yes 2. No 33. If no for Qn. # 32, please precisely explain your observation______________________ 34. During the ENGINE chicken rearing period, on average how many times your chicken
has encountered disease ______________________________________

32
35. Was there a time when chicken of your neighbor was healthy but the chicken you received from ENGINE got sick? 1. Yes 2. No
36. Did you know anyone who started chicken production copying/buy chicken or fertile egg from you? 1. Yes 2. No
37. If yes, tell the number of HHs who operates chicken farming by purchasing chicken or fertile egg from you? _________________________
III. Type of the Package
38. How long is your chicken farming experience? _________________ (in years) 39. Do you think your environment is suitable for chicken improved chicken raising? 1. Yes 2. No 3. I don’t know 40. If yes for Qn. # 39, please precisely explain why________________________________ 41. If no for Qn. # 39, please precisely explain why? _______________________________ 42. During ENGINE chicken distribution, what was the support along with the improved
chicken that you received consisting of? (multiple response is possible) 1. Feed 2. Vaccinated chicken 3. Veterinary service 4. Housing 5. Feeders 6. Drinkers 7. Training 8. Other (specify) ________________________
43. Did you know where to buy feed for your chicken? 1. Yes 2. No 44. Did you know where to buy improved chicken breed? 1. Yes 2. No 45. Did you know where to buy veterinary supplies for your chicken? 1. Yes 2. No 46. Did you know where to buy feed for your chicken? 1. Yes 2. No 47. Did you receive pictorial/tailor made manual for managing the chicken you received
from ENGINE? 1. Yes 2. No 48. If yes for Qn. # 47, was it useful to manage your improved chicken farming?
1.Yes2. No 49. How far is the nearest veterinary clinic from your house in walking hours? ________ 50. How far is the office of agriculture extension workers/office of agriculture from your
house in walking hours? ______________ 51. How did you manage your chicken? 1. Confined and fed in house 2. Fed the chicken
in the house and let them to scavenge in the day 3. Let them to scavenge with no supplementation 4. Other (Specify)_________________________________
52. In your view how do you rate the price of inputs? (for questions you know very well) 52.1 Price Chicken? 1. Very expensive 2. Expensive 3. Moderate 4. Cheap 5. Very Cheap 52.2 Feed? 1. Very expensive 2. Expensive 3. Moderate 4. Cheap 5. Very Cheap 52.3 Vaccine? 1. Very expensive 2. Expensive 3. Moderate 4. Cheap 5. Very Cheap 52.4 Drugs? 1. Very expensive 2. Expensive 3. Moderate 4. Cheap 5. Very Cheap 52.5 Chicken house? 1. Very expensive 2. Expensive 3. Moderate 4. Cheap 5. Very
Cheap 53. Do you keep records (on egg production, health and income) about your improved
chicken farming? 1. Yes 2. No 54. Is it a standard format provided by ENGINE? 1. Yes 2. No 55. Distance from the source of chicken supply to your house; in walking hours? ________

33
56. What was the age of the chicken when you received them from ENGINE project _________ (in months)?
VI. Management
57. What was the source of feed for your chicken after the feed you received from ENGINE finished? (multiple response is possible)
1. Scavenging supplemented with own formulation/purchased 2. Scavenging supplemented with grains 3. Only scavenging 4. Other (specify) _______________
58. When you were feeding your chicken confined in house, how often did you provide feed for your chicken per day? 1. Once per day 2. Twice per day 3. Three times per day 4. Other (specify) ____________
59. Did you measure the feed that you provided for your chicken per day? 1. Yes 2. No 60. If yes for Qn. #55, how much feed you offered fed per day? ___________ (capture the
respondents answer in local measuring equipment (e.g. jug). 61. Did you prepare laying nest for your hens? 1. Yes 2. No 62. How often did you collect eggs? 1. Once per day 2. Twice per day 3. More than three
times in a day 4. Other (specify)______________________________ 63. Was there any household member responsibly assigned to manage the chicken?
1. Yes 2. No 64. If yes for Qn. # 63, who was responsible? 1. Husband 2. Wife 3. Children 4. All
together 5. Other (specify)______________________ 65. What was the average time you or your family member spent managing the chicken per
day _______________________ (hours) VII. Sources of Agricultural Information
66. During rearing your improved chicken, did you receive technical advice from the agriculture extension workers? 1. Yes 2. No
67. If yes for Qn. # 66, how frequently do the agriculture extension workers visit you? 1. Once in a year 2. Once in a monthly 3. Twice in a week 4. Once in a Week 5. Once in 3 months 6. Other (specify)__________________
68. If yes for Qn. # 66, in what situation does the agriculture extension worker provided you advice? (multiple response is possible) 1. During house construction 2. During input provision 3. During vaccination 4. Whenever disease occurs 5. During credit collection 6. Up on request 7. Other (Specify) _____________
69. Have you ever received training on improved chicken production? 1. Yes 2. No 70. If yes for Qn. # 69, what were the topics of trainings? 1. General improved chicken
management 2. Health 3. Feeds & feeding 4. Financial management 5. Other (specify)_______
71. If yes for Qn. # 69, what did you improve in your poultry activity using the knowledge gained from the training? 1. Yes 2. No
72. If no for Qn. # 71, explain why? (multiple response is possible) 1. It was short 2. It was hard to understand 3. It lacks hands on exercise 4. Other (specify)______________
73. Are you still getting technical support? 1. Yes 2 No

34
74. What is your source of technical support about chicken production? (multiple response is possible) 1. Agricultural Extension workers 2. Fellow farmers 3. Mass media 4. NGOs 5. Agri. Research 6. Other (specify) ________________________
75. On what areas do you want to get technical support? (multiple response is possible) 1. Chicken health 2. Chicken feeds 3. Chicken Management 4. Chicken egg/meat consumption 5. Chicken marketing 6. Chicken housing 7. Other (specify) ________
76. Are you buying feed from market? 1. Yes 2. No 77. If yes for Qn. # 76, have you ever encountered price fluctuation? 1. Yes 2. No 78. Which month of the year was the price fluctuation critical? ________ write name of
month(s) 79. Is there critical season for feed shortage? 1. Yes 2. No 80. If yes for Qn. # 79, please specify the name of month(s)_________________________ 81. Did you receive training on how to formulate feed from locally available feed
ingredients? 1. Yes 2. No 82. Did you receive training on how to hatch chicken using local broody hen?
1. Yes 2. No 83. Do you visit extension agent/agricultural expert? 1. Yes 2. No 84. If yes for Qn. # 83, when do you visit? (multiple response is possible) 1. Planning to start
chicken farming 2. During input provision (chickens, feed, vaccines, drug, etc.) 3. Any time when there is technical problem 4. Other (specify) __________________
X. Biosecurity
85. Did you vaccinate your chicken received through the ENGINE project? 1. Yes 2. No 86. If yes for Qn. # 85, how many times? Please specify ____________________________ 87. Do you remember the name of the vaccine? 1. Yes 2. No 88. If Yes for Qn. # 87, please name them _______________________________________ 89. Has your chicken been sick and treated? 1. Yes 2. No 90. If yes for Qn. # 89, do you remember the disease? 1. Yes 2. No 91. Who treated your chicken? (multiple response is possible) 1. Myself 2. Veterinarian 92. Have you ever treated your chicken using local prepared medicine? 1. Yes 2. No 93. Why did not you take your chicken to the vet clinic rather than treating them using
locally prepared medicine (multiple response is possible) 1. Medicines were not always available at the vet clinic 2. The medicines were expensive to buy 3. Other (specify) ___________________
94. Is your chicken house separated by fence to avoid entrance of people/animals etc.? 1. Yes 2. No
95. Was there restriction on the number people to enter the chicken house for manage them? 1. Yes 2. No
96. How did you dispose your died chicken? (multiple response is possible) 1. Burry 2. Burn 3. Abandon 4. Other (specify) _______________________
97. How did you manage litter from your chicken? 1. Sell 2. Use as manure at the farm land 3. Throw away 4. Other (specify) ________________________________

35
IX. Consumption
98. Do you consume eggs? 1. Yes 2. No 99. If yes for Qn. #98, how often per week? ____________________________ 100. If yes for Qn. #98, who from among the family member were given priority to eat egg
from your chick farm? (please write in order of importance) 1. Children under five years’ ________ 2. Children aged 5 -15 years ______3. Pregnant women ______ 4. Lactating women ________ 5. Father ______ 6. Other (specify) _________
101. Do you consume chicken meat? 1. Yes 2. No 102. If yes for the above question, which one do you prefer to eat? 1. ENGINE provided
improved chicken 2. Local 3. Both 103. If you were not eating ENGINE provided chicken meat, what is your reason? Precisely
explain_________________ 104. If yes for Qn. #101, how often do you consume chicken meat per year? __________ 105. Who from among the family member were given priority to eat chicken meat from your
chick farm? (Rank in order of importance) 1. Children under five years ______ 2. Children aged 5 -15 years _______3. Pregnant women ______ 4. Lactating women ______ 5. Father _______ 6. Other (specify) ___________
Income
106. What are the chicken and chicken products you sold? 1. Egg 2. Chicks 3. Live hen 4. Live cock 5. Pullet 6. Cockerels 7. I did not sell chicken and chicken products
107. What is the number of eggs sold? _______________________ 108. What was the average price of one egg (birr)? _____________ 109. What was the number of chicks sold? ______________________ 110. What was the average price of one chick (birr)? ____________ 111. What was the number of hens sold? _______________________ 112. What was the average price of one hen (birr)? _____________ 113. What was the number of cocks sold? _______________________ 114. What was the average price of one cock (birr)? _____________ 115. What was the number of pullets sold? _______________________ 116. What was the average price of one pullet (birr)? _____________ 117. What was the number of cockerels sold? _______________________ 118. What was the average price of one cockerel (birr)? _____________ 119. Have you ever given chicken as gift? 1. Yes 2. No 120. If yes for Qn. #114, what were the numbers of chicken given as a gift? ____________
VIII. Challenges and Constraints
121. What are the major problems related to improved poultry production? Rank in order of importance
1. Feed cost [____] . Lack of market for farm products [____] 2. Shortage of veterinary supplies [____] 6. Disease [____] 3. Cost of veterinary supplies [____] 7. Access to extension service [____]

36
4. Lack of experience/knowledge [____] 8. Other (specify) ___________ [____]
XI. Profitability of the Industry
122. Did you purchase formulated feed for the chicken you received from ENGINE/get hatched If yes for the above question what the average price per kilogram (Birr) was_____
123. If you were buying chicken feed ingredient from the market what was the price per kilogram of; Maze _____ oil seed cake ______ Wheat _______ Wheat barn _______ Other (specify)________
124. What did you do with the money you got from the sale of your chicken farm products? 1. Schools fee 2. Family medication 3. Household consumable 4. Other (specify) ____
General Opinion______________________________________________________ ______________________________________________________________________________________________________________________________________________________

37
Case study out line
Background information Date__________________________
Region___________Woreda ________Kebele___________village______________
Name ______________________________ Age ____ Sex_____
Education ___________,
Marital status; Married________, single ______ Divorced_________ Widow_________
No. of child: Daughter __________ Sons__________,
Social status (any social responsibility) ___________________________________
Major means of livelihood (farming, trading, others) _________________________
Year of experience in the major means of livelihood_________________________
Participation of family members in household economic activities______________
Number of dependents___________________
Discussion of success history; in the success history those farmers who have joined the
ENGINE project and are still operating with verifiable performance success will be included.
The respondents must be selected with considerations that their experiences can be shared with
and motivate other farmers.
How were you introduced to the project and what kinds of support did you get during your
house hold poultry farm activity? Explain.
What were your success full practices and experiences in your ENGINE improved chicken
backyard poultry farm management and causes of your success? Explain.

38
Observation Check List/Interview Guide for Hatchers Owners
Location/District: ________________, Name of hatchery owners: _______________
Date of Interview: ________________
I. Breeder Farm
1. Stock size 2. Special training on breeder stock management
• Incubator operation and management
• Bio security and its effects
• Training and hatching plan
Observation Check List/Interview Guide for Growers
Location/District: _________________, Name of growers: _____________________
Date of Interview: ________________,
1. Stock size
- Chicken house, Location, Ventilation, Physical structure, Capacity (potential vs actual)
- Equipment, Brooding facility, Type of feeder, Type of drinker
- Flock performance (from the record sheet), Feed consumption, Egg productivity
2. Health and Biosecurity
- Health status (from the record sheet), Vaccination (from record sheet), Disinfection (foot
bath at the farm gate and chicken house), Overall, boot, mask, etc.
3. Special training on brooder management

39
Focus Group Discussion Guideline
General Information
Location/District: _________________ Date of Interview: ________________
1. Attitude of the community towards improved chicken production?
2. Awareness about the chicken package (objectives)
3. Roles and responsibilities of women
4. Importance of the chicken package
5. Control over/decision on income/benefit gained from the chicken package.
6. Why chicken package upscale or replicated beyond the target farmers
7. How was the extension service and technical support related to the chicken package?
8. How was/were the training/s delivered by the project (subject, methods of provision and
relevance)
9. Perception of targeted farmers towards protein nutrition (chicken and chicken products). Is there any challenge/constraint in consumption of chicken and chicken products?
10. How do you evaluate ENGINE chicken as compared with the indigenous chicken?
(Adaptation, behaviour, productivity, benefits (income) etc.)
11. Access to market
12. How were veterinary supplies (vaccine and medicaments are supplied)?

40
Key Informant Interview (KII) Guide for Experts
General Information
Location/District: _________________ Name of the expert: ____________________
Profession: __________________________Date of Interview: _________________
1. Awareness about the project (Please explain about ENGIN Poultry project?)
2. How your office has been managed the project?
3. How were the participant households selected? Criteria and your role?
4. How was the job relationship with project initiators/other partners in due of implementing
the project?
5. How the packages were implemented?
6. What were the activities carried out by your office to sustain the project while ENGINE is
phase out?
7. Do you think that the targets set by ENGINE are achieved?
8. Was there any intervention related chicken the woreda other than ENGINE?
9. What were components of the packages - type and number chickens, and related inputs?
10. How were participants selected?
11. How was the input source, supply/access system?
12. Technical support system?
13. Who were the stakeholders’ organizations and their associated tasks responsible for?
14. What were the approaches followed from planning to implementation of the project?
15. What was the input supply chain adopted?
16. What were the strengths of the project that could be adopted?
17. What were the weaknesses of the project that could be taken as a lesson?
18. Is ENGIN intervention replicated to other households or kebeles?