engine driven tools phase 1 test report for portable ... · 3 iso 8528-8:1995(e), reciprocating...
TRANSCRIPT
U.S. CONSUMER PRODUCT SAFETY COMMISSION
ENGINE-DRIVEN TOOLS
PHASE 1 TEST REPORT FOR
PORTABLE ELECTRIC GENERATORS
November 2006
Prepared by Christopher J. Brown Division of Mechanical Engineering Directorate for Laboratory Sciences
This report was prepared by CPSC staff, has not been reviewed or approved by, and may not
necessarily reflect the views of, the Commission.

ii
TABLE OF CONTENTS
EXECUTIVE SUMMARY........................................................................................................... ii
1. OBJECTIVES........................................................................................................................... 1
2. BACKGROUND....................................................................................................................... 1
3. TEST EQUIPMENT AND SETUP......................................................................................... 2
A. TEST SAMPLES................................................................................................................... 2 B. TEST CHAMBER DESCRIPTION........................................................................................... 3 C. AIR EXCHANGE RATE MEASUREMENT SYSTEM................................................................ 4 D. GAS SAMPLE ANALYSIS SYSTEMS .................................................................................... 4 E. DATA ACQUISITION SYSTEM ............................................................................................. 4
4. TESTS & PROCEDURES....................................................................................................... 4
A. TEST CONDITIONS ............................................................................................................. 5 B. PRE-TEST SYSTEM PREPARATION ..................................................................................... 6 C. TEST PROCEDURE .............................................................................................................. 7 D. AIR EXCHANGE RATE TEST............................................................................................... 7
5. DATA ANALYSIS.................................................................................................................... 8
A. EQUILIBRIUM CONDITION DATA ANALYSIS...................................................................... 8 B. AIR EXCHANGE RATE DATA ANALYSIS ............................................................................ 8 C. CO GENERATION RATE AND O2 DEPLETION RATE DATA ANALYSIS ................................ 9
6. GENERATOR TEST RESULTS AND DISCUSSION....................................................... 10
A. GENERATOR A................................................................................................................. 11 B. GENERATOR B ................................................................................................................. 14 C. GENERATOR C ................................................................................................................. 17 D. GENERATOR D................................................................................................................. 19 E. COMPARISON OF GENERATORS A AND B......................................................................... 21 F. COMPARISON OF GENERATORS A, B, C AND D................................................................ 22
7. RESULTS AND OBSERVATIONS SUMMARY ............................................................... 25
REFERENCES ............................................................................................................................ 27
APPENDIX A: ENGINE DRIVEN TOOLS PROJECT: PRELIMINARY GENERATOR RESULTS (MEMORANDUM).................................................................................................. 30
APPENDIX B: CHAMBER PHOTOS AND SCHEMATICS ................................................ 37
APPENDIX C: CHAMBER TEST EQUIPMENT................................................................... 40
APPENDIX D: DERIVATION OF EQUATIONS................................................................... 41
APPENDIX E: GENERATOR TEST DATA ........................................................................... 44
ii
EXECUTIVE SUMMARY
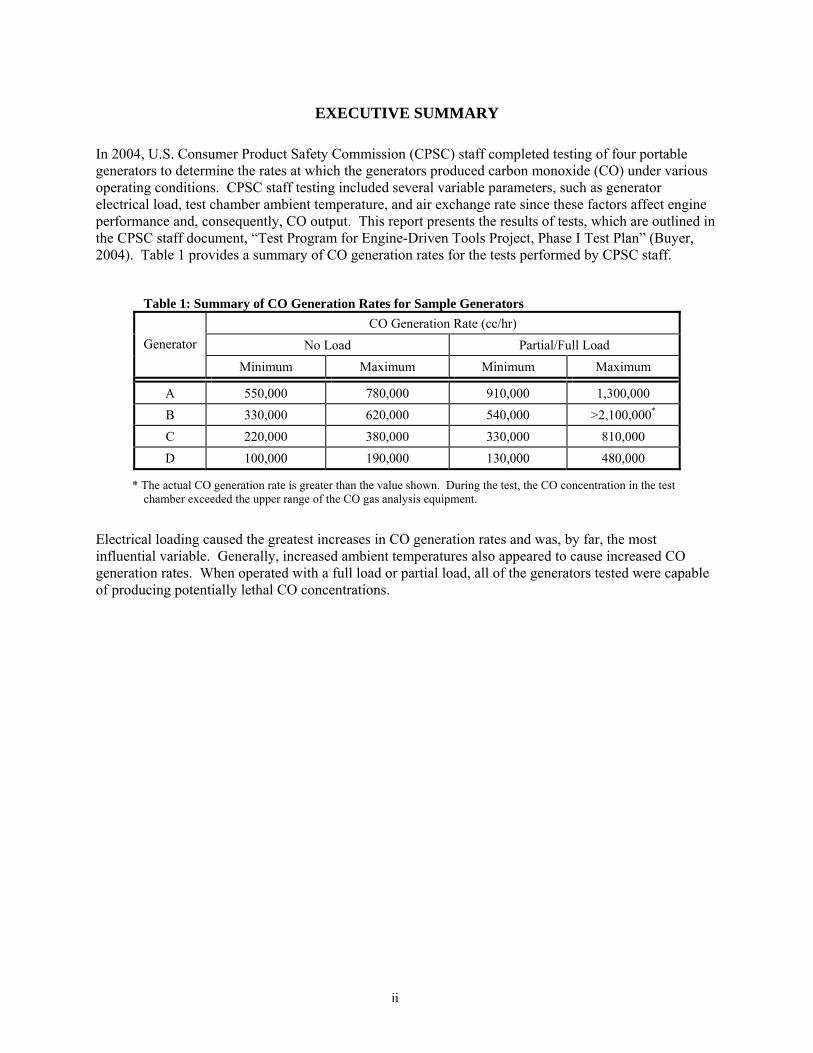
In 2004, U.S. Consumer Product Safety Commission (CPSC) staff completed testing of four portable generators to determine the rates at which the generators produced carbon monoxide (CO) under various operating conditions. CPSC staff testing included several variable parameters, such as generator electrical load, test chamber ambient temperature, and air exchange rate since these factors affect engine performance and, consequently, CO output. This report presents the results of tests, which are outlined in the CPSC staff document, “Test Program for Engine-Driven Tools Project, Phase I Test Plan” (Buyer, 2004). Table 1 provides a summary of CO generation rates for the tests performed by CPSC staff.
Table 1: Summary of CO Generation Rates for Sample Generators
CO Generation Rate (cc/hr) No Load Partial/Full Load Generator
Minimum Maximum Minimum Maximum
A 550,000 780,000 910,000 1,300,000 B 330,000 620,000 540,000 >2,100,000* C 220,000 380,000 330,000 810,000 D 100,000 190,000 130,000 480,000
* The actual CO generation rate is greater than the value shown. During the test, the CO concentration in the test chamber exceeded the upper range of the CO gas analysis equipment.
Electrical loading caused the greatest increases in CO generation rates and was, by far, the most influential variable. Generally, increased ambient temperatures also appeared to cause increased CO generation rates. When operated with a full load or partial load, all of the generators tested were capable of producing potentially lethal CO concentrations.
1
1. OBJECTIVES In 2004, U.S. Consumer Product Safety Commission (CPSC) staff completed testing of four sample portable generators to determine the rates at which the generators produced carbon monoxide (CO) under various operating conditions. Test variables included generator electrical load, chamber ambient temperature and air exchange rate since these factors affect engine performance and, consequently, CO output. This report presents the results of CPSC staff tests, which are outlined in the CPSC staff document, “Test Program for Engine-Driven Tools Project, Phase 1 Test Plan” (Buyer, 2004).
2. BACKGROUND For the 15-year period from January 1, 1990 through December 31, 2004, the CPSC databases contain records (as of June 27, 2005) of 274 deaths from CO poisoning associated with the use of generators (Marcy, N.E., Ascone, D.S., 2005).
CO is a colorless, odorless, tasteless, poisonous gas formed during incomplete combustion of fossil fuels, such as gasoline. Three main factors influence the severity of symptoms of CO exposure: (1) the ambient CO concentration, (2) the exposure duration, and (3) work-load and breathing rate of the exposed individual. Mild CO poisoning, such as would be associated with CO exposure concentrations of 100 to 200 parts per million (ppm) for 1 to 2 hours, manifests itself in non-specific flu-like symptoms such as headache, lightheadedness, nausea, and fatigue (National Institute for Occupational Safety and Health [NIOSH] et al., 1996). More severe CO poisoning can result in progressively worsening symptoms of vomiting, confusion, loss of consciousness, coma, and ultimately death. These symptoms are associated with CO exposure concentrations of 700 ppm or greater for an hour or more (NIOSH et al., 1996). The NIOSH recommended Immediately Dangerous to Life and Health concentration (IDLH) for CO is 1,200 ppm. NIOSH defines the IDLH as the concentration that could result in death or irreversible health effects, or prevent escape from the contaminated environment within 30 minutes.
Gasoline-fueled engine driven generators provide consumers with a means of powering various appliances and lighting within their homes when the normal utility power is not available. They have become increasingly affordable and available to consumers in recent years. Estimated annual U.S. sales of light duty, portable electric generators have steadily increased from 164,000 units in 2000 to 203,000 units in 2002, and CPSC staff estimates that 1 million generators are available for use in U.S. households (Donaldson, 2004). Typically, generators are not equipped with technology to limit consumer exposure to hazardous CO levels.
Generators can produce extremely large amounts of CO and are not intended for indoor use. NIOSH (1996) has demonstrated that small engines operated in enclosed or partially enclosed spaces can cause CO levels to rise so rapidly that there is not sufficient time for the victim(s) to recognize that they are in danger and remove themselves from the hazardous environment. CPSC staff investigated a number of reported deaths involving generators and found that the majority of the investigated deaths occurred in the home (Marcy, N.E., Ascone, D.S., 2005). When the investigated death occurred in the home, the generator was located in the basement or crawl space a majority of the time.
Currently, only the Environmental Protection Agency (EPA) has a U.S. emission standard (40 C.F.R. Part 90) that is applicable to engine classes found on most generators used by consumers. The EPA regulation concerns the impact of emissions on outdoor ambient air pollution (U.S. EPA, 2005). It allows engine exhaust to contain high levels of CO (519 to 610 g/kW-hr).
2
Underwriters Laboratories Inc. (UL) has a draft standard, UL 2201, “Portable Engine Generator Assemblies”.1 Neither Canada’s standard2, which has a section that addresses portable generators, nor the International Organization for Standardization (ISO) standard3 has CO emission requirements.
3. TEST EQUIPMENT AND SETUP This section describes the generator samples and equipment used in the CPSC staff tests and the general setup for testing.
a. Test Samples
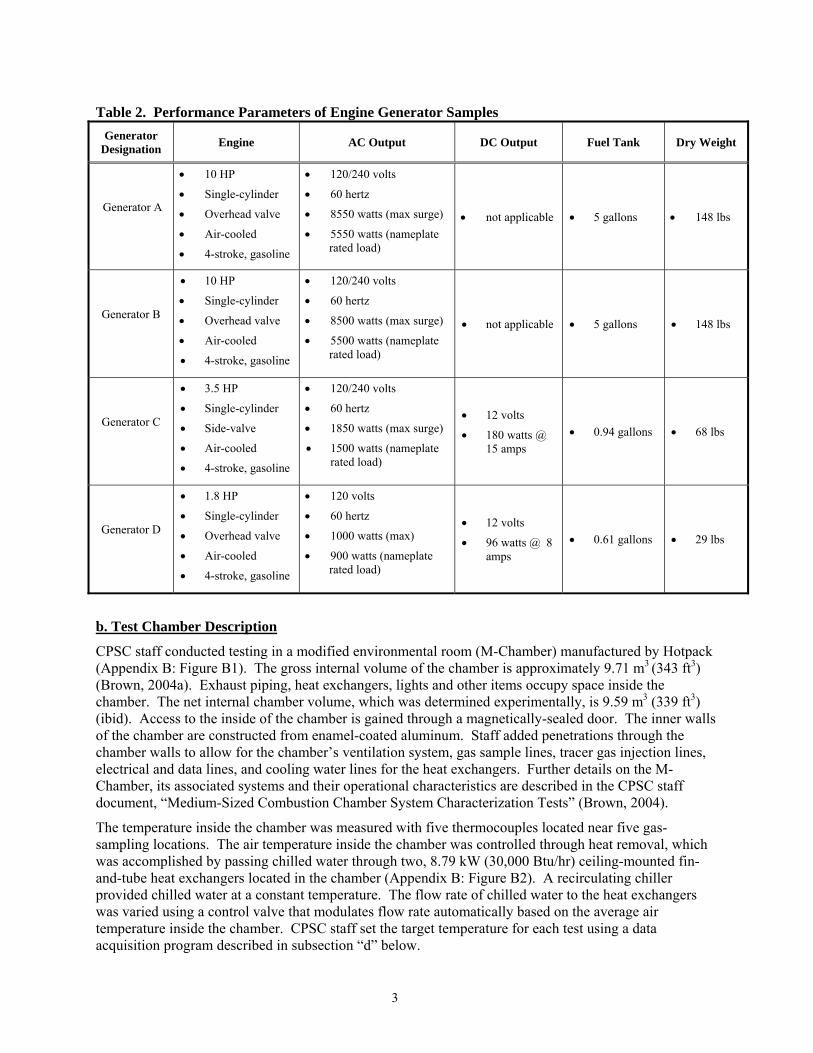
Table 2 displays the specifications of the four generators selected for testing, which are designated as Generators A, B, C, and D.
Generators A and B appear to be nearly identical, and both have a rated load4 of approximately 5.5 kW. Generators C and D have rated loads of 1.5 kW and 0.9 kW, respectively. Generators A and B were selected for evaluation for several reasons. In CPSC’s in-depth investigations of reported CO deaths associated with a generator, units rated in the 5.0-5.9 kW range were most commonly involved in those investigated deaths in which the generator’s rating was documented. Market data show that light duty generators in the size range of 5.1 kW to 6.0 kW make up 52 percent of sales.
Generator C was selected because it is a midrange power generation unit (compared to Generators A, B and D) and because the engine has a side valve configuration. Engine valve configuration can affect engine emission rates, and the other three generator engines have overhead valves. Generator D was selected because its power rating is at the low end of the range of units that have been involved in lethal CO poisonings of consumers reported to CPSC. Generator D has an additional operational mode that, when operated in this mode, automatically adjusts the engine speed to the appropriate level necessary for the power demand. Staff purchased all four generators new in 2002 and tested them in as received condition, not adjusting the carburetors.
1 At present, the draft standard includes requirements for cautionary markings only to address the CO poisoning hazard. Until the standard is finalized, UL has issued an Outline of Investigation for portable generators, which establishes UL certification requirements. The UL Outline includes requirements for labeling to alert consumers of the dangerous CO poisoning hazard. The Outline also includes other warning and advisory information, as well as requirements to permit safe use in rain (rainproof enclosure, while-in-use receptacle covers, and ground-fault circuit-interrupters on all AC output circuits). 2 Canadian Standard Association C22.2 No. 100-95, Motors and Generators 3 ISO 8528-8:1995(E), Reciprocating Internal Combustion Engine Driven Alternating Current Generator Sets, Part 8: Requirements and Tests for Low Power Generating Sets 4 The “rated load” is the manufacturers’ designated maximum load at which the generator can operate continuously. This load is stated on the generator and in a manufacturer supplied manual.
3
Table 2. Performance Parameters of Engine Generator Samples
b. Test Chamber Description
CPSC staff conducted testing in a modified environmental room (M-Chamber) manufactured by Hotpack (Appendix B: Figure B1). The gross internal volume of the chamber is approximately 9.71 m3 (343 ft3) (Brown, 2004a). Exhaust piping, heat exchangers, lights and other items occupy space inside the chamber. The net internal chamber volume, which was determined experimentally, is 9.59 m3 (339 ft3) (ibid). Access to the inside of the chamber is gained through a magnetically-sealed door. The inner walls of the chamber are constructed from enamel-coated aluminum. Staff added penetrations through the chamber walls to allow for the chamber’s ventilation system, gas sample lines, tracer gas injection lines, electrical and data lines, and cooling water lines for the heat exchangers. Further details on the M-Chamber, its associated systems and their operational characteristics are described in the CPSC staff document, “Medium-Sized Combustion Chamber System Characterization Tests” (Brown, 2004).
The temperature inside the chamber was measured with five thermocouples located near five gas-sampling locations. The air temperature inside the chamber was controlled through heat removal, which was accomplished by passing chilled water through two, 8.79 kW (30,000 Btu/hr) ceiling-mounted fin-and-tube heat exchangers located in the chamber (Appendix B: Figure B2). A recirculating chiller provided chilled water at a constant temperature. The flow rate of chilled water to the heat exchangers was varied using a control valve that modulates flow rate automatically based on the average air temperature inside the chamber. CPSC staff set the target temperature for each test using a data acquisition program described in subsection “d” below.
Generator Designation Engine AC Output DC Output Fuel Tank Dry Weight
Generator A
• 10 HP
• Single-cylinder
• Overhead valve
• Air-cooled
• 4-stroke, gasoline
• 120/240 volts
• 60 hertz
• 8550 watts (max surge)
• 5550 watts (nameplate rated load)
• not applicable • 5 gallons • 148 lbs
Generator B
• 10 HP
• Single-cylinder
• Overhead valve
• Air-cooled
• 4-stroke, gasoline
• 120/240 volts
• 60 hertz
• 8500 watts (max surge)
• 5500 watts (nameplate rated load)
• not applicable • 5 gallons • 148 lbs
Generator C
• 3.5 HP
• Single-cylinder
• Side-valve
• Air-cooled
• 4-stroke, gasoline
• 120/240 volts
• 60 hertz
• 1850 watts (max surge)
• 1500 watts (nameplate rated load)
• 12 volts
• 180 watts @ 15 amps
• 0.94 gallons • 68 lbs
Generator D
• 1.8 HP
• Single-cylinder
• Overhead valve
• Air-cooled
• 4-stroke, gasoline
• 120 volts
• 60 hertz
• 1000 watts (max)
• 900 watts (nameplate rated load)
• 12 volts
• 96 watts @ 8 amps
• 0.61 gallons • 29 lbs

4
Two fans were used to control the air exchange rate of the chamber. The chamber could attain a maximum air exchange rate of approximately 30 air changes per hour (ACH). One fan was located in a supply pipe and brought fresh air from the laboratory into the test chamber (Appendix B: Figure B2). The second fan was located in the exhaust pipe and exhausted air out of the chamber into an exhaust hood that vented outdoors. The flow rate of air through the supply pipe and exhaust pipe was controlled by manually varying the voltage supplied to each fan. The supply and exhaust pipes each contained a manually-operated iris, located outside the chamber, which allowed further control of the air exchange rate.
A magnehelic® pressure gauge and a digital pressure gauge measured the differential pressure between the inside of the chamber and the laboratory. A barometer with a built in thermometer was used to measure the local pressure and temperature in the laboratory. A digital hygrometer measured the relative humidity of the laboratory air.
c. Air Exchange Rate Measurement System
Digital mass flow controllers and rotometers were used to inject the appropriate amount of tracer gas(es) (CO and sulfur hexafluoride (SF6)). The injection lines were inserted into the supply air port near the ceiling of the chamber to ensure good mixing. Staff recorded the concentrations of the gases by computer and manually as they decayed.
d. Gas Sample Analysis Systems
Staff obtained gas samples from different locations using two independent sampling systems that route the samples to analyzers that use non-dispersive infrared (NDIR) and paramagnetic technologies (Appendix B: Figure B3). One gas sampling system measured the concentration of CO, carbon dioxide (CO2), oxygen (O2), hydrocarbons (HC), and SF6 inside the chamber. Gas samples were obtained through five equal length lines from five different locations inside the chamber and were blended using a gas-mixing manifold. Water vapor was condensed out of the samples prior to entering the analyzers using cold traps. The cold traps consisted of a simple chilled-water heat exchanger and a drain valve. The second sampling system measured the background concentration of CO in the laboratory. The sample lines conveyed all gases, sample and calibration, to the analyzers at an approximate flow rate of 0.8 standard liters per minute (slpm) (1.7 ft3/hr) and pressure of less than 6.90 kPa (1 psi). Appendices B and C provide details of the equipment used and a schematic illustrating the sampling systems (Appendix B: Figure B4).
e. Data Acquisition System
A computer based data acquisition system (DAS) recorded the majority of test data. The system consisted of a personal computer running TESTPOINTTM data acquisition software. Typical data acquisition rates were between 10 seconds to 5 minutes, depending on the air exchange rate and the duration of the test. In addition to obtaining the data electronically, test results were periodically recorded manually in a logbook during testing. The flow rates of the tracer gases (CO and SF6), the differential pressure between the chamber and laboratory, and the barometric pressure, temperature and relative humidity of the laboratory were recorded manually.
4. TESTS & PROCEDURES This section describes the planned Phase 1 tests and procedures in detail. Although the following discussion addresses separate tests (e.g., air exchange rate, generator operation, etc.), several of these tests were often combined during an actual test run. Therefore, a single test run may be used for several different evaluations.
5
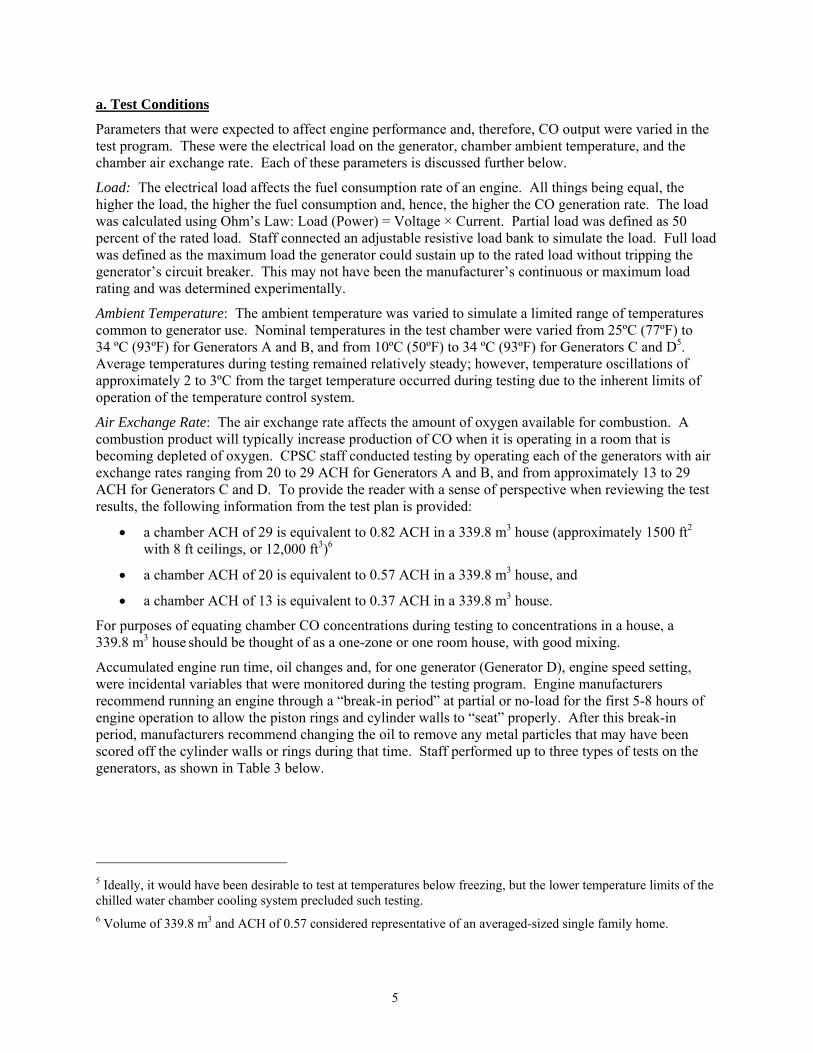
a. Test Conditions
Parameters that were expected to affect engine performance and, therefore, CO output were varied in the test program. These were the electrical load on the generator, chamber ambient temperature, and the chamber air exchange rate. Each of these parameters is discussed further below.
Load: The electrical load affects the fuel consumption rate of an engine. All things being equal, the higher the load, the higher the fuel consumption and, hence, the higher the CO generation rate. The load was calculated using Ohm’s Law: Load (Power) = Voltage × Current. Partial load was defined as 50 percent of the rated load. Staff connected an adjustable resistive load bank to simulate the load. Full load was defined as the maximum load the generator could sustain up to the rated load without tripping the generator’s circuit breaker. This may not have been the manufacturer’s continuous or maximum load rating and was determined experimentally.
Ambient Temperature: The ambient temperature was varied to simulate a limited range of temperatures common to generator use. Nominal temperatures in the test chamber were varied from 25ºC (77ºF) to 34 ºC (93ºF) for Generators A and B, and from 10ºC (50ºF) to 34 ºC (93ºF) for Generators C and D5. Average temperatures during testing remained relatively steady; however, temperature oscillations of approximately 2 to 3ºC from the target temperature occurred during testing due to the inherent limits of operation of the temperature control system.
Air Exchange Rate: The air exchange rate affects the amount of oxygen available for combustion. A combustion product will typically increase production of CO when it is operating in a room that is becoming depleted of oxygen. CPSC staff conducted testing by operating each of the generators with air exchange rates ranging from 20 to 29 ACH for Generators A and B, and from approximately 13 to 29 ACH for Generators C and D. To provide the reader with a sense of perspective when reviewing the test results, the following information from the test plan is provided:
• a chamber ACH of 29 is equivalent to 0.82 ACH in a 339.8 m3 house (approximately 1500 ft2
with 8 ft ceilings, or 12,000 ft3)6
• a chamber ACH of 20 is equivalent to 0.57 ACH in a 339.8 m3 house, and
• a chamber ACH of 13 is equivalent to 0.37 ACH in a 339.8 m3 house.
For purposes of equating chamber CO concentrations during testing to concentrations in a house, a 339.8 m3 house should be thought of as a one-zone or one room house, with good mixing.
Accumulated engine run time, oil changes and, for one generator (Generator D), engine speed setting, were incidental variables that were monitored during the testing program. Engine manufacturers recommend running an engine through a “break-in period” at partial or no-load for the first 5-8 hours of engine operation to allow the piston rings and cylinder walls to “seat” properly. After this break-in period, manufacturers recommend changing the oil to remove any metal particles that may have been scored off the cylinder walls or rings during that time. Staff performed up to three types of tests on the generators, as shown in Table 3 below.
5 Ideally, it would have been desirable to test at temperatures below freezing, but the lower temperature limits of the chilled water chamber cooling system precluded such testing. 6 Volume of 339.8 m3 and ACH of 0.57 considered representative of an averaged-sized single family home.

6
Table 3. Test Descriptions
• Preliminary Tests:
Designed to obtain preliminary test data – Generators A and D only
• Break-in Tests:
First 5 to 8 hours of accumulated run time (includes preliminary test time). Operated with no load or partial loading of nominally 50 percent of maximum load capacity – all Generators
• Post Break-in Tests:
Tests run after first 5-8 hours accumulated run time and subsequent oil change. Operated with load up to 100 percent of maximum sustainable load capacity (not rated load) – all Generators
Tables 2 and 3 of the Test Plan list the test conditions for all generators. However, all of the conditions were not achievable for all four generators. The primary reasons for the differences are:
1) An ACH of 29 (versus 30 as specified in the Test Plan) was used in testing. The actual chamber maximum ACH varies with the test conditions (temperature and pressure) and was limited to 29 ACH for this test program.
2) Designated low ACHs of 20 and 13 were used in testing to keep the CO concentrations within the range of the gas analyzers. Testing at an ACH of 11 was not feasible.
3) Staff ran tests at 34ºC (93ºF), rather than 37ºC (99ºF), due to the difficulty associated with achieving 37ºC.
4) Due to system limitations, Generators A and B were tested only at baseline (25ºC (77ºF)) and high (34 ºC (93ºF)) temperatures, with the exception of several preliminary tests. Generators C and D were tested at low temperature, as well as baseline and high temperatures.
5) For Generators A and B, the maximum sustainable load test condition, where tripping of the generators’ circuit breakers did not occur, tended to be approximately 72-84 percent of the rated load. Originally, the full load and partial load test conditions were defined in the test plan to be 100 percent and 50 percent of the rated load, respectively. Thus, the full load test condition was redefined during testing as 100 percent of the maximum sustainable continuous load, and the partial load condition was redefined as approximately 60 percent of same maximum load. Generators C and D did not trip their breakers at full rated load conditions.
b. Pre-Test System Preparation
At the start of each day, each gas analyzer was calibrated according to the instructions specified by the manufacturer of the analyzer. In general, the gas analyzers were zeroed with nitrogen gas and spanned (partial calibration) using a certified calibration gas (EPA Protocol Standards) of known concentration. The O2 analyzer was spanned using room air, which is normally 20.90 percent O2, and checked with a calibration gas. The analyzers were also checked at mid- and low-range concentrations to verify the performance of the analyzers.
Staff set the ventilation rate of the chamber by first fully opening the exhaust and the supply air pipes, and by adjusting the manually-operated irises located in each pipe. Next, the exhaust fan’s voltage was adjusted to achieve the desired ACH. Finally, the supply fan’s voltage was adjusted until the desired differential pressure (approximately 0.25 inches water column (w.c.) vacuum relative to outside the chamber) was achieved. The differential pressure of the chamber remained relatively constant during each test.
After setting the chamber ventilation rate, staff started the data acquisition program and entered the chamber temperature set-point into the test program. The flow of cooling water from the recirculating
7
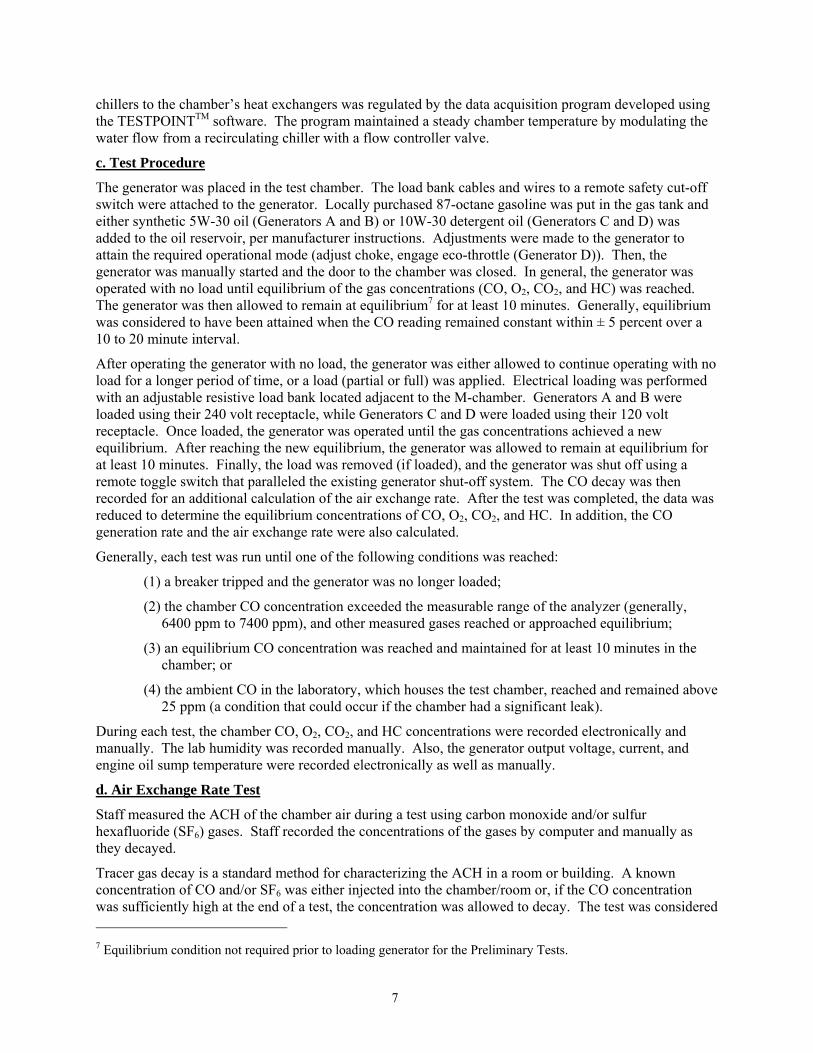
chillers to the chamber’s heat exchangers was regulated by the data acquisition program developed using the TESTPOINTTM software. The program maintained a steady chamber temperature by modulating the water flow from a recirculating chiller with a flow controller valve.
c. Test Procedure
The generator was placed in the test chamber. The load bank cables and wires to a remote safety cut-off switch were attached to the generator. Locally purchased 87-octane gasoline was put in the gas tank and either synthetic 5W-30 oil (Generators A and B) or 10W-30 detergent oil (Generators C and D) was added to the oil reservoir, per manufacturer instructions. Adjustments were made to the generator to attain the required operational mode (adjust choke, engage eco-throttle (Generator D)). Then, the generator was manually started and the door to the chamber was closed. In general, the generator was operated with no load until equilibrium of the gas concentrations (CO, O2, CO2, and HC) was reached. The generator was then allowed to remain at equilibrium7 for at least 10 minutes. Generally, equilibrium was considered to have been attained when the CO reading remained constant within ± 5 percent over a 10 to 20 minute interval.
After operating the generator with no load, the generator was either allowed to continue operating with no load for a longer period of time, or a load (partial or full) was applied. Electrical loading was performed with an adjustable resistive load bank located adjacent to the M-chamber. Generators A and B were loaded using their 240 volt receptacle, while Generators C and D were loaded using their 120 volt receptacle. Once loaded, the generator was operated until the gas concentrations achieved a new equilibrium. After reaching the new equilibrium, the generator was allowed to remain at equilibrium for at least 10 minutes. Finally, the load was removed (if loaded), and the generator was shut off using a remote toggle switch that paralleled the existing generator shut-off system. The CO decay was then recorded for an additional calculation of the air exchange rate. After the test was completed, the data was reduced to determine the equilibrium concentrations of CO, O2, CO2, and HC. In addition, the CO generation rate and the air exchange rate were also calculated.
Generally, each test was run until one of the following conditions was reached:
(1) a breaker tripped and the generator was no longer loaded;
(2) the chamber CO concentration exceeded the measurable range of the analyzer (generally, 6400 ppm to 7400 ppm), and other measured gases reached or approached equilibrium;
(3) an equilibrium CO concentration was reached and maintained for at least 10 minutes in the chamber; or
(4) the ambient CO in the laboratory, which houses the test chamber, reached and remained above 25 ppm (a condition that could occur if the chamber had a significant leak).
During each test, the chamber CO, O2, CO2, and HC concentrations were recorded electronically and manually. The lab humidity was recorded manually. Also, the generator output voltage, current, and engine oil sump temperature were recorded electronically as well as manually.
d. Air Exchange Rate Test
Staff measured the ACH of the chamber air during a test using carbon monoxide and/or sulfur hexafluoride (SF6) gases. Staff recorded the concentrations of the gases by computer and manually as they decayed.
Tracer gas decay is a standard method for characterizing the ACH in a room or building. A known concentration of CO and/or SF6 was either injected into the chamber/room or, if the CO concentration was sufficiently high at the end of a test, the concentration was allowed to decay. The test was considered 7 Equilibrium condition not required prior to loading generator for the Preliminary Tests.

8
complete once the concentration of CO and/or SF6 was less than 10 times the maximum background CO concentration and 2 percent of the gas analyzer’s full-scale value. After reaching this level, the chamber was allowed to ventilate completely before beginning the next test. On occasion, the cooling system was operated between tests to cool the generator to the desired temperature range for the next test.
5. DATA ANALYSIS This section describes how the raw data collected during the tests was processed. Appendix D provides detailed derivations of the equations listed below.
a. Equilibrium Condition Data Analysis
Data were imported into a Microsoft® Excel spreadsheet. Staff then plotted the concentrations of CO and SF6 in the chamber versus time in order to determine when equilibrium was achieved. Steady state during testing and during data analysis was assumed once the variation between concentrations was less than 5 percent over a period that coincided with the inverse of the air exchange rate (usually 10 to 20 minutes), taking into account any oscillations associated with the temperature control system. Also, test data graphed by the data acquisition software during the test was used to help determine equilibrium conditions.
The maximum and/or average values for all of the data during equilibrium were calculated once equilibrium was established. If necessary, the CO and SF6 concentrations were corrected for any background concentrations present in the laboratory after equilibrium was achieved and for any meter offset present at the start of the test.
b. Air Exchange Rate Data Analysis
The air exchange rate (AER) is the rate at which indoor air is exchanged with outdoor air. The rate is expressed as the volume of air per unit time. One hour is the typical time unit, and the volume is expressed in terms of the volume of the structure. The AER may typically be expressed in terms of air changes per hour (ACH). For example, an AER of 0.5 ACH means the volume of air passing through the chamber in an hour is equal to 0.5 × chamber volume.
The number of air changes per hour for the chamber was calculated from the decay of the tracer gases. Using a simple mass balance of the tracer gas in the chamber, the decay of the tracer gas with time can be described by Equation 1. In deriving Equation 1, the following assumptions were made: (a) the tracer gas in the chamber is well mixed, (b) the tracer gas does not get absorbed inside the room, and (c) the background concentration of the tracer gas is zero.
kteCC −= 0 [1]
In Equation 1, C is the concentration of the tracer gas at time t, Co is the initial concentration of the tracer gas at the start of the decay, k is the air exchange rate, and t is time. Equation 1 can be rearranged to solve for the quantity (kt) as follows:
ktCCLn −=
0 [2]
Equation 2 indicates that a plot of the quantity Ln (C/Co) versus time should be linear and that the air exchange rate (k) will be equal to the slope of this line. Linear regression can be used to fit a line to the data. An expression describing how well the line fits the data is the term R2, where R is the correlation coefficient. An R2 value of 1.0 indicates that the line obtained by linear regression fits the data perfectly. For most tests, a linear regression was performed on the tracer gas decay data, and the air exchange rate
9
was obtained from the slope of this line. Otherwise, the air exchange rates were obtained through a direct application of Equation 2 to the test data.
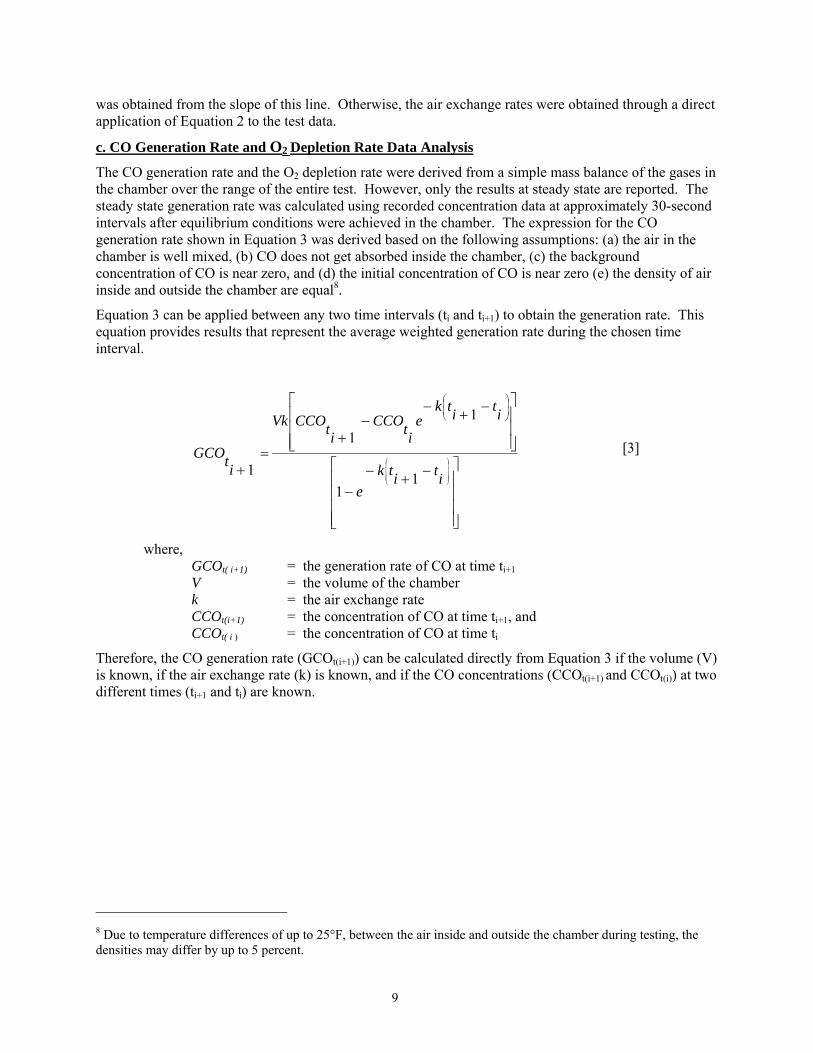
c. CO Generation Rate and O2 Depletion Rate Data Analysis
The CO generation rate and the O2 depletion rate were derived from a simple mass balance of the gases in the chamber over the range of the entire test. However, only the results at steady state are reported. The steady state generation rate was calculated using recorded concentration data at approximately 30-second intervals after equilibrium conditions were achieved in the chamber. The expression for the CO generation rate shown in Equation 3 was derived based on the following assumptions: (a) the air in the chamber is well mixed, (b) CO does not get absorbed inside the chamber, (c) the background concentration of CO is near zero, and (d) the initial concentration of CO is near zero (e) the density of air inside and outside the chamber are equal8.
Equation 3 can be applied between any two time intervals (ti and ti+1) to obtain the generation rate. This equation provides results that represent the average weighted generation rate during the chosen time interval.
⎥⎥⎥⎥
⎦
⎤
⎢⎢⎢⎢
⎣
⎡ −+−−
⎥⎥⎥
⎦
⎤
⎢⎢⎢
⎣
⎡ −+−−
+=
+⎟⎟⎟⎟
⎠
⎞
⎜⎜⎜⎜
⎝
⎛
⎟⎟⎠
⎞⎜⎜⎝
⎛
ititke
ititke
itCCO
itCCOVk
itGCO
11
11
1 [3]
where, GCOt( i+1) = the generation rate of CO at time ti+1 V = the volume of the chamber k = the air exchange rate CCOt(i+1) = the concentration of CO at time ti+1, and CCOt( i ) = the concentration of CO at time ti
Therefore, the CO generation rate (GCOt(i+1)) can be calculated directly from Equation 3 if the volume (V) is known, if the air exchange rate (k) is known, and if the CO concentrations (CCOt(i+1) and CCOt(i)) at two different times (ti+1 and ti) are known.
8 Due to temperature differences of up to 25°F, between the air inside and outside the chamber during testing, the densities may differ by up to 5 percent.
10
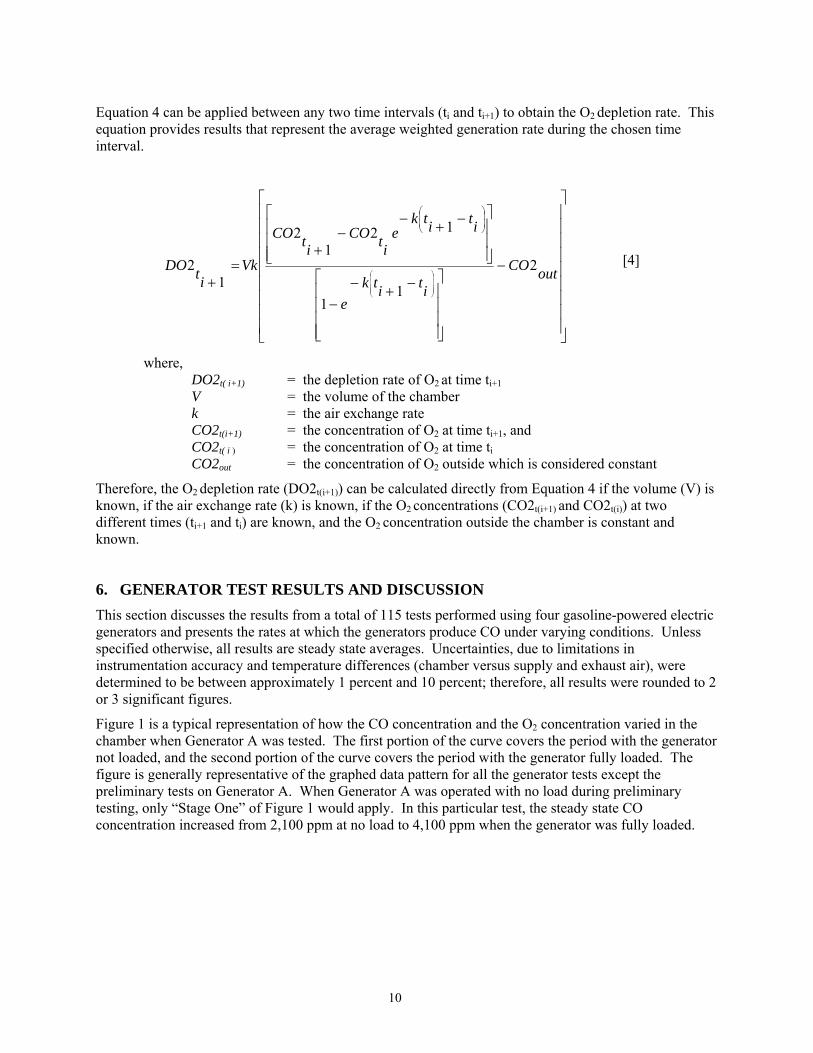
Equation 4 can be applied between any two time intervals (ti and ti+1) to obtain the O2 depletion rate. This equation provides results that represent the average weighted generation rate during the chosen time interval.
⎥⎥⎥⎥⎥⎥⎥⎥⎥
⎦
⎤
⎢⎢⎢⎢⎢⎢⎢⎢⎢
⎣
⎡
−
⎥⎥⎥⎥
⎦
⎤
⎢⎢⎢⎢
⎣
⎡ −+−−
⎥⎥⎥
⎦
⎤
⎢⎢⎢
⎣
⎡ −+−−
+=
+⎟⎟⎟⎟
⎠
⎞
⎜⎜⎜⎜
⎝
⎛
⎟⎟⎠
⎞⎜⎜⎝
⎛
outCO
ititke
ititke
itCO
itCO
Vkit
DO 2
11
121
2
12 [4]
where, DO2t( i+1) = the depletion rate of O2 at time ti+1 V = the volume of the chamber k = the air exchange rate CO2t(i+1) = the concentration of O2 at time ti+1, and CO2t( i ) = the concentration of O2 at time ti CO2out = the concentration of O2 outside which is considered constant
Therefore, the O2 depletion rate (DO2t(i+1)) can be calculated directly from Equation 4 if the volume (V) is known, if the air exchange rate (k) is known, if the O2 concentrations (CO2t(i+1) and CO2t(i)) at two different times (ti+1 and ti) are known, and the O2 concentration outside the chamber is constant and known.
6. GENERATOR TEST RESULTS AND DISCUSSION This section discusses the results from a total of 115 tests performed using four gasoline-powered electric generators and presents the rates at which the generators produce CO under varying conditions. Unless specified otherwise, all results are steady state averages. Uncertainties, due to limitations in instrumentation accuracy and temperature differences (chamber versus supply and exhaust air), were determined to be between approximately 1 percent and 10 percent; therefore, all results were rounded to 2 or 3 significant figures.
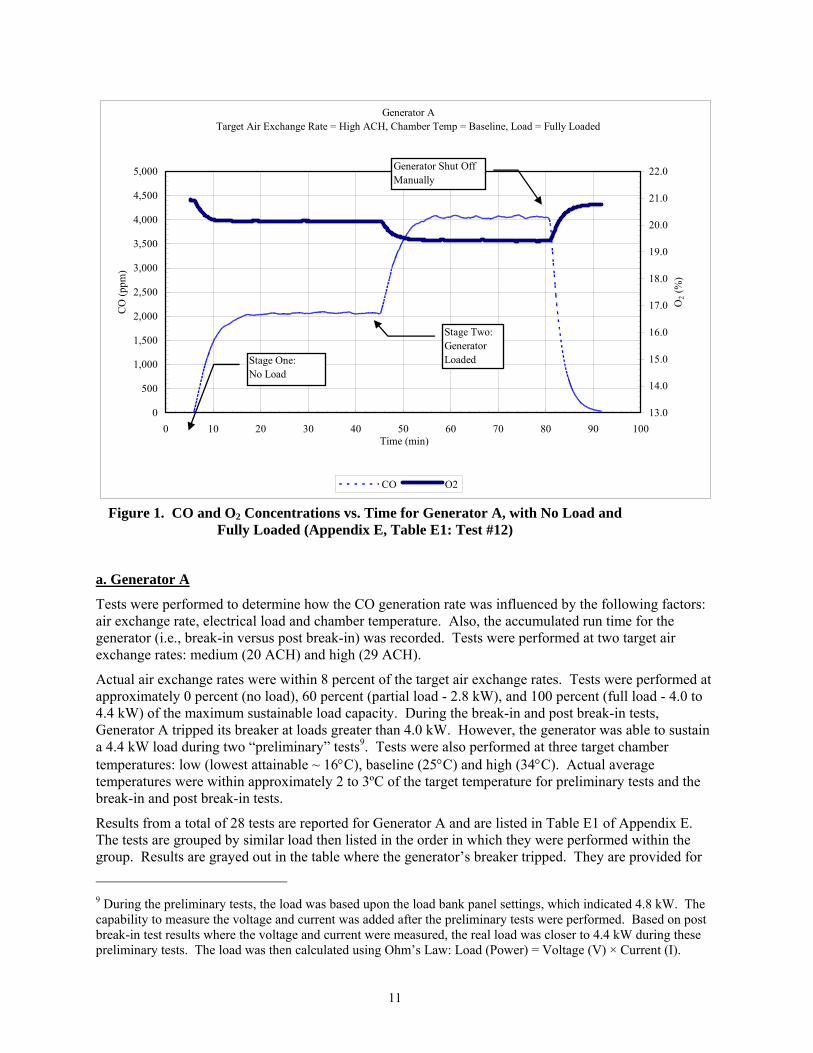
Figure 1 is a typical representation of how the CO concentration and the O2 concentration varied in the chamber when Generator A was tested. The first portion of the curve covers the period with the generator not loaded, and the second portion of the curve covers the period with the generator fully loaded. The figure is generally representative of the graphed data pattern for all the generator tests except the preliminary tests on Generator A. When Generator A was operated with no load during preliminary testing, only “Stage One” of Figure 1 would apply. In this particular test, the steady state CO concentration increased from 2,100 ppm at no load to 4,100 ppm when the generator was fully loaded.
11
Generator ATarget Air Exchange Rate = High ACH, Chamber Temp = Baseline, Load = Fully Loaded
0
500
1,000
1,500
2,000
2,500
3,000
3,500
4,000
4,500
5,000
0 10 20 30 40 50 60 70 80 90 100Time (min)
CO
(ppm
)
13.0
14.0
15.0
16.0
17.0
18.0
19.0
20.0
21.0
22.0
O2 (
%)
CO O2
Stage One: No Load
Stage Two: Generator Loaded
Generator Shut Off Manually
Figure 1. CO and O2 Concentrations vs. Time for Generator A, with No Load and Fully Loaded (Appendix E, Table E1: Test #12)
a. Generator A
Tests were performed to determine how the CO generation rate was influenced by the following factors: air exchange rate, electrical load and chamber temperature. Also, the accumulated run time for the generator (i.e., break-in versus post break-in) was recorded. Tests were performed at two target air exchange rates: medium (20 ACH) and high (29 ACH).
Actual air exchange rates were within 8 percent of the target air exchange rates. Tests were performed at approximately 0 percent (no load), 60 percent (partial load - 2.8 kW), and 100 percent (full load - 4.0 to 4.4 kW) of the maximum sustainable load capacity. During the break-in and post break-in tests, Generator A tripped its breaker at loads greater than 4.0 kW. However, the generator was able to sustain a 4.4 kW load during two “preliminary” tests9. Tests were also performed at three target chamber temperatures: low (lowest attainable ~ 16°C), baseline (25°C) and high (34°C). Actual average temperatures were within approximately 2 to 3ºC of the target temperature for preliminary tests and the break-in and post break-in tests.
Results from a total of 28 tests are reported for Generator A and are listed in Table E1 of Appendix E. The tests are grouped by similar load then listed in the order in which they were performed within the group. Results are grayed out in the table where the generator’s breaker tripped. They are provided for 9 During the preliminary tests, the load was based upon the load bank panel settings, which indicated 4.8 kW. The capability to measure the voltage and current was added after the preliminary tests were performed. Based on post break-in test results where the voltage and current were measured, the real load was closer to 4.4 kW during these preliminary tests. The load was then calculated using Ohm’s Law: Load (Power) = Voltage (V) × Current (I).
12
inspection but are not discussed further, since the generator could not sustain operation and most of the discussion is focused on CO exposure resulting from continuous operation.
i. Preliminary Tests
Generator A was not originally intended to be a test sample10. However, significant differences in test results between Generator A and Generator B prompted the decision to include Generator A as a test sample. Thus, Generator A had already been subjected to a number of “preliminary” tests11. (See Appendix A memorandum with preliminary test results.)
Preliminary tests resulted in a total of 3 hours and 40 minutes of accumulated run time for Generator A12. During Test No. 2, the generator was intentionally shut down before equilibrium was reached due to higher than anticipated background CO levels in the laboratory area. The generator exhaust was directed at a faulty chamber seal during this test. Areas where possible leaks in the chamber and chamber air exhaust line could have occurred were sealed. Also, the exhaust was directed away from the door for all subsequent tests. Later tests had much lower background CO concentrations. Staff conducted all tests with a maximum chamber air exchange rate of approximately 29 air changes per hour (ACH) and a chamber vacuum of approximately 6.27 mm w.c. (0.25 in w.c.) in the 9.59 m3 test chamber. It was determined from these tests that test conditions with reduced ACH and cold chamber temperature could not be conducted due to gas analyzer and chamber cooling system limitations.
Generator A had steady state CO generation rates that ranged from approximately 620,000 cc/hr (Appendix E, Table E1, Test No. 1) to 1,300,000 cc/hr (Test No. 6) in tests where the generator’s breaker did not trip. The CO generation rate increased significantly as the load increased. Test Nos. 4, 5, and 7, when the full rated load was applied, resulted in unexpected tripping of the generator's breaker causing termination of the generator’s power output. These tests helped determine the nominal maximum current capacity of the generator that was used for the remainder of the test conditions with (maximum sustainable) 100 percent load for this generator. The generator was not able to operate continuously with the rated 5.5 kW load applied.
The steady state CO concentrations ranged from 2,200 ppm to 4,600 ppm (Test Nos. 1 and 6, respectively) for all the tests where the generator’s breaker did not trip. The maximum CO concentrations ranged from 2,300 ppm to 2,900 ppm when the generator was not loaded and the ACH was high. The maximum CO concentrations ranged from 4,400 ppm to 4,600 ppm when the generator was fully loaded (~4.8 kW), the ACH was high (~29) and the generator’s breaker did not trip. The minimum O2 concentration for these tests was 19.4 percent.
10 Generator A was obtained for the purposes of: 1) providing initial generator test data to outside peer reviewers who had been asked to critique the test program for the Engine-Driven Tools Project, 2) determining the suitability of the test setup for performing generator tests, and 3) determining how future tests would be run, including modification of the original test plan, as deemed appropriate. This testing also provided initial test data to other CPSC staff who were involved with modeling to determine the potential health effects from consumer exposure to carbon monoxide (CO) emissions (Inkster, 2004). 11 It must be noted that the CO generation rates presented in this report do not exactly match those used in the health assessment (Inkster, 2004). This is because the rates used in the health assessment represent the averages of several tests. Since the time of the initial health assessment, the CO generation rate procedures were refined to more accurately represent the steady state CO generation rates. The specific generation rates derived for a 5.5 kilowatt generator that were used in the health assessment are: no load - 676604 cc/hr, partial load - 1,017,576 cc/hr, full load - 1,182,518 cc/hr. 12 The run time of the two preliminary tests reported in this report and the preliminary generator test results memorandum (Appendix A) are not included in the 3 hours and 40 minutes of preliminary tests, but are included in the 4 hours 26 minutes of break-in tests.

13
ii. Break-in and Post Break-in Tests
An additional 4 hours 26 minutes of run time were accumulated while conducting the break-in tests. After the break-in tests, the generator’s oil was changed and post break-in tests were run. Post break-in tests resulted in a total of 8 hours and 40 minutes of accumulated run time.
When operated with no load, Generator A had steady state CO generation rates that ranged from approximately 550,000 cc/hr to 780,000 cc/hr (Appendix E, Table E1, Test Nos. 18 and 10, respectively). The CO generation rate appeared to be most affected by the chamber temperature (Test No. 9 vs. 10, 12 vs. 13). The highest steady state CO generation rate was recorded during a high temperature test that had one of the lowest O2 concentrations (Test No. 10). Five of the six highest CO generation rates occurred during high temperature tests. The lowest four generation rates occurred during baseline temperature (25º C), high ACH tests. The CO generation rate under no load conditions did not appear to be affected by the accumulated run time on the generator.
When operated with no load, the steady state CO concentrations ranged from 2,100 ppm to 4,000 ppm (Test Nos. 18 and 10, respectively) for all the tests. The maximum CO concentrations ranged from 3,100 ppm to 4,100 ppm in the 9.59 m3 test chamber, when the generator was not loaded and the ACH was medium. For high ACH tests, the maximum CO concentrations ranged from 2,100 ppm to 2,600 ppm. With one exception (Test No. 1), the lowest O2 concentrations occurred during medium ACH tests (Test Nos. 9, 10, and 16).
When the generator was operated with a load, the variables that appeared to affect the CO generation rate the most were: 1) the load, 2) the accumulated run time prior to a test (Test No. 3 vs. 9 vs. 15), and 3) possibly the O2 concentration (See Test Nos. 10 vs. 11, 15 vs.16). When Generator A was loaded, the steady state CO generation rates ranged from approximately 910,000 cc/hr to 1,300,000 cc/hr (Test Nos. 15 and 17) in tests where the generator’s breaker did not trip. Test Nos. 13 and 14, where 4.3 kW and 4.2 kW loads were applied, respectively, resulted in unexpected tripping of the generator's breaker causing termination of the generator’s power output. For the partial load tests (~ 2.6 kW), the highest generation rate occurred during a baseline temperature, high ACH test (Test No. 3). However, this test was the first test of the group run, and the higher CO generation rate may have been because the engine was still going through its break-in period. A ranking of the partial load tests showed that the next three highest generation rates occurred during medium ACH (~20) tests (Test Nos. 9, 10, and 16), with one of the three tests also being a high temperature (~34°C) test (Test No. 10). The 100 percent load tests (~4 kW) showed that the high chamber temperature increased the generation rate (Test Nos. 17 and 18).
When the generator was operated with a load, the steady state CO concentrations ranged from 3,400 ppm to 5,900 ppm for all the tests. The maximum CO concentrations ranged from 3,500 ppm to 4,200 ppm when the generator was partially loaded (~2.6 kW) and the ACH was high. The maximum CO concentrations ranged from 5,400 ppm to 6,000 ppm when the generator was partially loaded (~2.6 kW) and the ACH was medium. As expected, the lowest O2 concentrations were found during the medium ACH tests and those with the highest loads. The minimum O2 concentration for these tests was 19.2 percent.
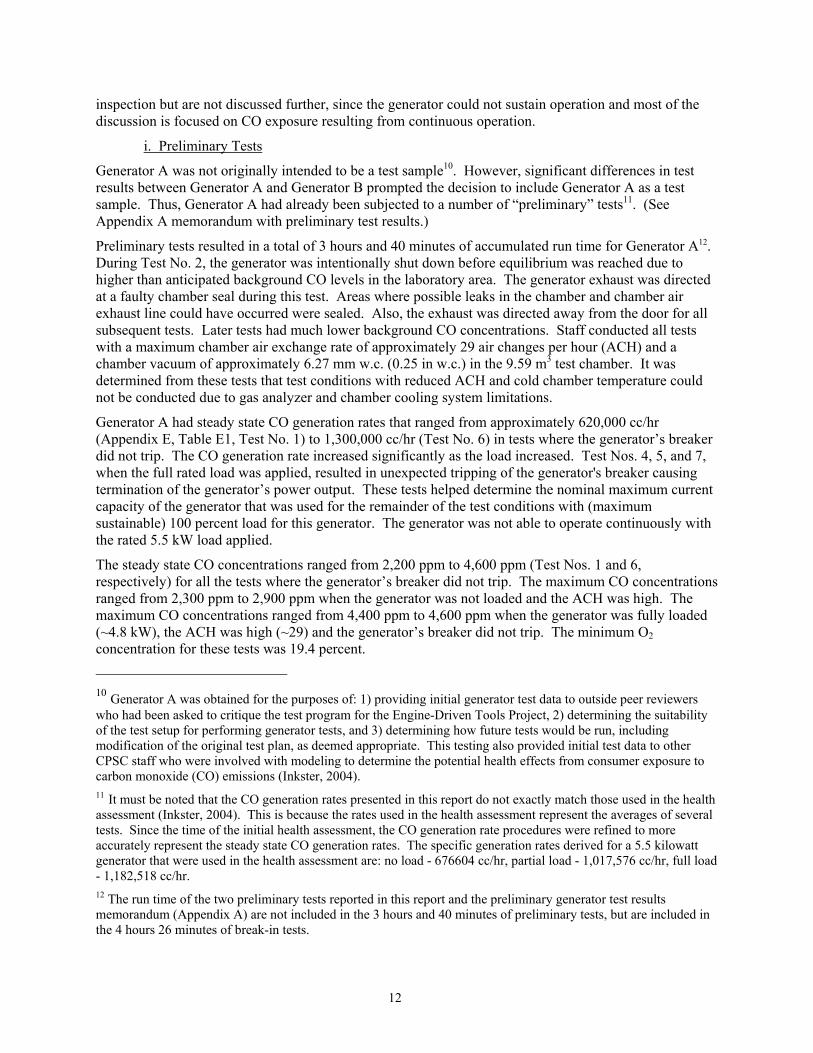
Figure 2 provides a graphical summary of the tests for Generator A13. The figure shows the effects of time (break-in or post break-in), generator load, and chamber temperature. The figure shows the effect of load and that, as the load increased, the CO generation rate increased. Also, as the chamber temperature increased, the CO generation rate increased for a given load. See Tables E5-E8 in Appendix E, which show the percentage change in CO generation rates as the load and/or temperature changed, for Figures 2, 4, 5 and 6. At 34°C, there did not appear to be a difference between break-in and post break-in tests,
13 Graph shows the averaged results of similar tests.
14
while at 25°C, there did appear to be a difference between break-in and post break-in tests, with lower CO emissions seen after the engine had been broken-in.
0
250,000
500,000
750,000
1,000,000
1,250,000
1,500,000
1,750,000
2,000,000
2,250,000
2,500,000
0 60 100 0 60 100
Load (percent)
Stea
dy-S
tate
CO
Gen
erat
ion
Rat
e (c
c/hr
)
Break-InPost Break-In
Chamber Temperature ~ 25 oC
Chamber Temperature ~ 34 oC
Air Exchange Rate = ~ 29 ACH
Figure 2. Generator A: Average Steady-State Generation rate vs. Sustainable Load
b. Generator B
Tests were performed to determine how the CO generation rate was influenced by the following factors: the air exchange rate, the load on the generator, and the chamber temperature. Also, the accumulated run time for the generator (i.e., break-in versus post break-in) was recorded. Tests were performed at two target air exchange rates: medium (20 ACH) and high (29 ACH). Although the test plan called for tests at (low) 11 ACH, 20 ACH was determined to be the lowest ACH where the CO concentrations achieved during testing did not exceed the full scale capability of the chamber CO analyzer. Actual air exchange rates were within 8 percent of the target air exchange rates. Load tests were performed at approximately 0 percent (no load), 60 percent (partial load - 2.8 kW), and 100 percent (full load - 4.4 kW) of the maximum sustainable load capacity. Generator B tripped its breaker with loads greater than 4.6 kW. Tests were also performed at two target chamber temperatures: baseline (25°C) and high (34°C). Actual average temperatures were within approximately 2 to 3ºC of the target temperature. Due to limitations of the chilled water heat removal system in the M-Chamber, the cold temperature tests prescribed in the test plan were not conducted.
Results from a total of 23 tests are reported for Generator B and are listed in Table E2 of Appendix E. The test where the generator was able to sustain a load of 4.6 kW is not included in the Appendix and was performed primarily to determine the maximum sustainable load. Results are grayed in Table E2 for one test where the analyzer’s CO range was exceeded during the test (Test No. 4, loaded), but not in two other tests where the range was exceeded (Test Nos. 12 and 13, loaded). In Test No. 4 (loaded), equilibrium
15
conditions were not achieved before the CO measurement range of the analyzer was exceeded. Results for Test Nos. 12 and 13 were not grayed out because: 1) equilibrium conditions were either achieved or very close to being achieved and 2) analysis of rate of change of generation rate and the amount of data collected warranted inclusion of the test results.
The grayed out result in Table E2 is provided for inspection, but discussion is limited to the effect of O2 level on the CO generation rate. The tests are grouped by similar load, and then listed in the order in which they were performed within the group. No preliminary tests were performed on Generator B.
i. Break-in and Post Break-in Tests Break-in tests resulted in 5 hours 48 minutes of run time. After the break-in tests, the generator’s oil was changed, and normal operation (post break-in) tests were run. Post break-in tests resulted in a total of 5 hours 2 minutes of accumulated run time.
When operated with no load, Generator B had steady state CO generation rates that ranged from approximately 330,000 cc/hr to 620,000 cc/hr (Appendix E, Table E2, Test Nos. 4 and 11). No variable could be determined that most affected the CO generation rate. The highest steady state CO generation rate was recorded during a baseline temperature (~25°C) test with one of the lowest O2 concentrations (19.7 percent). Five of the seven highest CO generation rates occurred during post break-in tests.
When operated with no load, the steady state CO concentrations ranged from 1,100 ppm to 3,100 ppm (Test Nos. 12 and 6, respectively) for all the tests. The maximum CO concentrations ranged from 1,400 ppm to 2,300 ppm when the generator was operated with no load and the ACH was high. When the ACH was medium (~20), the maximum CO concentrations ranged from 2,200 ppm to 3,300 ppm. As expected, the lowest O2 concentrations occurred during medium (20) ACH tests. The minimum O2 concentration for these tests was 19.3 percent.
When the generator was operated with a load, the variables that appeared to affect the CO generation rate the most were: 1) electrical load, 2) O2 concentration, and 3) chamber temperature (See Test Nos. 9 vs. 13 (load), 2 and 3 vs. 4 (O2 /ACH), 5 vs. 6 (O2 /ACH), 9 vs. 10 (temperature). When the generator was loaded, Generator B had steady state CO generation rates that ranged from approximately 540,000 cc/hr to >2,100,000 cc/hr (Test Nos. 2 and 13, respectively).
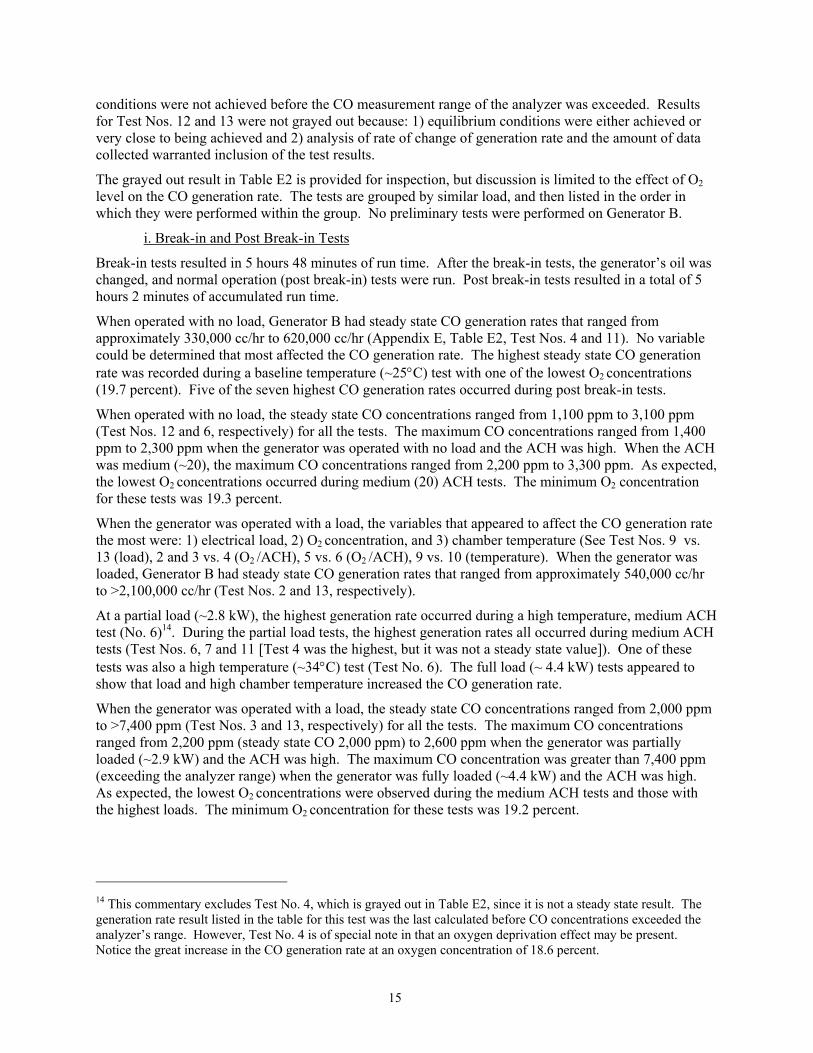
At a partial load (~2.8 kW), the highest generation rate occurred during a high temperature, medium ACH test (No. 6)14. During the partial load tests, the highest generation rates all occurred during medium ACH tests (Test Nos. 6, 7 and 11 [Test 4 was the highest, but it was not a steady state value]). One of these tests was also a high temperature (~34°C) test (Test No. 6). The full load (~ 4.4 kW) tests appeared to show that load and high chamber temperature increased the CO generation rate.
When the generator was operated with a load, the steady state CO concentrations ranged from 2,000 ppm to >7,400 ppm (Test Nos. 3 and 13, respectively) for all the tests. The maximum CO concentrations ranged from 2,200 ppm (steady state CO 2,000 ppm) to 2,600 ppm when the generator was partially loaded (~2.9 kW) and the ACH was high. The maximum CO concentration was greater than 7,400 ppm (exceeding the analyzer range) when the generator was fully loaded (~4.4 kW) and the ACH was high. As expected, the lowest O2 concentrations were observed during the medium ACH tests and those with the highest loads. The minimum O2 concentration for these tests was 19.2 percent.
14 This commentary excludes Test No. 4, which is grayed out in Table E2, since it is not a steady state result. The generation rate result listed in the table for this test was the last calculated before CO concentrations exceeded the analyzer’s range. However, Test No. 4 is of special note in that an oxygen deprivation effect may be present. Notice the great increase in the CO generation rate at an oxygen concentration of 18.6 percent.
16
Figure 3 provides a graphical summary of the tests for Generator B15. The figure shows the effects of accumulated run time (break-in or post break-in) and chamber O2 levels during steady state. The figure shows that as the O2 concentration decreased (by decreasing the ACH), the rate of CO generation increased. See Tables E9-E10 in Appendix E for the percentage change in generation rates that occurred as the O2 concentration changed, for Figure 3. The effect of accumulated run time was minimal. The CO generation rate of Generator B, as opposed to that of the other generators tested, appeared to be affected by slight decreases of O2 from ambient levels.
0
200,000
400,000
600,000
800,000
1,000,000
1,200,000
18.6 19.3 19.7 18.6 19.3 19.7
O2 (percent)
Ste
ady-
Stat
e C
O G
ener
atio
n R
ate
(cc/
hr)
Break-InPost Break-In
25 oC37 oC
Figure 3. Generator B: Average Steady-State Generation Rate vs. Chamber O2 During Partial
Load Tests
15 Graph shows the averaged results of similar tests.
17
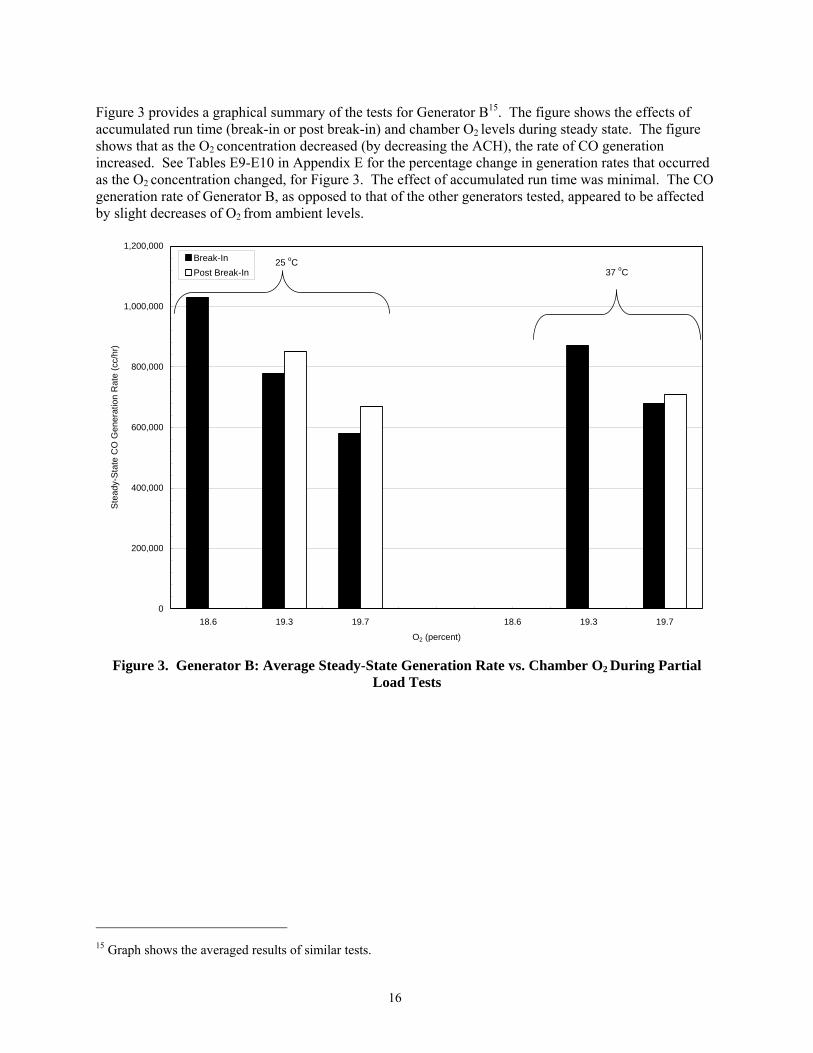
Figure 4 provides a graphical summary of the tests for Generator B. The figure shows the effects of accumulated run time (break-in or post break-in), generator load, and chamber temperature. The figure shows that as the load increased, the rate of CO generation increased. Also when the generator was loaded, as the chamber temperature increased, the CO generation rate increased for a given load. See Tables E5-E8 in Appendix E, which show the percentage change in CO generation rates as the load and/or temperature changed, for Figures 2, 4, 5 and 6.
0
250,000
500,000
750,000
1,000,000
1,250,000
1,500,000
1,750,000
2,000,000
2,250,000
2,500,000
0 60 100 0 60 100
Load (percent)
Ste
ady-
Stat
e C
O G
ener
atio
n R
ate
(cc/
hr)
Break-InPost Break-In
25 oC
37 oC
ACH = 29
Figure 4. Generator B: Average Steady-State Generation Rate vs. Sustainable Load
c. Generator C
Tests were performed to determine how the CO generation rate was influenced by the following factors: the air exchange rate, the load on the generator, and the chamber temperature. Also, the accumulated run time for the generator (i.e., break-in versus post break-in) was recorded. Tests were performed at two target air exchange rates: low (13 ACH) and high (29 ACH). Actual air exchanges rates were within 6 percent of the target air exchange rates. Tests were performed at approximately 0 percent (no load), 60 percent (partial load - 0.8 kW to 0.9 kW), and 100 percent (full load - 1.2 kW to 1.3 kW) of the maximum sustainable load capacity. The experimental 50 percent load condition differed by up to 13 percent from the nominal load bank setting of 0.8 kW. The experimental 100 percent load condition differed by up to 23 percent from the nominal load setting of 1.5 kW. This resulted in actual partial loads nearer to 60 percent rather than the targeted 50 percent of the maximum sustainable load. Tests were also performed at three target chamber temperatures: low (lowest attainable ~ 12°C), baseline (25°C) and high (34°C). Actual average temperatures were within approximately 2 to 3ºC of the target temperature.
Results from a total of 28 tests were reported for Generator C and are listed in Table E3 of Appendix E. The tests are grouped by similar load then listed in the order in which they were performed.

18
i. Break-in and Post Break-in Tests
No preliminary tests were performed on Generator C. Break-in tests put 3 hours 57 minutes of accumulated run time on Generator C. After the break-in tests, the generator’s oil was changed and post break-in tests were run. Post break-in tests resulted in a total of 11 hours 57 minutes of accumulated run time.
When operated with no load, Generator C had steady state CO generation rates that ranged from approximately 220,000 cc/hr to 380,000 cc/hr (Appendix E, Table E3, Test Nos. 8 and 11, respectively). The CO generation rate appeared to be most affected by the chamber temperature. The four highest CO generation rates occurred during high temperature tests (Test Nos. 2, 3, 9, and 11). The lowest two generation rates occurred during low temperature tests (Test Nos. 8 and 14). The CO generation rate under no load conditions did not appear to be affected by the accumulated run time on the generator. The effect of slightly reduced O2 levels on the CO generation rate appeared to be minor or negligible at the air exchange rates of approximately 12 and 29 ACH (O2 concentrations of 20.1 percent to 20.6 percent), respectively.
When operated with no load, the steady state CO concentrations ranged from 830 ppm to 3,200 ppm (Test Nos. 8 and 11) for all the tests. The maximum CO concentrations ranged from 2,100 ppm to 3,300 ppm in the test chamber, when the generator was not loaded and the ACH was low. For high ACH tests, the maximum CO concentrations ranged from 880 ppm to 1,600 ppm. The lowest O2 concentrations occurred during low ACH tests.
When the generator was operated with a load, the variables that appeared to affect the CO generation rate the most were: 1) the load, and 2) the chamber temperature. When Generator C was loaded, the steady state CO generation rates ranged from approximately 330,000 cc/hr to 810,000 cc/hr (Test Nos. 8 and 9). For the partial load tests (~0.9 kW), the highest generation rate occurred during a high temperature, low ACH test (Test No. 3). A ranking of the partial load test data shows that the three highest generation rates occurred during high temperature tests (~34°C). The effect of slightly reduced O2 levels on the CO generation rate appeared to be minor or negligible at the air exchange rates of approximately 13 and 29 ACH (O2 concentrations of 19.2 percent to 20.5 percent).
When the generator was operated with a load, the steady state CO concentrations ranged from 1,300 ppm to 6,400 ppm (Test Nos. 8 and 11) for all the tests. The maximum CO concentrations ranged from 1,300 ppm to 1,600 ppm when the generator was partially loaded (~0.9 kW) and the ACH was high. The maximum CO concentrations ranged from 4,000 ppm to 6,500 ppm when the generator was fully loaded (~1.3 kW) and the ACH was low. As expected, the lowest O2 concentrations were observed during the low ACH tests and those with the highest loads. The minimum O2 concentration for these tests was 19.2 percent.

19
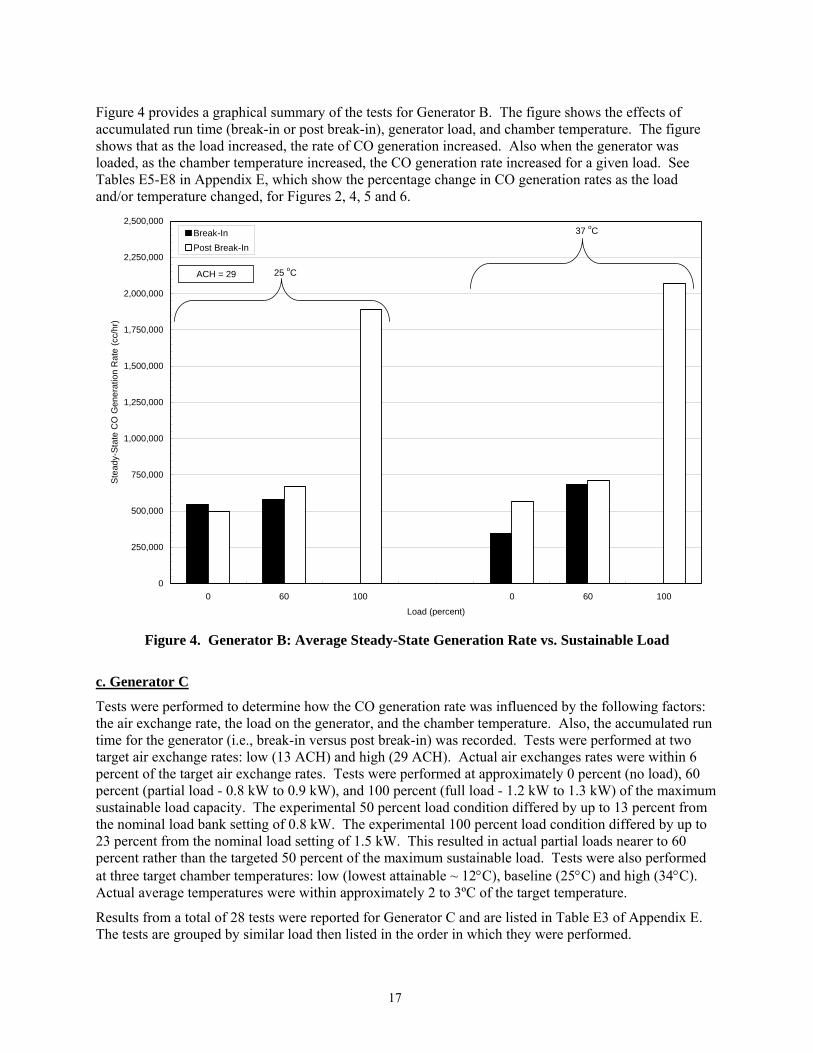
Figure 5 provides a graphical summary of the tests for Generator C16. The figure shows the effects of time (break-in or post break-in), generator load, and chamber temperature. The figure shows that as the load increased, the rate of CO generation increased. Also for a given load, as the chamber temperature increased, the CO generation rate increased. At 34°C and 25°C, there appeared to be a slight difference between break-in and post break-in tests, with post break-in CO emissions being slightly reduced compared to initial or comparable tests. See Tables E5-E8 in Appendix E, which show the percentage change in CO generation rates as the load and/or temperature changed, for Figures 2, 4, 5 and 6.
0
200,000
400,000
600,000
800,000
1,000,000
1,200,000
0 60 100 0 60 100 0 60 100
Load (percent)
Ste
ady-
Sta
te C
O G
ener
atio
n R
ate
(cc/
hr)
Break-InPost Break-In
25 oC
34 oCACH = ~ 29
12 oC
Figure 5. Generator C: Average Steady-State Generation Rate vs. Sustainable Load
d. Generator D
Tests were performed to determine how the CO generation rate was influenced by the following factors: the air exchange rate, the load on the generator, and the chamber temperature. Also, the accumulated run time for the generator (i.e., break-in versus post break-in) was recorded. Tests were performed at two target air exchange rates: low (13 ACH) and high (29 ACH). Actual air exchanges rates were within 11 percent of the target air exchange rates. Tests were performed at approximately 0 percent (no load), 50 percent (partial load - 0.5 kW), and 100 percent (full load - 0.9 kW) of the maximum sustainable load capacity. The experimental 50 percent load condition differed by less than 3 percent from the nominal load setting. The experimental 100 percent load condition differed by less than 3 percent from the nominal load setting. Tests were also performed at three target chamber temperatures: low (lowest attainable ~ 10°C), baseline (25°C) and high (34°C). Actual average temperatures were within 16 Graph shows the averaged results of similar tests.
20
approximately 2 to 3ºC of the target temperature. Generator D was tested in an additional operational mode (Eco-Throttle). When operated in this mode, the engine speed was automatically reduced by the generator when all loads were turned off or disconnected.
One preliminary test was run on Generator D for approximately 1 hour. However, the results are not reported here since the test was not a standard test with a constant ACH. The purpose of this test was to quickly appraise chamber adequacy.
Results from a total of 36 tests were reported for Generator D and are listed in Table E4 of Appendix E. The tests are grouped by similar load then listed in the order in which they were performed within the group.
i. Break-in and Post Break-in Tests
Break-in tests resulted in 7 hours 41 minutes of run time. After the break-in tests, the generator’s oil was changed, and normal operation (post break-in) tests were run. Post break-in tests resulted in a total of 15 hours 17 minutes of accumulated run time.
When operated with no load, Generator D had steady state CO generation rates that ranged from approximately 100,000 cc/hr to 190,000 cc/hr (Appendix E, Table E4, Test Nos. 8 and 5, respectively). The chamber temperature variable appeared to have affected the CO generation rate the most. The highest steady state CO generation rates were recorded during high temperature (~34°C) tests (Test Nos. 5, 7, 10, 14, and 16), and the lowest generation rates were recorded during low temperature (~10°C) tests (Test Nos. 1, 8, and 17). One of these low temperature tests followed an oil change; it had the lowest CO generation rate of all tests (Test No. 8).
Operation of the generator in the eco-throttle mode may have also affected the rate of CO generation (Test Nos. 4, 6, 12 and 15). In the eco-throttle mode, CO generation rates were lowered by 6 to 12 percent from comparable no load tests (Test Nos. 3 vs. 4, and 12 vs. 13). The O2 concentration in the chamber was lowered only slightly by the operation of the generator at low and high ACHs. The effect of slightly reduced O2 levels on the CO generation rate appeared to be minor or negligible at the air exchange rates of 13 and 29 ACH (O2 concentrations of 20.4 percent to 20.7 percent). As expected, the lowest O2 concentrations occurred during low ACH tests. The minimum O2 concentration for these tests was 20.4 percent. The effect of prior accumulated run time also appeared to be negligible.
When operated with no load, the steady state CO concentrations ranged from 370 ppm to 1,500 ppm (Test Nos. 8 and 5) for all the tests. The maximum CO concentrations ranged from 900 ppm to 1500 ppm (steady state CO 1,500 ppm) when the generator was operated with no load and the ACH was low (~13). When the ACH was high (~29), the maximum CO concentrations ranged from 380 ppm (steady state CO 370 ppm) to 1100 ppm.
When the generator was operated with a load, the variables that appeared to have affected the CO generation rate the most were: 1) electrical load, 2) chamber temperature, and 3) changing the oil. The effect of slightly reduced O2 levels on the CO generation rate appeared to be minor or negligible at the air exchange rates of 13 and 29 ACH (O2 concentrations of 19.9 percent to 20.6 percent). When the generator was loaded, Generator D had steady state CO generation rates that ranged from approximately 130,000 cc/hr to 480,000 cc/hr (Test Nos. 8 and 14). At a partial load (~0.5 kW), the highest generation rate occurred during a high temperature (~34°C), low ACH test (Test Nos. 5). During the partial load tests, the lowest generation rates occurred during low temperature tests (Test Nos. 1 and 8). The accumulated engine run time may have affected CO generation rates. There seemed to be a trend with the earliest tests having higher CO generation rates when compared with similar tests run later (Test No. 2 vs. Test No. 9). The full load (~ 0.9 kW) tests suggest that load and high chamber temperature increased the generation rate. The highest generation rates were recorded during the high temperature (~34°C) tests (Test Nos. 14 and 16).
21
When the generator was operated with a load, the steady state CO concentrations ranged from 500 ppm to 3,800 ppm (Test Nos. 8 and 16, respectively) for all the tests. The maximum CO concentrations ranged from 500 ppm (steady state CO 500 ppm) to 870 ppm when the generator was partially loaded (~0.5 kW) and the ACH was high. The maximum CO concentrations ranged from 3,300 ppm to 3,900 ppm (steady state CO 3,800 ppm) when the generator was fully loaded (~0.9 kW) and the ACH was low. As expected, the lowest O2 concentrations were found during the low ACH tests and those with the highest loads. The minimum O2 concentration for these tests was 19.9 percent.
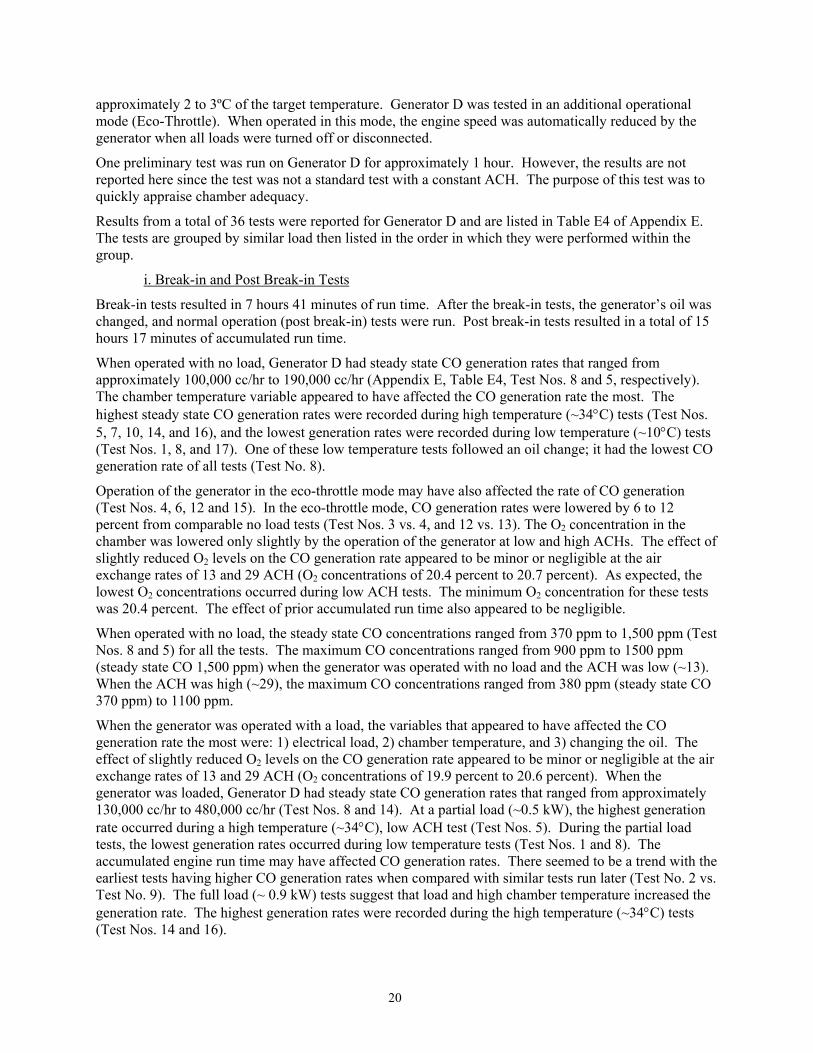
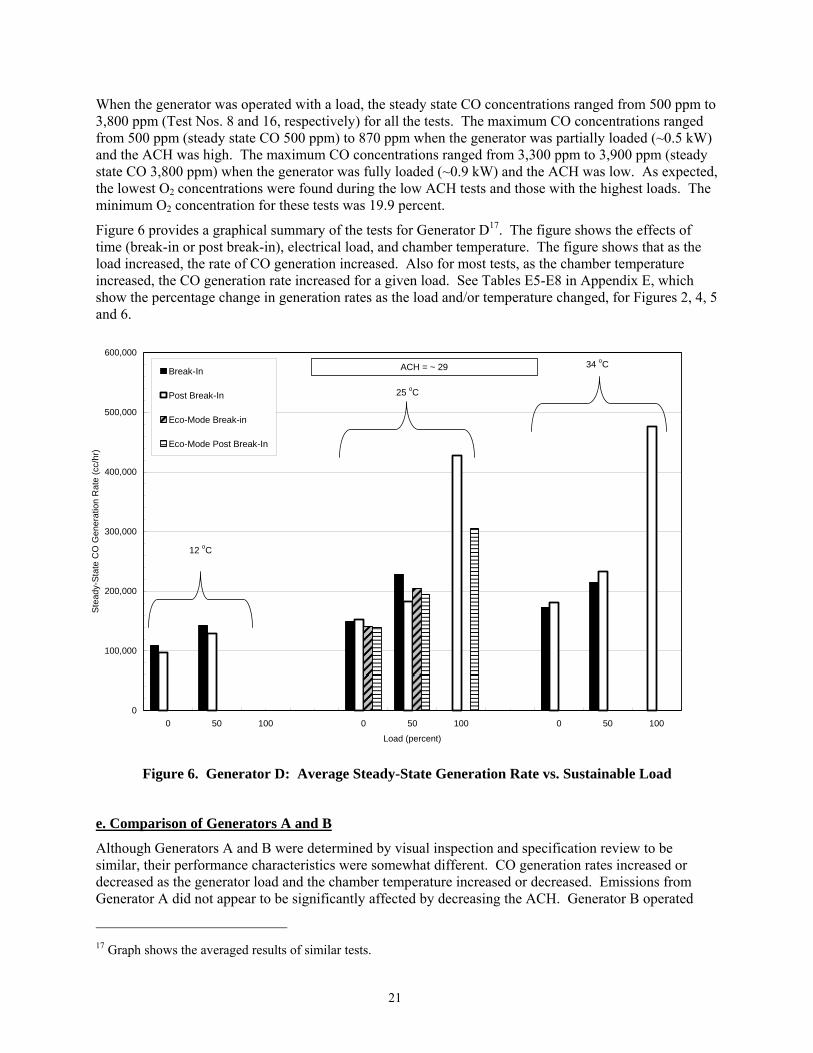
Figure 6 provides a graphical summary of the tests for Generator D17. The figure shows the effects of time (break-in or post break-in), electrical load, and chamber temperature. The figure shows that as the load increased, the rate of CO generation increased. Also for most tests, as the chamber temperature increased, the CO generation rate increased for a given load. See Tables E5-E8 in Appendix E, which show the percentage change in generation rates as the load and/or temperature changed, for Figures 2, 4, 5 and 6.
0
100,000
200,000
300,000
400,000
500,000
600,000
0 50 100 0 50 100 0 50 100
Load (percent)
Ste
ady-
Stat
e C
O G
ener
atio
n R
ate
(cc/
hr)
Break-In
Post Break-In
Eco-Mode Break-in
Eco-Mode Post Break-In
25 oC
34 oCACH = ~ 29
12 oC
Figure 6. Generator D: Average Steady-State Generation Rate vs. Sustainable Load
e. Comparison of Generators A and B
Although Generators A and B were determined by visual inspection and specification review to be similar, their performance characteristics were somewhat different. CO generation rates increased or decreased as the generator load and the chamber temperature increased or decreased. Emissions from Generator A did not appear to be significantly affected by decreasing the ACH. Generator B operated
17 Graph shows the averaged results of similar tests.

22
much the same as Generator A, except that emissions from Generator B did appear to be significantly affected by changing the ACH; it sustained a higher maximum load, and the CO emissions were significantly higher than Generator A’s at full load. As shown in Figure 7, despite having identical maximum rated loads of 5.5 kW, the CO generation rates for Generator B were lower than those of Generator A, until Generator B was fully loaded. Generator B was also able to sustain an approximate 4.6 kW load18 without the breaker tripping, while Generator A could sustain only a maximum load of approximately 4.0 kW (4.4 kW in two preliminary tests) during the tests described in this report. Generator A’s maximum sustainable load was approximately 72-79 percent of its rated load, while Generator B’s maximum sustainable load was approximately 84 percent of its rated load. This comparison shows that similar generators may have significantly different emission rates under similar operating conditions.
0
250,000
500,000
750,000
1,000,000
1,250,000
1,500,000
1,750,000
2,000,000
0 60 100
Load (percent)
Stea
dy S
tate
CO
Gen
erat
ion
Rat
e (c
c/hr
)
Post Break-InChamber Temperature ~ 25 oCAir Exchange Rate ~ 29 ACH
Generator AGenerator B
Figure 7. Comparison of the Steady State CO Generation Rate vs. Sustainable Load for
Generators A and B
f. Comparison of Generators A, B, C and D
As shown in Table 4, CO emission rates of the four test generators were compared based on the ratio of CO generated per kW-hr (CO emissions as a function of power generated). Only post break-in tests are shown in Table 4, Figure 8 and Figure 9. Generator D tests performed with the generator eco-mode turned “on” are not presented. Where possible, duplicate test results are presented as averaged values.
18 Test not included in tables. No generation rate available due to CO exceeding analyzer range.
23
Comparisons presented in Table 4 and Figures 8 and 9 take temperature, load, and accumulated run time into account for each generator. The O2 concentration at steady state is not taken into account in the tables. As discussed earlier, for Generators C and D, generation rates did not appear to be affected by the O2 concentration at which tests were conducted. The CO generation rate for Generator B did appear to be affected by the O2 concentration during some tests. Generator A is similar to Generator B; although no O2 depletion effect was discerned for Generator A, the effect may still be present.
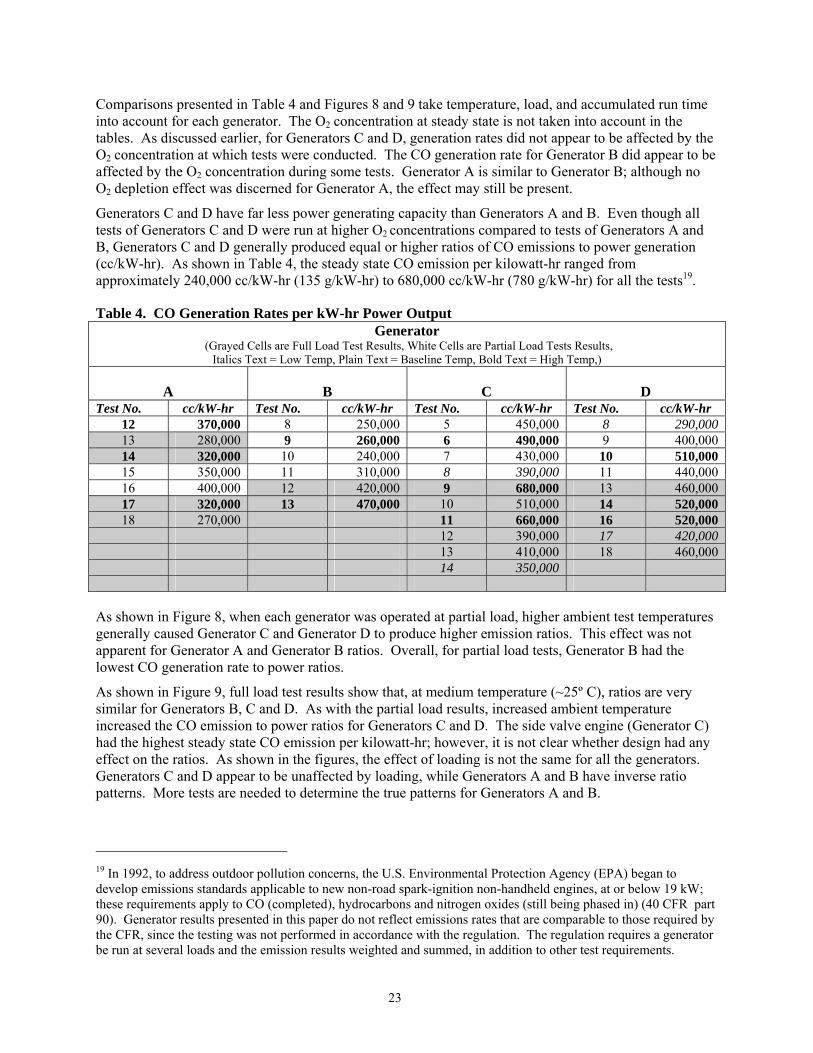
Generators C and D have far less power generating capacity than Generators A and B. Even though all tests of Generators C and D were run at higher O2 concentrations compared to tests of Generators A and B, Generators C and D generally produced equal or higher ratios of CO emissions to power generation (cc/kW-hr). As shown in Table 4, the steady state CO emission per kilowatt-hr ranged from approximately 240,000 cc/kW-hr (135 g/kW-hr) to 680,000 cc/kW-hr (780 g/kW-hr) for all the tests19.
Table 4. CO Generation Rates per kW-hr Power Output Generator
(Grayed Cells are Full Load Test Results, White Cells are Partial Load Tests Results, Italics Text = Low Temp, Plain Text = Baseline Temp, Bold Text = High Temp,)
A B C D Test No. cc/kW-hr Test No. cc/kW-hr Test No. cc/kW-hr Test No. cc/kW-hr
12 370,000 8 250,000 5 450,000 8 290,000 13 280,000 9 260,000 6 490,000 9 400,000 14 320,000 10 240,000 7 430,000 10 510,000 15 350,000 11 310,000 8 390,000 11 440,000 16 400,000 12 420,000 9 680,000 13 460,000 17 320,000 13 470,000 10 510,000 14 520,000 18 270,000 11 660,000 16 520,000 12 390,000 17 420,000 13 410,000 18 460,000 14 350,000
As shown in Figure 8, when each generator was operated at partial load, higher ambient test temperatures generally caused Generator C and Generator D to produce higher emission ratios. This effect was not apparent for Generator A and Generator B ratios. Overall, for partial load tests, Generator B had the lowest CO generation rate to power ratios.
As shown in Figure 9, full load test results show that, at medium temperature (~25º C), ratios are very similar for Generators B, C and D. As with the partial load results, increased ambient temperature increased the CO emission to power ratios for Generators C and D. The side valve engine (Generator C) had the highest steady state CO emission per kilowatt-hr; however, it is not clear whether design had any effect on the ratios. As shown in the figures, the effect of loading is not the same for all the generators. Generators C and D appear to be unaffected by loading, while Generators A and B have inverse ratio patterns. More tests are needed to determine the true patterns for Generators A and B.
19 In 1992, to address outdoor pollution concerns, the U.S. Environmental Protection Agency (EPA) began to develop emissions standards applicable to new non-road spark-ignition non-handheld engines, at or below 19 kW; these requirements apply to CO (completed), hydrocarbons and nitrogen oxides (still being phased in) (40 CFR part 90). Generator results presented in this paper do not reflect emissions rates that are comparable to those required by the CFR, since the testing was not performed in accordance with the regulation. The regulation requires a generator be run at several loads and the emission results weighted and summed, in addition to other test requirements.

24
0
100,000
200,000
300,000
400,000
500,000
600,000
700,000
800,000
Gen A Gen B Gen C Gen D
Gen
erat
ion
Rat
e (c
c/kW
-hr)
Low (~12) Medium (~25) High (~34)
Figure 8. Comparison of the CO Generation Rates per kW-hr Power Output at Partial Load for Test Generators while Accounting for Ambient Test Temperature
0
100,000
200,000
300,000
400,000
500,000
600,000
700,000
800,000
Gen A Gen B Gen C Gen D
Gen
erat
ion
Rat
e (c
c/kW
-hr)
Low (~12) Medium (~25) High (~34)
Figure 9. Comparison of the CO Generation Rates per kW-hr Power Output at Full Load for Test Generators while Accounting for Ambient Test Temperature

25
7. RESULTS AND OBSERVATIONS SUMMARY CPSC staff conducted testing of four gasoline engine-driven portable generators (designated A, B, C and D) to determine the rates at which the generators produced carbon monoxide (CO) under various operating conditions. Generators A and B were the largest generators and had the greatest electric generating capacity; both had continuous (nameplate) ratings of approximately 5.5 kW. Generators C and D had continuous (nameplate) electric generating capacities of 1.5 kW and 0.9 kW, respectively.
Several variables were considered during the CPSC staff tests: the air exchange rate, the electrical load on the generator, the chamber temperature, and the accumulated engine run time prior to a test (i.e., break-in versus post break-in). Staff conducted testing in a 9.59 m3 chamber, with air exchange rates ranging from approximately 20 to 29 for Generators A and B, and from 13 to 29 for Generators C and D. Nominal temperatures in the test chamber ranged from 25ºC (77ºF) to 34ºC (93ºF) for Generators A20 and B, and from 10ºC (50ºF) to 34ºC (93ºF) for Generators C and D.
For most tests, staff operated a generator under a no-load condition at the beginning of the test, followed by either a partial or a full load condition for the remainder of the test. Generator A’s maximum sustainable load was approximately 72-79 percent of its rated load21. Generator B’s maximum sustainable load was approximately 84 percent of its rated load. Generators C and D were able to operate at their maximum rated loads, as tested. Tables 5 and 6 summarize the results of the generator tests.
Table 5: Summarized Steady State Results for the Generators Operated With No Load
CO Generation Rate Chamber CO Concentration
O2 Most Influential Variable
Minimum (cc/hr)
Maximum (cc/hr)
Minimum (ppm)
Maximum (ppm)
Minimum (%)
Generator A 550,000 780,000 2,200 4,000 19.7 temperature
Generator B 330,000 620,000 1,100 3,100 19.7 indeterminate
Generator C 220,000 380,000 830 3,200 20.1 temperature
Generator D 100,000 190,000 370 1,500 20.4 temperature
Table 6: Summarized Steady State Results for the Generators Operated With a Partial or Full Load
CO Generation Rate Chamber CO Concentration
O2 Most Influential Variable
Minimum (cc/hr)
Maximum (cc/hr)
Minimum (ppm)
Maximum (ppm)
Minimum (%)
Generator A 910,000 1,300,000 3,400 5,900 19.2 load
Generator B 540,000 >2,100,000 2,000 >7,400 19.2 load
Generator C 330,000 810,000 1,300 6,400 19.2 load
Generator D 130,000 480,000 500 3,800 19.9 load
20 With the exception of several preliminary tests, Generators A and B were tested only at baseline (25ºC) and high (34 ºC) temperatures since, while operating Generator A with no load, the lowest chamber temperature that could be sustained was approximately 16oC. 21 The “rated load” is the manufacturer’s designated maximum load at which the generator can operate continuously.
26
Generally, electrical loading of the generators caused the greatest increases in CO generation rates compared to other variables. CO generation rates ranged from approximately 100,000 cc/hr to over 2 million cc/hr. Increased temperature in the operating environment and, thus, the engine also often appeared to cause the CO generation rates to increase. Temperature most frequently appeared to be second to the applied load as the most influential variable, within the range of the test variables. In some tests with reduced air exchange rate, it appeared that the reduced O2 concentration (due to consumption during combustion) may have affected CO production. More tests need to be run at lower O2 concentrations and in an open outdoor area, with normal ambient O2 concentrations, to determine whether any O2 depletion effect or synergistic temperature/ O2 effect exists.
Temperature was found to increase the ratio of CO emissions to power generation rate (cc/[kW-hr]) for Generators C and D. The steady state CO emission per kilowatt ranged from approximately 240,000 cc/kW-hr (135 g/kW-hr) to 680,000 cc/kW-hr (781 g/kW-hr).
When operated with a full load or partial load, all of the generators tested were capable of producing potentially lethal CO concentrations. The worst case presented in this report had a calculated CO generation rate greater than 2,100,000 cc/hr.
27
ACKNOWLEDGMENTS
Contributors: David Tucholski, Warren Porter, Janet Buyer, James Hyatt, Sandy Inkster, Susan Carlson, Les Sparks (EPA), Hugh McLaurin, and Andrew Stadnik
Design and Construction of Test Chamber: Thomas Hardison, Mark Eilbert, Perry Sharpless and Duncan Snyder
Programming: Dean LaRue
REFERENCES Brown, C.J. (2004, July 15). Engine Driven Tools Project: Preliminary Generator Results.
[Memorandum]. Gaithersburg, MD: U.S. Consumer Product Safety Commission Brown, C.J. (2004a, July). Medium Sized Combustion Chamber System Characterization Tests.
Gaithersburg, MD: U.S. Consumer Product Safety Commission Brown, C.J., Jordan, R.A., & Tucholski, D.R. (2000). Furnace CO Emissions Under Normal and
Compromised Vent Conditions, Furnace #1 Draft Hood Equipped. Bethesda, MD: U.S. Consumer Product Safety Commission
Buyer, J. (2004, July). Test Program for Engine- Driven Tools Project and Phase 1 Test Plan. Bethesda,
MD: U.S. Consumer Product Safety Commission Buyer, J., Carlson, S., Inkster, S., Donaldson, M., Brown, C.J. (2004, May 20) Developing New Strategies
for Portable Generator Safety, [Staff Forum; PowerPoint Presentation]. Bethesda, MD: U.S. Consumer Product Safety Commission
Donaldson, M. (2004, April 12). Portable Generators. [Memorandum] Bethesda, MD: U.S. Consumer
Product Safety Commission Grot, R. & Lagus, P. (1991). Application of Tracer Gas Analysis to Industrial Hygiene Investigations.
Olney, MD; Lagus Applied Technology, Inc. Inkster, S. (2004, September 21). Health hazard assessment of CO poisoning associated with emissions
from a portable, 5.5 kilowatt, gasoline-powered generator. [Memorandum]. Bethesda, MD: U.S. Consumer Product Safety Commission;
Marcy, N.E., Ascone, D.S. (2005, December 1). Incidents, Deaths, and In-Depth Investigations
Associated with Carbon Monoxide and Engine Driven Tools, 1990-2004. [Memorandum] Bethesda, MD: U.S. Consumer Product Safety Commission
Nagada, N.L., Rector, H.E., & Koontz, M.D. (1987). Guidelines for Modeling Indoor Air Quality. New
York, NY: Hemisphere Publishing Corporation. NIOSH, CDPHE, CPSC, OSHA, & EPA. (1996). ALERT: Preventing Carbon Monoxide Poisoning
from Small Gasoline-Powered Engines and Tool. DHHS (NIOSH) Publication No. 96-118. [Retrieved Online] September 17, 2004 [http://www.cdc.gov/niosh/carbon2.html].
Porter, Jr. W.K. (2000, September 1). Indoor Air Modeling for Furnace #1 with Blocked or
Disconnected Vents. Bethesda, MD: U.S. Consumer Product Safety Commission

28
Porter, Jr. W.K. (2001) Personal communications with W. Porter, CPSC Laboratory Sciences, “Emission
Rate Calculation and Indoor Air Modeling,” [PowerPoint Presentation]. Gaithersburg, MD: U.S. Consumer Product Safety Commission
Porter, Jr. W.K. (2004, March 25) Personal communication with S. Inkster, CPSC Health Sciences,
regarding modeled CO Concentrations from engine-powered generators. Bethesda, MD: U.S. Consumer Product Safety Commission
Smith, T. (2004, March). Personal communication with J. Buyer, CPSC Engineering Staff, regarding
typical run modes for engine-powered generators. Bethesda, MD: U.S. Consumer Product Safety Commission
U.S. Environmental Protection Agency. (2005, July 1). Title 40 U.S. Code: Protection of the
Environment, Part 90, Subpart B, Section 103; Control of Emissions from Nonroad Spark-Ignition Engines at or Below 19 Kilowatts. [Retrieved Online] December 16, 2005. GPO Access. [http://www.access.gpo.gov/nara/cfr/waisidx_05/40cfr90_05.html].
U.S. Environmental Protection Agency, (1997). Exposure Factors Handbook, Vol. III, Activity Factors,
Ch. 17, Residential Building Characteristics. EPA/600/P-95-002Fa. Washington, D.C.

30
APPENDIX A: ENGINE DRIVEN TOOLS PROJECT: PRELIMINARY GENERATOR RESULTS (MEMORANDUM)

31
Date: February 8, 2006
TO : Janet Buyer, Mechanical Engineer, Division of Engineering Sciences THROUGH : Andrew G. Stadnik, P.E., Associate Executive Director, Directorate for Laboratory
Sciences
THROUGH : James C. Hyatt, P.E., Director, Division of Mechanical Engineering
FROM : Christopher J. Brown, Mechanical Engineer, Division of Mechanical Engineering
SUBJECT : Engine Driven Tools Project: Preliminary Generator Results
1. INTRODUCTION This memorandum1, 2 transmits the results from initial generator tests conducted on one generator. The test conditions are listed in the U.S. Consumer Product Safety Commission (CPSC) staff document, "Test Program for Engine Driven Tools Project and Phase I Test Plan" (referred to later in this memorandum as the test plan).2 Not all of the test conditions listed in the test plan were applied to the generator. This memorandum also provides the initial test data used by CPSC staff to predict the potential health effects from consumer exposure to the carbon monoxide (CO) emissions similar to those from the generator that was tested.3 In addition, this memorandum documents some of the Medium-Sized Chamber’s (M-Chamber) capabilities and limitations that will affect the scope of the remainder of the generator testing identified in the test plan. A final report will be written that includes results of all tests identified in the test plan for the four generators described in the test plan. This memorandum is not intended to comprehensively describe the project or the scope of testing.
2. TEST FACILITY AND GENERATOR DESCRIPTIONS Staff conducted the tests in CPSC’s M-Chamber, which has a net internal volume of 9.59 m3 (339 ft3) and is used to test combustion appliances. The chamber can attain a maximum air exchange rate of approximately 30 air changes per hour (ACH).4 The temperature in the chamber is controlled through heat removal, which is accomplished by passing chilled water through two ceiling mounted fin-and-tube heat exchangers. The chamber is instrumented to measure chamber concentrations of CO, carbon dioxide (CO2), oxygen (O2), and hydrocarbons (HC) using commercially available non-dispersive infrared (NDIR) and paramagnetic gas analyzers. For a detailed description of the chamber, its operations, associated systems, air exchange rate and chamber volume calculations, please refer to the CPSC staff 1 This analysis was prepared by the CPSC staff, has not been reviewed or approved by, and may not necessarily reflect the views of, the Commission. 2 This document was reviewed in draft form by peer reviewers within the U.S. government, and incorporates their comments. 3 Inkster, S. (2004). Health hazard assessment of CO poisoning associated with emissions from a portable, 5.5 kilowatt, gasoline-powered generator. [Memorandum]. U.S. Consumer Product Safety Commission; Bethesda, MD. It must be noted that the CO generation rates presented in this memorandum do not exactly match those used in the health assessment. This is because the rates used in the health assessment represent the averages of several tests. Since the initial health assessment, the CO generation rate procedures were refined to more accurately represent the steady state CO generation rates. The specific generation rates derived for a 5.5 kilowatt generator that were used in the health assessment are: no load - 676604 cc/hr, partial load - 1,017,576 cc/hr, full load - 1,182,518 cc/hr. They were provided to S. Inkster (HS) by W. Porter (LS), March 25, 2004 4 An air exchange rate of 30 ACH in the 9.59 m3 chamber is equivalent to an air exchange rate of approximately 0.85 ACH in a 1500 ft2 house with 8-foot ceilings (12,000 ft3).

32
report "Medium-Sized Combustion Chamber System Characterization Tests5." An adjustable resistive load bank was used to load the generator. Generator output voltage and current, as well as engine oil sump temperature, were recorded. The generator, identified in the test plan as Generator A, is described in Table 1 below. Table 1. Portable Generator Description
Engine AC Output Fuel Dry Weight
• 10 HP • Single-cylinder • Overhead valve • Air-cooled • 4-stroke
• 8.55 kW (max surge) • 5.55 kW (rated continuous) • 60 hertz • 120/240 Volts
• gasoline • 87-octane • 18.9 L tank/ (5 gallon)
• 67.1 kg /148 lbs
3. TEST METHODS AND PROCEDURES At the start of each day, each gas analyzer was calibrated according to the instructions specified by the manufacturer of the analyzer. In general, the gas analyzers were zeroed with nitrogen gas and spanned using a certified EPA calibration gas of known concentration. The analyzers were also checked at mid- and low-range concentrations to verify their performance.
Prior to any testing, locally purchased 87-octane gasoline was put in the gas tank and synthetic 5W-30 oil was added to the oil reservoir, per the manufacturer’s instructions. To begin a generator test, the air exchange rate was adjusted to the desired setting. Then, the generator was manually started and the door to the chamber was closed. After operating the generator with no load, the generator was either allowed to continue operating with no load for a longer period of time, or the generator was loaded to approximately 60 percent (partial) or to the maximum load it could sustain without tripping the generator’s breaker on the 240-volt receptacle (100 percent or full load). Electrical loading was performed with an adjustable-capacity resistive load bank located adjacent to the M-chamber. Once loaded, the generator was operated until the gas concentrations achieved equilibrium. Normally after reaching equilibrium, the generator was allowed to remain at equilibrium for at least 10 minutes. Finally, the load was removed (if loaded), and the generator was shut off using a remote toggle switch that paralleled the existing generator shut-off system. The shut-off switch shorted the generator’s ignition system to ground. The CO decay within the chamber was then recorded to allow for calculation of the air exchange rate. After the test was completed, the data was reduced to determine the equilibrium concentrations of CO, O2, CO2, and HC. In addition, the CO generation rate and the air exchange rate were also calculated. The full load condition had to be determined experimentally since during testing it was determined that the generator could not sustain the stated continuous rated load capacity without tripping its breaker. This tripping resulted in termination of the generator’s power output. Therefore, some of the early full load tests were repeated with a reduced load to determine the maximum sustainable load. The full load test condition where tripping did not occur tended to be approximately 87 percent (as determined by the load bank settings6) of the rated load. The loading for the 50 percent test condition, as defined by the test plan, was intended to be 50 percent of the rated load. Using this criterion as the standard for loading the
5 Brown, C.J. (2004, July). Medium Sized Combustion Chamber System Characterization Tests. Bethesda, MD; U.S. Consumer Product Safety Commission 6 The actual load delivered by the generator was not measured at this time. Load will be directly measured for the Phase I project tests.

33
generator, initial 50 percent of the maximum rated load tests actually resulted in a loading that was approximate 60 percent of the experimentally-determined full load condition. Nine preliminary tests were completed. Staff tested using test conditions No. 1 and 3 from Table 2, and Nos. 7, 13, 15, and 17 from Table 3 of the test plan. The corresponding test plan tests are also identified in the second column of Table 2 and Table 3 in the Generator Test Results section of this memorandum.
4. DATA ANALYSIS CO Generation rate:
The CO generation rate was calculated from a simple mass balance of the CO in the chamber. The expressions for the generation rate shown in Equation 1 is derived based on the following assumptions: (a) the air in the chamber is well mixed, (b) CO does not get absorbed inside the chamber, (c) the background concentration of CO is near zero, and (d) the initial concentration of CO is near zero. See the M-Chamber report for the derivation of the equations and associated references.
Equation 1 can be applied between any two time intervals (ti and ti+1) to obtain the generation rate. This equation provides results that represent the average weighted generation rate over a chosen interval.
⎥⎥⎥
⎦
⎤
⎢⎢⎢
⎣
⎡ −+−−
⎥⎥
⎦
⎤
⎢⎢
⎣
⎡ −+−−
+=
+ ⎟⎟
⎠
⎞⎜⎜
⎝
⎛
⎟⎠⎞
⎜⎝⎛
ititke
ititke
itC
itCVk
itS
11
11
1 (1)
where, St(i+1) = the generation rate of CO at time ti+1 V = the volume of the chamber k = the air exchange rate Ct(i+1) = the concentration of CO at time ti+1, and Ct (i) = the concentration of CO at time ti
5. GENERATOR TEST RESULTS Tests were performed to determine how the CO generation rate was influenced by the load applied to the generator. Test Nos. 4, 6, and 8, when the full rated load was applied, resulted in unexpected tripping of the generator's breakers causing termination of the generator’s power output. These tests helped determine the nominal maximum current capacity of the generator that will be used for the remainder of the test conditions with maximum sustainable (100 percent) load for this generator. The generator was able to sustain a 4.8 kW maximum applied load, but not the rated 5.55 kW load. Thus, the 50 percent rated load specified in the test plan would actually be approximately 60 percent of the actual full load applied to the generator.
Table 2 below describes the test parameters and Table 3 below summarizes the test results. During test No. 2, the generator was intentionally shut down before equilibrium was reached due to high background CO levels in the operator's workspace. Possible leaks in the chamber were sealed before testing was continued; subsequent tests had much lower background CO concentrations. All tests were conducted with a maximum chamber air exchange rate of approximately 29 air changes per hour (ACH). It was determined from these tests that test conditions with reduced ACH and cold chamber temperature could not be conducted due to gas analyzer and chamber cooling system limitations.

34
Table 3 lists the generation rates calculated for each test. The steady state generation rate is calculated using recorded concentration data at approximately 30 seconds intervals after equilibrium conditions were achieved in the chamber. The maximum generation rate reported in the "Maximum" column of Table 3 is the maximum calculated value from all the data acquired during that test. Table 2. Test Parameters
Load ACH Decay Test No.
Test Conditions Percent Load-ACH-
Temp (Test Plan Table
No./Condition No.)
Engine Run Time (min)
Amps Applied
(per load bank setting)
Receptacle Load
Applied (VAC)
Kilowatts Applied
CO (h-1)
SF6 (h-1)
1 0-H-BT (2/ 1) 31 0 None Not Done 29.1 Not Done 2 0-H-CT (2/3) 10 0 None Not Done Not Avail Not Done 3 0-H-CT (2/3) 34 0 None Not Done 28.4 Not Done 4 100-H-BT (3/13) 11 23 240 5.5 28.6 Not Done 5 60-H-BT (3/7) 23 11.5 240 2.8 29.1 Not Done 6 100-H-BT (3/13) 31 23 240 5.5 28.9 Not Done 7 87-H-BT (3/13) 30 20 240 4.8 29.1 Not Done 8 96-H-HT (3/17) 68 22 240 5.3 28.7 28.84 9 87-H-CT (3/15) 36 20 240 4.8 28.5 Not Done
• Percent Load: 0 = no load, 100 = 22 to 23 amps, @ 240 Volts • ACH: H= 29 • Temp: BT= baseline temp (25OC); HT= hot temp (34oC); CT= cold temp (4oC or lower desired) - SETPOINT Table 3. Preliminary Generator Test Results and Calculated Generation rates
Measured Values Calculated Generation rates Test No.
Test Conditions Percent Load-ACH-
Temp (Test Plan Table No./Condition No.)
CO Steady State 1 (ppm)
Reached Steady State
O2
Min (%)
CO2 Max (%)
Avg Temp (oC)
Maximum (cc/hr)
Average at Steady State
(cc/hr)
1 0-H-BT (2/ 1) 2,200 Yes 19.7 0.40 23 680,000 620,000 2 0-H-CT (2/3) 1,900 No –
manual shut off
19.7 0.40 14 NA NA
3 0-H-CT (2/3) 2,700 Yes 19.7 0.36 16 800,000 740,000 4 100-H-BT (3/13) 5,000 No-
breaker tripped
19.0 0.77 25 1,400,000 1,400,000
5 60-H-BT (3/7) 4,100 Yes 19.6 0.60 25 1,200,000 1,200,000 6 100-H-BT (3/13) 5,900 Yes &
breaker tripped
19.3 0.72 26 1,700,000 1,700,000
7 87-H-BT (3/13) 4,600 Yes 19.4 0.73 25 1,300,000 1,300,000 8 96-H-HT (3/17) 5,400 Yes &
breaker tripped
19.4 0.85 31 1,600,000 1,500,000
9 87-H-CT (3/15) 4,400 Yes 19.4 0.82 19 1,400,000 1,200,000 1. Max CO presented in table when steady state not achieved due to breaker tripping. Figure 1 below is provided as an example of some of the data obtained during a test. Figure 1 is a plot of the CO and O2 concentration profiles measured during test No. 7. Between 0 and 4 minutes, background levels of CO and SF6 were collected, the analyzer concentrations and scale factors were confirmed, and laboratory conditions were recorded. At approximately 4 minutes, the generator was started. From 4 minutes to 13 minutes, the generator was operated with no load applied. At approximately 13 minutes, a load of 20 amps was applied to the generator's 240-volt receptacle. At 33 minutes, the load was removed. At 35 minutes, the generator was turned off. From 35 minutes to 48 minutes, the CO decayed from the chamber and this data was used to determine the air exchange rate.

35
Figure 1: Typical Generator Test Curve
6. CONCLUSION CPSC staff conducted preliminary tests with one gasoline engine-driven generator to determine the rates at which the generator produced CO under several different operating conditions. This data (see page 1, footnote 3) was used by staff for modeling CO exposure rates, to supplement the test plan and M-Chamber report data for peer review of the test program, and to refine the scope of further generator testing. As the load increased, the CO generation rate increased. For all tests, the average CO generation rates, at steady state, ranged from approximately 620,000 cc/hr to more than 1,700,000 cc/hr.
The maximum CO generation rate that the M-Chamber sample system can measure is approximately 2,200,000 cc/hr7. Under certain test conditions, some generators will produce CO in excess of this rate. The M-Chamber and the associated test systems appear well suited to measure the expected concentrations of most of the products that are expected to be tested in the chamber. They are not fully suited to measure the concentrations of some generators when tested under the full range of test conditions that could be applied. There were two noticeable issues: (1) temperatures below 13.6º C (57º F) could not be attained with this size generator, and (2) the ACH had to be high (29h-1) for CO concentrations to not exceed analyzer range and lab safety guidelines. Both issues limited testing. For purposes of determining the maximum generation rate for the generators under all test conditions, including low ACH or low temperature, the test systems are not as robust as desired. A larger chamber and/or an extended analyzer range would make the system more suitable for measuring the maximum CO concentrations, and generation rates from generator testing under all potential test conditions. However, 7 This maximum was determined using the maximum ACH that can be maintained by the system and the CO value that can be measured by the laboratory analyzers.
Generator No. 1, 5500 W:
Test # 7- Air Exchange Rate =29.1 ACH, Average Load = 20 AMPS/4800W
0
400
800
1200
1600
2000
2400
2800
3200
3600
4000
4400
4800
4.00 8.00 12.00 16.00 20.00 24.00 28.00 32.00 36.00 40.00 44.00 48.00 Time (min)
CO
(ppm
)
19.0
19.2
19.4
19.6
19.8
20.0
20.2
20.4
20.6
20.8
21.0
O2 (%
),
CO O2Generator Shut Off Manually

36
some of the extreme test conditions may remain unfeasible due to laboratory safety concerns. For purposes of determining severe health risks associated with generators, the M-Chamber and associated test systems are sufficient.
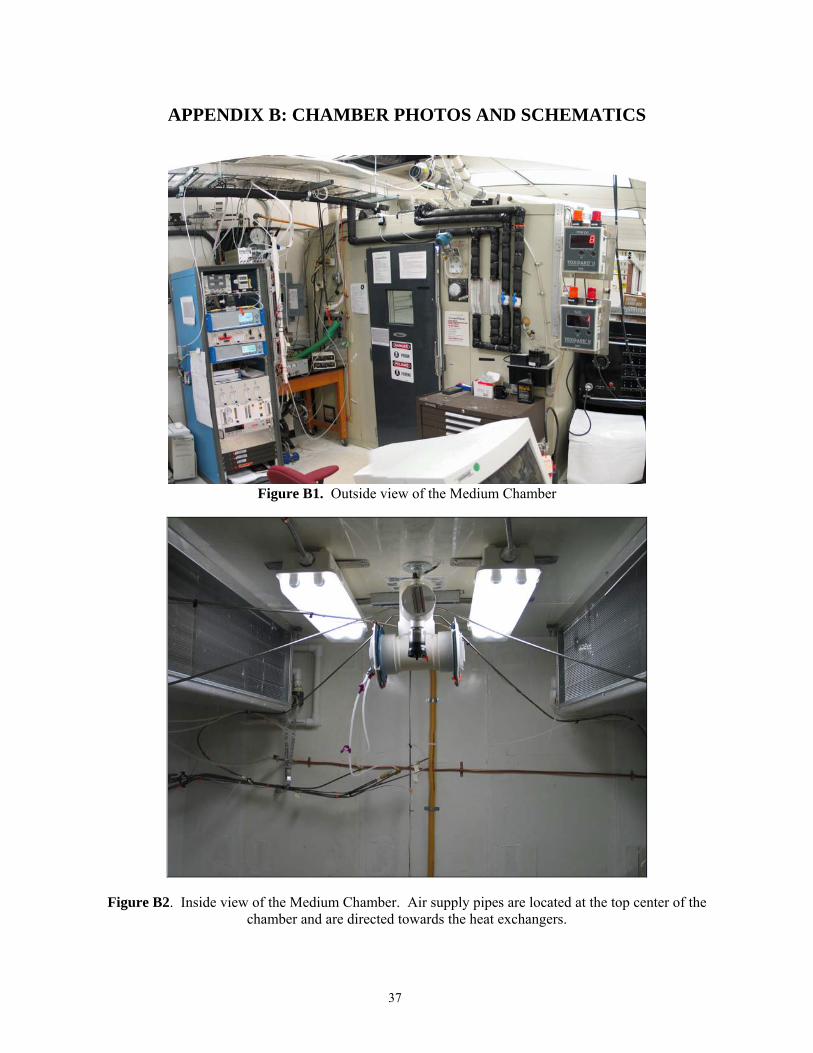
37
APPENDIX B: CHAMBER PHOTOS AND SCHEMATICS
Figure B1. Outside view of the Medium Chamber
Figure B2. Inside view of the Medium Chamber. Air supply pipes are located at the top center of the chamber and are directed towards the heat exchangers.

38
CHAMBER
SAMPLE
CHAMBER
COLD TRAP
Recirculation
Recirculation
Calibration Gas
RecirculatingChiller
Rotamet er Mass FlowMeter
NeedleValve
3-WayValve
Pump Coalescing Filter
BACKGROUND SAMPLE
EXHAUSTRIGHT
EXHAUSTLEFT
Recirculating Chiller
HCCO O2
To Exhaust Vent
SF6
MLT 4 ANALYZER *
COLD TRAP
CO2 CO
MLT 3 ANALYZER
Figure B3. Medium-Chamber gas sampling system

39
Figure B4. Medium Chamber – Schematic
B
A
4 3 2 1
B
A
4 3 2 1
ANSI
Seattle
Default Project
Def Proj 1
United States Consumer Product SafetyCommission
Engineering Laboratory10901 Darnestown Rd.
Gaithersburg, MD 20878
ristopher J. Brown, ME
December 17, 2003
Laboratory Sciences Engineering Division: Combustion Projects - 23335
One Zone Combustion Chamber for the Testing of Unvented AppliancesHeat Exchanger Mounting
SIZE FSCM NO DWG NO REV
A 1 - New Chamber A
SCALE 1 : 1 SHEET 1 OF 1
14" 14"
Top View
Weight Bearing Unistrut - (Or Comparable)
Right Side
Heat Exchangers
Water Pipes
Water Pipes
Front Door
AIR FLOW DIRECTION
AIR FLOW DIRECTION
Front View
4' 4"
1" 3"
1'
7' 1"
Room:8.0"X
5'11"
Room:8 x 7'x 6'
15"
5.5”
Area for Appliance
Area for Appliance
Area for Appliance
5"
8'
6'
7'
9"
1'
Ø4”
Ø4”
4"5"
Lights Supply Air & Diffuser
ExhaustPipes
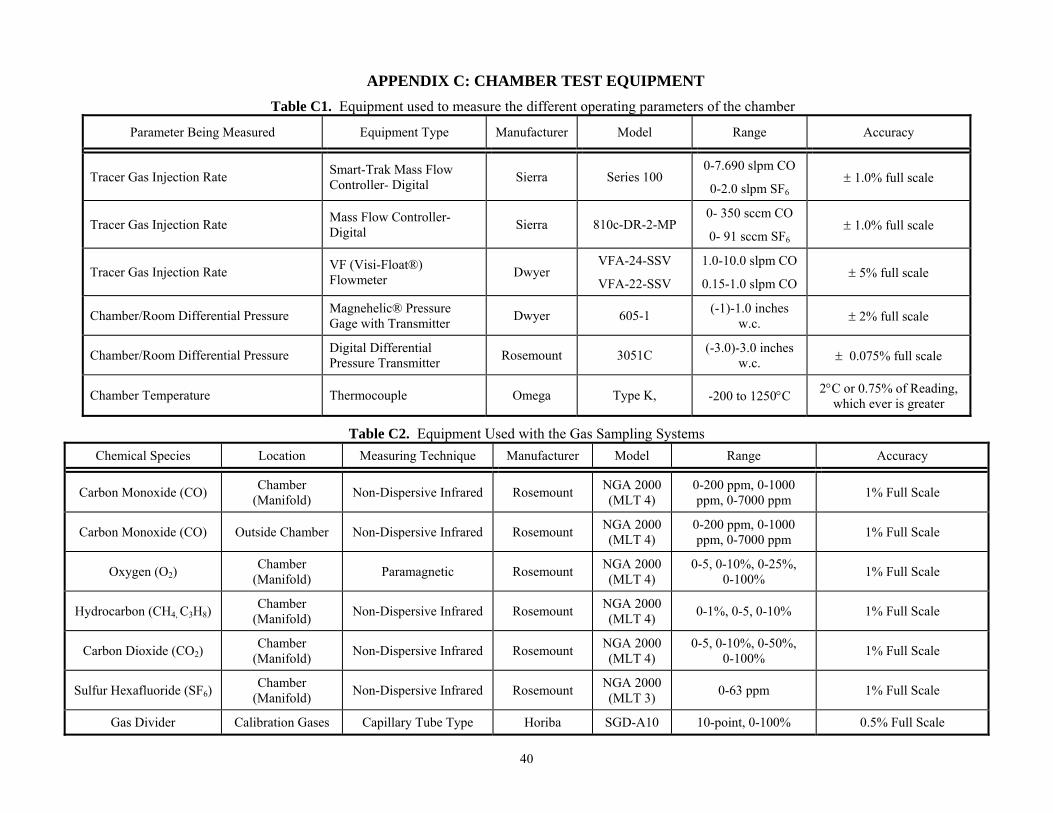
40
APPENDIX C: CHAMBER TEST EQUIPMENT Table C1. Equipment used to measure the different operating parameters of the chamber
Parameter Being Measured Equipment Type Manufacturer Model Range Accuracy
Tracer Gas Injection Rate Smart-Trak Mass Flow Controller- Digital Sierra Series 100
0-7.690 slpm CO
0-2.0 slpm SF6 ± 1.0% full scale
Tracer Gas Injection Rate Mass Flow Controller- Digital Sierra 810c-DR-2-MP
0- 350 sccm CO
0- 91 sccm SF6 ± 1.0% full scale
Tracer Gas Injection Rate VF (Visi-Float®) Flowmeter Dwyer
VFA-24-SSV
VFA-22-SSV
1.0-10.0 slpm CO
0.15-1.0 slpm CO ± 5% full scale
Chamber/Room Differential Pressure Magnehelic® Pressure Gage with Transmitter Dwyer 605-1 (-1)-1.0 inches
w.c. ± 2% full scale
Chamber/Room Differential Pressure Digital Differential Pressure Transmitter Rosemount 3051C (-3.0)-3.0 inches
w.c. ± 0.075% full scale
Chamber Temperature Thermocouple Omega Type K, -200 to 1250°C 2°C or 0.75% of Reading, which ever is greater
Table C2. Equipment Used with the Gas Sampling Systems Chemical Species Location Measuring Technique Manufacturer Model Range Accuracy
Carbon Monoxide (CO) Chamber (Manifold) Non-Dispersive Infrared Rosemount NGA 2000
(MLT 4) 0-200 ppm, 0-1000 ppm, 0-7000 ppm 1% Full Scale
Carbon Monoxide (CO) Outside Chamber Non-Dispersive Infrared Rosemount NGA 2000 (MLT 4)
0-200 ppm, 0-1000 ppm, 0-7000 ppm 1% Full Scale
Oxygen (O2) Chamber
(Manifold) Paramagnetic Rosemount NGA 2000 (MLT 4)
0-5, 0-10%, 0-25%, 0-100% 1% Full Scale
Hydrocarbon (CH4, C3H8) Chamber
(Manifold) Non-Dispersive Infrared Rosemount NGA 2000 (MLT 4) 0-1%, 0-5, 0-10% 1% Full Scale
Carbon Dioxide (CO2) Chamber
(Manifold) Non-Dispersive Infrared Rosemount NGA 2000 (MLT 4)
0-5, 0-10%, 0-50%, 0-100% 1% Full Scale
Sulfur Hexafluoride (SF6) Chamber
(Manifold) Non-Dispersive Infrared Rosemount NGA 2000 (MLT 3) 0-63 ppm 1% Full Scale
Gas Divider Calibration Gases Capillary Tube Type Horiba SGD-A10 10-point, 0-100% 0.5% Full Scale

41
APPENDIX D: DERIVATION OF EQUATIONS The following is the derivation of the equations used to calculate the air exchange rate from the tracer gas decay tests and the generation rate from the constant injection tests (Equations 1, 2 and 3 in the report).
Chamber Model
The chamber can be modeled as a 1-zone system. Figure E.1 illustrates the different flows into and out of the chamber. The chamber boundaries are displayed using a dashed line. A tracer gas is injected into the chamber (designated as Sm) and the gas concentration (C) is measured inside the chamber over time. The number of air exchanges per hour inside the chamber is controlled by the mass flow of air into (min) and out of (mout) the chamber.
Figure D1. Chamber modeled as a 1-zone system.
In Figure D1, Camb is the ambient concentration of tracer gas, C is the concentration of tracer gas in the chamber, min is the mass flow of air into the chamber, mout is the mass flow of air out of the chamber, Sm is the generation rate (i.e. injection rate), V is the volume of the chamber, and ρ is the density of air in the chamber.
Mass Balance of Tracer Gas in the Chamber
Based on Figure D1, a mass balance of the tracer gas inside of the chamber can be written as follows:
moutinamb SCmmCdtVC)d(
+−=ρ [D1]
In deriving Equation D1, the following assumptions were made: the chamber is well mixed, the chamber is of uniform density, and no adsorption or absorption of the chemical occurs inside the chamber.
Mass Balance of Air Flowing Into and Out of the Chamber
Based on Figure D1, a mass balance of the air flowing into and out of the chamber can be written as follows:
outin mmdt
V)d(−=
ρ [D2]
Assuming that the temperature, pressure, and volume are constant inside the chamber, then Equation D2 reduces to the following:
m m m 0, dt
V)d(outin ==∴=
ρ [D3]
min
C V ρ
Camb
mout Sm

42
Based on Equation D3, Equation D1 reduces to the following
mamb Sm Cm CdtdCV +−=ρ [D4]
Dividing through by ρV yields the following
VS
VmC
VmC
dtdC m
amb ρρρ+−= [D5]
Equation D5 can further be reduced by assuming that the temperature and pressure of the air entering the chamber is the same as that inside the chamber and by making the following observations
k rate exchangeair ρVm
== [D6]
Vm S basis) (volumestregnth sourceρ
S== [D7]
Therefore, Equation D5 reduces to the following:
VS
C) (Ck dtdC V
amb +−= [D8]
The general solution to the differential equation D8 is Equation D9:
⎥⎥⎥⎥
⎦
⎤
⎢⎢⎢⎢
⎣
⎡ −+−−
⎥⎥⎥
⎦
⎤
⎢⎢⎢
⎣
⎡ −+−−
+=
+⎟⎟⎟⎟
⎠
⎞
⎜⎜⎜⎜
⎝
⎛
⎟⎟⎠
⎞⎜⎜⎝
⎛
ititke
ititke
itC
itCVk
itS
11
11
1 [D9]
where, St( i+1) = the generation rate of CO at time ti+1 V = the volume of the chamber k = the air exchange rate Ct(i+1) = the concentration of CO at time ti+1, and Ct( i) = the concentration of CO at time ti
Therefore, the CO generation rate (St (i+1)) can be calculated directly from Equation D9, if the volume (V) is known, if the air exchange rate (k) is known, and if the CO concentrations (Ct (i+1) and Ct (i)) at two different times (ti+1 and ti) known.
Air Exchange Rate by Tracer Gas Decay
In the tracer gas decay tests, the tracer gas is injected into the chamber for a period of time and then stopped. The decay of the tracer gas is then monitored. Once the tracer gas injection has stopped, the generation rate is zero (Sv = 0). Therefore, equation D8 reduces to the following:
0 C) (Ck dtdC
amb +−= [D10]
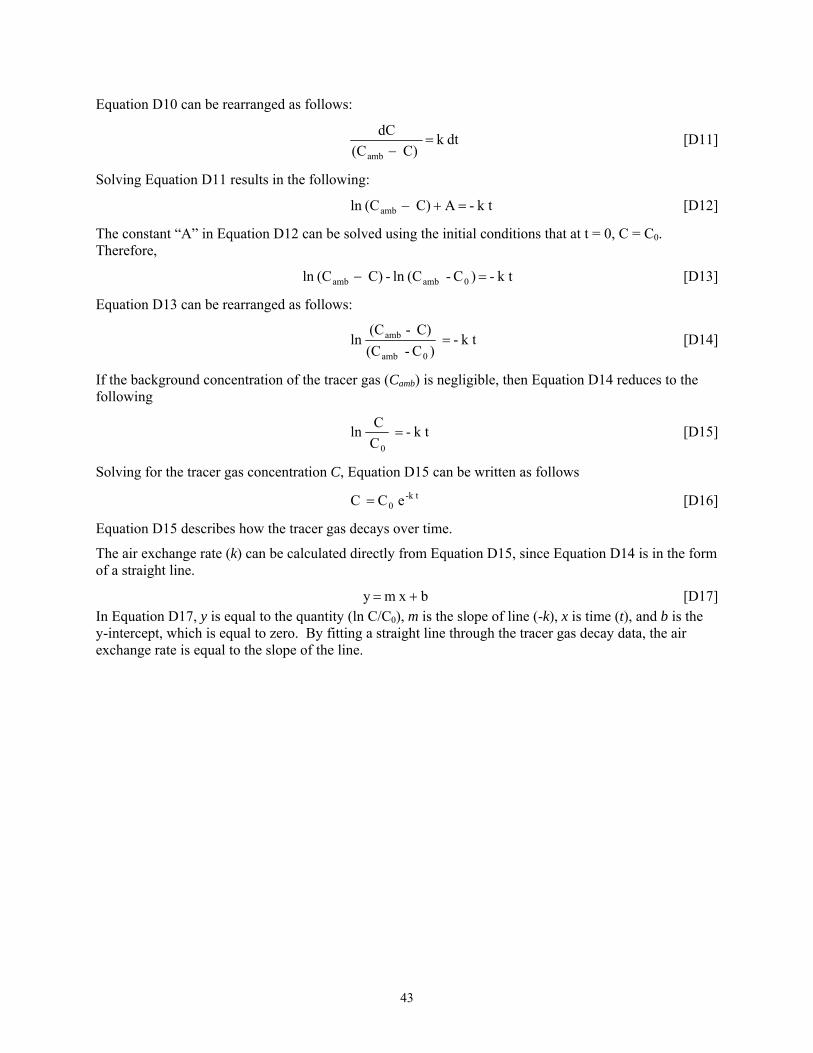
43
Equation D10 can be rearranged as follows:
dtk C) (C
dC
amb=
− [D11]
Solving Equation D11 results in the following:
k t- A C) (Cln amb =+− [D12]
The constant “A” in Equation D12 can be solved using the initial conditions that at t = 0, C = C0. Therefore,
k t- )C - (Cln - C) (Cln 0 ambamb =− [D13]
Equation D13 can be rearranged as follows:
k t- )C - (C
C) - (Cln
0 amb
amb = [D14]
If the background concentration of the tracer gas (Camb) is negligible, then Equation D14 reduces to the following
k t- C C ln
0= [D15]
Solving for the tracer gas concentration C, Equation D15 can be written as follows
e C C -k t0= [D16]
Equation D15 describes how the tracer gas decays over time.
The air exchange rate (k) can be calculated directly from Equation D15, since Equation D14 is in the form of a straight line.
b x m y += [D17] In Equation D17, y is equal to the quantity (ln C/C0), m is the slope of line (-k), x is time (t), and b is the y-intercept, which is equal to zero. By fitting a straight line through the tracer gas decay data, the air exchange rate is equal to the slope of the line.
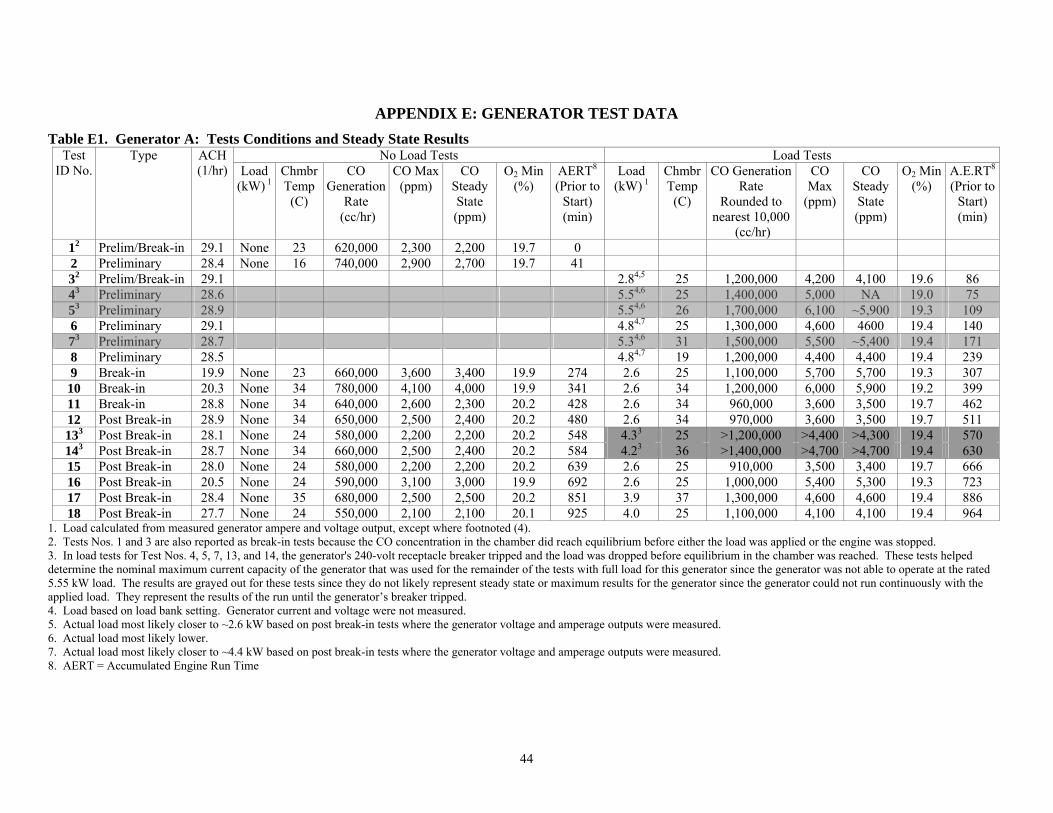
44
APPENDIX E: GENERATOR TEST DATA Table E1. Generator A: Tests Conditions and Steady State Results
No Load Tests Load Tests Test ID No.
Type ACH (1/hr) Load
(kW) 1 Chmbr Temp
(C)
CO Generation
Rate (cc/hr)
CO Max(ppm)
CO Steady State (ppm)
O2 Min (%)
AERT8 (Prior to
Start) (min)
Load (kW) 1
Chmbr Temp
(C)
CO Generation Rate
Rounded to nearest 10,000
(cc/hr)
CO Max
(ppm)
CO Steady State (ppm)
O2 Min(%)
A.E.RT8 (Prior to
Start) (min)
12 Prelim/Break-in 29.1 None 23 620,000 2,300 2,200 19.7 0 2 Preliminary 28.4 None 16 740,000 2,900 2,700 19.7 41 32 Prelim/Break-in 29.1 2.84,5 25 1,200,000 4,200 4,100 19.6 86 43 Preliminary 28.6 5.54,6 25 1,400,000 5,000 NA 19.0 75 53 Preliminary 28.9 5.54,6 26 1,700,000 6,100 ~5,900 19.3 109 6 Preliminary 29.1 4.84,7 25 1,300,000 4,600 4600 19.4 140 73 Preliminary 28.7 5.34,6 31 1,500,000 5,500 ~5,400 19.4 171 8 Preliminary 28.5 4.84,7 19 1,200,000 4,400 4,400 19.4 239 9 Break-in 19.9 None 23 660,000 3,600 3,400 19.9 274 2.6 25 1,100,000 5,700 5,700 19.3 307
10 Break-in 20.3 None 34 780,000 4,100 4,000 19.9 341 2.6 34 1,200,000 6,000 5,900 19.2 399 11 Break-in 28.8 None 34 640,000 2,600 2,300 20.2 428 2.6 34 960,000 3,600 3,500 19.7 462 12 Post Break-in 28.9 None 34 650,000 2,500 2,400 20.2 480 2.6 34 970,000 3,600 3,500 19.7 511 133 Post Break-in 28.1 None 24 580,000 2,200 2,200 20.2 548 4.33 25 >1,200,000 >4,400 >4,300 19.4 570 143 Post Break-in 28.7 None 34 660,000 2,500 2,400 20.2 584 4.23 36 >1,400,000 >4,700 >4,700 19.4 630 15 Post Break-in 28.0 None 24 580,000 2,200 2,200 20.2 639 2.6 25 910,000 3,500 3,400 19.7 666 16 Post Break-in 20.5 None 24 590,000 3,100 3,000 19.9 692 2.6 25 1,000,000 5,400 5,300 19.3 723 17 Post Break-in 28.4 None 35 680,000 2,500 2,500 20.2 851 3.9 37 1,300,000 4,600 4,600 19.4 886 18 Post Break-in 27.7 None 24 550,000 2,100 2,100 20.1 925 4.0 25 1,100,000 4,100 4,100 19.4 964
1. Load calculated from measured generator ampere and voltage output, except where footnoted (4). 2. Tests Nos. 1 and 3 are also reported as break-in tests because the CO concentration in the chamber did reach equilibrium before either the load was applied or the engine was stopped. 3. In load tests for Test Nos. 4, 5, 7, 13, and 14, the generator's 240-volt receptacle breaker tripped and the load was dropped before equilibrium in the chamber was reached. These tests helped determine the nominal maximum current capacity of the generator that was used for the remainder of the tests with full load for this generator since the generator was not able to operate at the rated 5.55 kW load. The results are grayed out for these tests since they do not likely represent steady state or maximum results for the generator since the generator could not run continuously with the applied load. They represent the results of the run until the generator’s breaker tripped. 4. Load based on load bank setting. Generator current and voltage were not measured. 5. Actual load most likely closer to ~2.6 kW based on post break-in tests where the generator voltage and amperage outputs were measured. 6. Actual load most likely lower. 7. Actual load most likely closer to ~4.4 kW based on post break-in tests where the generator voltage and amperage outputs were measured. 8. AERT = Accumulated Engine Run Time
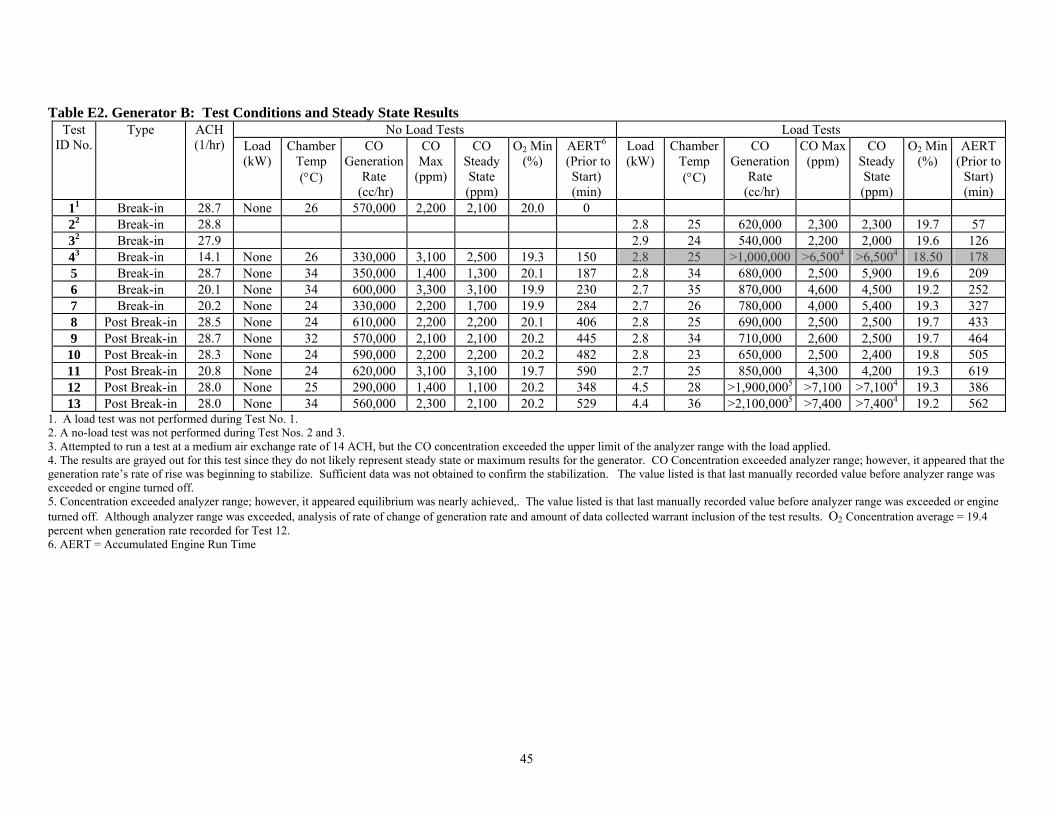
45
Table E2. Generator B: Test Conditions and Steady State Results No Load Tests Load Tests Test
ID No. Type ACH
(1/hr) Load (kW)
Chamber Temp
(°C)
CO Generation
Rate (cc/hr)
CO Max
(ppm)
CO Steady State (ppm)
O2 Min(%)
AERT6 (Prior to
Start) (min)
Load (kW)
Chamber Temp
(°C)
CO Generation
Rate (cc/hr)
CO Max(ppm)
CO Steady State (ppm)
O2 Min(%)
AERT (Prior to
Start) (min)
11 Break-in 28.7 None 26 570,000 2,200 2,100 20.0 0 22 Break-in 28.8 2.8 25 620,000 2,300 2,300 19.7 57 32 Break-in 27.9 2.9 24 540,000 2,200 2,000 19.6 126 43 Break-in 14.1 None 26 330,000 3,100 2,500 19.3 150 2.8 25 >1,000,000 >6,5004 >6,5004 18.50 178 5 Break-in 28.7 None 34 350,000 1,400 1,300 20.1 187 2.8 34 680,000 2,500 5,900 19.6 209 6 Break-in 20.1 None 34 600,000 3,300 3,100 19.9 230 2.7 35 870,000 4,600 4,500 19.2 252 7 Break-in 20.2 None 24 330,000 2,200 1,700 19.9 284 2.7 26 780,000 4,000 5,400 19.3 327 8 Post Break-in 28.5 None 24 610,000 2,200 2,200 20.1 406 2.8 25 690,000 2,500 2,500 19.7 433 9 Post Break-in 28.7 None 32 570,000 2,100 2,100 20.2 445 2.8 34 710,000 2,600 2,500 19.7 464
10 Post Break-in 28.3 None 24 590,000 2,200 2,200 20.2 482 2.8 23 650,000 2,500 2,400 19.8 505 11 Post Break-in 20.8 None 24 620,000 3,100 3,100 19.7 590 2.7 25 850,000 4,300 4,200 19.3 619 12 Post Break-in 28.0 None 25 290,000 1,400 1,100 20.2 348 4.5 28 >1,900,0005 >7,100 >7,1004 19.3 386 13 Post Break-in 28.0 None 34 560,000 2,300 2,100 20.2 529 4.4 36 >2,100,0005 >7,400 >7,4004 19.2 562
1. A load test was not performed during Test No. 1. 2. A no-load test was not performed during Test Nos. 2 and 3. 3. Attempted to run a test at a medium air exchange rate of 14 ACH, but the CO concentration exceeded the upper limit of the analyzer range with the load applied. 4. The results are grayed out for this test since they do not likely represent steady state or maximum results for the generator. CO Concentration exceeded analyzer range; however, it appeared that the generation rate’s rate of rise was beginning to stabilize. Sufficient data was not obtained to confirm the stabilization. The value listed is that last manually recorded value before analyzer range was exceeded or engine turned off. 5. Concentration exceeded analyzer range; however, it appeared equilibrium was nearly achieved,. The value listed is that last manually recorded value before analyzer range was exceeded or engine turned off. Although analyzer range was exceeded, analysis of rate of change of generation rate and amount of data collected warrant inclusion of the test results. O2 Concentration average = 19.4 percent when generation rate recorded for Test 12. 6. AERT = Accumulated Engine Run Time
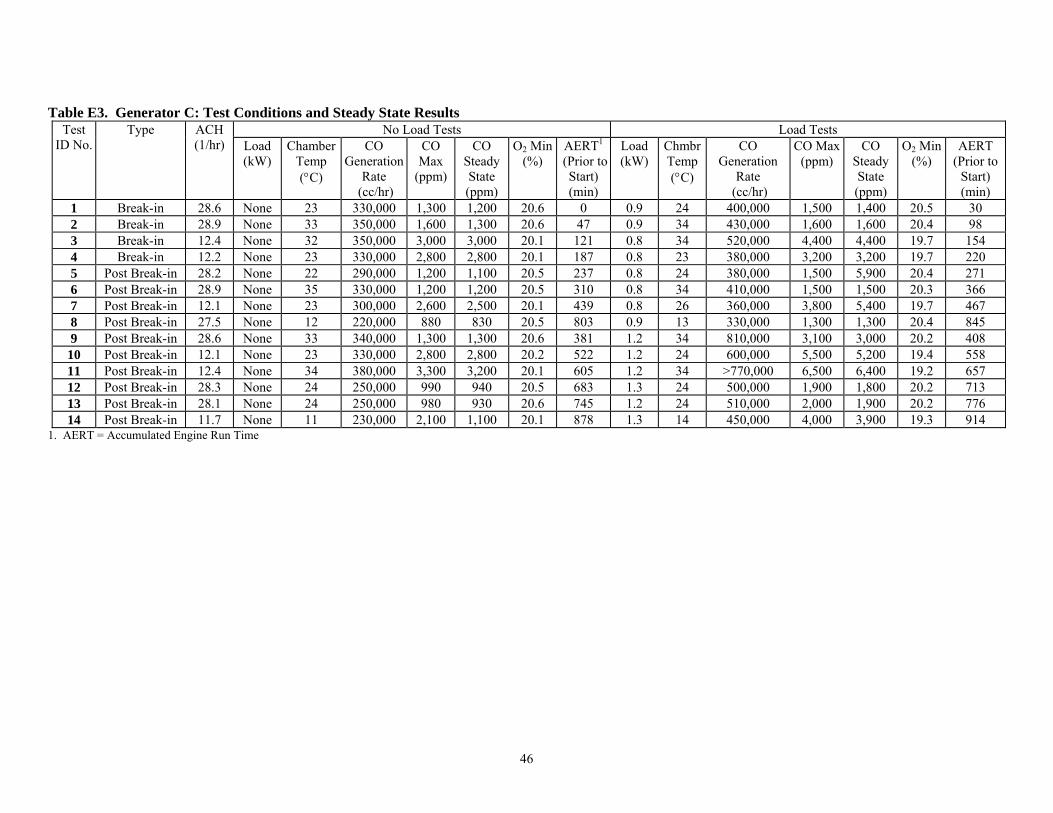
46
Table E3. Generator C: Test Conditions and Steady State Results No Load Tests Load Tests Test
ID No. Type ACH
(1/hr) Load (kW)
Chamber Temp
(°C)
CO Generation
Rate (cc/hr)
CO Max
(ppm)
CO Steady State (ppm)
O2 Min(%)
AERT1 (Prior to
Start) (min)
Load (kW)
Chmbr Temp
(°C)
CO Generation
Rate (cc/hr)
CO Max(ppm)
CO Steady State (ppm)
O2 Min(%)
AERT (Prior to
Start) (min)
1 Break-in 28.6 None 23 330,000 1,300 1,200 20.6 0 0.9 24 400,000 1,500 1,400 20.5 30 2 Break-in 28.9 None 33 350,000 1,600 1,300 20.6 47 0.9 34 430,000 1,600 1,600 20.4 98 3 Break-in 12.4 None 32 350,000 3,000 3,000 20.1 121 0.8 34 520,000 4,400 4,400 19.7 154 4 Break-in 12.2 None 23 330,000 2,800 2,800 20.1 187 0.8 23 380,000 3,200 3,200 19.7 220 5 Post Break-in 28.2 None 22 290,000 1,200 1,100 20.5 237 0.8 24 380,000 1,500 5,900 20.4 271 6 Post Break-in 28.9 None 35 330,000 1,200 1,200 20.5 310 0.8 34 410,000 1,500 1,500 20.3 366 7 Post Break-in 12.1 None 23 300,000 2,600 2,500 20.1 439 0.8 26 360,000 3,800 5,400 19.7 467 8 Post Break-in 27.5 None 12 220,000 880 830 20.5 803 0.9 13 330,000 1,300 1,300 20.4 845 9 Post Break-in 28.6 None 33 340,000 1,300 1,300 20.6 381 1.2 34 810,000 3,100 3,000 20.2 408
10 Post Break-in 12.1 None 23 330,000 2,800 2,800 20.2 522 1.2 24 600,000 5,500 5,200 19.4 558 11 Post Break-in 12.4 None 34 380,000 3,300 3,200 20.1 605 1.2 34 >770,000 6,500 6,400 19.2 657 12 Post Break-in 28.3 None 24 250,000 990 940 20.5 683 1.3 24 500,000 1,900 1,800 20.2 713 13 Post Break-in 28.1 None 24 250,000 980 930 20.6 745 1.2 24 510,000 2,000 1,900 20.2 776 14 Post Break-in 11.7 None 11 230,000 2,100 1,100 20.1 878 1.3 14 450,000 4,000 3,900 19.3 914
1. AERT = Accumulated Engine Run Time

47
Table E4. Generator D: Test Conditions and Steady State Results No Load Tests Load Tests Test
ID No.
Type ACH (1/hr)
Eco-Throttle System
Load (kW)
Chamber Temp
(°C)
CO Generation
Rate (cc/hr)
CO Max
(ppm)
CO Steady State (ppm)
O2 Min (%)
AERT3 (Prior to
Start) (min)
Load (kW)
Chmbr Temp
(°C)
CO Generation
Rate (cc/hr)
CO Max(ppm)
CO Steady State (ppm)
O2 Min (%)
AERT (Prior to
Start) (min)
1 Break-in 27.8 OFF None 10 110,000 1,1002 410 20.7 601 0.5 11 140,000 570 540 20.6 92 2 Break-in 28.8 OFF None 23 150,000 550 530 20.7 121 0.5 24 230,000 860 830 20.6 147 3 Break-in 13.1 OFF None 24 170,000 1,300 1,300 20.7 167 0.5 23 250,000 2,000 1,900 20.5 202 4 Break-in 13.1 on None 23 150,000 1,200 1,200 20.6 228 0.5 24 220,000 1,800 1,700 20.4 266 5 Break-in 13.3 OFF None 31 190,000 1,500 1,500 20.6 287 0.5 35 290,000 5,900 2,300 20.3 354 6 Break-in 28.7 on None 23 140,000 510 510 20.7 386 0.5 23 200,000 760 740 20.6 414 7 Break-in 28.3 OFF None 34 170,000 650 640 20.7 450 0.5 36 210,000 5,400 790 20.6 493 8 Post Break-in 27.3 OFF None 10 100,000 380 370 20.7 521 0.5 11 130,000 500 500 20.6 566 9 Post Break-in 28.5 OFF None 23 150,000 570 570 20.6 685 0.5 23 180,000 720 670 20.6 713
10 Post Break-in 28.8 OFF None 33 180,000 670 650 20.6 853 0.5 34 230,000 870 850 20.6 925 11 Post Break-in 13.2 OFF None 23 150,000 1,200 1,200 20.4 1021 0.5 23 200,000 1,600 1,600 20.4 1063 12 Post Break-in 28.1 on None 23 140,000 510 500 20.7 1376 0.5 24 200,000 750 720 20.6 1416 13 Post Break-in 28.2 OFF None 25 150,000 570 560 20.7 592 0.9 24 430,000 1,600 1,600 20.4 646 14 Post Break-in 28.7 OFF None 32 180,000 660 650 20.7 754 0.9 35 480,000 1,800 1,700 20.4 826 15 Post Break-in 28.2 on None 23 140,000 530 520 20.6 949 0.9 24 310,000 1,200 1,100 20.4 991 16 Post Break-in 13.3 OFF None 33 180,000 1,400 1,400 20.5 1108 0.9 34 480,000 3,900 3,800 20.0 1170 17 Post Break-in 12.4 OFF None 9 110,000 900 900 20.4 1212 0.9 10 390,000 3,300 3,300 20.0 1248 18 Post Break-in 12.9 OFF None 24 150,000 1,300 1,200 20.4 1287 0.9 24 430,000 3,500 3,500 19.9 1338
1. Generator was run for approximately 60 minutes during a preliminary test, the results of which are not reported here. 2. Generator was run for approximately 3 minutes at the beginning of the test with the choke partially closed. In cold temperature, generator would cut off if choke not partially closed. 3. AERT = Accumulated Engine Run Time

48
Table E5. Average CO Generation Rate Change for Break-in Tests with Increasing Loads at Constant Temperatures (For Figures 2, 4, 5 and 6 in “Generator Test Results and Discussion”)
Note: Raw, unrounded data used to calculate the average generation rate changes. Temperatures may vary by up to ± 3º C. Table E6. Average CO Generation Rate Change for Post Break-in Tests with Increasing Loads at Constant Temperatures (For Figures 2, 4, 5 and 6 in “Generator Test Results and Discussion”)
Note: Raw, unrounded data used to calculate the average generation rate changes. Temperatures may vary by up to ± 3º C.
Break-in Tests Average CO Generation Rate Change at 12º C
(%)
Average CO Generation Rate Change at 25º C
(%)
Average CO Generation Rate Change at 37º C
(%) ACH ~29 No load to
Partial Load
Partial Load to
Full Load
No load to Partial Load
Partial Load to
Full Load
No load to Partial Load
Partial Load to Full
Load
Generator A - - 86 - 50 -
Generator B - - 6 - 98 -
Generator C - - 21 - 23 -
Generator D 31 - 54 - 24 -
Post Break-in Test
Average CO Generation Rate Change at 12º C
(%)
Average CO Generation Rate Change at 25º C
(%)
Average CO Generation Rate Change at 37º C
(%) ACH ~29 No load to
Partial Load
Partial Load to
Full Load
No load to Partial Load
Partial Load to
Full Load
No load to Partial Load
Partial Load to
Full Load
Generator A - - 60 25 46 34
Generator B - - 35 183 25 193
Generator C 49 37 44 34 23 98
Generator D 34 - 20 133 29 104
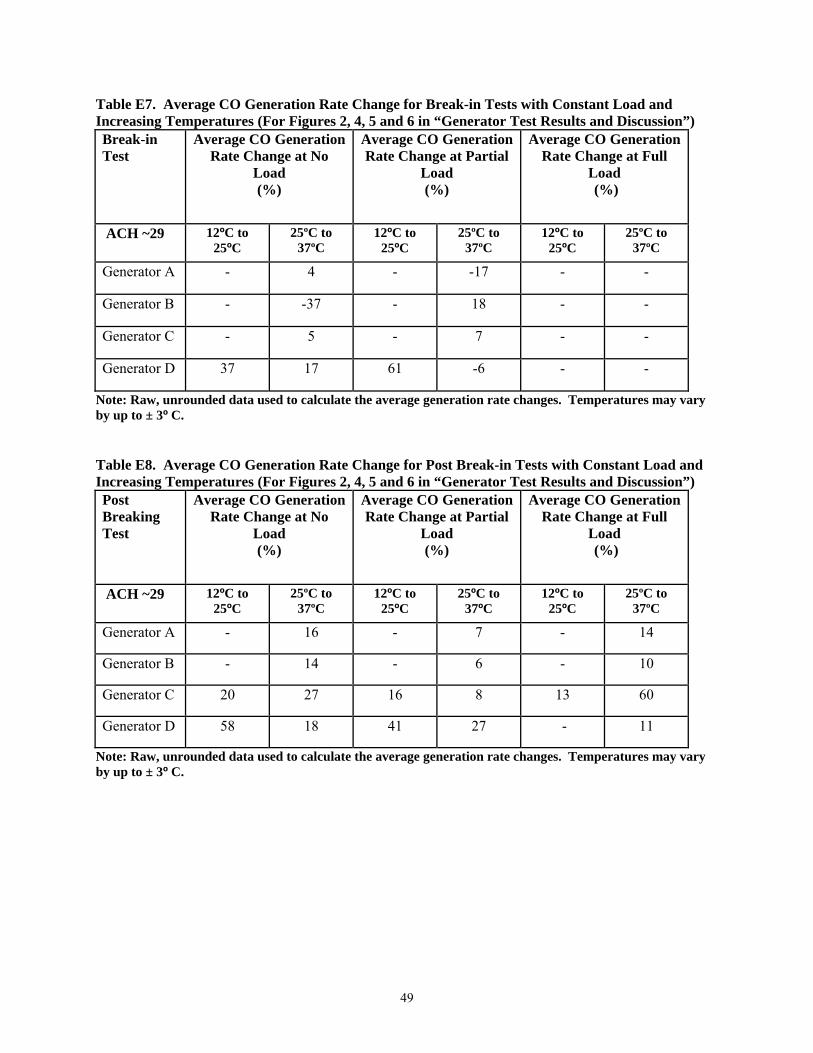
49
Table E7. Average CO Generation Rate Change for Break-in Tests with Constant Load and Increasing Temperatures (For Figures 2, 4, 5 and 6 in “Generator Test Results and Discussion”) Break-in Test
Average CO Generation Rate Change at No
Load (%)
Average CO Generation Rate Change at Partial
Load (%)
Average CO Generation Rate Change at Full
Load (%)
ACH ~29 12ºC to 25ºC
25ºC to 37ºC
12ºC to 25ºC
25ºC to 37ºC
12ºC to 25ºC
25ºC to 37ºC
Generator A - 4 - -17 - -
Generator B - -37 - 18 - -
Generator C - 5 - 7 - -
Generator D 37 17 61 -6 - -
Note: Raw, unrounded data used to calculate the average generation rate changes. Temperatures may vary by up to ± 3º C. Table E8. Average CO Generation Rate Change for Post Break-in Tests with Constant Load and Increasing Temperatures (For Figures 2, 4, 5 and 6 in “Generator Test Results and Discussion”) Post Breaking Test
Average CO Generation Rate Change at No
Load (%)
Average CO Generation Rate Change at Partial
Load (%)
Average CO Generation Rate Change at Full
Load (%)
ACH ~29 12ºC to 25ºC
25ºC to 37ºC
12ºC to 25ºC
25ºC to 37ºC
12ºC to 25ºC
25ºC to 37ºC
Generator A - 16 - 7 - 14
Generator B - 14 - 6 - 10
Generator C 20 27 16 8 13 60
Generator D 58 18 41 27 - 11
Note: Raw, unrounded data used to calculate the average generation rate changes. Temperatures may vary by up to ± 3º C.

50
Table E9. Average CO Generation Rate Change for Break-in Tests at Partial Load at Various O2 Concentrations (For Figure 3 in “Generator Test Results and Discussion”) Break-in Test
Average CO Generation Rate Change at Partial Load and 25º C
(%)
Average CO Generation Rate Change at Partial Load and 37º C
(%) ACH ~29 19. 7 O2 to 19.3 O2 19.3 O2 to 18.6 O2 19. 7 O2 to 19.3 O2 19.3 O2 to 18.6 O2
Generator A - - - -
Generator B 34 32 27 -
Generator C - - - -
Generator D - - - -
Note: Raw, unrounded data used to calculate the average generation rate changes. Temperatures may vary by up to ± 3º C. Table E10. Average CO Generation Rate Change for Break-in Tests at Partial Load at Various O2 Concentrations (For Figure 3 in “Generator Test Results and Discussion”) Post Break-in Test
Average CO Generation Rate Change at Partial Load and 25º C
(%)
Average CO Generation Rate Change at Partial Load and 37º C
(%)
ACH ~29 19. 7 O2 to 19.3 O2 19.3 O2 to 18.6 O2 19. 7 O2 to 19.3 O2 19.3 O2 to 18.6 O2
Generator A - - - -
Generator B 27 - - -
Generator C - - - -
Generator D - - - -
Note: Raw, unrounded data used to calculate the average generation rate changes. Temperatures may vary by up to ± 3º C.