engineering and implementing raytheon missile … · engineering and implementing raytheon missile...
TRANSCRIPT

Engineering and ImplementingRaytheon Missile Systems
Engineering Design to Cost Metric
System Engineering’s Cost EngineeringRaytheon Missile Systems
Bldg. M12, MS. 61151 E. Herman’s RoadTucson, Arizona 85706
F. Quentin Redman
George Stratton
Ed Casey
Diana Patane
Areas to be Covered
1. Background2. Design to Cost and Cost As an Independent
Variable3. The DTC Process4. The DTC Metric5. Lessons Learned6. Going Forward

Background• The Engineering Effectiveness Metrics initiative grew out of
RMS’s desire to reduce the costs and cycle times necessary todesign, develop and build products that work right the firsttime.
• To support these goals, an Engineering Effectiveness MetricsTeam developed three primary metrics:
• On-Time Delivery Performance
• First-Presentation Yield
• Design To Cost (DTC)
• Today’s focus is on the creation of the DTC Metric, its purposeand use at RMS.
• The DTC metric is designed to allow business unit managementto quickly review program(s) progress and status towardsmeeting their affordability commitments.

Background:DTC & CAIV at Raytheon Missile Systems
• DTC and CAIV are blended into Business Development under theheading of Affordability.
• Within the process at RMS:• Defined cost targets are assigned to each IPT• Focus is on identified cost drivers• Cost vs performance tradeoffs are conducted that lead to best
value solutions• Metrics are determined and reported accordingly
• Each design choice is evaluated simultaneously for both costand benefit
• CAIV begins before Concept Exploration and remains, with DTC,vigorous throughout product development
CAIV – Cost As an Independent Variable
DTCas a
Management ControlSystem

DTC - A Management Control System
Management ControlSystems are put inplace to directtargeted activitytoward achievementof the desiredresults.
Environment DecisionMaker
Sensor
FeedbackPerception(Current
Estimate)
Effector
Goals (AUPC)
Behavior Choice(Cost reduction)
FactualPremises
ValuePremises!
Comparator
BehavioralRepertoire
Current estimate vs. DTC goalCompares achievement with goals
Repeats at interval per planFollow-up to ensure that goals are met
Action plan: changesTakes action to eliminate variances
Cost Drivers, spec. risk, etc.Determines the cause(s) of the variances
Reports $ DataReports variances
Estimates system and subsystem variancesComputes the variances as the result of the preceding comparison
Prepares current cost estimateMeasures achievement
Sets AUPC Goal as part of DTC PlanSet goals and performance measures
DTC ProcessManagement Control Process

Our DTC Process

Requirements Flowchart
Design to Costis a continuousiterative processthat begins at the
top level with aproduct
requirement thatincludes cost as amajor priority and
then seeks tooptimize the entire
product whileallocating
requirementsdown to all levels
Design Review As Appropriate to Phase
SystemRequirements
Iterate To ProvideBest Customer Value
• • • •
SystemDecom-position
Sub-SystemDecom-position
UnitDecom-position
ModuleDecom-position
Iterate To ProvideBest Value
• • • •
• • • •
• • • •
Iterate To ProvideBest Value
Iterate To ProvideBest Value
Iterate To ProvideBest Value
• • • •
Hybrid/MCMDecom-position
orComponent
DesignIterate To ProvideBest Value
Ana
lysi
s an
d Tr
adeo
ff St
udie
s (A
&TS
)
HistoricalData
ProcessCapability
(Six Sigma)Data
DOE/DFMAResults
RiskAssessment

Seven Steps to an Affordable Design
The engineer must use the following7 steps to execute DTC:1. Understand requirements2. Analyze functions3. Identify physical alternatives /
allocate requirements / plan task4. Design synthesis5. Cost Modeling – Estimation &
Rollup6. Evaluate – Meet or changes
requirements?7. Select/Formalize Design
Plus, an often overlooked 8th step to:8. Document and report progress
towards meeting the cost goal.

The Design is Complete IF
The design is complete when the customer/contractor team hasaccomplished the following:
• Performed detailed cost, performance, supportability, and riskassessments that indicate that all final requirements will be metwith levels of cost, schedule and technical risk acceptable to boththe customer and the company.
• Allocated all requirements to non NDI items or specific customdesigned components.
• Completed the detailed design of all custom components.
• Successfully modeled/prototyped custom components andassemblies that can drive cost, performance, or schedule.
• Completed a thorough manufacturing plan defining the approachto the fabrication or procurement of all components and theassembly, integration, and test of the product and each significantsub-product.
• Complied with all customer and company requirements for ILS,support, review, documentation, verification, scheduling, warranty,and the like.

The DTC Metric
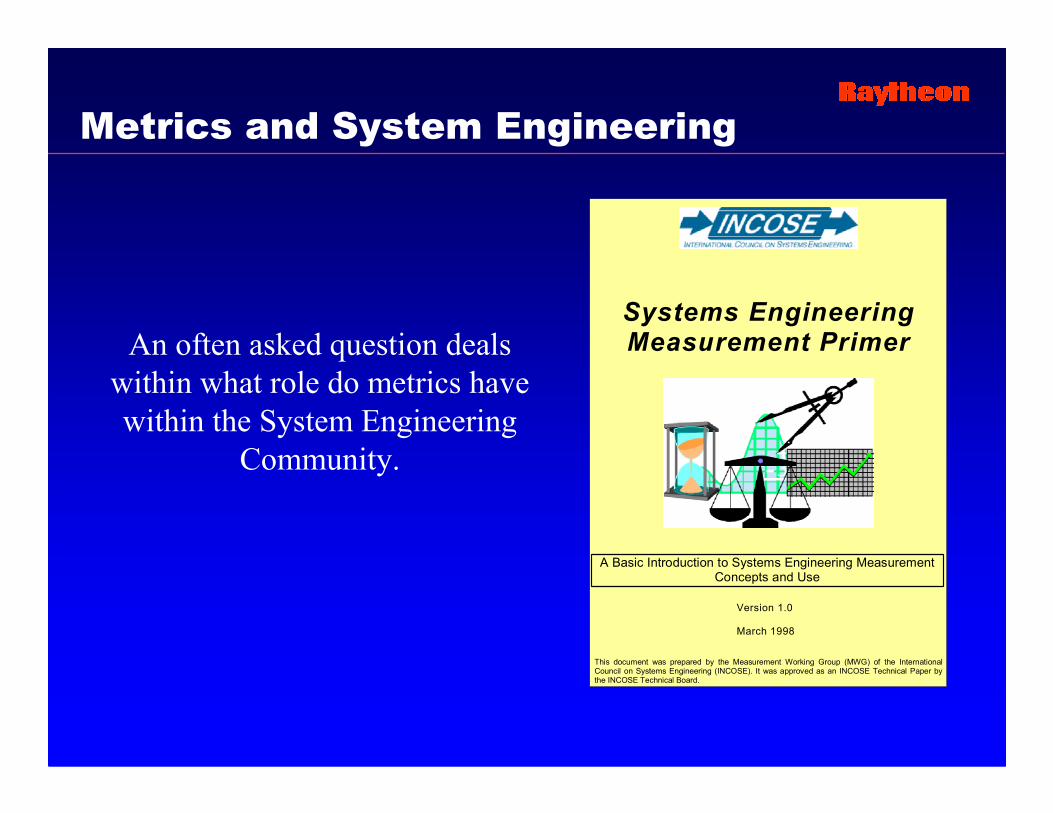
Metrics and System Engineering
Systems EngineeringMeasurement Primer
Version 1.0
March 1998
This document was prepared by the Measurement Working Group (MWG) of the InternationalCouncil on Systems Engineering (INCOSE). It was approved as an INCOSE Technical Paper bythe INCOSE Technical Board.
A Basic Introduction to Systems Engineering MeasurementConcepts and Use
An often asked question dealswithin what role do metrics havewithin the System Engineering
Community.

The purpose of any metric is to drive proper behavior.
• Proper behavior is achieved by setting, striving for, and ultimately reaching goals.A DTC metric is therefore one that keeps cost and cost reduction in the forefront.
• The proper metric for DTC is one that establishes a system cost goal for thedesign and that requires attainment of estimated production costs at specifiedpoints along a program timeline starting pre-SDD and going through production.
• By establishing cost goals for a program (and its subsystems) that are timephased, and constantly decreasing, a program is able to measure its costreduction effort toward the ultimate program cost goal.
• The DTC metric is measured as cost variance to the required time-phased goals.Any variance to a cost goal should precipitate IPT action to eliminate thediscrepancy.
• Variances are measured and reported at design team meetings and programreviews. Efforts to eliminate cost variances (the proper behavior) become part ofthe IPT design effort when tradeoffs are made between cost, risk, performance,and cycle time.
Metrics
Establishing a DTC Metric at RMS
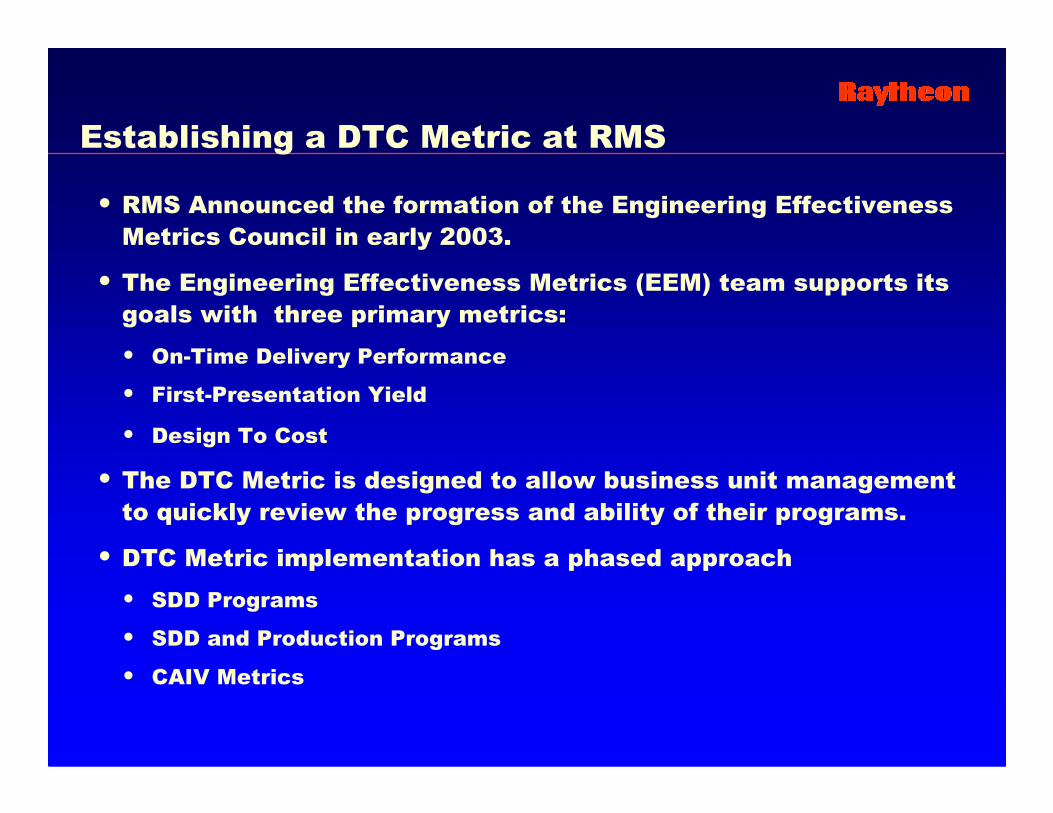
• RMS Announced the formation of the Engineering EffectivenessMetrics Council in early 2003.
• The Engineering Effectiveness Metrics (EEM) team supports itsgoals with three primary metrics:• On-Time Delivery Performance
• First-Presentation Yield
• Design To Cost
• The DTC Metric is designed to allow business unit managementto quickly review the progress and ability of their programs.
• DTC Metric implementation has a phased approach• SDD Programs
• SDD and Production Programs
• CAIV Metrics

Implementation
• Potential programs taken from the EEM “Deployment Matrix,”which are programs that are reporting other EEM metrics (FirstTime Presentation Yield and On-time Delivery Performance).
• Initial meetings with PLCE to identify candidate programs.
• E-mails or phone calls to program manager.
• “Getting Started” packets mailed to candidates:• Product Cost Control Survey• DTC Start-Up Instructions• DTC Points of Contact• DTC Guidelines• DTC Process• Sample DTC Plan Table of Contents• CAIV/DTC Training Schedules plus “Program-Specific” CAIV/DTC
offered
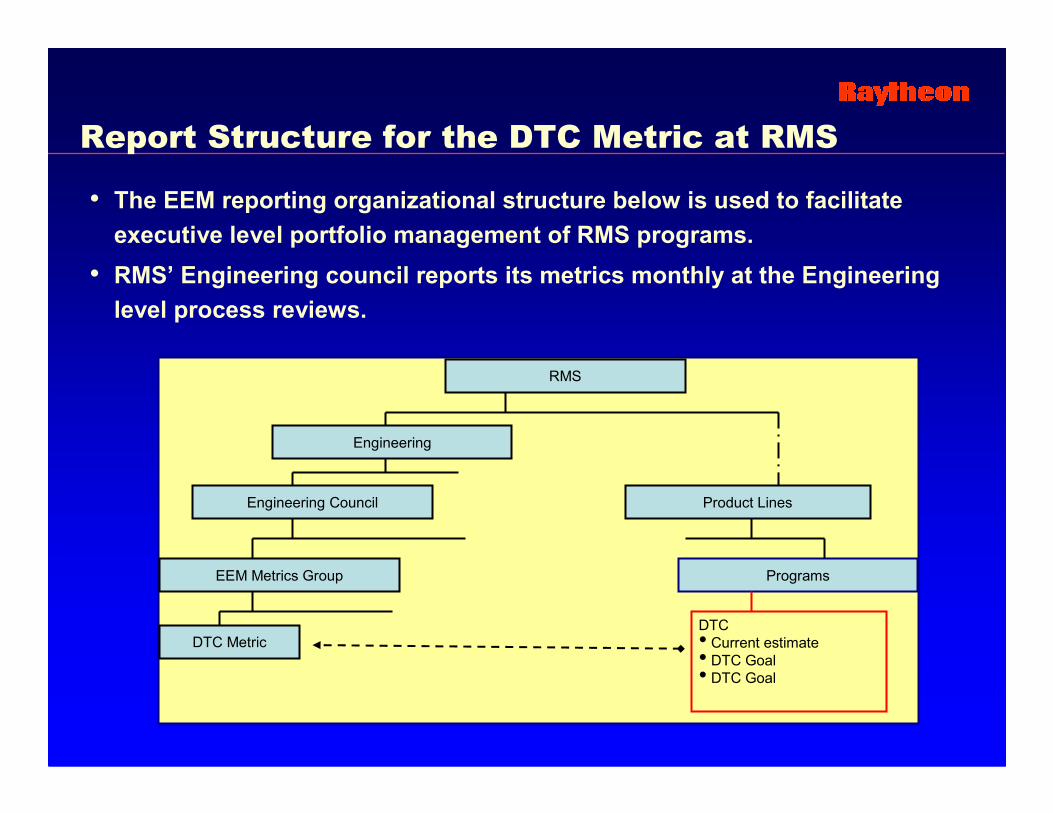
Report Structure for the DTC Metric at RMS
• The EEM reporting organizational structure below is used to facilitateexecutive level portfolio management of RMS programs.
• RMS’ Engineering council reports its metrics monthly at the Engineeringlevel process reviews.
RMS
Engineering
Engineering Council
EEM Metrics Group
Product Lines
Programs
DTC MetricDTC• Current estimate• DTC Goal• DTC Goal

Process
• Programs provide their initial cost goal and current estimate.• Programs provide an initial basis of estimate.• Programs are contacted monthly for their prior month’s current estimate (trailing
indicator)• Current estimate is divided by the cost goal for a DTC metric. This is reported in
a percentage format; i.e., Program A’s DTC metric is 1.04, which is 4% over theircost goal.
• Latency or how often the cost information is reviewed and updated is alsoreported.
• For programs in “yellow” and “red” categories, “Root Causes and CorrectiveActions reports are required.
Latency - 1-2 monthsLatency - 2-3 monthsLatency - 5 months +
DTC Goal <100% to no >4.99% over goalOver DTC Goal >4.99% to 9.99%Over DTC Goal >10%

DTC Metric Definition and Reporting Levels
• Phase/Gate: The program’s current position in its life-cycle
• DTC Metric: Current Cost Estimate / DTC Target
• Green: < 1.05; Yellow: between 1.05 & 1.1; Red: > 1.1
• Latency: Months since completion of last Current Cost Estimate.
• Green: < 3 months; Yellow: between 3 & 5 months; Red: > 5 months
• Accuracy: Represents the relative possible cost risk associated withcurrent cost estimate expressed as a plus and minus percent. Accuracyis not currently being reported.
Lower FPA Cost+10 -541.045SDDThree C
Program undergoing majorcorrections and rebaselining
+25 -1571.507SDDTwo B
High Subcontractor cost formotor assembly
+15 -1011.126SDDOne A
AccuracyGate Metric LatencyProgram CommentPhase

DTC Metric Reporting Frequencyand Initial Results
RMS’s Engineering Council reports itsmetrics monthly at the Engineering
Process Review Meeting. All engineeringmetrics are distilled into a series of color-coded stoplight charts that show current
status in relation to goals for the year.
Variances are measured and reported at design teammeetings and program reviews. Efforts to eliminatecost variances (the proper behavior) become part of
the IPT design effort when tradeoffs are madebetween cost, risk, performance, and cycle time.

Action
•“Five Why’s” reports required for programs that remain inthe red category without signs of improvement.
•Areas of concern are identified for “yellow” and “red”programs, and Engineering Centers assist in resolving thechallenges.
•The Engineering Accountability Review Group reviewsmonthly the programs that should be reporting DTCMetrics.
• “Programs That Should Be Reporting ‘DTC’ Metrics” arenow being reported to Louise Francesconi at the monthlyproduct line reviews.

Lessons Learned

Lessons Learned
• Affordability is the primary driver in all architecture design anddevelopment activities.
• DTC requires mandatory cost requirements be assigned to all programsdown to the lowest levels.
• Programs must track and measure their current design to cost statusagainst their goals at periodic intervals. (Cost Management)
• Cost must be a design requirement with importance equal to or greaterthan performance.
• DTC focus must begin as early as possible in a program (pre-RFQ) forearly cost driver identification.
• Cost estimation can be approximate in early program phases,progressively better during later phases.
• Proper DTC behavior is achieved by setting, striving for, and ultimatelyreaching goals. A DTC metric is therefore one that keeps cost and costreduction in the forefront of IPT activity.
• By establishing cost goals for a program (and its subsystems) that aretime phased, and constantly decreasing, a program is able to measure itscost reduction effort toward the ultimate program cost goal.

Going Forward
To quote Sun Tsu, The Art of War, “the wise general in his deliberations mustconsider both favourable and unfavourable factors. By taking into account the
favourable factors, he makes his plan feasible; by taking into account theunfavourable, he may resolve the difficulties.”
To quote Sun Tsu, The Art of War, “the wise general in his deliberations mustconsider both favourable and unfavourable factors. By taking into account the
favourable factors, he makes his plan feasible; by taking into account theunfavourable, he may resolve the difficulties.”

Going Forward: Plans for the Future
A DTC Metric, by itself, is not enough!
It is time to consider expanding DTC Metrics into CAIV Metrics:
• CAIV Metrics encompass not only cost, but performance,schedule and risk as well. The primary metric to measurespecific CAIV project effectiveness is cost. The utilization ofthis metric requires an established cost baseline in sufficientdetail to compare prior and resultant impacts of a CAIVproject.
The proper metric for CAIV:• Establishes a system cost goal for the design• Requires specific points of estimated development
production and operation/support costs• Reflects on program costs and system performance

Going Forward: CAIV Metrics Sample Chart
DTC Metrics can be enlarged with Cost, Performance, Scheduleand a Risk Assessment to form a set of CAIV Metrics.
Threshold Goal Current Current/Goal Risk Assess Cost Driver Latency Plan of Action32,775.00$ 31,500.00$ 37,790.00$ 1.20
Sub-System 5,000.00$ 4,500.00$ 6,200.00$ 1.38 2 noSub-System 1,500.00$ 1,500.00$ 1,400.00$ 0.93 4 noSub-System 12,275.00$ 12,000.00$ 17,890.00$ 1.49 1 yesSub-System 8,000.00$ 7,500.00$ 6,000.00$ 0.80 3 yesSub-System 2,500.00$ 2,500.00$ 2,700.00$ 1.08 3 yesSub-System 3500 3500 3600 1.03 2 yesSub-SystemSub-System
Requirement Goal Current Req/Current Risk Assess Cost Driver Latency Plan of Actionspeed mph 200 220 180 1.11 1 norange nm 500 550 525 0.95 1 yesload lbs 750 750 800 0.94 1 yesKPP-4
Contract Goal Expected Exp/Con Risk Assess Cost Driver Latency Plan of ActionDatesMonths to Go 18 15 15 0.83 2 no
Red Red What is/are Red Is there a plan of action - yes/noYellow Yellow the major cost Yellow CommentGreen Green driver(s) GreenBlueViolet
CAIV MetricCost - System
Performance
Schedule

Going Forward: CAIV Metrics Sample Chart
CAIV Metrics chart at a glance:• Discloses a program’s status in the areas of cost, performance
and schedule. From the above sample chart one can quickly see:• The program is projected to over-run costs by 20%.
• Two of the sub-systems are in the red; one with a high risk offailing.
• The PM has no plan of action to fix one of the red areas• One sub-system is in the “violet” with low risk of failure so
perhaps cost goals ought to be re-allocated.• The others are close to goals on one-side or the other
• Two of the performance areas have superseded requirementswhile one area, without a plan of action and at high risk offailure is in the red.
• And, the program is planning on an early delivery.• The color coding helps management key in on specific areas of
concern and make necessary changes.

Any Questions?
• Now is a good time to ask.

USNA - 75