engineering chemistry laboratory … chemistry laboratory manual cum observation name of the student...
TRANSCRIPT

ENGINEERING CHEMISTRY
LABORATORY
MANUAL CUM OBSERVATION
Name of the student
Regd. No
By
DEPARTMENT OF CHEMISTRY
Maharaj Vijayaram Gajapathi Raj College of Engineering
(Autonomous)
(Approved by AICTE, New Delhi, Accredited by NBA of AICTE, NAAC with ‘A’ Grade of UGC,
and permanently affiliated to JNTUK)
Chintala valasa, Vizianagaram -535005
Engineering Chemistry lab manual 2016-17 (II Semester)
M V G R College of Engineering (Autonomous), Vizianagaram. Page 2
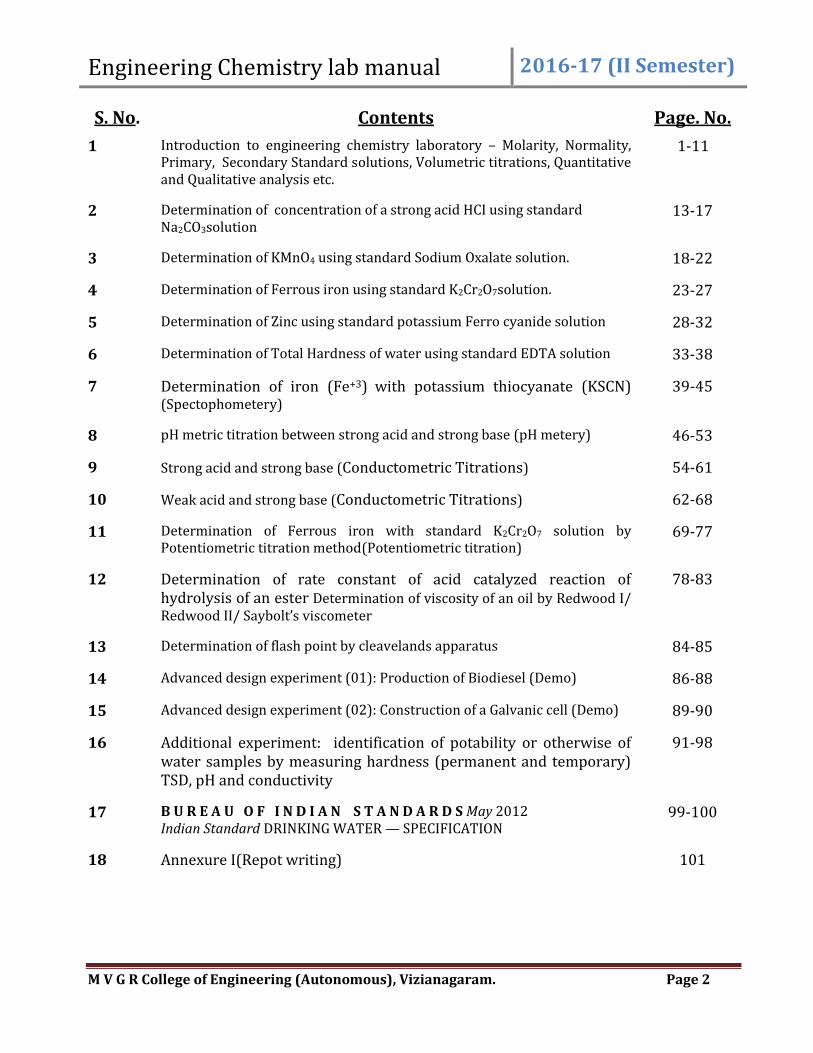
S. No. Contents Page. No.
1 Introduction to engineering chemistry laboratory – Molarity, Normality, Primary, Secondary Standard solutions, Volumetric titrations, Quantitative and Qualitative analysis etc.
1-11
2 Determination of concentration of a strong acid HCI using standard Na2CO3solution
13-17
3 Determination of KMnO4 using standard Sodium Oxalate solution. 18-22
4 Determination of Ferrous iron using standard K2Cr2O7solution. 23-27
5 Determination of Zinc using standard potassium Ferro cyanide solution 28-32
6 Determination of Total Hardness of water using standard EDTA solution 33-38
7 Determination of iron (Fe+3) with potassium thiocyanate (KSCN) (Spectophometery)
39-45
8 pH metric titration between strong acid and strong base (pH metery) 46-53
9 Strong acid and strong base (Conductometric Titrations) 54-61
10 Weak acid and strong base (Conductometric Titrations) 62-68
11 Determination of Ferrous iron with standard K2Cr2O7 solution by Potentiometric titration method(Potentiometric titration)
69-77
12 Determination of rate constant of acid catalyzed reaction of hydrolysis of an ester Determination of viscosity of an oil by Redwood I/ Redwood II/ Saybolt’s viscometer
78-83
13 Determination of flash point by cleavelands apparatus
84-85
14 Advanced design experiment (01): Production of Biodiesel (Demo) 86-88
15 Advanced design experiment (02): Construction of a Galvanic cell (Demo) 89-90
16 Additional experiment: identification of potability or otherwise of water samples by measuring hardness (permanent and temporary) TSD, pH and conductivity
91-98
17 B U R E A U O F I N D I A N S T A N D A R D S May 2012 Indian Standard DRINKING WATER — SPECIFICATION
99-100
18 Annexure I(Repot writing) 101

Engineering Chemistry lab manual 2016-17 (II Semester)
M V G R College of Engineering (Autonomous), Vizianagaram. Page 3
INTRODUCTION TO CHEMISTRY LAB
Chemical analysis is carried out to understand the composition of the materials. This will enable to assess the properties of materials and if necessary, modify the properties for technical and scientific applications. Chemical analysis is the resolution of a chemical compound into proximate or ultimate parts. Traditional manual chemical analysis is divided into two types.
a. QUALITATIVE ANALYSIS: It deals with the identification and confirmation of the nature of the substance or impurities present in a given sample.
b. QUANTITATIVE ANALYSIS: It deals with the estimation of, how much of each component or of specified components, are present in a given sample, including in trace quantities. The substance determined is analyte and the minor or the trace quantities are impurities. The complete quantitative analysis consists of five steps: sampling, dissolution of the sample, conversion of the analytes into a form suitable for measurement, measurement, calculation and interpretation of data.
Quantitative chemical analysis is further divided into two types:
a. VOLUMETRIC ANALYSIS: It is based on a chemical reaction and the calculations are on the simple stoichiometric relations of chemical reactions. It is a quantitative chemical analysis by measure, which consists essentially in determining the volume of solution of accurately known concentration required to react quantitatively with solution of substance being determined. The weight of the substance to be determined is then calculated from the volume of the standard solutions and the known laws of chemical equivalence/ stoichiometry. The standard solution is usually added from a graduated glass vessel called a burette. The process of adding the standard solution until the reaction is just complete is termed as a titration and the substance to be determined is said to be titrated. Hence, this is also referred to as titrimetric analysis. The point at which the titration is completed is called the equivalence point or the theoretical (stoichiometric) endpoint. The completion of the titration should, as a rule, be detectable by some change, unmistakable to the eye, produced by the standard solution itself or more usually by the addition an auxiliary agent, known as indicator. The indicator should give a clear visual change in the solution being titrated. In the ideal titration, the visible endpoint will coincide with the stoichiometric or theoretical endpoint. However in practice, a very small difference usually occurs, referred to as titration error. Volumetric analysis, which involves the accurate measurements of volume of solutions, though one or two weighing’s may also be needed. The indicator is a chemical substance and choice of the indicator depends on the nature of the chemical reaction. Volumetric methods need simpler apparatus and the processes are quickly performed. They require a balance for weighing, calibrated measuring vessels like burettes, pipettes and volumetric flasks and substances of known purity for the preparation of standard solutions.
b. GRAVIMETRIC ANALYSIS: Unlike volumetric analysis where measurements of volumes are involved,
gravimetric method involves separation of the analyte into a solid form as precipitate. The measurement step in gravimetry is weighing. The element or a definite compound of the element in as pure form as possible, is isolated and weighed. The weight of the element or compound may then be readily calculated from a knowledge of the formula of the compound and the atomic weights of the constituent elements. The isolation of the required species is achieved by precipitation methods, volatilization, evolution methods or electro analytical methods.
The advantage of gravimetric method over volumetric analysis is that the constituent may be seen and examined for the presence of impurities. A correction can be applied if necessary. The disadvantage of gravimetry is that it is more time consuming compared to volumetric analysis. Of
Engineering Chemistry lab manual 2016-17 (II Semester)
M V G R College of Engineering (Autonomous), Vizianagaram. Page 4
the two methods, gravimetric analysis is accurate, but volumetric analysis is much more readily and quickly carried out. The error allowed in volumetric analysis is 0.2%.
ESSENTIAL CONDITIONS FOR ACCURATE TITRIMETRY
1. Clean glass apparatus must only be used in titrimetric analysis. Glass apparatus must be free from grease and thoroughly rinsed with distilled water and dried in an oven before use. Graduated apparatus need not be dried in oven, as they may cause error due to expansion.
2. The stoichiometric equation governing the reaction must be known. 3. The reaction should be practically instantaneous or proceed with sufficient speed. Addition of a
suitable catalyst may help to increase the speed of the reaction. The reaction must go to completion, without any complicating side reactions.
4. There must be some marked change in some physical or chemical property of the titrate to assess the completion of the reaction (usually an indicator is employed).
5. An indicator should be available, which should sharply define the end point of the reaction. 6. The standard solution must not alter in its strength during the period of experimentation. The
solution must be stable to light, atmosphere and must not react with the solvent or containers. 7. The balance must be accurate, stable, and sensitive and give the same result in successive weighings.
Calibrated weights must be used. If a digital balance is used, its operation must be fully understood and proper care be taken to obtain accurate results to the specified decimals.
TERMS USED IN VOLUMETRIC ANALYSIS
a. TITRATION: It is a process of adding one solution from the burette to another known volume of solution in a conical flask, in order to complete the chemical reaction. Out of the two solutions one must be standard i.e., whose concentration is known by preparation or by previous standardization.
b. TITRANT: The reagent being added through a burette is called as titrant.
c. TITRATE: The substance being titrated in the reaction vessel is termed as Titrate. However, these terms titrant and titrate are relative.
d. EQUIVALENCE POINT or STIOCHIOMETRIC END POINT: It is the point at which the amount of reagent (titrant) and substance (titrate) being determined are stoichiometrically equivalent according to the equation representing the chemical reaction or it is the exact stage at which the chemical reaction involved in the titration is just complete.
e. INDICATOR: The substance which helps in the visual detection of the completion of the reaction in the titration is known as indicator.
f. PIPETTE: A glass apparatus with which a fixed volume of solution as marked on the pipette can be delivered. It should be previously rinsed with the solution of titrate Solution is drawn by suction above the mark and the end is closed with pointing finger tightly, with three fingers on one side and thumb on the other side. By slow release of pointing finger, the level is adjusted to the mark and transferred into the titration vessel. Care must be taken to see that air bubbles are not present while drawing solution and the solution drop in the nozzle is never released by blow off.
g. BURETTE: Burettes are long cylindrical tubes of uniform bore throughout the graduated length with a closed bottom with stop cock and nozzle at the end. Titrant is filled into the burette including the nozzle and clamped to the stand vertically for five minutes before use, to eliminate air bubbles, if any. Initially the burette is filled with titrant up to its zero mark. The stop cock can

Engineering Chemistry lab manual 2016-17 (II Semester)
M V G R College of Engineering (Autonomous), Vizianagaram. Page 5
release solution as a continuous flow, but gentle operation will enable drop wise addition. Burette releases sufficient measured volume of solution into the titration vessel till the reaction is complete as indicated by change in colour of indicator. The volume released can be noted immediately as titer value. The reading of the lower meniscus coinciding with graduation will be taken as the burette reading. Burette should be fixed in stand and clamp vertically during and after use.
h. CONICAL FLASK: It is the reaction vessel containing titrate and indicator solution in distilled water. It should be rinsed with distilled water only before and after each titration.
i. WEIGHING BOTTLE: This is used to weigh a required quantity of specified solid for preparing standard solutions. The difference in weights before and after use gives the weight of the substance transferred.
,,
j. ANALYTICAL BALANCE: It is a two pan balance with graduated beam holding aluminum rider. It is closed on all sides to prevent air disturbances and all weighings must be carried out while closing these windows. Gentle lifting of the bottom knob will lift the beam to give free oscillations of the attached pointer within the scale. Before weighing, it should show equal oscillations on both sides of the scale failing which, the help of teacher in charge may be sought. No part of balance must be touched, while the beam is raised with knob and it is on free oscillations. Usually the balance is supplied with a weight box having weights 200g to 1 g and fractional weights of 500mg to 10mg. The weights should be handled with forceps only otherwise errors in weights are likely to interfere. Its accuracy is up to 0.1 mg. i.e., to fourth decimal place of a recorded weight. Digital balance can also be used for specific decimal places. A digital balance gives direct reading of weight to specified decimal paces on the panel.
k. MEASURING CYLIDER OR JAR: This is a graduated cylindrical glass vessel to draw approximate volumes of solution.
l. VOLUMETRIC FLASK: This is a stoppered glass vessel with flat bottom and pear shape with a long narrow neck containing a thin line mark etched on the neck. The volume specified on the flask is up to the mark only. This is used to prepare solutions with definite concentrations.
m. PORCELAIN TILE: A ceramic plate of 6”x6” size glazed white on one side and placed under the conical flask or any titration vessel during titration, which helps for better detection of colour change at the equivalence point.
n. END – POINT: The point at which the colour change of the indicator is visible is called the end point. Since this depends upon the sensitivity of the eye, the appearance of the first change in the faint color must be noted carefully, lest errors should creep into the measurement of volumes of solutions. A glazed white porcelain tile or a white paper in the back ground of the titration vessel will improve the visibility of the colour change in observing and recording the end point accurately.
o. TITRATION ERROR: Ideally, the visible end – point and the equivalence point should coincide, but in practice there is always a difference between the two, this difference being called the titration error. It is because the color change of indicator takes place only after the completion of the chemical reaction and addition of small excess of the titrant. Also it is possible that the indicator itself may also cause or join the chemical reaction.
Many errors occur due to analyst or method or reagent or uncalibrated glassware and interference of the indicator. To avoid these errors statistical treatment of the titration values is necessary. Hence, ‘Most Probable value’ is taken as the result.

Engineering Chemistry lab manual 2016-17 (II Semester)
M V G R College of Engineering (Autonomous), Vizianagaram. Page 6
MOST PROBABLE VALUE: Even when a quantity is measured with possible accuracy, the results of a successive observation differ among themselves. The average value of these results is taken as most probable value. Hence, it is not a true value.
ABSOLUTE ERROR: The difference between observed or measured value to a true or most probable value is known as absolute error. It is measure of accuracy.
ACCURACY: It is the concordance between measured value and most probable value or true value.
RELATIVE ERROR: It is the absolute error divided by true or most probable value. It is usually expressed in terms of % ppm.
MEAN DEVIATION: It is an agreement between a series of results. It can be evaluated by determining arithmetic means of the results, then calculating the deviation of each individual from the mean, finally dividing the sum of the deviations by the number of measurements.
Results Deviations 48.32 48.36 48.23 48.11 48.38
Mean =
0.04 0.08
0.05 Mean Deviation =
0.17 0.10
241.40 0.44
RELATIVE MEAN DEVIATION: It is the mean deviation divided by the mean. It is expressed in % or ppm.
Relative Mean Deviation =
=
It is a measure of Precision. PRECISION: Precision is a measure of reproducibility of measurements.

Engineering Chemistry lab manual 2016-17 (II Semester)
M V G R College of Engineering (Autonomous), Vizianagaram. Page 7
If the values are accurate, they may be precise, but if they are precise, they may not be accurate.
STANDARD DEVIATION: It measures the closeness of the results with the mean. Smaller the Standard deviation, more closely are the results to the mean value.
Where = individual measurements
= Average of the results.
N = Number of Measurements.
RELATIVE STANDARD DEVIATION (RSD): It is a measure of the quality of the sample. Large the RSD, shows the poor the quality of the sample.
STANDARD SOLUTION: A solution of known strength is called as standard solution. It is prepared by dissolving a definite weighed amount of the substance in a small volume of solvent in a volumetric flask of prescribed volume. It is dissolved and made up to the mark in the volumetric flask in the total volume being as stipulated on the volumetric flask. Later it is thoroughly made homogeneous before use and every reuse by shaking for uniformity in concentration.
PRIMARY STANDARD SUBSTANCE: A Primary Standard Substance should satisfy the following requirements.
a. The substance used as a primary standard should be available in a state of high purity and preserved in a pure state. It is known as Analytical Reagent or AR grade.
b. The substance should maintain its composition during storage and unaltered in air during weighing. It should be neither oxidized by air nor effected by carbon – dioxide.
c. It should not be hygroscopic, deliquescent or efflorescent. d. The total amount of impurities should not in general, exceed to 0.01 to 0.02%. The impurities to
the trace level must be specified to take necessary precautions to avoid possible interferences. e. It is preferred to have high equivalent weight so that the errors in weighing are minimum. f. The substance should readily be soluble under the conditions in which it is employed.
In practice an ideal primary standard is difficult to be obtained and a compromise in the above ideal requirements may be necessary.
PRIMARY STANDARD SUBSTANCES COMMONLY EMPLOYED:
In acidimetry and alkalimetry: Sodium carbonate (Na2CO3), Borax (Na2B4O7. 10H2O), and Potassium hydrogen phthalate (KHC8H4O4) etc.
In precipitation titrations: Sodium chloride, Potassium chloride, etc.
In oxidation-reduction titrations: Potassium dichromate, sodium oxalate, arsenium oxide etc.
In Complexometric titrations: Zinc sulphate solution

Engineering Chemistry lab manual 2016-17 (II Semester)
M V G R College of Engineering (Autonomous), Vizianagaram. Page 8
SECONDARY STANDARD SUBSTANCES: Those substances which do not loose water of crystallization such as sodium bicarbonate, ferrous ammonium sulphate, copper sulphate, silver nitrate etc.
CLASSIFICATION OF REACTIONS IN VOLUMETRIC ANALYSIS:
For convenience sake, reactions in volumetric analysis are classified into four types. However the classification is not strictly followed and overlap may occur.
1. Neutralization reactions (acidimetry and alkalimetry): These reactions are based on the principle of neutralization of a free acid or free base. The free bases or those formed from salts of weak acids by hydrolysis are titrated with a standard acid (acidimetry) or vice versa (alkalimetry). The basic common reaction involves the interaction of hydrogen and hydroxyl ions to form water molecule. Selective acid base indicators are only employed to mark the sudden change in pH during these titrations.
2. Oxidation reduction reactions (redox reactions): These reactions involve a change in the oxidation number or transfer of electrons amongst the reacting substances. The standard solutions are oxidizing or reducing agents. The oxidation reduction indicator should mark the sudden change in the oxidation potential in the neighborhood of the equivalence point.
3. Complex formation reactions: They involve the combination of ions (other than hydrogen and hydroxyl ions) to form a soluble, slightly dissociated ion or compound. Special metallochromic indicators are employed here.
4. Precipitation reactions: They involve the combination of ions (other than hydrogen and hydroxyl ions) to form a simple precipitate. No change in valency occurs. Special adsorption indicators help the detection of the equivalence point.
Concentration of a standard solution is generally expressed in following chemical units.
MOLARITY: Molarity of a solution is defined as the number of gram moles of solute present in one liter of the total solution solution.
NORMALITY: The normality of a solution is defined as the number of gram – equivalents of solute present in one liter of the total solution.
Ppm: Parts per million (Ppm) is a better notation for expressing concentrations of trace quantities of species present. This system is convenient for expressing the concentrations of very dilute solutions. It specifies the number of parts of solute in one million parts of solution and is expressed mathematically as
Ppm = w X106/W
Engineering Chemistry lab manual 2016-17 (II Semester)
M V G R College of Engineering (Autonomous), Vizianagaram. Page 9
where w is the number of grams of solute and W is no of grams of solvent.
One liter of water at room temperature weighs approximately 106 mg; hence a convenient relationship to remember is that one milligram of solute in one liter of water is a concentration of 1ppm. For even more dilute solutions the system parts per billion (Ppb) is employed.
Ppb = w X 109/W

Engineering Chemistry lab manual 2016-17 (II Semester)
M V G R College of Engineering (Autonomous), Vizianagaram. Page 10
GENERAL SAFETY PRECAUTIONS
1. Every student entering into the lab shall wear a white apron or a protective coat, and shoe. 2. While leaving the lab ensure that all gas tap connections, electrical switches shall be kept in off
mode. All instruments must be properly shut down as per instructions of the teacher in charge. Water taps, gas connections and fans, lights etc., may kindly be switched off when they are not required.
3. Students are advised not to tamper electrical or gas connections and they should not touch electrical main switches. They should seek help of the teacher or lab assistant in handling gas or electrical connections. Any malfunction of electrical or gas connections shall immediately be reported to the teacher in charge or lab technician.
4. All water tap connections shall be used as and when needed or be turned into off mode when not in use. Wastage of water shall be avoided and leakage of gas or water shall be immediately reported to lab technician or teacher. Laboratory water should not be used for drinking purposes.
5. All waste solid materials, broken glass, filter papers etc., shall be dumped into dust bins provided. Disposal of solutions or water or washing of apparatus shall be into the water sink only. Insoluble solids should be put in dust bins but not in water sinks. The work tables and working space must be kept neat, dry and clean always before, during and after experiment. Any spilling of material should be cleaned immediately.
6. The bottles and other apparatus should not be moved from one place to another unless instructed by teacher. Reagent bottles should be replaced to their original position soon after use. Otherwise it becomes difficult for another user to trace it.
7. All doors and windows must be kept open while working in the laboratory. Fans and lights should be switched off, if they are not required.
8. Solutions containing strong acids should never be poured directly into the sink. They should be diluted with sufficiently excess water and discharged into the nearby sink slowly.
9. A fuming cup board must be used for handling reactions involving corrosive chemicals like concentrated acids, ammonia etc., volatile compound having foul smell and certain organic compounds.
10. Dry alkalis and concentrated acids should never be touched with hands or spilled over on the skin. In case it happens, the skin exposed must be washed under tap water immediately.
11. The test tubes and open vessels are to be heated with caution. The face of the vessel being heated should not be kept towards your neighboring colleague in lab, as the liquid inside may be ejected on to his face.
12. Heating must be done gradually and carefully. The articles, test tubes or others for heating must be dry or wiped dry to prevent breakage.
13. The nozzles of burettes and pipettes must be protected against casual handling resulting in breakage, as the entire apparatus becomes useless, if its nozzle is broken. If any of the equipment supplied to you is found cracked or broken, immediately report to the lab in charge. Never handle the apparatus carelessly or roughly as it may result in damage or breakage.
14. The glass corks of the volumetric flasks should be tied through a small thread to prevent mixing of stoppers. Replace caps on bottles immediately after use lest they should be interchanged.
15. All electrical devices should be plugged in with a dry hand only, preferably with dry shoes. 16. The balance pan must be clean and dry. Chemicals should not be weighed directly on the pan of
the balance. A watch glass or paper may be used and necessary tare may be made. 17. Students should not sit on the work tables or keep hands for rest on tables for their own safety. 18. Never return unused solutions or solids to the stock containers as they can contaminate the
stock chemicals.

Engineering Chemistry lab manual 2016-17 (II Semester)
M V G R College of Engineering (Autonomous), Vizianagaram. Page 11
19. The floor space in the laboratory shall be clean and free from spillage, broken glass or pieces, straw, cloth pieces or paper to avoid accidents. Leave the laboratory only when your work bench is cleaned and all the apparatus supplied to you is properly returned to the lab technician.
20. Fire buckets containing sand and water or fire extinguishers should always be available in the lab in easily accessible places.
21. When fire originates, all gas taps must be cut off immediately. 22. In case of emergency, do not get panicky and be brave enough to handle the situation. Medical
attention should be requested immediately. If skin comes into contact with acid solutions, it should be washed with water and sodium bicarbonate solution alternately and continuously till skin is smoothened. Similarly exposure to caustic alkalis may be treated with dilute acetic or boric acid solutions and water. Fire scar can be washed thoroughly with water in a tap in the sink and a little oil or pipette be applied. If eyes come into contact with chemicals, wash them with plenty of water and clean them with a dry fresh cloth.
-oOo-

Engineering Chemistry lab manual 2016-17 (II Semester)
M V G R College of Engineering (Autonomous), Vizianagaram. Page 12
INSTRUCTIONS TO THE STUDENTS
The following instructions are offered to the students for acquiring curriculum based skills in Chemistry laboratory, since chemical analysis is a basic component in all branches of Engineering & Technology, which will be useful in later courses of study, research and technical job requirements.
1. The student shall make himself completely familiar with the experiment he/she is about to perform, its theory, procedure and precautions, before the beginning of the experiment.
2. This lab manual is intended to help in this aspect. Each apparatus is designed to be used in a specific manner to give expected results. Even if the experiment is performed in a batch of two or three, each student shall record his/her own observations separately in his observation note book. Students are advised to familiarize themselves with each of the apparatus with the help of this lab manual and further supporting instruction from the teacher.
3. All students should carry an exclusive observation note book and make a record of every observation in it during experimentation immediately. They are advised to perform the experiment in the manner prescribed in the procedure or as instructed by the teacher. If there is a doubt in experimentation, they may consult the teacher and follow the instruction.
4. The student should read the procedure of the experiment and conduct it accordingly. For better results, the precautions to be taken shall be adhered to strictly. Better results are not accidental and they are due to contiguous effort.
5. Students should not use excess amount of reagents or chemicals. The quantities to be used are prescribed in the procedure given in this manual. Sometimes use of excess reagents may lead to adverse results, in addition to wastage of chemicals.
6. After completion of the assigned experiment and proper record of all necessary observations on the note book, the apparatus may be returned to the in charge. Calculations shall be completed in the observation note books to arrive at the results. The results shall be shown to the teacher and his approval in the form of his signature must be obtained on the observation note book for certification on record. Records will not be certified or evaluated unless signed observations are submitted to the teacher.
7. Students are advised to record observations on the spot of experimentation and after approval of the concerned teacher, prepare the record in due proforma and submit for grading in the subsequent week. Every student shall complete the prescribed number of experiments and submit record for certification & evaluation by the concerned teachers and Head. A student without the certified record will not be allowed for external examination at the end of the semester.
8. If there is breakage of supplied equipment or abuse of any instrument the concerned student shall be charged as per present price list. Hence students are advised to verify equipment/ instrument before they obtain and give satisfactory report to lab in charge.
-oOo-

Engineering Chemistry lab manual 2016-17 (II Semester)
M V G R College of Engineering (Autonomous), Vizianagaram. Page 13
EXPERIMENT NO. 1 Date:
ACIDIMETRY – ALKALIMETRY DETERMINATION OF HYDROCHLORIC ACID
AIM: Determination of the concentration and amount of hydrochloric acid in a given volume (100ml) of solution with standard sodium carbonate solution.
APPARATUS & CHEMICALS REQUIRED: Burette, pipette, volumetric flasks, funnel, conical flasks, wash bottle with distilled water, burette stand with suitable burette clamp, white porcelain glazed tile, Analytical balance, weight box with fractional weights& aluminum rider or a digital balance, weighing bottle, anhydrous sodium carbonate AR(solid), watch glass, methyl orange indicator solution.
PRINICIPLE:
2HCl + Na2CO3 2NaCl + H20+CO2
According to the principle of neutralization reactions, a free acid reacts with a base to form salt and water, in which the hydrogen ions of the acid combine with the hydroxyl ions of the free base in stoichiometric proportions, this being common for all acid- base reactions. For example, in the reaction, two moles of hydrochloric acid react with one mole of sodium carbonate. Sodium carbonate, being a salt of strong base sodium hydroxide and weak carbonic acid, shows residual alkaline properties and hence can be considered as a weak base. Since it is available in pure state and satisfies all other required conditions, anhydrous sodium carbonate is a primary standard.
Thus, the concentration of a solution of acid/base can be estimated by titrating it with a standardized base/acid solution. One of the above solutions shall be of known concentration (standard solution). On mixing the two solutions in the process of titration, the reaction goes to completion instantaneously and for estimation of the unknown, the end point should be detected with a suitable indicator, methyl orange solution here. On the addition of hydrochloric acid from burette to sodium carbonate in conical flask, the pH of the solution slowly decreases and crosses the value of 7 at the end point. Methyl orange solution being yellow in its colour above pH 7 shows a pale pink colour at the equivalence point, which indicates the completion of the reaction. During titration, a fixed volume of standard sodium carbonate solution taken in the titration vessel reacts with a measured volume of hydrochloric acid at the end point indicated by the initial addition of a drop or two of methyl orange solution giving a due colour change at the end point. Measurement of these volumes and substitution in the stoichiometric formula gives the concentration of the unknown species i.e., hydrochloric acid here.
PROCEDURE:
PART- A: Preparation of 0.05M sodium carbonate solution (Primary standard):
About 1.325g of AR grade anhydrous sodium carbonate solid sample is weighed accurately in a clean, dry weighing bottle and transferred into a 250ml volumetric flask through a glass funnel. The substance is dissolved completely in a minimum amount of distilled water and the solution is made up to the mark. The solution is made homogeneous by thorough shaking in the stoppered volumetric flask. The particulars of the weights used are tabulated and the concentration of the sodium carbonate solution is calculated using the given formula.

Engineering Chemistry lab manual 2016-17 (II Semester)
M V G R College of Engineering (Autonomous), Vizianagaram. Page 14
OBSERVATIONS:
S. No Contents in the pan grams milligrams Total weight(g)
1 W1
2 W2
CALCULATIONS:
W1 = Weight of weighing bottle with sodium carbonate = g
W2 = Weight of weighing bottle after transferring the sodium carbonate = g
Amount of the sodium carbonate transferred = W1–W2 = g
Concentration of the sodium carbonate = = M
Gram molecular weight (GMW) of sodium carbonate = 106g
PART B: Determination of the concentration of the given hydrochloric acid solution:
The given HCl solution is made up to the mark with distilled water (in the 100 mL volumetric flask) and shaken well to make it homogeneous in concentration. Now, the burette is rinsed with a small volume of given hydrochloric acid solution and the rinsed solution is discharged into the sink. The burette including its nozzle portion is filled with hydrochloric solution supplied without air bubbles, up to the zero mark and allowed to stand vertically for few minutes. 10 ml of the standard sodium carbonate solution is drawn through a pipette into a 250 ml clean conical flask. To this, 10ml of distilled water, 2-3 drops of methyl orange indicator solution are added to give a yellow colour. This mixture is then titrated with the hydrochloric acid solution run down from the burette. The contents of the conical flask are swirled throughout the titration, till the end point is reached. The end point is determined by a change in colour of the solution from yellow to pale pink. The slightest pale pink colour obtained at the end point in the white back drop of the porcelain tile and noting the initial and final burette readings marks the end of the titration. The difference in the initial and final readings of the burette gives the volume of HCl reacted with 10 ml of the sodium carbonate solution taken. The same procedure of titration is repeated until concurrent readings are obtained and all the observations are tabulated.
OBSERVATIONS:
S.No Volume of sodium carbonate taken, in ml
Burette reading Volume of HCl rundown in ml
Initial Final
1
2
3
Engineering Chemistry lab manual 2016-17 (II Semester)
M V G R College of Engineering (Autonomous), Vizianagaram. Page 15
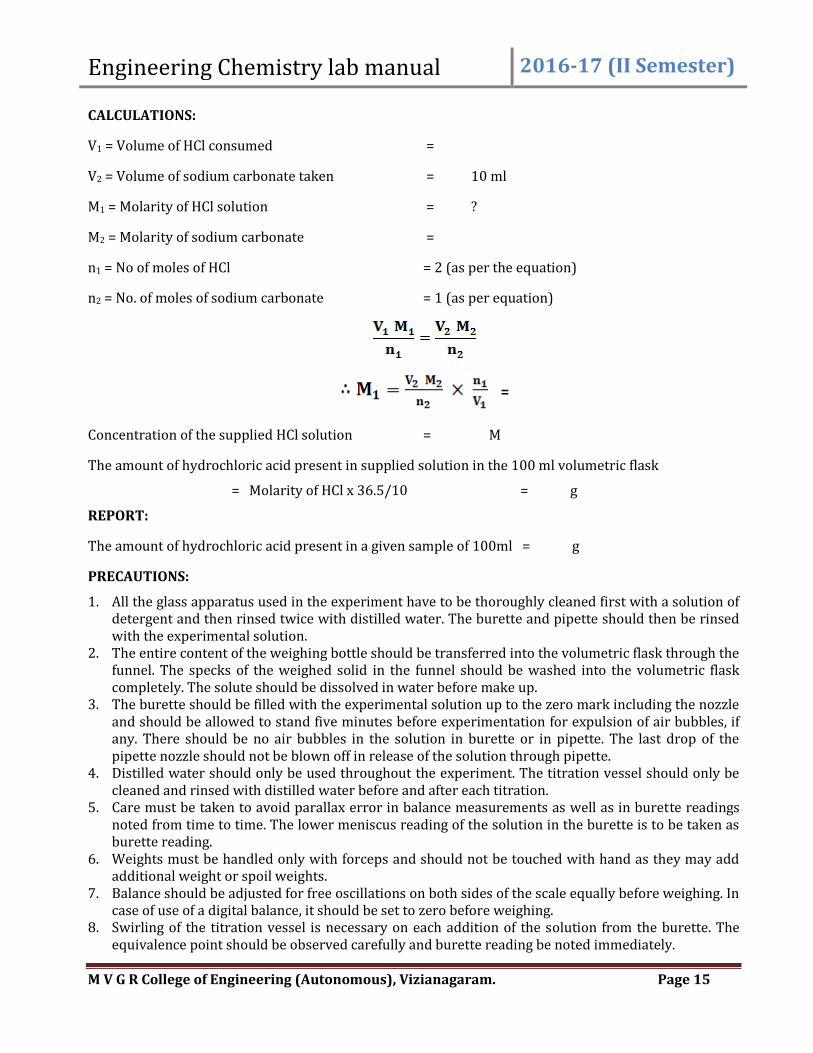
CALCULATIONS:
V1 = Volume of HCl consumed =
V2 = Volume of sodium carbonate taken = 10 ml
M1 = Molarity of HCl solution = ?
M2 = Molarity of sodium carbonate =
n1 = No of moles of HCl = 2 (as per the equation)
n2 = No. of moles of sodium carbonate = 1 (as per equation)
=
Concentration of the supplied HCl solution = M
The amount of hydrochloric acid present in supplied solution in the 100 ml volumetric flask
= Molarity of HCl x 36.5/10 = g
REPORT:
The amount of hydrochloric acid present in a given sample of 100ml = g
PRECAUTIONS:
1. All the glass apparatus used in the experiment have to be thoroughly cleaned first with a solution of detergent and then rinsed twice with distilled water. The burette and pipette should then be rinsed with the experimental solution.
2. The entire content of the weighing bottle should be transferred into the volumetric flask through the funnel. The specks of the weighed solid in the funnel should be washed into the volumetric flask completely. The solute should be dissolved in water before make up.
3. The burette should be filled with the experimental solution up to the zero mark including the nozzle and should be allowed to stand five minutes before experimentation for expulsion of air bubbles, if any. There should be no air bubbles in the solution in burette or in pipette. The last drop of the pipette nozzle should not be blown off in release of the solution through pipette.
4. Distilled water should only be used throughout the experiment. The titration vessel should only be cleaned and rinsed with distilled water before and after each titration.
5. Care must be taken to avoid parallax error in balance measurements as well as in burette readings noted from time to time. The lower meniscus reading of the solution in the burette is to be taken as burette reading.
6. Weights must be handled only with forceps and should not be touched with hand as they may add additional weight or spoil weights.
7. Balance should be adjusted for free oscillations on both sides of the scale equally before weighing. In case of use of a digital balance, it should be set to zero before weighing.
8. Swirling of the titration vessel is necessary on each addition of the solution from the burette. The equivalence point should be observed carefully and burette reading be noted immediately.
Engineering Chemistry lab manual 2016-17 (II Semester)
M V G R College of Engineering (Autonomous), Vizianagaram. Page 16
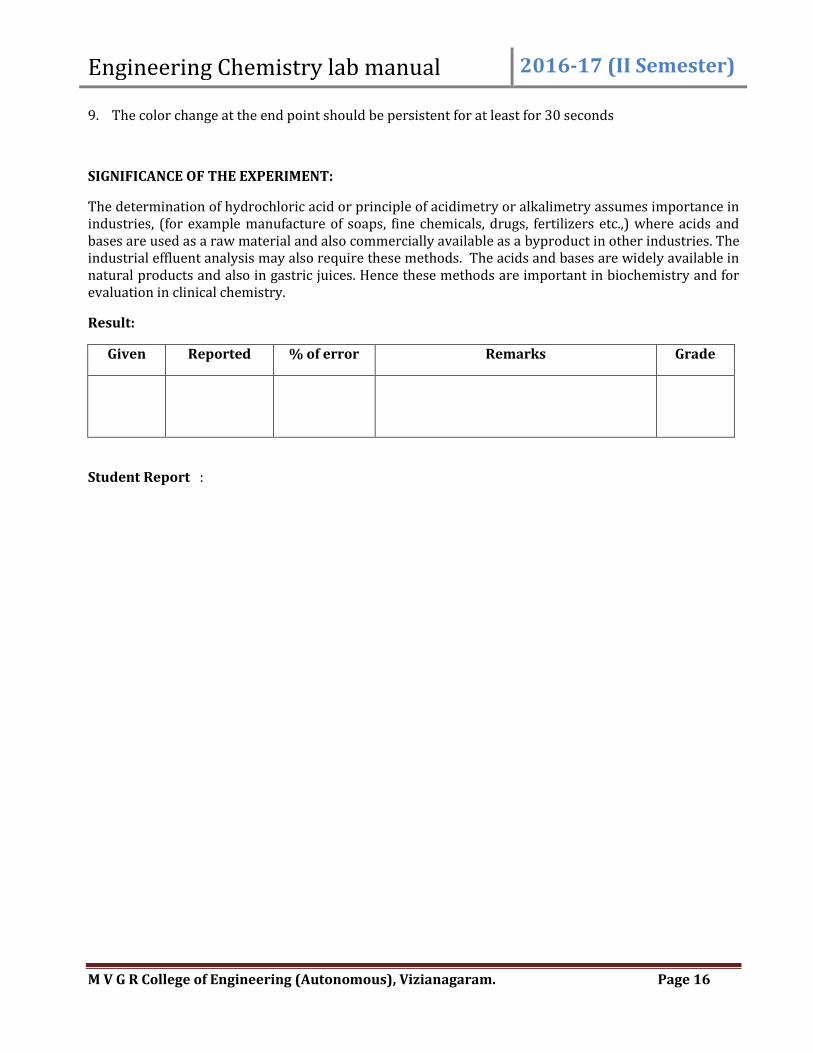
9. The color change at the end point should be persistent for at least for 30 seconds
SIGNIFICANCE OF THE EXPERIMENT:
The determination of hydrochloric acid or principle of acidimetry or alkalimetry assumes importance in industries, (for example manufacture of soaps, fine chemicals, drugs, fertilizers etc.,) where acids and bases are used as a raw material and also commercially available as a byproduct in other industries. The industrial effluent analysis may also require these methods. The acids and bases are widely available in natural products and also in gastric juices. Hence these methods are important in biochemistry and for evaluation in clinical chemistry.
Result:
Given Reported % of error Remarks Grade
Student Report :

Engineering Chemistry lab manual 2016-17 (II Semester)
M V G R College of Engineering (Autonomous), Vizianagaram. Page 17

Engineering Chemistry lab manual 2016-17 (II Semester)
M V G R College of Engineering (Autonomous), Vizianagaram. Page 18
EXPERIMENT NO. 2 Date:
REDOX TITRATION – PERMANGANAMETRY
Determination of permanganate by standard sodium oxalate
AIM: Determination of the concentration and amount of potassium permanganate present in the given volume of a solution ( 100ml) using a standard solution of sodium oxalate.
APPARATUS & CHEMICALS REQUIRED: Burette, pipette, volumetric flasks, funnel, conical flasks, wash bottle with distilled water, burette stand with suitable burette clamp, white porcelain glazed tile, heating mantle or Bunsen burner, Analytical balance, weight box with fractional weights or digital balance, weighing bottle, potassium permanganate solution, AR sodium oxalate solid , watch glass, sulphuric acid.
PRINCIPLE:
Oxidation – reduction reactions involve a change in the valence of the chemical species involved in the reaction, due to loss or gain of electrons. Oxidation is loss of electrons and reduction is gain of electrons, which are complementary to one another and occur simultaneously- one cannot take place without the other. The reagent suffering oxidation is termed the reductant or reducing agent. The reagent undergoing reduction is oxidant or oxidizing agent. According to modern theories, an electric current is essentially transfer of electrons.
Potassium permanganate (KMnO4, mol. wt. 158) is a valuable and powerful oxidizing agent in both acid and alkaline media. However, it is not a primary standard due to several impurities remaining, even after purification. Since its standard potential is high in acid solutions, it is a strong oxidizing agent in acid medium, sulphuric acid being the most suitable. It reacts with sodium oxalate in acid medium as given in the following equation.
2KMnO4 + 8H2SO4 + 5Na2C2O4 K2SO4 + 2MnSO4 + 5Na2SO4 + 10CO2 + 8H2O
Sodium oxalate is a primary standard and is available in pure dry state. It is non-hygroscopic and stable on drying. If necessary, it can be dried for two hours before the experiment. It is soluble in water and the solutions are stable over a good period of time and do not undergo air oxidation or photochemical reaction. Since potassium permanganate has an inherent pink colour which disappears during the titration process, no indicator is needed in this titration and the reaction is classified as self indicator type of reaction. The reaction may be slow at the addition of the first drop from burette, but picks up speed in swirling due to autocatalysis with manganous sulphate formed during the course of the above reaction. With these advantages, estimation of potassium permanganate with sodium oxalate solution assumes considerable importance in analysis.
PROCEDURE:
PART-A: Preparation of 0.02M sodium oxalate solution:
About 0.65g of AR grade sodium oxalate solid sample is weighed accurately in a clean, dry weighing bottle and transferred into a 250ml volumetric flask through a glass funnel. The substance is dissolved completely in a minimum amount of distilled water and the solution is made up to the mark. The solution is made homogeneous by thorough shaking in the stoppered volumetric flask. The particulars of the weights used are tabulated and the concentration of sodium oxalate is calculated using the given formula.
Engineering Chemistry lab manual 2016-17 (II Semester)
M V G R College of Engineering (Autonomous), Vizianagaram. Page 19
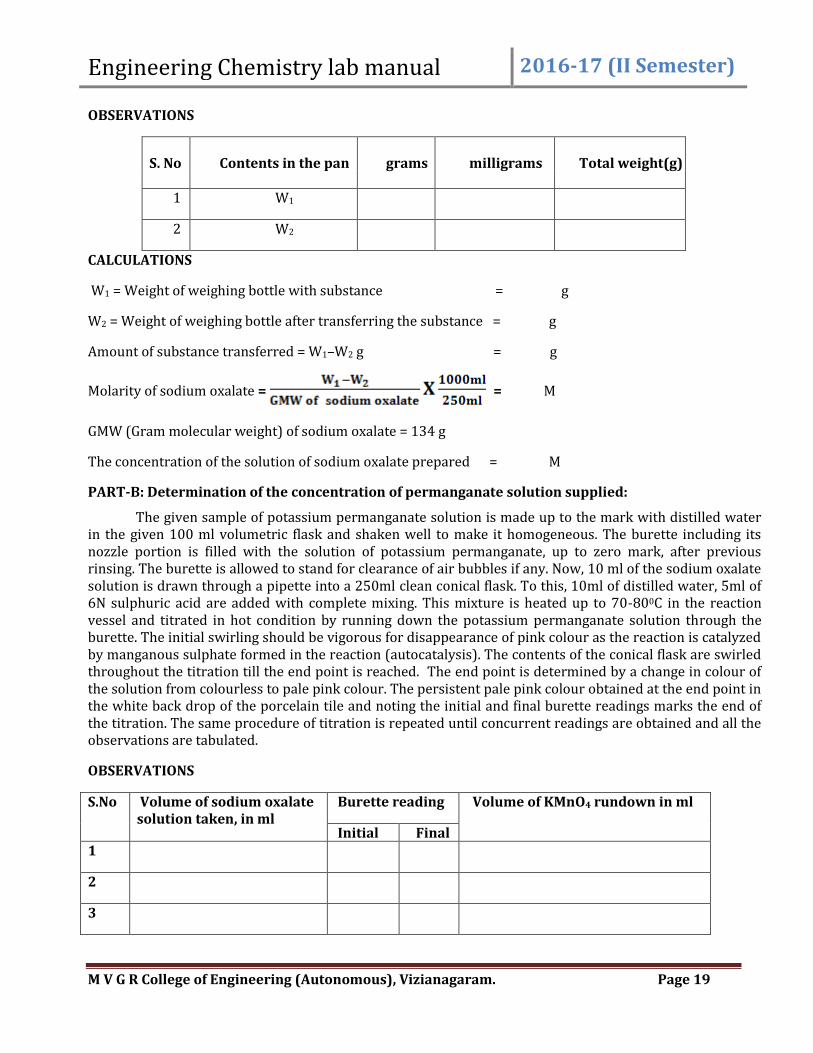
OBSERVATIONS
S. No Contents in the pan grams milligrams Total weight(g)
1 W1
2 W2
CALCULATIONS
W1 = Weight of weighing bottle with substance = g
W2 = Weight of weighing bottle after transferring the substance = g
Amount of substance transferred = W1–W2 g = g
Molarity of sodium oxalate = = M
GMW (Gram molecular weight) of sodium oxalate = 134 g
The concentration of the solution of sodium oxalate prepared = M
PART-B: Determination of the concentration of permanganate solution supplied:
The given sample of potassium permanganate solution is made up to the mark with distilled water in the given 100 ml volumetric flask and shaken well to make it homogeneous. The burette including its nozzle portion is filled with the solution of potassium permanganate, up to zero mark, after previous rinsing. The burette is allowed to stand for clearance of air bubbles if any. Now, 10 ml of the sodium oxalate solution is drawn through a pipette into a 250ml clean conical flask. To this, 10ml of distilled water, 5ml of 6N sulphuric acid are added with complete mixing. This mixture is heated up to 70-800C in the reaction vessel and titrated in hot condition by running down the potassium permanganate solution through the burette. The initial swirling should be vigorous for disappearance of pink colour as the reaction is catalyzed by manganous sulphate formed in the reaction (autocatalysis). The contents of the conical flask are swirled throughout the titration till the end point is reached. The end point is determined by a change in colour of the solution from colourless to pale pink colour. The persistent pale pink colour obtained at the end point in the white back drop of the porcelain tile and noting the initial and final burette readings marks the end of the titration. The same procedure of titration is repeated until concurrent readings are obtained and all the observations are tabulated.
OBSERVATIONS
S.No Volume of sodium oxalate solution taken, in ml
Burette reading Volume of KMnO4 rundown in ml
Initial Final 1
2
3

Engineering Chemistry lab manual 2016-17 (II Semester)
M V G R College of Engineering (Autonomous), Vizianagaram. Page 20
CALCULATIONS
M1= Concentration of potassium permanganate solution = ?
V1 = Volume of the potassium permanganate run down from burette = ml
= No. of moles of permanganate as per equation = 2
M2 =Concentration of sodium oxalate solution prepared =
V2 = Volume of sodium oxalate solution pipette out = 10 ml
= No. of moles of sodium oxalate as per equation = 5
=
=
Concentration of potassium permanganate present in given 100 ml of solution (M1) =
Amount of potassium permanganate present in given 100ml solution =
= g
Molecular weight of KMnO4 = 158
PRECAUTIONS:
1. All the glass apparatus used in the experiment have to be thoroughly cleaned first with a solution of detergent and then rinsed twice with distilled water. The burette and pipette should then be rinsed with experimental solutions.
2. The entire content of the weighing bottle should be transferred into the volumetric flask through the funnel. The specks of the weighed solid in the funnel should be washed into the volumetric flask completely. The solute should be dissolved in water before make up.
3. The burette should be filled with the experimental solution up to the zero mark including the nozzle and should be allowed to stand five minutes before experimentation. There should be no air bubbles in the solution in burette or in pipette. The last drop of the pipette nozzle should not be blown off in release of the solution through pipette.
4. Distilled water should only be used throughout the experiment. The titration vessel should only be cleaned and rinsed with distilled water before and after each titration.
5. Proper care must be taken to avoid parallax error in balance measurements as well as in burette readings noted from time to time. The lower meniscus reading in the burette is to be taken as burette reading.
6. Sufficient time for reaction and swirling for interaction must be allowed before noting the end point carefully.
7. Weights must be handled only with forceps and should not be touched with hand as they may add additional weight.

Engineering Chemistry lab manual 2016-17 (II Semester)
M V G R College of Engineering (Autonomous), Vizianagaram. Page 21
8. Balance should be adjusted for free oscillations on both sides of the scale equally before weighing. The oscillations of the pointer are limited within the scale. In case of use of a digital balance, it should be set to zero before weighing.
9. Swirling of the titration vessel is necessary on each addition of the solution from the burette. The equivalence point should be observed carefully and burette reading be noted immediately.
10. The color change at the end point should be persistent for at least 30 seconds.
SIGNIFICANCE OF THE EXPERIMENT:
These titrations assume importance in the determination of potassium permanganate in the quick determination in ores, and have wide significance in steel and allied industries. Since it is not a primary standard but strong oxidizing agent in both acid and alkaline media, its determination assumes considerable importance in analytical as well as organic chemistry. The branch of analysis is specifically termed as permanganametry and has wide applications.
.
Result:
Given Reported % of error Remarks Grade
Student Report :

Engineering Chemistry lab manual 2016-17 (II Semester)
M V G R College of Engineering (Autonomous), Vizianagaram. Page 22
Engineering Chemistry lab manual 2016-17 (II Semester)
M V G R College of Engineering (Autonomous), Vizianagaram. Page 23
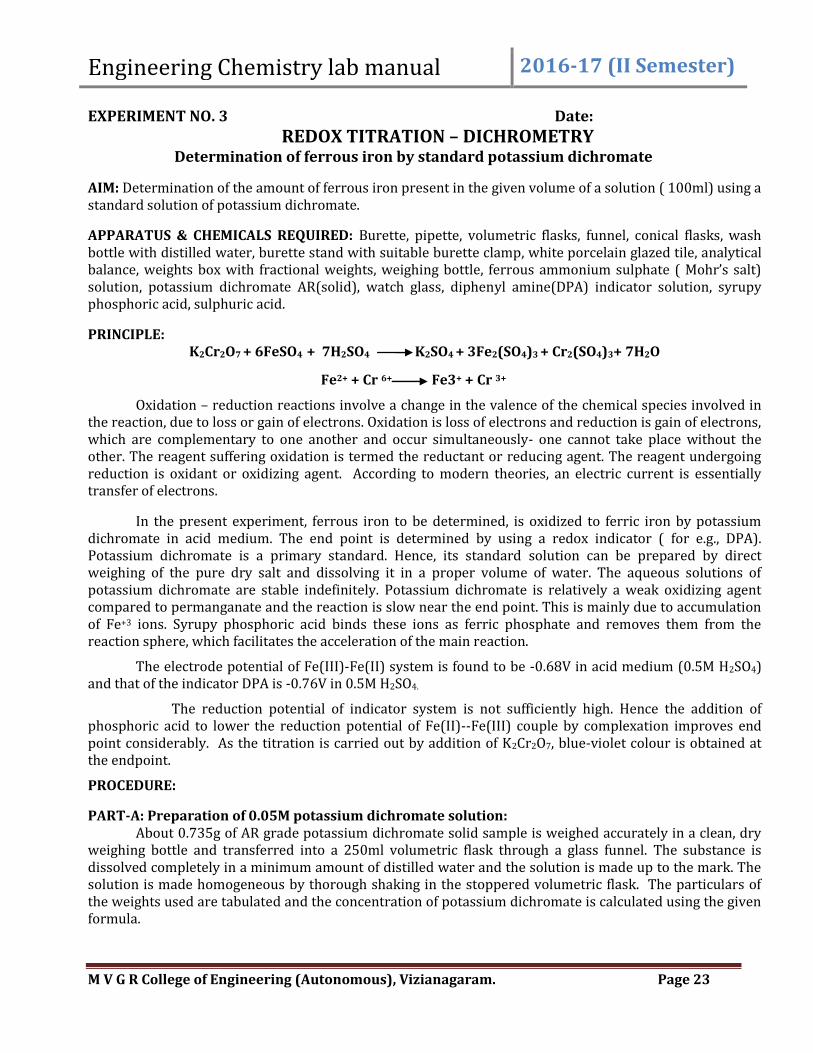
EXPERIMENT NO. 3 Date:
REDOX TITRATION – DICHROMETRY Determination of ferrous iron by standard potassium dichromate
AIM: Determination of the amount of ferrous iron present in the given volume of a solution ( 100ml) using a standard solution of potassium dichromate.
APPARATUS & CHEMICALS REQUIRED: Burette, pipette, volumetric flasks, funnel, conical flasks, wash bottle with distilled water, burette stand with suitable burette clamp, white porcelain glazed tile, analytical balance, weights box with fractional weights, weighing bottle, ferrous ammonium sulphate ( Mohr’s salt) solution, potassium dichromate AR(solid), watch glass, diphenyl amine(DPA) indicator solution, syrupy phosphoric acid, sulphuric acid.
PRINCIPLE: K2Cr2O7 + 6FeSO4 + 7H2SO4 K2SO4 + 3Fe2(SO4)3 + Cr2(SO4)3+ 7H2O
Fe2+ + Cr 6+ Fe3+ + Cr 3+
Oxidation – reduction reactions involve a change in the valence of the chemical species involved in the reaction, due to loss or gain of electrons. Oxidation is loss of electrons and reduction is gain of electrons, which are complementary to one another and occur simultaneously- one cannot take place without the other. The reagent suffering oxidation is termed the reductant or reducing agent. The reagent undergoing reduction is oxidant or oxidizing agent. According to modern theories, an electric current is essentially transfer of electrons.
In the present experiment, ferrous iron to be determined, is oxidized to ferric iron by potassium dichromate in acid medium. The end point is determined by using a redox indicator ( for e.g., DPA). Potassium dichromate is a primary standard. Hence, its standard solution can be prepared by direct weighing of the pure dry salt and dissolving it in a proper volume of water. The aqueous solutions of potassium dichromate are stable indefinitely. Potassium dichromate is relatively a weak oxidizing agent compared to permanganate and the reaction is slow near the end point. This is mainly due to accumulation of Fe+3 ions. Syrupy phosphoric acid binds these ions as ferric phosphate and removes them from the reaction sphere, which facilitates the acceleration of the main reaction.
The electrode potential of Fe(III)-Fe(II) system is found to be -0.68V in acid medium (0.5M H2SO4) and that of the indicator DPA is -0.76V in 0.5M H2SO4.
The reduction potential of indicator system is not sufficiently high. Hence the addition of phosphoric acid to lower the reduction potential of Fe(II)--Fe(III) couple by complexation improves end point considerably. As the titration is carried out by addition of K2Cr2O7, blue-violet colour is obtained at the endpoint.
PROCEDURE:
PART-A: Preparation of 0.05M potassium dichromate solution: About 0.735g of AR grade potassium dichromate solid sample is weighed accurately in a clean, dry
weighing bottle and transferred into a 250ml volumetric flask through a glass funnel. The substance is dissolved completely in a minimum amount of distilled water and the solution is made up to the mark. The solution is made homogeneous by thorough shaking in the stoppered volumetric flask. The particulars of the weights used are tabulated and the concentration of potassium dichromate is calculated using the given formula.
Engineering Chemistry lab manual 2016-17 (II Semester)
M V G R College of Engineering (Autonomous), Vizianagaram. Page 24
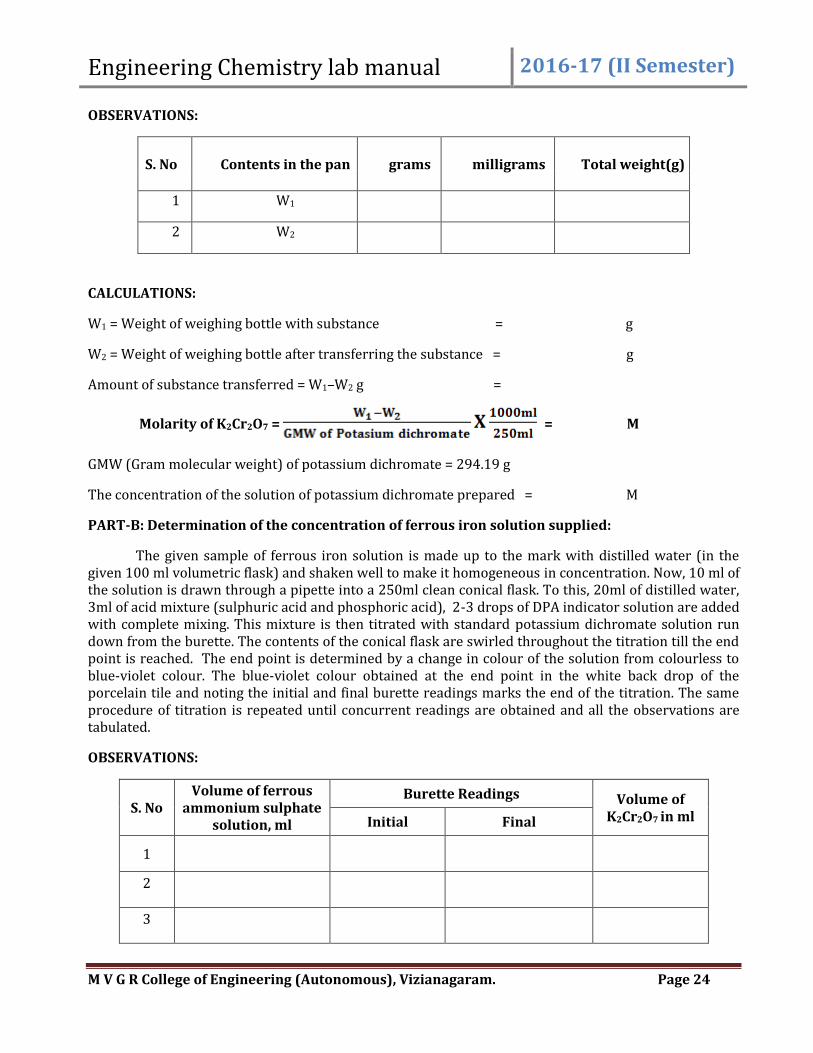
OBSERVATIONS:
S. No Contents in the pan grams milligrams Total weight(g)
1 W1
2 W2
CALCULATIONS:
W1 = Weight of weighing bottle with substance = g
W2 = Weight of weighing bottle after transferring the substance = g
Amount of substance transferred = W1–W2 g =
Molarity of K2Cr2O7 = = M
GMW (Gram molecular weight) of potassium dichromate = 294.19 g
The concentration of the solution of potassium dichromate prepared = M
PART-B: Determination of the concentration of ferrous iron solution supplied:
The given sample of ferrous iron solution is made up to the mark with distilled water (in the given 100 ml volumetric flask) and shaken well to make it homogeneous in concentration. Now, 10 ml of the solution is drawn through a pipette into a 250ml clean conical flask. To this, 20ml of distilled water, 3ml of acid mixture (sulphuric acid and phosphoric acid), 2-3 drops of DPA indicator solution are added with complete mixing. This mixture is then titrated with standard potassium dichromate solution run down from the burette. The contents of the conical flask are swirled throughout the titration till the end point is reached. The end point is determined by a change in colour of the solution from colourless to blue-violet colour. The blue-violet colour obtained at the end point in the white back drop of the porcelain tile and noting the initial and final burette readings marks the end of the titration. The same procedure of titration is repeated until concurrent readings are obtained and all the observations are tabulated.
OBSERVATIONS:
S. No Volume of ferrous
ammonium sulphate solution, ml
Burette Readings Volume of K2Cr2O7 in ml Initial Final
1
2
3
Engineering Chemistry lab manual 2016-17 (II Semester)
M V G R College of Engineering (Autonomous), Vizianagaram. Page 25
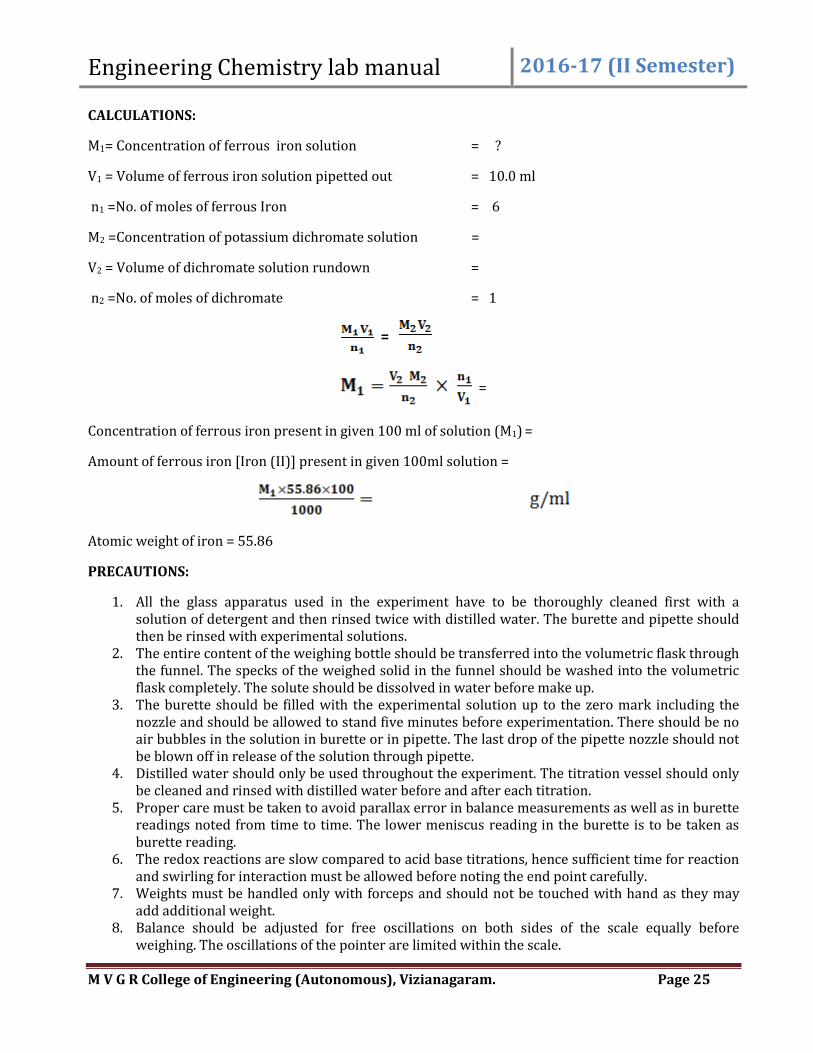
CALCULATIONS:
M1= Concentration of ferrous iron solution = ?
V1 = Volume of ferrous iron solution pipetted out = 10.0 ml
n1 =No. of moles of ferrous Iron = 6
M2 =Concentration of potassium dichromate solution =
V2 = Volume of dichromate solution rundown =
n2 =No. of moles of dichromate = 1
=
=
Concentration of ferrous iron present in given 100 ml of solution (M1) =
Amount of ferrous iron [Iron (II)] present in given 100ml solution =
Atomic weight of iron = 55.86
PRECAUTIONS:
1. All the glass apparatus used in the experiment have to be thoroughly cleaned first with a solution of detergent and then rinsed twice with distilled water. The burette and pipette should then be rinsed with experimental solutions.
2. The entire content of the weighing bottle should be transferred into the volumetric flask through the funnel. The specks of the weighed solid in the funnel should be washed into the volumetric flask completely. The solute should be dissolved in water before make up.
3. The burette should be filled with the experimental solution up to the zero mark including the nozzle and should be allowed to stand five minutes before experimentation. There should be no air bubbles in the solution in burette or in pipette. The last drop of the pipette nozzle should not be blown off in release of the solution through pipette.
4. Distilled water should only be used throughout the experiment. The titration vessel should only be cleaned and rinsed with distilled water before and after each titration.
5. Proper care must be taken to avoid parallax error in balance measurements as well as in burette readings noted from time to time. The lower meniscus reading in the burette is to be taken as burette reading.
6. The redox reactions are slow compared to acid base titrations, hence sufficient time for reaction and swirling for interaction must be allowed before noting the end point carefully.
7. Weights must be handled only with forceps and should not be touched with hand as they may add additional weight.
8. Balance should be adjusted for free oscillations on both sides of the scale equally before weighing. The oscillations of the pointer are limited within the scale.

Engineering Chemistry lab manual 2016-17 (II Semester)
M V G R College of Engineering (Autonomous), Vizianagaram. Page 26
9. Swirling of the titration vessel is necessary on each addition of the solution from the burette. The equivalence point should be observed carefully and burette reading be noted immediately.
10. The color change at the end point should be persistent for at least 30 seconds.
SIGNIFICANCE OF THE EXPERIMENT:
These titrations assume importance in the determination of ferrous iron in the quick determination in ores, total iron in iron ore, alloys and have wide significance in steel and allied industries. They are also useful in the determination of extent of corrosion and rusting of marine and other equipment. Ferrous iron is an important species in biochemical molecules and natural products. These procedures are also useful in determining ferrous iron in drug formulations such as ferrous fumarate, ferrous gluconate, fesofur etc., soil, fruits and vegetables. Iron in ferrous state is an essential element in human body present in considerable quantity, its estimation is important in noting problems leading to anemia.
Result:
Given Reported % of error Remarks Grade
Student Report :

Engineering Chemistry lab manual 2016-17 (II Semester)
M V G R College of Engineering (Autonomous), Vizianagaram. Page 27
Engineering Chemistry lab manual 2016-17 (II Semester)
M V G R College of Engineering (Autonomous), Vizianagaram. Page 28
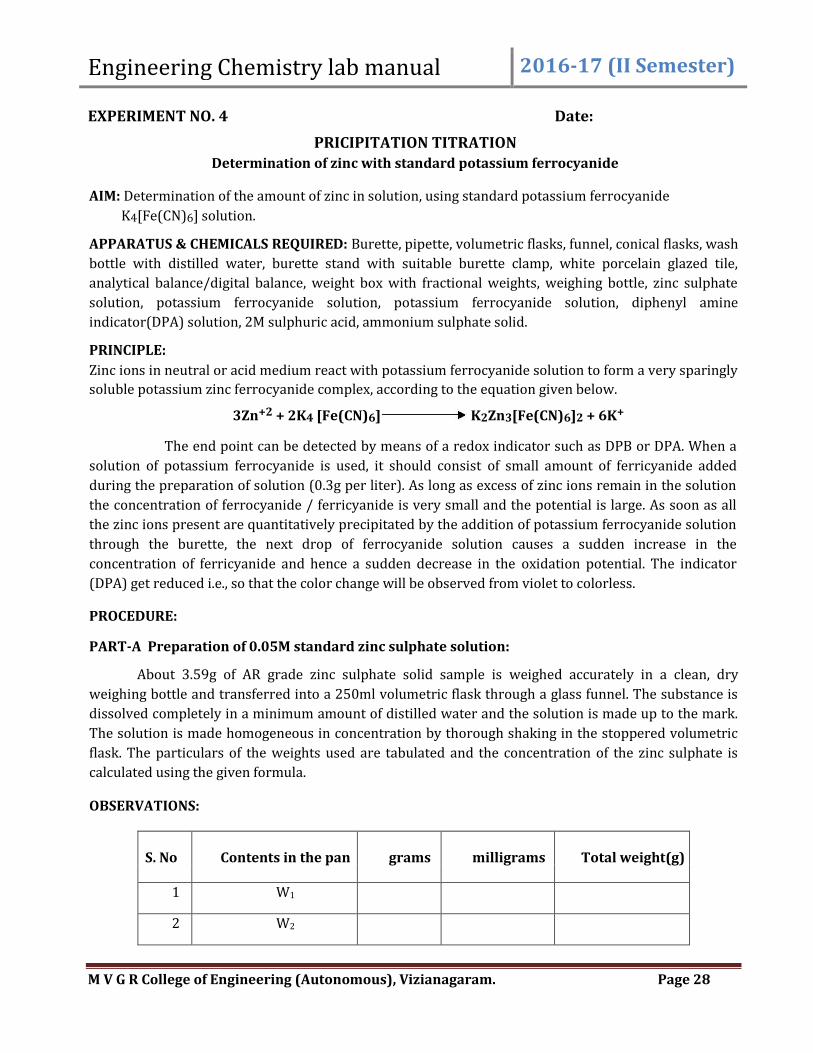
EXPERIMENT NO. 4 Date:
PRICIPITATION TITRATION Determination of zinc with standard potassium ferrocyanide
AIM: Determination of the amount of zinc in solution, using standard potassium ferrocyanide K4[Fe(CN)6] solution. APPARATUS & CHEMICALS REQUIRED: Burette, pipette, volumetric flasks, funnel, conical flasks, wash
bottle with distilled water, burette stand with suitable burette clamp, white porcelain glazed tile,
analytical balance/digital balance, weight box with fractional weights, weighing bottle, zinc sulphate
solution, potassium ferrocyanide solution, potassium ferrocyanide solution, diphenyl amine
indicator(DPA) solution, 2M sulphuric acid, ammonium sulphate solid. PRINCIPLE: Zinc ions in neutral or acid medium react with potassium ferrocyanide solution to form a very sparingly
soluble potassium zinc ferrocyanide complex, according to the equation given below.
3Zn+2 + 2K4 [Fe(CN)6] K2Zn3[Fe(CN)6]2 + 6K+
The end point can be detected by means of a redox indicator such as DPB or DPA. When a
solution of potassium ferrocyanide is used, it should consist of small amount of ferricyanide added
during the preparation of solution (0.3g per liter). As long as excess of zinc ions remain in the solution
the concentration of ferrocyanide / ferricyanide is very small and the potential is large. As soon as all
the zinc ions present are quantitatively precipitated by the addition of potassium ferrocyanide solution
through the burette, the next drop of ferrocyanide solution causes a sudden increase in the
concentration of ferricyanide and hence a sudden decrease in the oxidation potential. The indicator
(DPA) get reduced i.e., so that the color change will be observed from violet to colorless.
PROCEDURE:
PART-A Preparation of 0.05M standard zinc sulphate solution:
About 3.59g of AR grade zinc sulphate solid sample is weighed accurately in a clean, dry
weighing bottle and transferred into a 250ml volumetric flask through a glass funnel. The substance is
dissolved completely in a minimum amount of distilled water and the solution is made up to the mark.
The solution is made homogeneous in concentration by thorough shaking in the stoppered volumetric
flask. The particulars of the weights used are tabulated and the concentration of the zinc sulphate is
calculated using the given formula. OBSERVATIONS:
S. No Contents in the pan grams milligrams Total weight(g)
1 W1
2 W2

Engineering Chemistry lab manual 2016-17 (II Semester)
M V G R College of Engineering (Autonomous), Vizianagaram. Page 29
CALCULATIONS:
W1 = Weight of weighing bottle with zinc sulphate = g
W2 = Weight of weighing bottle after transferring the zinc sulphate = g
Amount of the Zinc sulphate transferred = W1–W2 = g
Concentration of the Zinc sulphate= x = M
Gram molecular weight (GMW) of Zinc sulphate = 287.54g
PART- B- Standardization of potassium ferrocyanide solution:
The burette is filled with potassium ferrocyanide solution supplied. Exactly 10ml of standard
zinc sulphate solution prepared is transferred into a clean conical flask with a pipette. This solution is
mixed with about 15ml of 2M sulphuric acid, 0.5 g of ammonium sulphate solid and three drops of
diphenylamine indicator (DPA) solution. The contents of the conical flask are titrated against potassium
ferrocyanide solution filled in burette, until greenish white precipitate is formed. The mixture in the
conical flask is swirled throughout the titration till the end point is reached. The end point is
determined by a change in the colour of the solution from colourless to pale green colour precipitate.
The pale green colour precipitate obtained at the end point in the white back drop of the porcelain tile
and noting the initial and final burette readings marks the end of the titration. The same procedure of
titration is repeated until concurrent readings are obtained and all the observations are tabulated. OBSERVATIONS:
Volume of Zinc Burette Readings Volume of
S. No
K4[Fe(CN)6]
solution(ml) Initial
Final
rundown(ml)
1
2
3
CALCULATIONS:
V1 = Volume of zinc sulphate taken = 10ml V2 = Volume of K4[Fe(CN)6] rundown =
M1 = Molarity of zinc sulphate = M2 = Molarity of K4[Fe(CN)6] = ?
n1 = No. of moles of zinc sulphate = 1 n2 = No. of moles of K4[Fe(CN)6] = 1
Concentration of potassium ferrocyanide solution: = M

Engineering Chemistry lab manual 2016-17 (II Semester)
M V G R College of Engineering (Autonomous), Vizianagaram. Page 30
PART-C –Determination of the concentration of zinc sulphate solution supplied:
The given zinc sulphate solution is made up to the mark with distilled water and shaken well to
make it homogeneous in concentration. About 10ml of this solution is drawn through a pipette into a
clean conical flask, followed by the addition of 15ml of 2M sulphuric acid, 0.5g of ammonium sulphate
and 2 or 3 drops of DPA indictor. The contents of the flask are titrated against potassium ferrocyanide
solution from the burette. The mixture in the conical flask is swirled throughout the titration till the end
point is reached. The end point is determined by a change in colour of the solution from colourless to
pale green colour precipitate. The pale green colour precipitate obtained at the end point in the white
back drop of the porcelain tile and noting the initial and final burette readings marks the end of the
titration. The end point is indicated by the formation of greenish white precipitate, the titration is
repeated for concurrent values and the values are tabulated. OBSERVATIONS:
Volume of Zinc
Burette Readings Volume of
S. No
K4[Fe(CN)6]
solution(ml) Initial
Final
rundown(ml)
1
2
3
CALCULATIONS:
V3 = Volume of zinc sulphate taken = 10ml V2 = Volume of K4[Fe(CN)6] rundown =
M3 = Molarity of zinc sulphate = M2 = Molarity of K4[Fe(CN)6] = ?
N3 = No. of moles of zinc sulphate = 1 n2 = No. of moles of K4[Fe(CN)6] = 1
Amount of zinc present in the solution = (M3 x atomic weight of Zn X 100)/1000 g Atomic weight of zinc = 65.38 RESULT The amount of zinc present in 100 ml of the given solution is = g PRECAUTIONS:
1. All the glass apparatus used in the experiment have to be thoroughly cleaned first with a
solution of detergent and then rinsed twice with distilled water. The burette and pipette should
then be rinsed with experimental solutions.
2. The entire content of the weighing bottle should be transferred into the volumetric flask through

Engineering Chemistry lab manual 2016-17 (II Semester)
M V G R College of Engineering (Autonomous), Vizianagaram. Page 31
the funnel. The specks of the weighed solid in the funnel should be washed into the volumetric
flask completely. The solute should be dissolved in water before make up 3. The burette should be filled with the experimental solution up to the zero mark including the
nozzle and should be allowed to stand five minutes before experimentation. There should be no
air bubbles in the solution in burette or in pipette. The last drop of the pipette nozzle should not
be blown off in release of the solution through pipette. 4. Distilled water should only be used throughout the experiment. The titration vessel should only
be cleaned and rinsed with distilled water before and after each titration. 5. Proper care must be taken to avoid parallax error in balance measurements as well as in burette
readings noted from time to time. The lower meniscus reading in the burette is to be taken as
burette reading. 6. The redox reactions are slow compared to acid base titrations, hence sufficient time for reaction
and swirling for interaction must be allowed before noting the end point carefully. 7. Weights must be handled only with forceps and should not be touched with hand, as they may
add additional weight. 8. Balance should be adjusted for free oscillations on both sides of the scale equally before
weighing. The oscillations of the pointer are limited within the scale. 9. Swirling of the titration vessel is necessary on each addition of the solution from the burette. The
equivalence point should be observed carefully and burette reading be noted immediately. 10. Due care is to be taken during the preparation of ferrocyanide, by adding little amount of
ferricyanide to maintain redox potential and to prevent the hydrolysis of ferrous iron. 11. The titration must not be carried out too rapidly and the solution must be thoroughly shaken
throughout the titration, otherwise over-titration may easily occur. Reducing substance must be absent since they effect the redox potential of the system.
12. At the end point, the greenish white precipitate may not be visible clearly, therefore titration is to be carried out slowly.
SIGNIFICANCE OF THE EXPERIMENT:
This experiment to estimate the amount of zinc in solutions assumes importance in soil
chemistry, paints, analysis of alloys, zinc plating and galvanization industries and such related
electro chemical industries as battery manufacture etc. This is also useful in biochemistry and
clinical chemistry as zinc ion is one of the essential elements required for human body. Result:
Given Reported % of error Remarks Grade
Student Report :

Engineering Chemistry lab manual 2016-17 (II Semester)
M V G R College of Engineering (Autonomous), Vizianagaram. Page 32

Engineering Chemistry lab manual 2016-17 (II Semester)
M V G R College of Engineering (Autonomous), Vizianagaram. Page 33
EXPERIMENT NO. 5 Date:
COMPLEXOMETRY
DETERMINATION OF TOTAL HARDNESS OF WATER
AIM: Determination of total hardness of a selected/supplied water sample with EDTA by a complexometric method.
APPARATUS & CHEMICALS REQUIRED: Burette, pipette, volumetric flasks, funnel, conical flasks, wash bottle with distilled water, burette stand with suitable burette clamp, white porcelain glazed tile, Analytical balance, weight box with fractional weights& aluminum rider, weighing bottle, EDTA solution, zinc sulphate AR(solid), Eriochrome black T (EBT) indicator solution, buffer solution (NH4Cl +NH4OH) of pH 10, watch glass.
PRINICIPLE:
The natural waters contain many dissolved salts as it flows through minerals, organic matter in dissolved or suspended state and other suspended or colloidal particles. The hardness of water is caused due to the quantity of cations with +2 and +3 charge, but mainly due to calcium and magnesium ions. Temporary hardness due to bicarbonates can be removed by heating, but permanent hardness can be eliminated only by chemical treatment. For this, the extent of presence of these ions should be determined by a chemical analysis.
The total hardness of water is generally due to dissolved calcium and magnesium salts. Water with hardness up to 50ppm is known as soft water and if the limit exceeds, it is considered as hard water. Water up to 50 ppm is regarded as soft, 50 to 150 ppm as medium and 150 to 300 ppm is moderately hard and above 300 ppm is hard water. Hard water does not give lather with a solution of soap. Elimination of the calcium and magnesium ions makes the water soft which gives lather with soap solution, so that cleaning/ laundering with soap is possible.
Hardness of water is expression for the sum of the calcium and magnesium ion concentration in a water sample. The standard way to express total hardness of water is in ppm of CaCO3 (of formula weight 100.1)
Ethylene diamine tetra acetic acid (EDTA) or its sodium salt forms stable complexes with bivalent metal cations of calcium and magnesium at pH 10. EDTA has four ionizable hydrogen ions, which are available for coordination to a bivalent metal cation, in such a way that five membered ring compounds are produced by chelation. Complexes of 1:1 are usually formed, which are more stable in basic or slightly acidic solution. The stability of the complex is very sensitive to the specific pH value. EDTA has wide general application in analysis because of its relatively low price, spatial structure of its anion and ability to form complexes with bivalent and trivalent metal cations. Direct titration and preparation of standard EDTA (GMW = 372.24g) solution are possible. The success of an EDTA titration depends upon the precise determination of the end point. Ordinary indicators fail hence metal ion indicators or metallochromic indicators like SBT, EBT are used.
An excellent way to determine the hardness of water is to perform a complexometric titration using a standard EDTA solution. The optimum pH for the experiment is found to be 10.0±0.1 and is adjusted by NH4OH + NH4Cl buffer solution. When a small amount of indicator solution is added to a hard water sample in pH controlled buffer medium, the indicator reacts with Ca+2 and Mg+2 ions to give a wine red colour. As EDTA is further added, the free Ca+2 ions present in the water sample are first complexed to EDTA forming the most stable Ca- EDTA complex. Later the free Mg+2 ions present in the water then react to give Mg-EDTA complex, which is less stable than Ca-EDTA complex.
Engineering Chemistry lab manual 2016-17 (II Semester)
M V G R College of Engineering (Autonomous), Vizianagaram. Page 34
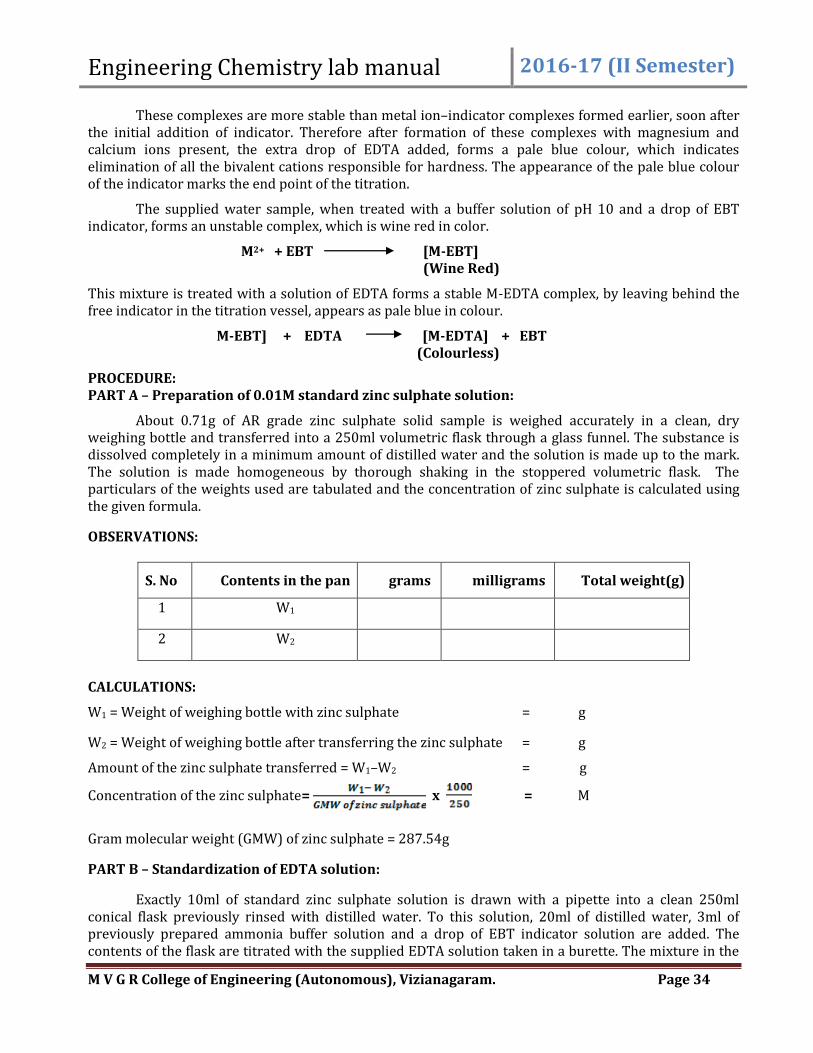
These complexes are more stable than metal ion–indicator complexes formed earlier, soon after the initial addition of indicator. Therefore after formation of these complexes with magnesium and calcium ions present, the extra drop of EDTA added, forms a pale blue colour, which indicates elimination of all the bivalent cations responsible for hardness. The appearance of the pale blue colour of the indicator marks the end point of the titration.
The supplied water sample, when treated with a buffer solution of pH 10 and a drop of EBT indicator, forms an unstable complex, which is wine red in color.
M2+ + EBT [M-EBT] (Wine Red)
This mixture is treated with a solution of EDTA forms a stable M-EDTA complex, by leaving behind the free indicator in the titration vessel, appears as pale blue in colour.
M-EBT] + EDTA [M-EDTA] + EBT (Colourless)
PROCEDURE: PART A – Preparation of 0.01M standard zinc sulphate solution:
About 0.71g of AR grade zinc sulphate solid sample is weighed accurately in a clean, dry weighing bottle and transferred into a 250ml volumetric flask through a glass funnel. The substance is dissolved completely in a minimum amount of distilled water and the solution is made up to the mark. The solution is made homogeneous by thorough shaking in the stoppered volumetric flask. The particulars of the weights used are tabulated and the concentration of zinc sulphate is calculated using the given formula.
OBSERVATIONS:
S. No Contents in the pan grams milligrams Total weight(g)
1 W1
2 W2
CALCULATIONS:
W1 = Weight of weighing bottle with zinc sulphate = g
W2 = Weight of weighing bottle after transferring the zinc sulphate = g
Amount of the zinc sulphate transferred = W1–W2 = g
Concentration of the zinc sulphate= x = M
Gram molecular weight (GMW) of zinc sulphate = 287.54g
PART B – Standardization of EDTA solution:
Exactly 10ml of standard zinc sulphate solution is drawn with a pipette into a clean 250ml conical flask previously rinsed with distilled water. To this solution, 20ml of distilled water, 3ml of previously prepared ammonia buffer solution and a drop of EBT indicator solution are added. The contents of the flask are titrated with the supplied EDTA solution taken in a burette. The mixture in the

Engineering Chemistry lab manual 2016-17 (II Semester)
M V G R College of Engineering (Autonomous), Vizianagaram. Page 35
conical flask is swirled throughout the titration till the end point is reached. The end-point of titration can be identified by the colour change of the solution from wine red colour to pale blue colour. The pale blue colour obtained at the end point in the white back drop of the porcelain tile and noting the initial and final burette readings marks the end of the titration. The titration is repeated as above until concurrent readings are obtained and all the observations are tabulated in the table given below.
OBSERVATIONS:
S.No Volume of zinc sulphate taken in ml Burette reading Volume of EDTA rundown in ml Initial Final
1
2
3
CALCULATIONS:
V1 = Volume of zinc sulphate taken = 10ml V2 = Volume of EDTA rundown =
M1 = Molarity of zinc sulphate = M2 = Molarity of EDTA = ?
n1 = No. of moles of zinc sulphate = 1 n2 = No. of moles of EDTA = 1
Concentration of the supplied EDTA solution = M
PART C –Determination of total hardness of water:
20.0 ml of the water sample given is pipetted out into a clean, dry conical flask. This mixture is treated with 3ml of previously prepared ammonia buffer solution of pH 10 and 1 or 2 drops of EBT indicator solution. This produces wine red colour. After due stirring, the solution in the conical flask is titrated with previously standardized EDTA solution from the burette slowly with continuous swirling, until the colour changes from wine red colour to pale blue colour. The pale blue colour obtained at the end point in the white back drop of the porcelain tile and noting the initial and final burette readings marks the end of the titration. The titration is repeated as above until concurrent readings are obtained and all the observations are tabulated in the table given below.
OBSERVATIONS:
S.No Volume of water sample taken in ml Burette Reading Volume of EDTA rundown in ml Initial Final
1
2
3

Engineering Chemistry lab manual 2016-17 (II Semester)
M V G R College of Engineering (Autonomous), Vizianagaram. Page 36
CALCULATIONS:
V1 = Volume of water sample taken = 20ml
V2 = Volume of EDTA rundown =
M1 = Concentration of Ca2+and Mg2+ in water sample = ?
M2 = Molarity of EDTA =
n1 = No. of moles of Ca2+ and Mg2+ = 1
n2 = No. of moles of EDTA = 1
Total hardness in CaCO3mg/lit is given by the formula:
Volume of EDTA X Conc. Of EDTA X100.1 X1000 Total hardness of water = ----------------------------------------------------- ppm Volume of water sample titrated
REPORT:
The given water samples contains the following ppm (parts per million) of total hardness.
1. Sample 1 ……… ppm
2. Sample 2 ……… ppm
3. Sample 3………. ppm
PRECAUTIONS:
1. All the glass apparatus used in the experiment have to be thoroughly cleaned first with a solution of detergent and then rinsed twice with distilled water. The burette and pipette should then be rinsed with experimental solution.
2. The entire content of the weighing bottle should be transferred into the volumetric flask through the funnel. The specks of the weighed solid in the funnel should be washed into the volumetric flask completely. The solute should be dissolved in water before make up
3. The burette should be filled with the experimental solution up to the zero mark including the nozzle and should be allowed to stand five minutes before experimentation. There should be no air bubbles in the solution in burette or in pipette. The last drop of the pipette nozzle should not be blown off in release of the solution through pipette.
4. Distilled water should only be used throughout the experiment. The titration vessel should only be cleaned and rinsed with distilled water before and after each titration.
5. Proper care must be taken to avoid parallax error in balance measurements as well as in burette readings noted from time to time. The lower meniscus reading in the burette is to be taken as burette reading.
6. Weights must be handled only with forceps and should not be touched with hand as they may add additional weight.

Engineering Chemistry lab manual 2016-17 (II Semester)
M V G R College of Engineering (Autonomous), Vizianagaram. Page 37
7. Balance should be adjusted for free oscillations on both sides of the scale equally before weighing.
8. Swirling of the titration vessel is necessary on each addition of the solution from the burette. The equivalence point should be observed carefully and burette reading be noted immediately.
9. The color change at the end point should be persistent for at least 30 seconds. SIGNIFICANCE OF THE EXPERIMENT
Hardness of water has a permissible limit for use in laundering purpose and industrial applications, so this experiment assumes importance in the analysis of the water samples from time to time, so that the water has the desired quality parameters. If not, proper rectifications can be made to change the quality of water, based on the requirements. This data is relevant for knowing the quality of water for other purposes in industrial equipment such as boilers, house old equipment, heaters, water pipes etc.
Result:
Given Reported % of error Remarks Grade
Student Report :

Engineering Chemistry lab manual 2016-17 (II Semester)
M V G R College of Engineering (Autonomous), Vizianagaram. Page 38

Engineering Chemistry lab manual 2016-17 (II Semester)
M V G R College of Engineering (Autonomous), Vizianagaram. Page 39
SPECTROPHOTOMETRY
The variation of colour of a system with change in concentration of some component in the system forms the basis of colorimetric quantitative analysis. The colour may be inherent or due to the formation of a colored compound by the addition of an appropriate reagent (chromogen). The intensity of the colour may then be compared with that obtained by treating a known amount of the substance in the same manner. Colorimetry is concerned with the determination of the concentration of a substance by measurement of relative absorption of light with respect to a known concentration of the substance. In visual Colorimetry, natural or artificial white light is used as a light source and determinations are made with a photo-electric cell detector in the instrument photoelectric colorimeter.
The main advantage of these methods is that they provide a simple and accurate means for
determining trace quantities (sometimes even less than one percent) quickly. The determination is based on Beer – Lambert law, which states that when a monochromatic radiation is passed through a transparent colored medium, the rate of decrease in intensity with the thickness of the medium is proportional to the intensity of the incident radiation, thickness of the medium and concentration of the species present.
Lambert’s law: This law states that when a beam of monochromatic light passes through absorbing medium the rate of decrease in intensity with thickness of the medium proportional to intensity of light. Beer’s law: This law states that the intensity of emitted light decreases as the concentration of absorbing component increases.
After due mathematical treatment the final equation of Beer -Lambert’s law stands as
A = €Ct
Where A is the absorbance, € is the molar absorptivity or molar absorption coefficient, C is the
concentration of the species present in solution (mole L-1, and t is the length of the optical path or thickness of the medium or the width of the cuvette in which the experimental solution is placed (generally one cm.). The molar absorptivity is defined as the absorption per unit optical path length and unit molar concentration. Its value depends on the wavelength of the incident light, the temperature and the solvent employed. It is better to work with light of wavelength for which the solution exhibits a maximum selective absorption to achieve maximum sensitivity. For matched cells, where the optical path length is constant Beer Lambert’s law can be considered as c ∞ A, hence by plotting A given by dial reading as ordinate against concentration as abscissa, a straight line obtained will pass through origin (where A= 0 when c = 0) This calibration line can be used to determine unknown concentrations of the solutions of the same species after measurement of absorption. This is valid only when the Beer-Lambert’s law is obeyed by the species in the experimental concentration ranges employed and the instrument has no optical defects.
Beer-Lambert’s law is obeyed in dilute solutions of the colored species determined. The
structure of the colored ion or colored non-electrolyte in the dissolved state should not change with concentration ranges employed. The colored species under determination should not undergo molecular association or dissociation. Only monochromatic light should be used. The nature of the calibration curve passing through origin indicates conformity to the law.
The basic principle in all colorimetric measurements consists in comparing under well defined

Engineering Chemistry lab manual 2016-17 (II Semester)
M V G R College of Engineering (Autonomous), Vizianagaram. Page 40
conditions, the colour produced by the substance in unknown amount with the same colour produced by known amount of the substance being determined. A colorimetric method will often give more accurate results at low concentrations than the corresponding titrimetric or gravimetric methods. It may be also simpler and rapid to be carried out. For the determination of certain biological species such as haemoglobin, cholesterol etc., no satisfactory titrimetric or gravimetric procedures exist and colorimetry may be an easy option. However, the criteria for satisfactory colorimetric analysis are:
i) Specificity of the colour reaction for a particular chromogen
ii) proportionality between colour and concentration of the species to be determined
iii) Stability of the colour inherent or obtained by the addition of a colouring agent (chromogen)
iv) Clarity of the solution without any traces of suspended particles or turbidity
v) High sensitivity of the colour reaction for absorption of the incident radiation of chosen
wavelength
vi) Reproducibility of the results under specific experimental conditions.
vii) The colour reaction must be specific to the component being determined
The standard or calibration curve is constructed with known concentrations within the range of
obedience to Beer’s law, by plotting optical density against concentration for which a straight line plot should be obtained. Once calibration curve is obtained, the optical density of any sample of unknown concentration can be measured with the instrument and from the graph, the concentration can be read out
oOo-
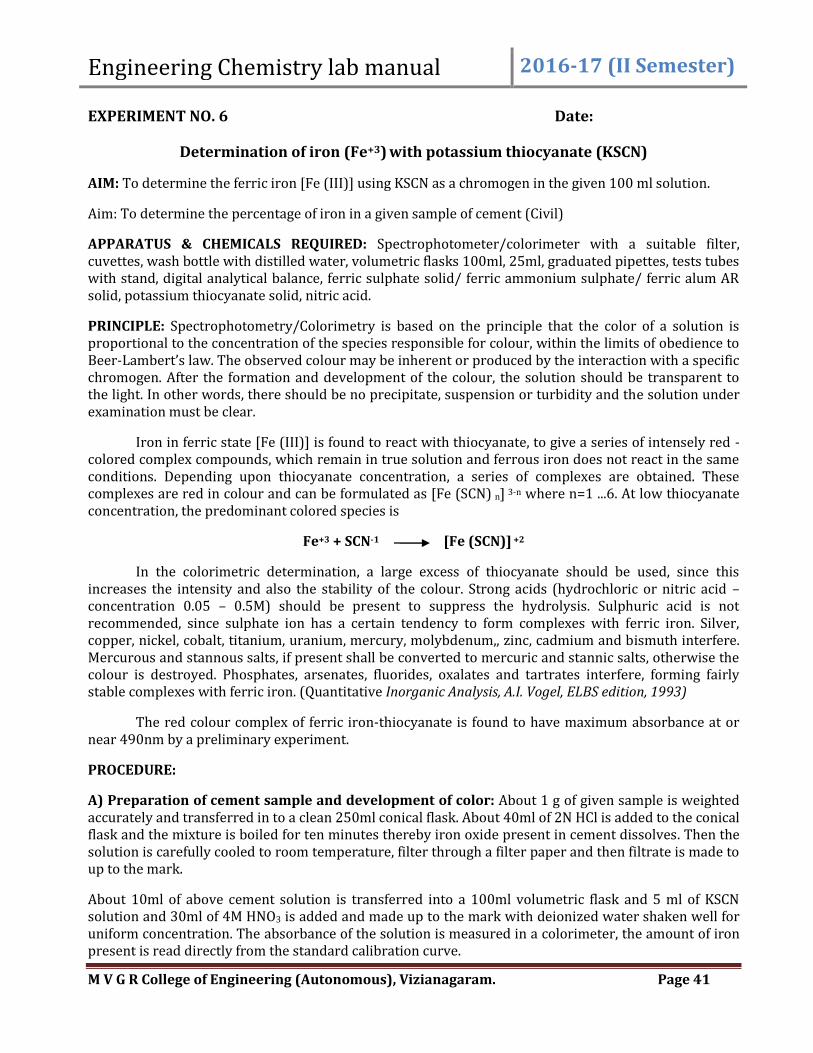
Engineering Chemistry lab manual 2016-17 (II Semester)
M V G R College of Engineering (Autonomous), Vizianagaram. Page 41
EXPERIMENT NO. 6 Date:
Determination of iron (Fe+3) with potassium thiocyanate (KSCN)
AIM: To determine the ferric iron [Fe (III)] using KSCN as a chromogen in the given 100 ml solution.
Aim: To determine the percentage of iron in a given sample of cement (Civil)
APPARATUS & CHEMICALS REQUIRED: Spectrophotometer/colorimeter with a suitable filter, cuvettes, wash bottle with distilled water, volumetric flasks 100ml, 25ml, graduated pipettes, tests tubes with stand, digital analytical balance, ferric sulphate solid/ ferric ammonium sulphate/ ferric alum AR solid, potassium thiocyanate solid, nitric acid.
PRINCIPLE: Spectrophotometry/Colorimetry is based on the principle that the color of a solution is proportional to the concentration of the species responsible for colour, within the limits of obedience to Beer-Lambert’s law. The observed colour may be inherent or produced by the interaction with a specific chromogen. After the formation and development of the colour, the solution should be transparent to the light. In other words, there should be no precipitate, suspension or turbidity and the solution under examination must be clear.
Iron in ferric state [Fe (III)] is found to react with thiocyanate, to give a series of intensely red -colored complex compounds, which remain in true solution and ferrous iron does not react in the same conditions. Depending upon thiocyanate concentration, a series of complexes are obtained. These complexes are red in colour and can be formulated as [Fe (SCN) n] 3-n where n=1 ...6. At low thiocyanate concentration, the predominant colored species is
Fe+3 + SCN-1 [Fe (SCN)] +2
In the colorimetric determination, a large excess of thiocyanate should be used, since this increases the intensity and also the stability of the colour. Strong acids (hydrochloric or nitric acid – concentration 0.05 – 0.5M) should be present to suppress the hydrolysis. Sulphuric acid is not recommended, since sulphate ion has a certain tendency to form complexes with ferric iron. Silver, copper, nickel, cobalt, titanium, uranium, mercury, molybdenum,, zinc, cadmium and bismuth interfere. Mercurous and stannous salts, if present shall be converted to mercuric and stannic salts, otherwise the colour is destroyed. Phosphates, arsenates, fluorides, oxalates and tartrates interfere, forming fairly stable complexes with ferric iron. (Quantitative Inorganic Analysis, A.I. Vogel, ELBS edition, 1993)
The red colour complex of ferric iron-thiocyanate is found to have maximum absorbance at or near 490nm by a preliminary experiment.
PROCEDURE:
A) Preparation of cement sample and development of color: About 1 g of given sample is weighted accurately and transferred in to a clean 250ml conical flask. About 40ml of 2N HCl is added to the conical flask and the mixture is boiled for ten minutes thereby iron oxide present in cement dissolves. Then the solution is carefully cooled to room temperature, filter through a filter paper and then filtrate is made to up to the mark.
About 10ml of above cement solution is transferred into a 100ml volumetric flask and 5 ml of KSCN solution and 30ml of 4M HNO3 is added and made up to the mark with deionized water shaken well for uniform concentration. The absorbance of the solution is measured in a colorimeter, the amount of iron present is read directly from the standard calibration curve.

Engineering Chemistry lab manual 2016-17 (II Semester)
M V G R College of Engineering (Autonomous), Vizianagaram. Page 42
B) Preparation of chromogenic reagent solution of potassium thiocyanate: 20g of potassium thiocyanate is weighed accurately and transferred into a 100ml volumetric flask. It is dissolved in a small volume of distilled water and after complete dissolution; the solution is made up to the mark and shaken well to make it homogeneous in concentration.
C) Preparation of stock solutions of ferric iron salt: A stock solution of 100ml of 0.01M ferric ammonium sulphate is prepared first, for which 0.5g of AR grade ferric ammonium sulphate is weighed accurately into a clean 100ml volumetric flask. The amount is dissolved completely in a small amount of distilled water and 2ml of conc. nitric acid to prevent hydrolysis and after ensuring complete dissolution, it is made up to 100ml. It is thoroughly shaken well to make it homogeneous in concentration. The concentration of the stock solution thus prepared, is calculated as below.
Molecular weight of the salt, ferric ammonium sulphate = 482.18
Weight of the salt transferred into 100ml volumetric flask = g
Weight of the salt x 1000 Concentration of ferric iron solution, C = ------------------------------------------- Molecular weight of the salt x 100
From the above stock solution, 5.5ml are pipette out with a 10ml graduated pipette into a clean and dry 100ml volumetric flask and made up to the mark. The second stock solution now prepared is shaken well to make it homogeneous in concentration. All aliquots for further experimentation are drawn from this solution only. The concentration of this stock solution M, is calculated as below.
5.5 X C = M X 100
M = 5.5 X C/100 =
Five 25ml volumetric flasks are cleaned thoroughly with distilled water, drained, dried and labeled as 1,2,3,4 and 5. From the second stock solution of ferric iron prepared (whose concentration is M), 2.5ml, 5ml, 7.5ml, 10ml and 12.5ml aliquots are drawn with graduated pipette and transferred into these labeled volumetric flasks respectively. 0.5ml of Nitric acid and 4ml of potassium thiocyanate (KSCN) solution are added to aliquots in each of these labeled flasks. Red colour is developed in each of these flasks. They are then made up to the mark and thoroughly shaken to make them homogeneous in concentration. Using the formula M1V1 =M2V2, the concentration of ferric iron in each of these labeled flasks is calculated and tabulated. Here M is the concentration of the second stock solution of ferric iron salt prepared as above.
S. No Sample No. Volume of Fe(III) taken in ml Concentration (calculated)
1 1 2.5+0.5ml HNO3+4ml KSCN 2.5xM = M1 x 25 M1 =
2 2 5.0+0.5ml HNO3+4ml KSCN 5xM = M2 x 25 M2 =
3 3 7.5+0.5ml HNO3+4ml KSCN 7.5xM = M3 x 25 M3 =
4 4 10.0+0.5ml HNO3+4ml KSCN 10xM = M4 x 25 M4 =
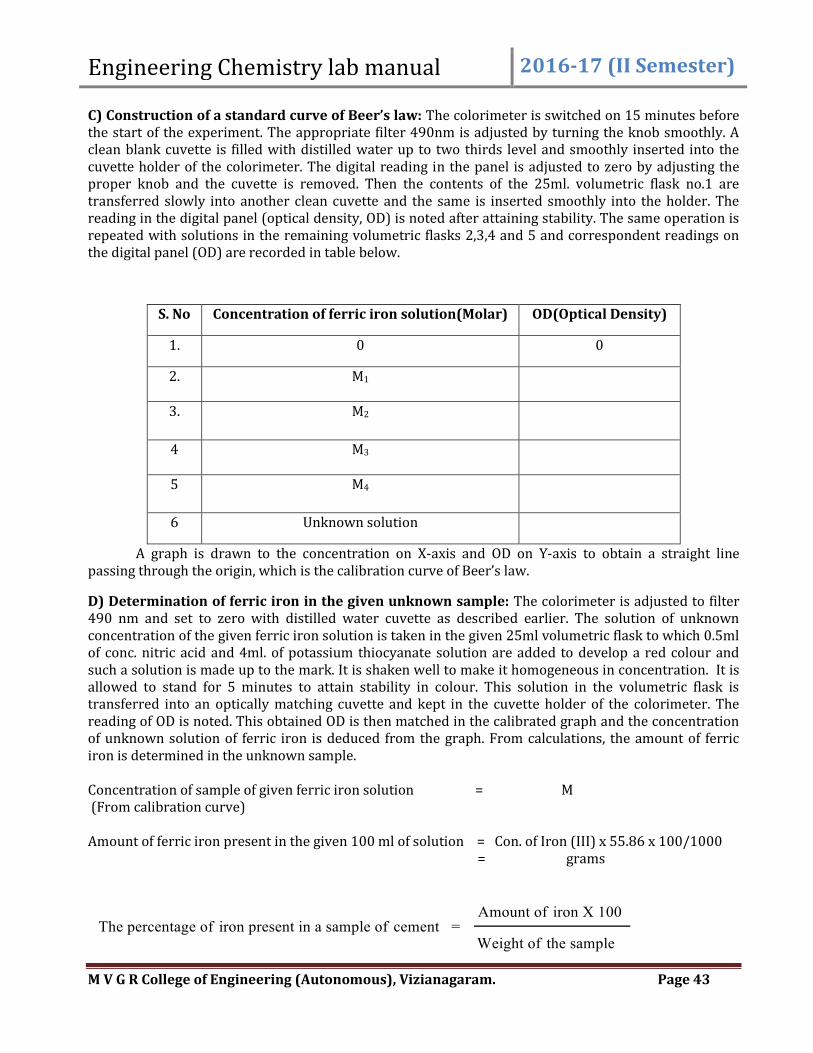
Engineering Chemistry lab manual 2016-17 (II Semester)
M V G R College of Engineering (Autonomous), Vizianagaram. Page 43
C) Construction of a standard curve of Beer’s law: The colorimeter is switched on 15 minutes before the start of the experiment. The appropriate filter 490nm is adjusted by turning the knob smoothly. A clean blank cuvette is filled with distilled water up to two thirds level and smoothly inserted into the cuvette holder of the colorimeter. The digital reading in the panel is adjusted to zero by adjusting the proper knob and the cuvette is removed. Then the contents of the 25ml. volumetric flask no.1 are transferred slowly into another clean cuvette and the same is inserted smoothly into the holder. The reading in the digital panel (optical density, OD) is noted after attaining stability. The same operation is repeated with solutions in the remaining volumetric flasks 2,3,4 and 5 and correspondent readings on the digital panel (OD) are recorded in table below.
S. No Concentration of ferric iron solution(Molar) OD(Optical Density)
1. 0 0
2. M1
3. M2
4 M3
5 M4
6 Unknown solution
A graph is drawn to the concentration on X-axis and OD on Y-axis to obtain a straight line passing through the origin, which is the calibration curve of Beer’s law.
D) Determination of ferric iron in the given unknown sample: The colorimeter is adjusted to filter 490 nm and set to zero with distilled water cuvette as described earlier. The solution of unknown concentration of the given ferric iron solution is taken in the given 25ml volumetric flask to which 0.5ml of conc. nitric acid and 4ml. of potassium thiocyanate solution are added to develop a red colour and such a solution is made up to the mark. It is shaken well to make it homogeneous in concentration. It is allowed to stand for 5 minutes to attain stability in colour. This solution in the volumetric flask is transferred into an optically matching cuvette and kept in the cuvette holder of the colorimeter. The reading of OD is noted. This obtained OD is then matched in the calibrated graph and the concentration of unknown solution of ferric iron is deduced from the graph. From calculations, the amount of ferric iron is determined in the unknown sample. Concentration of sample of given ferric iron solution = M (From calibration curve)
Amount of ferric iron present in the given 100 ml of solution = Con. of Iron (III) x 55.86 x 100/1000 = grams
Engineering Chemistry lab manual 2016-17 (II Semester)
M V G R College of Engineering (Autonomous), Vizianagaram. Page 44
PRECAUTIONS:
1. All the glass apparatus used in the experiment have to be thoroughly cleaned first with a
solution of detergent and then rinsed twice with distilled water. The pipette should then be rinsed with the experimental solution.
2. The entire content of the weighing bottle should be transferred into the volumetric flask
through the funnel. The specks of the weighed solid in the funnel should be washed into the volumetric flask completely. The solute should be dissolved in water before make up.
3. Distilled water should only be used throughout the experiment.
4. The cuvettes must be optically matching set. The cuvettes and reaction test tubes must be clean
and dry. The external glass surface of the cuvette should be cleaned with a dry tissue paper to wipe of dust and hand impressions, if any.
5. Proper time must be ensured for the development of the colour with chromogen.
6. The filter or wave length range set up and zero reading with blank distilled water cuvette should not be disturbed throughout the experiment.
7. The outer surfaces of the cuvette must be cleaned with a tissue paper for any adhering water before inserting it holder to obtain reading of OD. The optical path must be clear.
8. The solution in the cuvette should not contain even traces of suspended or dust particles as they will interfere in absorption and cause serious error. While the colour is formed by the chromogen, there should be no precipitate or turbidity. The solution after development of colour shall be clear otherwise it should be discarded and fresh solution be prepared.
9. The unknown concentration must be in Beer’s law obedience range.
10. The colorimeter should be switched on for a warm up otherwise, reproducible readings may not be obtained.
SIGNIFICANCE OF THE EXPERIMENT:
This experiment assumes utmost significance in the determination of trace quantities of substances in solutions with enhanced accuracy. Colorimetric estimations help in clinical Bio-Chemistry, where abnormalities are detected through blood sampling and its analysis and proper remedial methods are immediately suggested.
The colorimetric estimation of ferric iron in the above experiment is very useful in determining trace quantities of ferric iron in steel, other alloys as well as in biological substances in clinical Bio-Chemistry, in presence of other species. The method is quick, accurate and reproducible. This trace content evaluation is not possible by any titrimetric method with such accuracy.
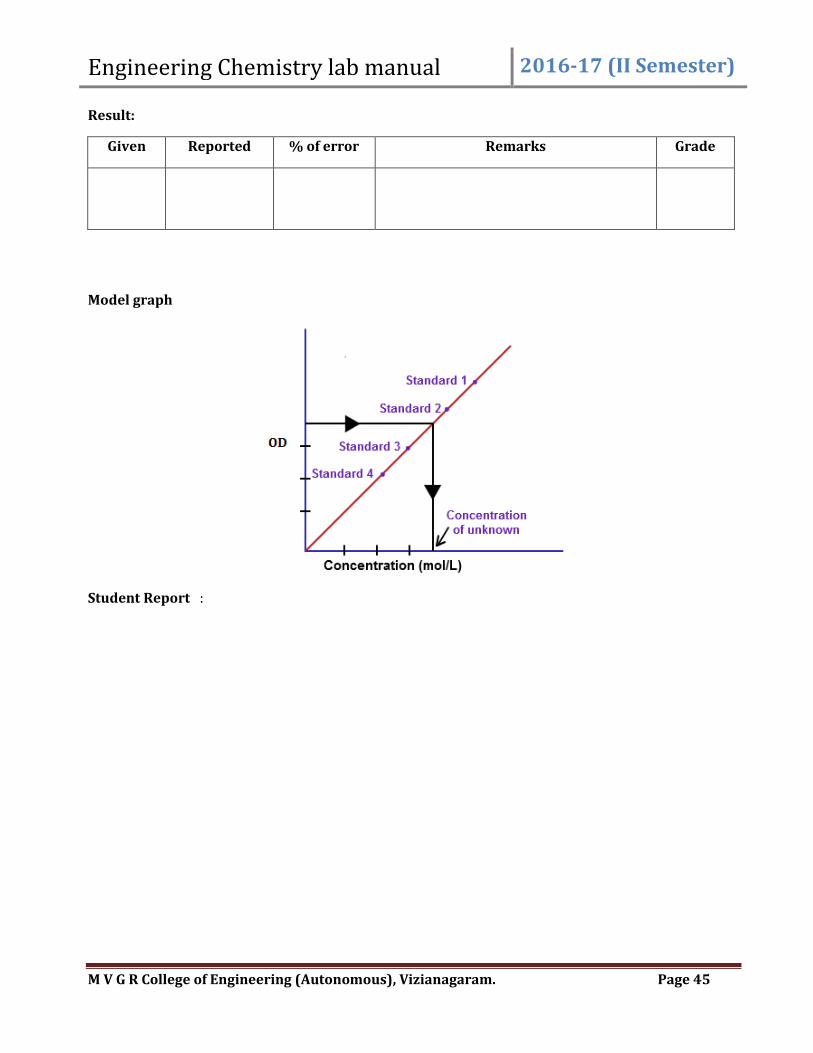
Engineering Chemistry lab manual 2016-17 (II Semester)
M V G R College of Engineering (Autonomous), Vizianagaram. Page 45
Result:
Given Reported % of error Remarks Grade
Model graph
Student Report :
Engineering Chemistry lab manual 2016-17 (II Semester)
M V G R College of Engineering (Autonomous), Vizianagaram. Page 46
pH METRY(DETERMINATION OF pH OF A SOLUTION)
Introduction: The concept of pH was given by Sörensen in 1909. It is a scale to measure the acidity or alkalinity of an aqueous solution. It is defined as the negative logarithm ( to base 10) of hydrogen ion concentration of a solution and thus is a measurement of power of hydrogen ion concentration, expressed in moles.liter-1, in any solution. According to Arrhenius theory, H+ causes acidic nature and OH- causes alkalinity. Pure water in solution state has a tendency to dissociate into H+ and OH- ions, equal in their number, thus making water neutral. The ionic product of water at 22oC has been found to be 10-14,
[H+][OH-] = 10-14 Since, each water molecule dissociated to give hydrogen and hydroxyl ions, each of their
concentration in pure neutral water shall be 10-7. [H+] = [OH-] = 10-7
Thus for all neutral solutions, their hydrogen (or hydroxyl) ion concentration shall be 10-7 and the corresponding pH value calculated is 7. For acid solutions, the concentration of hydrogen ions shall be greater than 10-7 and hence their corresponding pH value shall be less than 7. Similarly for alkaline solutions, the hydrogen concentration shall be less than 10-7 and hence their corresponding pH value shall be greater than 7 up to 14.
Thus in pH scale from 0 to 14, 0 to 7 indicates acidity, 7 indicates neutrality and 7 to 14 indicates alkalinity of an aqueous solution. The pH values of strong acids lie in 0 to 1 region while that of strong bases lie in 13 to 14 region.
Determination of pH is very important in view of the fact that many reactions in organic, inorganic media and especially in Bio-Chemistry are pH sensitive. Control and monitoring pH may be a necessary condition in industries too. There are several methods with indicator solutions and indicator papers for the instant determination of pH. Even though quick, they are approximate. The best and widely used accurate method for the determination of pH is the measurement of EMF produced by H+ ions around an electrode in the instrument pH meter, it is a suitably modified potentiometer calibrated in terms of pH. Here the basic principle is that when two electrodes are kept in two solutions having different hydrogen ion concentration and the electrodes are connected to a potentiometer and the solutions via salt bridge, a small potential difference(EMF) can be observed. If the standard EMF produced by hydrogen ion species of a known concentration is known, the EMF can be measured by comparison and calibration. The pH and EMF are related by the equation.
pH = EMF/ 0.00019837 T Where T is the absolute temperature
Normally, the measurements of pH are carried out with a glass electrode. A thin membrane of the proper glass is selectively permeable to H+, which is an H+ ion sensitive electrode. If the glass electrode is coupled with another reference electrode such as calomel or silver/sliver chloride electrode as a combined electrode, the hydrogen ion concentration and the pH of an unknown solution can be directly measured as EMF of the cell constituted by the two electrodes. Contact between the test solution and reference electrode is usually achieved by means of a liquid junction, which forms part of the reference electrode. The pH meter is a high impedance electrometer, calibrated in terms of pH. The glass electrode as a half cell contains a very thin glass membrane with constant hydrogen ion activity on one side (0.1M HCl) and the variable hydrogen ion activity on the other side (of the unknown solution). The potential across a glass membrane is a concentration potential due to difference in hydrogen ion activity. In actual practice, the instrument is calibrated from 0-14 against a series of buffer solutions of known pH values. The glass electrode is applicable for use in all solutions including those containing oxidizing and reducing agents. The solutions are not contaminated and the sensitivity is up to 0.01%. However, since glass membrane is attacked by strong alkalies like NaOH or KOH, it may not function well beyond pH 10 and looses its sensitivity in such a case.
Engineering Chemistry lab manual 2016-17 (II Semester)
M V G R College of Engineering (Autonomous), Vizianagaram. Page 47
EXPERIMENT NO. 7 Date:
pH METRIC TITRATION OF A STRONG ACID WITH A STRONG BASE AIM: Determination of concentration of a strong acid solution, hydrochloric acid with a strong base, sodium hydroxide solution, by a pH metric titration method.
APPARATUS & CHEMICALS REQUIRED: pH meter with electrode, burette (50ml), volumetric flask (100 ml), conical flask (100 ml), pipette (10 ml/25 ml), beakers (100 ml), stirrer / glass rod, hydrochloric acid solution, sodium hydroxide solution, oxalic acid AR solid. PRINCIPLE:
The neutralization reaction between electrolytic solutions of HCl and NaOH is
H+ + Cl- + Na+ +OH- Na+ + Cl- + H2O
A measured volume of HCl solution is taken in a 100 ml beaker in which the combined electrode is immersed without touching the bottom and NaOH solution is added from the burette, when the above reaction occurs, forming feebly ionized water molecules by the combination of H+ and OH- ions. Since both the acid and base are strong, their ionization is complete. With the progress of the titration, as the NaOH solution is gradually added, highly mobile H+ ions disappear and are replaced by less mobile Na+ ions causing a decrease in the potential of the solution. This trend of decrease continues till the end point is reached, when all the H+ ions present in solution due to HCl are neutralized by combination with OH- ions and disappear, due to addition of NaOH. Beyond end point, further addition of NaOH solution results in gradual change in potential due to unreacted OH- ions and Na+ ions. At the point of neutralization, the pH value of the solution is constant. A plot of pH on Y-axis measured at each addition versus volume of NaOH solution added, on X-axis gives a smooth curve and the sudden inflexion (jump in pH) indicates the end point. The corresponding value of NaOH added with respect to the inflexion gives the titre value.
PROCEDURE:
PART A : Preparation of standard oxalic acid(0.025M) solution (Primary standard):
About 0.315g of AR grade oxalic acid solid sample is weighed accurately in a clean, dry weighing bottle and transferred into a 100 ml volumetric flask through a glass funnel. The substance is dissolved completely in a minimum amount of distilled water and the solution is made up to the mark after complete dissolution. The solution is made homogeneous by thorough shaking in the stoppered volumetric flask. The particulars of the weights used are tabulated and the concentration of oxalic acid is calculated using the given formula.
OBSERVATIONS:
S. No Contents in the pan grams milligrams Total weight(g)
1 W1
2 W2
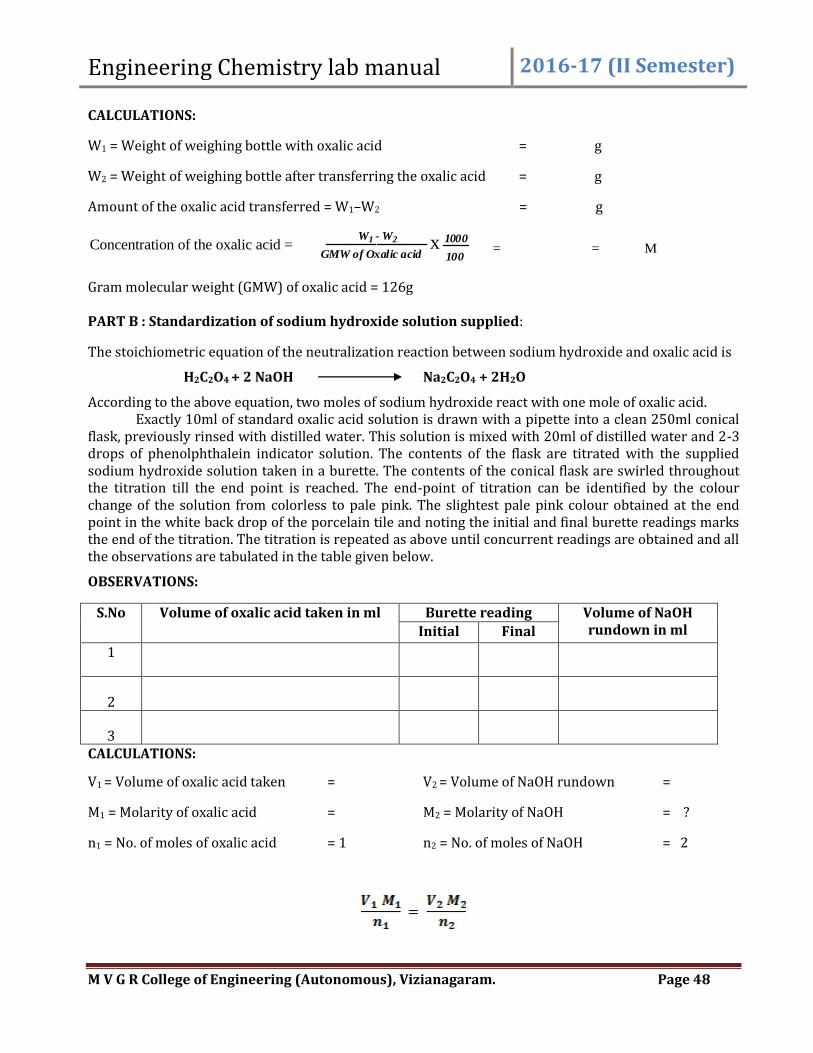
Engineering Chemistry lab manual 2016-17 (II Semester)
M V G R College of Engineering (Autonomous), Vizianagaram. Page 48
CALCULATIONS:
W1 = Weight of weighing bottle with oxalic acid = g
W2 = Weight of weighing bottle after transferring the oxalic acid = g
Amount of the oxalic acid transferred = W1–W2 = g
W1 - W2
GMW of Oxalic acidx 1000
100= = MConcentration of the oxalic acid =
Gram molecular weight (GMW) of oxalic acid = 126g PART B : Standardization of sodium hydroxide solution supplied:
The stoichiometric equation of the neutralization reaction between sodium hydroxide and oxalic acid is
H2C2O4 + 2 NaOH Na2C2O4 + 2H2O
According to the above equation, two moles of sodium hydroxide react with one mole of oxalic acid. Exactly 10ml of standard oxalic acid solution is drawn with a pipette into a clean 250ml conical
flask, previously rinsed with distilled water. This solution is mixed with 20ml of distilled water and 2-3 drops of phenolphthalein indicator solution. The contents of the flask are titrated with the supplied sodium hydroxide solution taken in a burette. The contents of the conical flask are swirled throughout the titration till the end point is reached. The end-point of titration can be identified by the colour change of the solution from colorless to pale pink. The slightest pale pink colour obtained at the end point in the white back drop of the porcelain tile and noting the initial and final burette readings marks the end of the titration. The titration is repeated as above until concurrent readings are obtained and all the observations are tabulated in the table given below.
OBSERVATIONS:
S.No Volume of oxalic acid taken in ml Burette reading Volume of NaOH rundown in ml Initial Final
1
2
3 CALCULATIONS:
V1 = Volume of oxalic acid taken = V2 = Volume of NaOH rundown =
M1 = Molarity of oxalic acid = M2 = Molarity of NaOH = ?
n1 = No. of moles of oxalic acid = 1 n2 = No. of moles of NaOH = 2
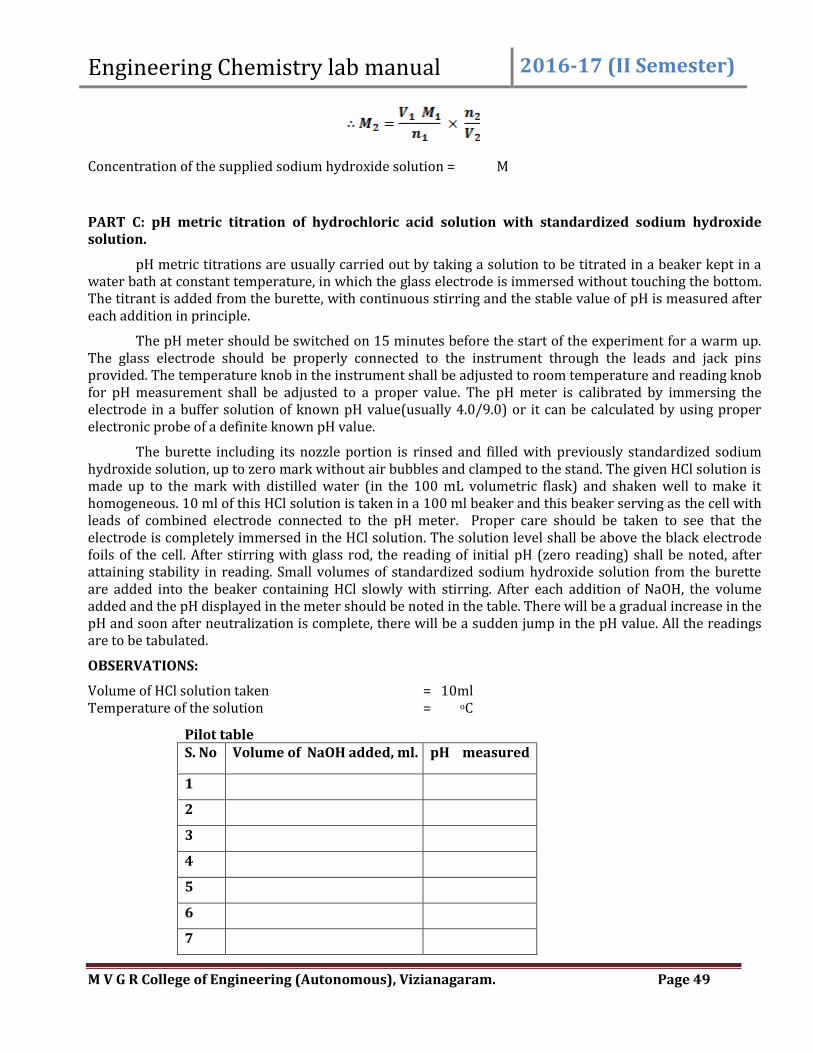
Engineering Chemistry lab manual 2016-17 (II Semester)
M V G R College of Engineering (Autonomous), Vizianagaram. Page 49
Concentration of the supplied sodium hydroxide solution = M
PART C: pH metric titration of hydrochloric acid solution with standardized sodium hydroxide solution.
pH metric titrations are usually carried out by taking a solution to be titrated in a beaker kept in a water bath at constant temperature, in which the glass electrode is immersed without touching the bottom. The titrant is added from the burette, with continuous stirring and the stable value of pH is measured after each addition in principle.
The pH meter should be switched on 15 minutes before the start of the experiment for a warm up. The glass electrode should be properly connected to the instrument through the leads and jack pins provided. The temperature knob in the instrument shall be adjusted to room temperature and reading knob for pH measurement shall be adjusted to a proper value. The pH meter is calibrated by immersing the electrode in a buffer solution of known pH value(usually 4.0/9.0) or it can be calculated by using proper electronic probe of a definite known pH value.
The burette including its nozzle portion is rinsed and filled with previously standardized sodium hydroxide solution, up to zero mark without air bubbles and clamped to the stand. The given HCl solution is made up to the mark with distilled water (in the 100 mL volumetric flask) and shaken well to make it homogeneous. 10 ml of this HCl solution is taken in a 100 ml beaker and this beaker serving as the cell with leads of combined electrode connected to the pH meter. Proper care should be taken to see that the electrode is completely immersed in the HCl solution. The solution level shall be above the black electrode foils of the cell. After stirring with glass rod, the reading of initial pH (zero reading) shall be noted, after attaining stability in reading. Small volumes of standardized sodium hydroxide solution from the burette are added into the beaker containing HCl slowly with stirring. After each addition of NaOH, the volume added and the pH displayed in the meter should be noted in the table. There will be a gradual increase in the pH and soon after neutralization is complete, there will be a sudden jump in the pH value. All the readings are to be tabulated.
OBSERVATIONS:
Volume of HCl solution taken = 10ml Temperature of the solution = oC
Pilot table S. No Volume of NaOH added, ml. pH measured
1
2
3
4
5
6
7

Engineering Chemistry lab manual 2016-17 (II Semester)
M V G R College of Engineering (Autonomous), Vizianagaram. Page 50
8
9
10
11
Accurate table S. No Volume of NaOH added, ml. pH measured
1
2
3
4
5
6
7
8
9
10
11
12
13
14
15
16
17
18
A graph is plotted to the volume of NaOH added on X-axis and corresponding pH measured on Y-axis to obtain a smooth curve through the obtained points. The steep inflexion in pH in the curve causing a change of pH (acid to base) is the point of neutralization and the corresponding volume of NaOH gives the volume required to neutralize the 10ml of HCl taken. The concentration of HCl is calculated from the graphically obtained value (V2) as below.
CALCULATIONS:
V1 = Volume of HCl taken = 10 ml V2 = Volume of NaOH required =
M1 = Molarity of HCl solution = ? M2 = Molarity of NaOH =
n1 = No of moles of HCl =1 n2 = No. of moles of NaOH = 1
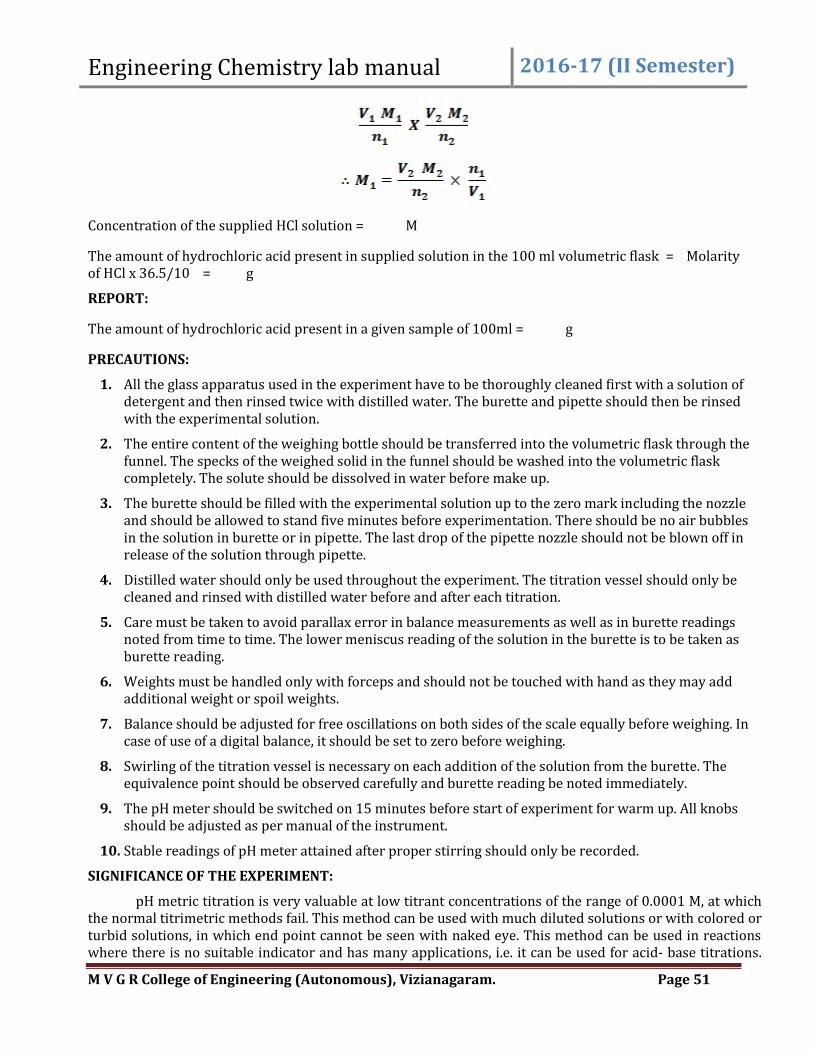
Engineering Chemistry lab manual 2016-17 (II Semester)
M V G R College of Engineering (Autonomous), Vizianagaram. Page 51
Concentration of the supplied HCl solution = M
The amount of hydrochloric acid present in supplied solution in the 100 ml volumetric flask = Molarity of HCl x 36.5/10 = g
REPORT:
The amount of hydrochloric acid present in a given sample of 100ml = g
PRECAUTIONS:
1. All the glass apparatus used in the experiment have to be thoroughly cleaned first with a solution of detergent and then rinsed twice with distilled water. The burette and pipette should then be rinsed with the experimental solution.
2. The entire content of the weighing bottle should be transferred into the volumetric flask through the funnel. The specks of the weighed solid in the funnel should be washed into the volumetric flask completely. The solute should be dissolved in water before make up.
3. The burette should be filled with the experimental solution up to the zero mark including the nozzle and should be allowed to stand five minutes before experimentation. There should be no air bubbles in the solution in burette or in pipette. The last drop of the pipette nozzle should not be blown off in release of the solution through pipette.
4. Distilled water should only be used throughout the experiment. The titration vessel should only be cleaned and rinsed with distilled water before and after each titration.
5. Care must be taken to avoid parallax error in balance measurements as well as in burette readings noted from time to time. The lower meniscus reading of the solution in the burette is to be taken as burette reading.
6. Weights must be handled only with forceps and should not be touched with hand as they may add additional weight or spoil weights.
7. Balance should be adjusted for free oscillations on both sides of the scale equally before weighing. In case of use of a digital balance, it should be set to zero before weighing.
8. Swirling of the titration vessel is necessary on each addition of the solution from the burette. The equivalence point should be observed carefully and burette reading be noted immediately.
9. The pH meter should be switched on 15 minutes before start of experiment for warm up. All knobs should be adjusted as per manual of the instrument.
10. Stable readings of pH meter attained after proper stirring should only be recorded.
SIGNIFICANCE OF THE EXPERIMENT:
pH metric titration is very valuable at low titrant concentrations of the range of 0.0001 M, at which the normal titrimetric methods fail. This method can be used with much diluted solutions or with colored or turbid solutions, in which end point cannot be seen with naked eye. This method can be used in reactions where there is no suitable indicator and has many applications, i.e. it can be used for acid- base titrations.

Engineering Chemistry lab manual 2016-17 (II Semester)
M V G R College of Engineering (Autonomous), Vizianagaram. Page 52
There is no need to use any indicator here as such the cumbersome process of selection of an indicator altogether is eliminated. Further, choice of an indicator for titrations weak acids, weak bases and sometimes both, is difficult to be carried out and pH metric titrations are accurate alternative for such experiments. Since the end point is located graphically, any errors creeping in the operation shall stand minimized or averaged out.
In acid-base visual titrimetry, location of end point accurately is very important and any error requires repetition of the entire process. For obtaining concurrent values, the experiment may have to be repeated several times. However, in pH metry, no observation of end point is necessary and one single experiment is sufficient as there is no visual location of the end point, as it is located graphically by extrapolation.
Result:
Given Reported % of error Remarks Grade
Model graph

Engineering Chemistry lab manual 2016-17 (II Semester)
M V G R College of Engineering (Autonomous), Vizianagaram. Page 53
Student Report :
Engineering Chemistry lab manual 2016-17 (II Semester)
M V G R College of Engineering (Autonomous), Vizianagaram. Page 54
CONDUCTOMETRIC TITRATIONS
INTRODUCTION: Conductometric titration is a type of titration in the instrumental methods of chemical analysis, in
which the electrolytic conductivity of the reaction mixture is continuously monitored as one reactant is added. The end point in these titrations is determined by means of a conductance measurement. They are based on the principle that the conductance of an electrolyte solution depends on the number of ions, their charge and mobilities. As a reaction proceeds during a titration, number of ions or concentration of ions vary. Also, the ions of one kind are replaced by ions of other kind, differing in the mobilities. As a result, the conductance of the solution changes with every addition of the titrant. At the equivalence point, a sharp change in the conductance is observed. Thus, if the conductance of the solution measured during the course of titration is plotted against the volume of the titrant added, the end point can be conveniently obtained by the extrapolation of straight lines obtained at the point of their intersection. It is not necessary to know the actual specific conductance of the solution. The equivalence point is the point at which the conductivity undergoes a sudden change. Marked increases or decrease in conductance are associated with the changing concentrations of the two most highly conducting ions—the hydrogen and hydroxyl ions. The method can be used for titrating coloured solutions or homogeneous suspensions, which cannot be used with normal indicators.
Conductometric titration works on the principle of Ohm's law. As current (i) is inversely proportional to resistance (R) and the reciprocal of resistance is termed as conductance, and its unit is Siemen (mho) cm-1. The electrical conductivity of a solution depends on the number of ions and their mobility. Ionic interactions may occur when one electrolytic solution is added to another electrolytic solution, resulting changes in the conductivity of the solution.
Acid-base titrations and redox titrations are often performed in which commonly, indicators are used to locate the end point e.g., methyl orange, phenolphthalein for acid base titrations and starch solutions for iodometric type of redox processes. However, electrical conductance measurements can also be used as a tool to locate the end point, e.g., in a titration of a HCl solution with the strong base NaOH without use of any indicators. As the titration progresses, the protons are neutralized to form water by the addition of NaOH. For each amount of NaOH added equivalent amount of hydrogen ions is removed. Effectively, the faster moving H+ cation is replaced by the slower moving Na+ ion, and the conductivity of the titrated solution as well as the measured conductance of the cell will fall. This continues until the equivalence point is reached, at which we have a solution of sodium chloride, NaCl. If more base is added an increase in conductivity or conductance is observed, since more ions Na+ and OH- are being added and the neutralization reaction no longer removes an appreciable number any of them. Consequently, in the titration of a strong acid with a strong base, the conductance has a minimum at the equivalence point. This minimum can be used instead of an indicator dye to determine the endpoint of the titration. Conductometric titration curve is a plot of the measured conductance or conductivity values against the number of ml of NaOH solution added.
Conductometric titrations are usually carried out by taking a solution to be titrated in a beaker kept in a water bath at constant temperature, in which the conductivity cell is immersed till the solution level is well above the black platinised electrode foils. The conductivity cell is connected to a conductivity bridge (Wheatstone bridge circuit). The titrant is added from the burette, with continuous stirring and the stable value of conductance is measured after each addition. For accurate results, there should not be any appreciable change in the volume of solution being titrated. If there is change, volume correction can be applied. Best results are achieved by using a solution of titrant 20 to 100 times concentrated than the solution to be titrated and employing a micro-burette for making additions.
Thus, the principle of conductometric titrations is the substitution of ions of one mobility by ions of mobility. In conductometric titrations, the titrant is added from the burette, and the conductivity readings

Engineering Chemistry lab manual 2016-17 (II Semester)
M V G R College of Engineering (Autonomous), Vizianagaram. Page 55
(corresponding to various increments of titrant) are plotted against the volume of the titrant .Upon adding a strong base to the mixture of acids, the conductance falls until the strong acid is neutralized then raised, as weak acid is converted into its salt and finally raises more steeply as excess alkali is introduced. Such a titration curve consists of 3 lines which intersect at a particular point, known as the END POINT or EQUIVALENCE POINT.
In one experiment, a strong base (NaOH) will be titrated against a strong acid (HCl), and the change in the conductivity of the solution will be measured with a conductivity meter. Consider that the acid (HCl) is taken in the beaker, while the base (NaOH) is taken in the burette. The solution in the beaker (HCl) at first contains H+ and Cl- ions. After that, when a small amount of NaOH is added to HCl in the beaker, the conductivity decreases due to removal of hydrogen ions.
H+ + Cl- + Na+ + OH- Na+ + Cl- + H2O
The fall in the conductivity is due to removal of H+ ions, which have greater mobility and replacement by less mobile Na+ ions. This fall occurs till all the H+ ions are removed and there upon, the conductance will raise due to the presence of excess unreacted OH- ions. The intersection of these two lines in graph gives end point of titration and corresponding volume of alkali on X-axis will give the volume of alkali required exactly to neutralize the amount of acid taken.
Similarly in the second experiment a weak acid, acetic acid is taken in the cell and NaOH is added from burette to CH3COOH, the conductivity decreases slowly. Since the concentration of H+ ions in CH3COOH is small due to lesser ionization and H+ ions possess a high mobility, the conductivity of the solution decreases gradually due to the formation of Na+ and CH3COO- ions. It follows that the conductivity of this solution is mainly due to H+ ions. The addition of NaOH is represented by:
CH3COO- + H+ + Na+ + OH- CH3COO- + Na+ +H2O
As NaOH is added, the H+ ions are removed as unionized water. Therefore, the conductivity will decrease, since Na+ ions do not possess much mobility. At the neutralization point, the solution contains Na+ and Cl- ions, and will have a considerably less conductivity than the original value. If one drop of NaOH is added, after the neutralization point, there will be a small concentration of excess OH- ions. Therefore, the conductivity increases, as OH- ions have the second highest mobility. As more and more NaOH is added, the conductivity keeps on increasing continuously. Hence, on plotting the corrected conductivity values as ordinate (y-axis) against the volume of titrant added as abscissa (x-axis), we get two straight lines and the point of intersection gives the equivalence point.
The titrant should be at least ten times as concentrated as the solution being titrated in order to keep the volume change small. If necessary, volume correction can be applied.
An important advantage of these titrations is that the relative change in conductivity is almost independent of the concentration of the strong acid being titrated. Thus, dilute solutions can be titrated with almost the same accuracy as concentrated solutions. Further, the actual conductance value is not measured and the proportional quantity by Wheatstone bridge is read out, which is directly plotted against the volume of the titrant.
Conductometric titrations are widely used in direct & indirect measurements of physico-chemical analysis, complexometric titrations, chemical kinetics, precipitation titrations and plant laboratories.
However, these methods become less accurate and less satisfactory with increasing total electrolytic concentration. Again, it is not suitable for all redox reactions.
-oOo-
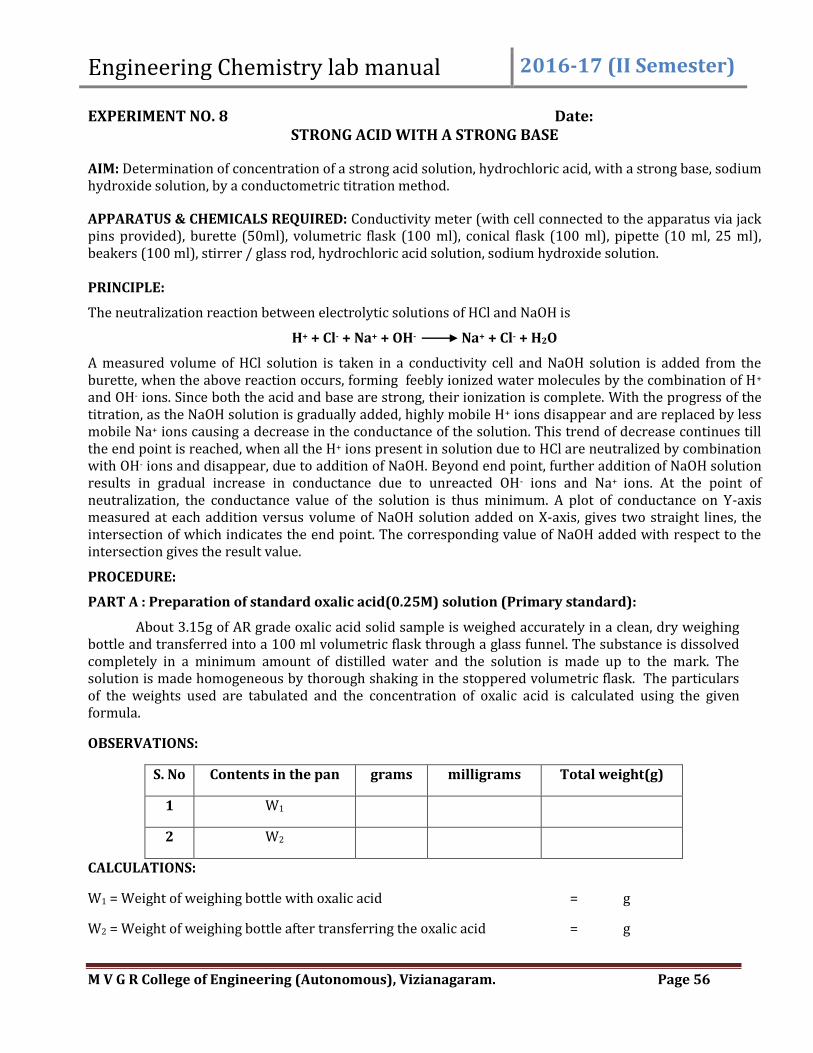
Engineering Chemistry lab manual 2016-17 (II Semester)
M V G R College of Engineering (Autonomous), Vizianagaram. Page 56
EXPERIMENT NO. 8 Date: STRONG ACID WITH A STRONG BASE
AIM: Determination of concentration of a strong acid solution, hydrochloric acid, with a strong base, sodium hydroxide solution, by a conductometric titration method.
APPARATUS & CHEMICALS REQUIRED: Conductivity meter (with cell connected to the apparatus via jack pins provided), burette (50ml), volumetric flask (100 ml), conical flask (100 ml), pipette (10 ml, 25 ml), beakers (100 ml), stirrer / glass rod, hydrochloric acid solution, sodium hydroxide solution. PRINCIPLE:
The neutralization reaction between electrolytic solutions of HCl and NaOH is
H+ + Cl- + Na+ + OH- Na+ + Cl- + H2O
A measured volume of HCl solution is taken in a conductivity cell and NaOH solution is added from the burette, when the above reaction occurs, forming feebly ionized water molecules by the combination of H+ and OH- ions. Since both the acid and base are strong, their ionization is complete. With the progress of the titration, as the NaOH solution is gradually added, highly mobile H+ ions disappear and are replaced by less mobile Na+ ions causing a decrease in the conductance of the solution. This trend of decrease continues till the end point is reached, when all the H+ ions present in solution due to HCl are neutralized by combination with OH- ions and disappear, due to addition of NaOH. Beyond end point, further addition of NaOH solution results in gradual increase in conductance due to unreacted OH- ions and Na+ ions. At the point of neutralization, the conductance value of the solution is thus minimum. A plot of conductance on Y-axis measured at each addition versus volume of NaOH solution added on X-axis, gives two straight lines, the intersection of which indicates the end point. The corresponding value of NaOH added with respect to the intersection gives the result value.
PROCEDURE:
PART A : Preparation of standard oxalic acid(0.25M) solution (Primary standard):
About 3.15g of AR grade oxalic acid solid sample is weighed accurately in a clean, dry weighing bottle and transferred into a 100 ml volumetric flask through a glass funnel. The substance is dissolved completely in a minimum amount of distilled water and the solution is made up to the mark. The solution is made homogeneous by thorough shaking in the stoppered volumetric flask. The particulars of the weights used are tabulated and the concentration of oxalic acid is calculated using the given formula.
OBSERVATIONS:
S. No Contents in the pan grams milligrams Total weight(g)
1 W1
2 W2
CALCULATIONS:
W1 = Weight of weighing bottle with oxalic acid = g
W2 = Weight of weighing bottle after transferring the oxalic acid = g

Engineering Chemistry lab manual 2016-17 (II Semester)
M V G R College of Engineering (Autonomous), Vizianagaram. Page 57
Amount of the oxalic acid transferred = W1–W2 = g
W1 - W2
GMW of Oxalic acidx 1000
100= = MConcentration of the oxalic acid =
Gram molecular weight (GMW) of oxalic acid = 126g
PART B: Standardization of sodium hydroxide solution supplied:
The stoichiometric equation of the neutralization reaction between sodium hydroxide and oxalic acid is
H2C2O4 + 2NaOH Na2C2O4 + 2H2O
According to the above equation, two moles of sodium hydroxide react with one mole of oxalic acid.
Exactly 10ml of standard oxalic acid solution is drawn with a pipette into a clean 250ml conical flask, previously rinsed with distilled water. This solution is mixed with 20ml of distilled water and 2-3 drops of phenolphthalein indicator solution. The contents of the flask are titrated with the supplied sodium hydroxide solution taken in a burette. The contents of the conical flask are swirled throughout the titration till the end point is reached. The end-point of titration can be identified by the colour change of the solution from colourless to pale pink. The slightest pale pink colour obtained at the end point in the white back drop of the porcelain tile and noting the initial and final burette readings marks the end of the titration. The titration is repeated as above until concurrent readings are obtained and all the observations are tabulated in the table given below.
OBSERVATIONS:
S. No Volume of oxalic acid taken in ml Burette reading Volume of NaOH rundown in ml Initial Final
1
2
3
CALCULATIONS: V1 = Volume of oxalic acid taken = V2 = Volume of NaOH rundown =
M1 = Molarity of oxalic acid = M2 = Molarity of NaOH = ?
n1 = No. of moles of oxalic acid = 1 n2 = No. of moles of NaOH = 2
Concentration of the supplied sodium hydroxide solution = M
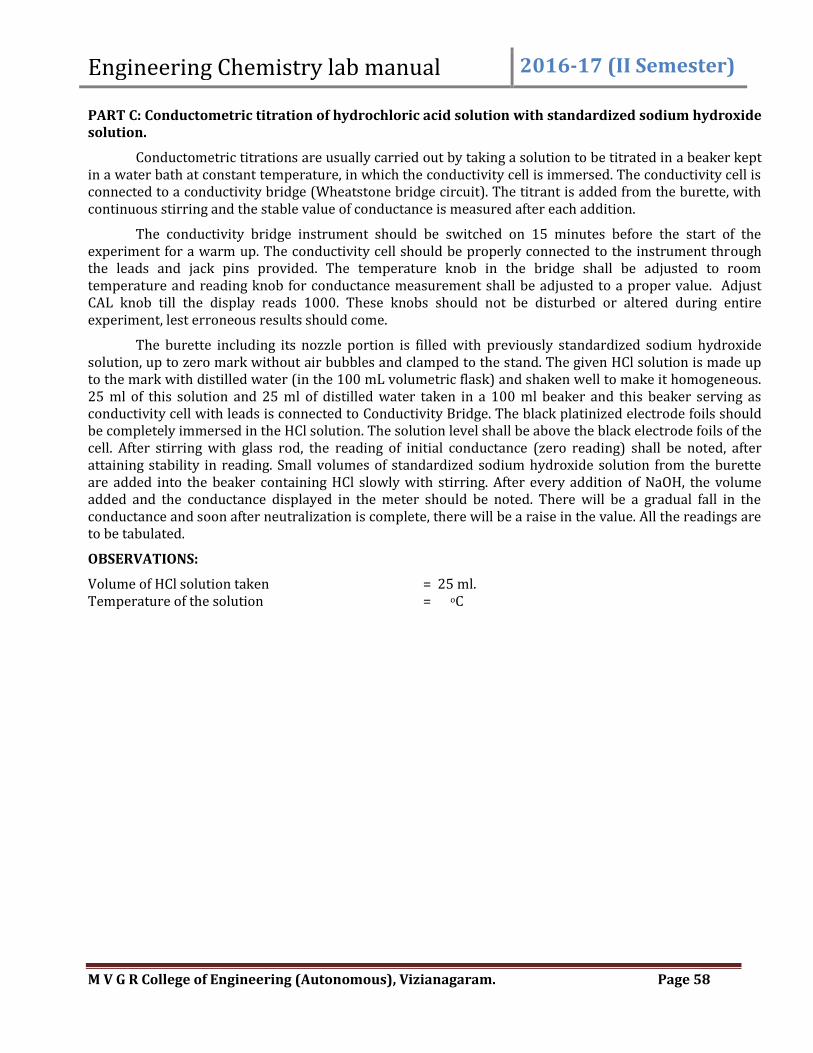
Engineering Chemistry lab manual 2016-17 (II Semester)
M V G R College of Engineering (Autonomous), Vizianagaram. Page 58
PART C: Conductometric titration of hydrochloric acid solution with standardized sodium hydroxide solution.
Conductometric titrations are usually carried out by taking a solution to be titrated in a beaker kept in a water bath at constant temperature, in which the conductivity cell is immersed. The conductivity cell is connected to a conductivity bridge (Wheatstone bridge circuit). The titrant is added from the burette, with continuous stirring and the stable value of conductance is measured after each addition.
The conductivity bridge instrument should be switched on 15 minutes before the start of the experiment for a warm up. The conductivity cell should be properly connected to the instrument through the leads and jack pins provided. The temperature knob in the bridge shall be adjusted to room temperature and reading knob for conductance measurement shall be adjusted to a proper value. Adjust CAL knob till the display reads 1000. These knobs should not be disturbed or altered during entire experiment, lest erroneous results should come.
The burette including its nozzle portion is filled with previously standardized sodium hydroxide solution, up to zero mark without air bubbles and clamped to the stand. The given HCl solution is made up to the mark with distilled water (in the 100 mL volumetric flask) and shaken well to make it homogeneous. 25 ml of this solution and 25 ml of distilled water taken in a 100 ml beaker and this beaker serving as conductivity cell with leads is connected to Conductivity Bridge. The black platinized electrode foils should be completely immersed in the HCl solution. The solution level shall be above the black electrode foils of the cell. After stirring with glass rod, the reading of initial conductance (zero reading) shall be noted, after attaining stability in reading. Small volumes of standardized sodium hydroxide solution from the burette are added into the beaker containing HCl slowly with stirring. After every addition of NaOH, the volume added and the conductance displayed in the meter should be noted. There will be a gradual fall in the conductance and soon after neutralization is complete, there will be a raise in the value. All the readings are to be tabulated.
OBSERVATIONS:
Volume of HCl solution taken = 25 ml. Temperature of the solution = oC
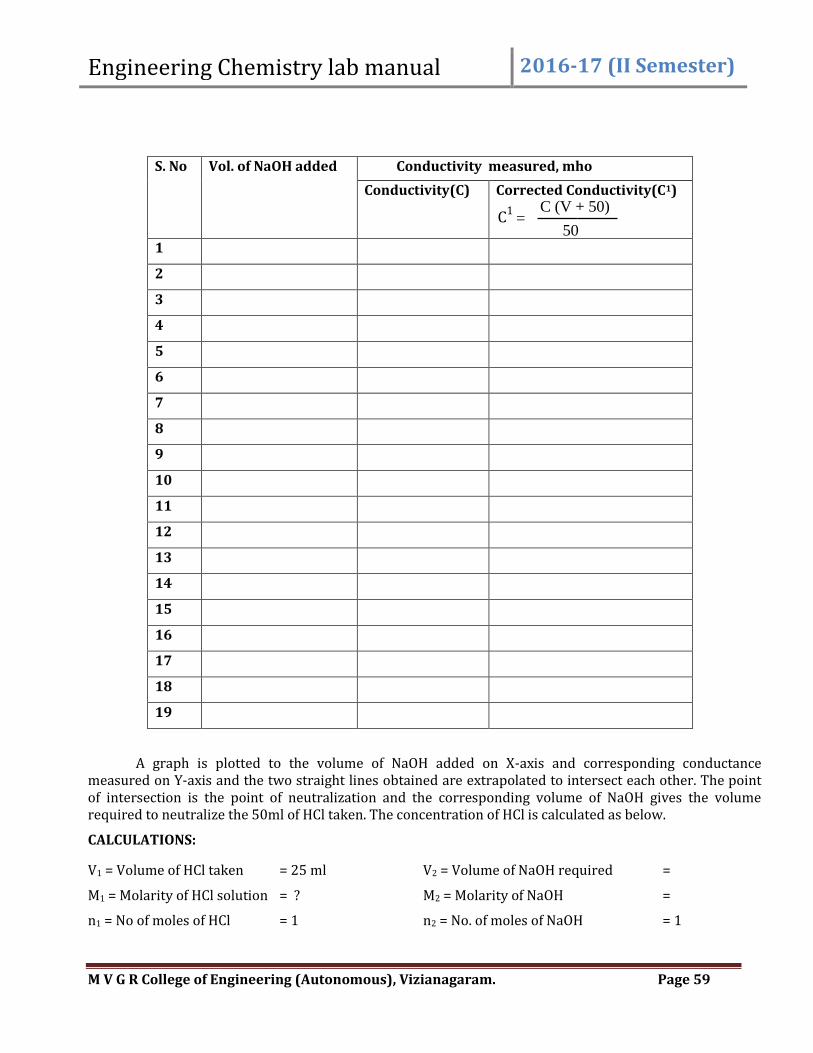
Engineering Chemistry lab manual 2016-17 (II Semester)
M V G R College of Engineering (Autonomous), Vizianagaram. Page 59
S. No Vol. of NaOH added Conductivity measured, mho
Conductivity(C) Corrected Conductivity(C1)
C1=
C (V + 50)
50 1
2
3
4
5
6
7
8
9
10
11
12
13
14
15
16
17
18
19
A graph is plotted to the volume of NaOH added on X-axis and corresponding conductance measured on Y-axis and the two straight lines obtained are extrapolated to intersect each other. The point of intersection is the point of neutralization and the corresponding volume of NaOH gives the volume required to neutralize the 50ml of HCl taken. The concentration of HCl is calculated as below.
CALCULATIONS:
V1 = Volume of HCl taken = 25 ml V2 = Volume of NaOH required =
M1 = Molarity of HCl solution = ? M2 = Molarity of NaOH =
n1 = No of moles of HCl = 1 n2 = No. of moles of NaOH = 1

Engineering Chemistry lab manual 2016-17 (II Semester)
M V G R College of Engineering (Autonomous), Vizianagaram. Page 60
Concentration of the supplied HCl solution = M
The amount of hydrochloric acid present in supplied solution in the 100 ml volumetric flask = Molarity of HCl x 36.5/10 = g
REPORT:
The amount of hydrochloric acid present in a given sample of 100ml = g
SIGNIFICANCE OF THE EXPERIMENT:
Conductometric titration is very valuable at low titrant concentrations of the range of 0.0001 M, at which the normal titrimetric methods fail. This method can be used with much diluted solutions or with coloured or turbid solutions, in which end point cannot be seen with naked eye. This method can be used in reactions where there is no suitable indicator and has many applications, i.e. it can be used for acid- base, redox, precipitation, or complex titrations. There is no need to use any indicator here as such the cumbersome process of selection of an indicator altogether is eliminated. Further, choice of an indicator for titrations weak acids, weak bases and sometimes both, is difficult to be carried out and conductometric titrations are accurate alternative for such experiments. Since the end point is located graphically, any errors creeping in the operation shall stand minimized.
In acid-base visual titrimetry, location of end point accurately is very important and any error requires repetition of the entire process. However, in conductometry, , no observation of end point is necessary and one single experiment is sufficient as there is no visual location of the end point, as it is located graphically by extrapolation.
This method can be used for the determination of sulphur dioxide in air pollution studies, determination of soap in oil, determination of accelerators in rubber and determination of total soap in latex.
Result:
Given Reported % of error Remarks Grade
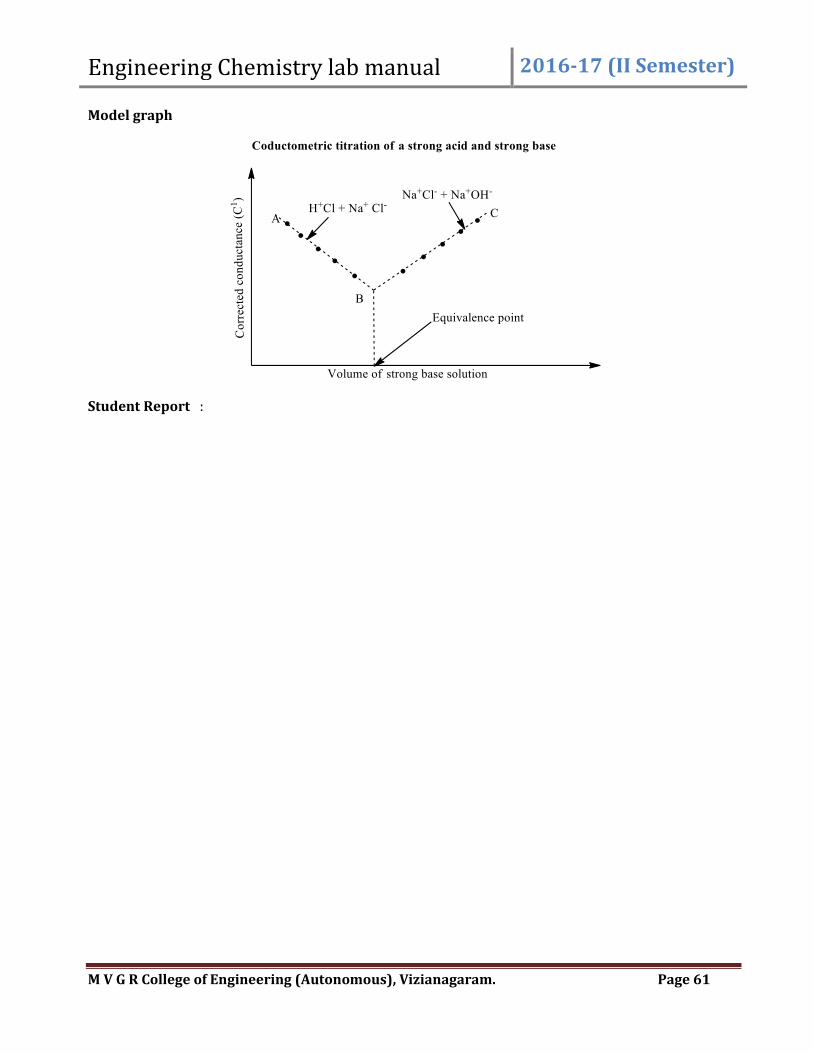
Engineering Chemistry lab manual 2016-17 (II Semester)
M V G R College of Engineering (Autonomous), Vizianagaram. Page 61
Model graph
Student Report :
Engineering Chemistry lab manual 2016-17 (II Semester)
M V G R College of Engineering (Autonomous), Vizianagaram. Page 62
EXPERIMENT NO. 9 Date:
WEAK ACID WITH A STRONG BASE AIM: Determination of concentration of a weak acid solution, acetic acid, with a strong base, sodium hydroxide solution, by a conductometric titration method.
APPARATUS & CHEMICALS REQUIRED: Conductivity meter (with cell connected to the apparatus via jack pins provided), burette (50ml), volumetric flask (100 ml), conical flask (100 ml), pipette (10 ml, 25 ml), beakers (100 ml), stirrer / glass rod, acetic acid solution, NaOH solution. PRINCIPLE: The reaction between electrolytic solutions of HCl and NaOH is
CH3COO- + H+ + Na+ + OH- CH3COO- + Na+ +H2O
A measured volume of acetic acid solution is taken in a conductivity cell and NaOH solution is added from the burette, when the above reaction occurs, forming feebly ionized water molecules by the combination of H+ and OH- ions. With the progress of the titration, as the NaOH solution is gradually added, highly mobile H+ ions disappear and are replaced by less mobile Na+ ions causing a decrease in the conductance of the solution. This trend of decrease continues till the end point is reached, when all the H+ ions present in solution due to acetic acid are neutralized by combination with OH- ions due to addition of NaOH. Beyond end point, further addition of NaOH solution results in gradual increase in conductance due to unreacted OH- ions and Na+ ions. At the point of neutralization, the conductance value of the solution is thus minimum. A plot of conductance on Y-axis measured at each addition versus volume of Na. OH solution added on X-axis, gives two straight lines, the intersection of which indicates the end point. The corresponding value of NaOH added with respect to the intersection gives the result value.
Unlike a strong acid like hydrochloric acid, acetic acid is a weak electrolyte with around 30% dissociation and hence the number or concentration of dissociated available H+ ions is comparatively low. Hence the conductance values at zero reading are low and the rate of decrease in conductance due to addition of NaOH solution is also low, which is clearly represented in the graph. However, after the end point, the resultant conductance due to freely available OH- is high and a steep raise in graph can be seen. The intersection of these two lines is also clear with corresponding volume as the result value.
PROCEDURE:
PART A: Preparation of standard oxalic acid (025M) solution (Primary standard):
About 3.15g of AR grade oxalic acid solid sample is weighed accurately in a clean, dry weighing bottle and transferred into a 100ml volumetric flask through a glass funnel. The substance is dissolved completely in a minimum amount of distilled water and the solution is made up to the mark. The solution is made homogeneous by thorough shaking in the stoppered volumetric flask. The particulars of the weights used are tabulated and the concentration of oxalic acid is calculated using the given formula.
OBSERVATIONS:
S. No Contents in the pan grams milligrams Rider Values Total
weight(g) MSD SSD
1 W1
2 W2

Engineering Chemistry lab manual 2016-17 (II Semester)
M V G R College of Engineering (Autonomous), Vizianagaram. Page 63
CALCULATIONS:
W1 = Weight of weighing bottle with oxalic acid = g
W2 = Weight of weighing bottle after transferring the oxalic acid = g
Amount of the oxalic acid transferred = W1–W2 = g
W1 - W2
GMW of Oxalic acidx 1000
100= = MConcentration of the oxalic acid =
Gram molecular weight (GMW) of oxalic acid = 126g
Part B: Standardization of sodium hydroxide solution supplied:
The stoichiometric equation of the neutralization reaction between sodium hydroxide and oxalic acid is
H2C2O4 + 2 NaOH Na2C2O4 + 2H2O
According to the above equation, two moles of sodium hydroxide react with one mole of oxalic acid. Exactly 10ml of standard oxalic acid solution is drawn with a pipette into a clean 250ml conical
flask, previously rinsed with distilled water. This solution is mixed with 20ml of distilled water and 2-3 drops of phenolphthalein indicator solution. The contents of the flask are titrated with the supplied sodium hydroxide solution taken in a burette. The contents of the conical flask are swirled throughout the titration till the end point is reached. The end-point of titration can be identified by the colour change of the solution from colourless to pale pink. The slightest pale pink colour obtained at the end point in the white back drop of the porcelain tile and noting the initial and final burette readings marks the end of the titration. The titration is repeated as above until concurrent readings are obtained and all the observations are tabulated in the table given below.
OBSERVATIONS:
S. No Volume of oxalic acid taken in ml Burette reading Volume of NaOH rundown in ml Initial Final
1
2
3
CALCULATIONS: V1 = Volume of oxalic acid taken = V2 = Volume of NaOH rundown =
M1 = Molarity of oxalic acid = M2 = Molarity of NaOH = ?
n1 = No. of moles of oxalic acid = 1 n2 = No. of moles of NaOH = 2
Engineering Chemistry lab manual 2016-17 (II Semester)
M V G R College of Engineering (Autonomous), Vizianagaram. Page 64
Concentration of the supplied sodium hydroxide solution = M
PART C: Conductometric titration of acetic acid with standard sodium hydroxide solution.
Conductometric titrations are usually carried out by taking a solution to be titrated in a beaker kept in a water bath at constant temperature, in which the conductivity cell is immersed. The conductivity cell is connected to a conductivity bridge (Wheatstone bridge circuit). The titrant is added from the burette, with continuous stirring and the stable value of conductance is measured after each addition.
The conductivity bridge instrument should be switched on 15 minutes before the start of the experiment for a warm up. The conductivity cell should be properly connected to the instrument through the leads and jack pins provided. The temperature knob in the bridge shall be adjusted to room temperature and reading knob for conductance measurement shall be adjusted to a proper value. Adjust CAL knob till the display reads 1000. These knobs should not be disturbed or altered during entire experiment, lest erroneous results should come.
The burette including its nozzle portion is filled with previously standardized sodium hydroxide solution, up to zero mark without air bubbles and clamped to the stand. The given acetic acid solution is made up to the mark with distilled water (in the 100 mL volumetric flask) and shaken well to make it homogeneous. 25 ml of this solution and 25 ml of distilled water taken in a 100 ml beaker and this beaker serving as conductivity cell with leads is connected to Conductivity Bridge. The black platinized electrode foils should be completely immersed in the acetic acid solution. The solution level shall be above the black electrode foils of the cell. After stirring with glass rod, the reading of initial conductance (zero reading) shall be noted, after attaining stability in reading. Small volumes of standardized sodium hydroxide solution from the burette are added into the beaker containing acetic acid slowly with vigorous stirring. After every addition of NaOH, the volume added and the conductance displayed in the meter should be noted. There will be a gradual fall in the conductance and soon after neutralization is complete, there will be a raise in the value. All the readings are tabulated.
OBSERVATIONS:
Volume of acetic acid solution taken = 25 ml. Temperature of the solution = oC

Engineering Chemistry lab manual 2016-17 (II Semester)
M V G R College of Engineering (Autonomous), Vizianagaram. Page 65
S. No Volume of
NaOH added,
ml
Conductivity measured, mho
Conductivity(C) Corrected Conductivity(C1)
C1=
C (V + 50)
50 1
2
3
4
5
6
7
8
9
10
11
12
13
14
15
16
17
18
19
A graph is plotted to the volume of NaOH added on X-axis and corresponding conductance measured on Y-axis and the two straight lines obtained are extrapolated to intersect each other. The point of intersection is the point of neutralization and the corresponding volume of NaOH gives the volume required to neutralize the 50ml of HCl taken. The concentration of acetic acid (HA) is calculated as below.
CALCULATIONS:
V1 = Volume of HA taken = 25 ml V2 = Volume of NaOH required =
M1 = Molarity of HA solution = ? M2 = Molarity of NaOH =
n1 = No of moles of HA =1 n2 = No. of moles of NaOH = 1
Engineering Chemistry lab manual 2016-17 (II Semester)
M V G R College of Engineering (Autonomous), Vizianagaram. Page 66
Concentration of the supplied acetic acid solution = M
The amount of acetic acid present in supplied solution in the 100 ml volumetric flask = Molarity of acetic acid x 60/10 = g
REPORT:
The amount of acetic acid present in a given sample of 100ml = g
PRECAUTIONS:
1. All the glass apparatus used in the experiment have to be thoroughly cleaned first with a solution of detergent and then rinsed twice with distilled water. The burette and pipette should then be rinsed with the experimental solution.
2. The entire content of the weighing bottle should be transferred into the volumetric flask through the funnel. The specks of the weighed solid in the funnel should be washed into the volumetric flask completely. The solute should be dissolved in water before make up.
3. The burette should be filled with the experimental solution up to the zero mark including the nozzle and should be allowed to stand five minutes before experimentation. There should be no air bubbles in the solution in burette or in pipette. The last drop of the pipette nozzle should not be blown off in release of the solution through pipette.
4. Distilled water should only be used throughout the experiment. The titration vessel should only be cleaned and rinsed with distilled water before and after each titration.
5. Care must be taken to avoid parallax error in balance measurements as well as in burette readings noted from time to time. The lower meniscus reading of the solution in the burette is to be taken as burette reading.
6. Weights must be handled only with forceps and should not be touched with hand as they may add additional weight or spoil weights.
7. Balance should be adjusted for free oscillations on both sides of the scale equally before weighing. In case of use of a digital balance, it should be set to zero before weighing.
8. Swirling of the titration vessel is necessary on each addition of the solution from the burette. The equivalence point should be observed carefully and burette reading be noted immediately.
9. The color change at the end point should be persistent for at least for 30 seconds. 10. The conductivity meter should be switched on 15 minutes before start of experiment for warm up.
All knobs should be adjusted as per manual of the instrument. 11. The solution of NaOH used in the burette must be 50 times more concentrated than the acid taken
in the conductivity cell. Soon after the experiment, the alkali solution must discharged from the burette and it is washed twice with tap and distilled water.
12. The electrodes of the conductivity cell visible as black foils should never be touched with hand while in cleaning or during operation, as they are electrically plated with a coat of platinum black for better results. Also, during titration, the electrode foils must be fully covered with solution and immersed in it.
13. Stable readings of conductance attained after proper stirring should only be recorded.

Engineering Chemistry lab manual 2016-17 (II Semester)
M V G R College of Engineering (Autonomous), Vizianagaram. Page 67
SIGNIFICANCE OF THE EXPERIMENT:
Conductometric titration is very valuable at low titrant concentrations of the range of 0.0001 M, at which the normal titrimetric methods fail. This method can be used with much diluted solutions or with coloured or turbid solutions, in which end point cannot be seen with naked eye. This method can be used in reactions where there is no suitable indicator and has many applications, i.e. it can be used for acid- base, redox, precipitation, or complex titrations. There is no need to use any indicator here as such the cumbersome process of selection of an indicator altogether is eliminated. Further, choice of an indicator for titrations weak acids, weak bases and sometimes both, is difficult to be carried out and conductometric titrations are accurate alternative for such experiments. Since the end point is located graphically, any errors creeping in the operation shall stand minimized.
In acid-base visual titrimetry, location of end point accurately is very important and any error requires repetition of the entire process. However, in conductometry, , no observation of end point is necessary and one single experiment is sufficient as there is no visual location of the end point, as it is located graphically by extrapolation.
This method can be used for the determination of sulphur dioxide in air pollution studies, determination of soap in oil, determination of accelerators in rubber and determination of total soap in latex.
Result:
Given Reported % of error Remarks Grade
Model graph

Engineering Chemistry lab manual 2016-17 (II Semester)
M V G R College of Engineering (Autonomous), Vizianagaram. Page 68
Student Report :
Engineering Chemistry lab manual 2016-17 (II Semester)
M V G R College of Engineering (Autonomous), Vizianagaram. Page 69
POTENTIOMETRIC TITRATION
Many acid-base titrations are difficult to be carried out using a visual indicator for one or several reasons. Visual methods may fail or have limited accuracy in dilute or colored solutions. Perhaps the analyst is not colour sensitive to the colour change of a particular indicator, there may not be a suitable colour change available for a particular type of titration or the solutions themselves may be colored, opaque or turbid. It may be necessary to automate a series of replicate determinations. In such situations, potentiometric titration, using a glass hydronium ion selective electrode, a suitable reference electrode and a sensitive potentiometer (a pH meter) may be advantageous.
Potentiometric titration is a technique similar to direct titration of a redox reaction. No indicator is used instead the potential across the analyte, typically an electrolyte solution, is measured. To do this, two electrodes are used, an indicator electrode and a reference electrode. The indicator electrode forms an electrochemical half cell with the interested ions in the test solution. The reference electrode forms the other half cell, holding a consistent electrical potential. The overall electric potential is calculated as Ecell = Eind -Eref + Esol and Esol is the potential drop over the test solution between the two electrodes. Ecell is recorded at intervals as the titrant is added. A graph of potential against volume added can be drawn and the end point of the reaction is half way between the jumps in voltage. Equivalence point is located through the graph as the point where the inflexion is maximum.
Ecell depends on the concentration of the interested ions with which the indicator electrode is in contact. For example, the electrode reaction may be
Mn+ +ne- M
As the concentration of Mn+ changes, the Ecell value changes correspondingly. Thus the potentiometric titration involves measurement of Ecell with the gradual incremental addition of titrant. The various types of potentiometric titrations are: acid-base titration (total alkalinity and total acidity), redox titration (HI/HY and cerate), precipitation titration (halides), and complexometric titration (EDTA).
THEORY: Any acid-base titration may be conducted through a potentiometric method. Two electrodes, after calibration [to relate potential in mill volts (mV) to a pH value] are immersed in a solution of the analyte. One is an indicator electrode, selective for H3O+ and the other, a stable reference electrode. The potential difference, which after calibration is pH, is measured after the successive addition of known increments of acid or base as titrant.
When a potentiometric titration is being performed, interest is focused upon changes in the
electromotive force of an electrolytic cell as a titrant of known concentration is added to a solution of unknown. The method can be applied to all titrimetric reactions provided that the concentration of at least one of the substances involved can be followed by means of a suitable indicator electrode. The critical problem in a titration is to recognize the point at which the quantities of reacting species are present in equivalent amounts. The titration curve can be followed point by point, plotting as ordinate, successive values of the cell EMF (pH) vs. the corresponding volume of titrant added.
The reference electrode: Most commonly, the reference electrode is the silver/silver chloride electrode. The potential is based on the following equilibrium:

Engineering Chemistry lab manual 2016-17 (II Semester)
M V G R College of Engineering (Autonomous), Vizianagaram. Page 70
AgCl(s) + e- Ag(s) + Cl-(aq)
The half cell is: Ag│AgCl(Saturated)│KCl(xM)║
The indicator electrode: The glass electrode is hydrogen ion sensitive electrode and hence is used as the indicator electrode in potentiometric titrations involving acidimetry - alkalimetry. The heart of the glass electrode is a thin glass membrane, specially fabricated to preferentially exchange H3O+. The outside of the membrane is in contact with the analyte solution containing the unknown [H3O+]. The inside of the membrane contacts hydrochloric acid solution of a fixed concentration. A silver wire, coated with AgCl dips into this solution, the other end of the wire is connected to the measuring device, potentiometer.
The mechanism of the response: A change in hydronium ion concentration causes a change in composition of the glass membrane due to an ion exchange process involving the solution and the membrane. A corresponding change in membrane potential, proportional to pH is measured. All the other potentials are constant. In effect, the membrane potential (variable) is measured against two fixed potentials, the external reference and the internal reference, both Ag/AgCl reference electrodes. Potential difference is measured using a high impedance potentiometer. This high resistance dictates a very small current flow. Each glass electrode is different, due to the difficulty of reproducing the glass membrane; it is, therefore, necessary to standardize the meter and electrode against at least two solutions of accurately known pH. Such standard buffer solutions are available from many different manufacturers.
The points to be considered while carrying out a potentiometric titration are
1. Stir well after every addition of titrant.
2. Allow some time after every addition of titrant so that the electrode may attain equilibrium.
3. E M F measured shall be constant within 1 mV fluctuation is enough. When the drift in EMF is within this, further volume of titrant may be added.
4. The region near the end point is important in locating the exact equivalence point
accurately. With the addition of the titrant, as the change in EMF becomes greater and greater, the volume increment of the titrant should be small, say it shall be reduced to 0.2 to even 0.1 ml. This increment should be maintained both below and above the end point.
5. To prevent unnecessary dilution of the solution, the titrant must be 10 times concentrated.
-oOo-

Engineering Chemistry lab manual 2016-17 (II Semester)
M V G R College of Engineering (Autonomous), Vizianagaram. Page 71
EXPERIMENT NO. 10 Date:
POTENTIOMETRIC TITRATION OF FERROUS IRON [Fe (II)] WITH POTASSIUM DICHROMATE
AIM: Determination of ferrous iron [Fe (II)] with standard potassium dichromate Apparatus & Chemicals required: Potentiometric titration setup with combined electrode , magnetic stirrer with paddle, beakers, wash bottle with distilled water, analytical/digital balance, weight box, weighing bottle, watch glass, funnel, micro burette, pipette, volumetric flasks, conical flask, ferrous ammonium sulphate, potassium dichromate AR solid, sulphuric acid. PRINCIPLE:
An electrode dipped in a solution containing an ion with respect to which the electrode is reversible is called the reference electrode, since its potential indicates the presence and concentration of the ions. However, since the potential of the electrode is a logarithmic function of the concentration of the ion, it is not possible to find out accurately the concentration of the ion knowing potential of the half element. This is true for very dilute solutions where concentrations may be taken as equal to activities. If, however, the ions are removed by the addition of a suitable titrant, the EMF changes first slowly and then more steeply as the fraction of the ion removed increases with the incremental addition of the titrant. Beyond the end point the fraction of the ion removed increases less and less. So a plot of EMF of half element against volume of titrant added gives characteristic curves showing steep fall/raise in potential at the point of equivalence. End point is the point of maximum inflexion in the graph.
In this experiment, a measured volume of an aqueous solution of ferrous ammonium sulphate in sulphuric acid medium (4N) is taken in the beaker, in which the combined electrode is fully immersed to dip the bulb and the electrode terminals are connected to the potentiometer. Standard potassium dichromate solution is taken in the micro-burette. Initial potential of the solution in beaker is noted. Similarly, potential is measured after each addition of dichromate solution from the burette. The potential slowly increases and shows a steep jump at the point of equivalence, where all the ferrous ions are oxidized to ferric ion during the course of titration. The basic equation for the reaction is:
K2Cr2O7 + 6FeSO4 + 7H2SO4 K2SO4 + 3Fe2 (SO4)3 + Cr2 (SO4)3 + 7H2O Fe2+ + Cr6+ Fe3+ + Cr3+
Proper care must be taken to see that small incremental addition is made at the point of equivalence, where a jump to the tune of 250mV can be observed. Addition of dichromate shall be continued even after attaining end point after complete oxidation of all the ferrous ions into ferric ions. The volume of dichromate solution added and corresponding potential observed in mV are noted in the table. A graph is drawn to the volume added on X-axis and potential E mV on Y-axis giving a smooth curve with a steep upward jump at the point of equivalence, from which volume required for complete oxidation is noted corresponding to the jump. From this, the concentration of ferrous ammonium sulphate and hence amount of ferrous iron present are calculated relevant formulae.
PROCEDURE:
PART A – Preparation of standard potassium dichromate solution (Primary standard): About 0.4910g of AR grade potassium dichromate solid sample is weighed accurately in a clean,
dry weighing bottle and transferred into a 100ml volumetric flask through a glass funnel. The substance is dissolved completely in a minimum amount of distilled water and the solution is made up to the mark.
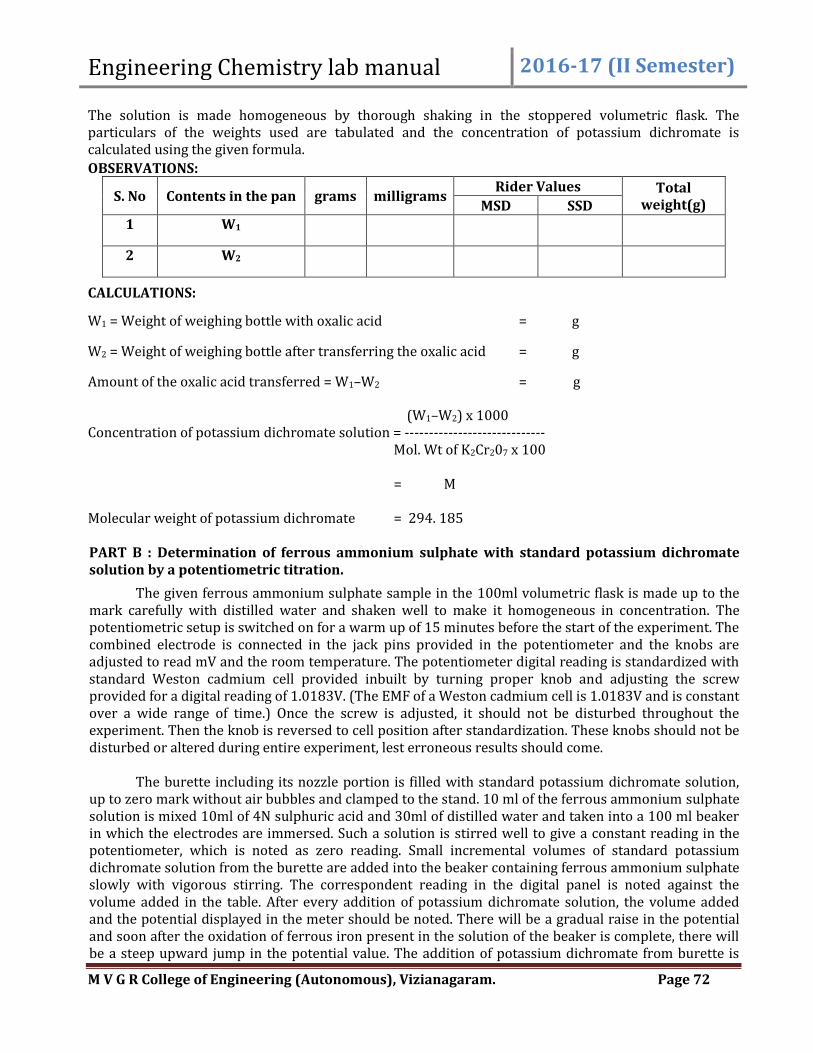
Engineering Chemistry lab manual 2016-17 (II Semester)
M V G R College of Engineering (Autonomous), Vizianagaram. Page 72
The solution is made homogeneous by thorough shaking in the stoppered volumetric flask. The particulars of the weights used are tabulated and the concentration of potassium dichromate is calculated using the given formula.
OBSERVATIONS:
S. No Contents in the pan grams milligrams Rider Values Total
weight(g) MSD SSD
1 W1
2 W2
CALCULATIONS:
W1 = Weight of weighing bottle with oxalic acid = g
W2 = Weight of weighing bottle after transferring the oxalic acid = g
Amount of the oxalic acid transferred = W1–W2 = g
(W1–W2) x 1000 Concentration of potassium dichromate solution = ----------------------------- Mol. Wt of K2Cr207 x 100 = M Molecular weight of potassium dichromate = 294. 185 PART B : Determination of ferrous ammonium sulphate with standard potassium dichromate solution by a potentiometric titration.
The given ferrous ammonium sulphate sample in the 100ml volumetric flask is made up to the mark carefully with distilled water and shaken well to make it homogeneous in concentration. The potentiometric setup is switched on for a warm up of 15 minutes before the start of the experiment. The combined electrode is connected in the jack pins provided in the potentiometer and the knobs are adjusted to read mV and the room temperature. The potentiometer digital reading is standardized with standard Weston cadmium cell provided inbuilt by turning proper knob and adjusting the screw provided for a digital reading of 1.0183V. (The EMF of a Weston cadmium cell is 1.0183V and is constant over a wide range of time.) Once the screw is adjusted, it should not be disturbed throughout the experiment. Then the knob is reversed to cell position after standardization. These knobs should not be disturbed or altered during entire experiment, lest erroneous results should come.
The burette including its nozzle portion is filled with standard potassium dichromate solution, up to zero mark without air bubbles and clamped to the stand. 10 ml of the ferrous ammonium sulphate solution is mixed 10ml of 4N sulphuric acid and 30ml of distilled water and taken into a 100 ml beaker in which the electrodes are immersed. Such a solution is stirred well to give a constant reading in the potentiometer, which is noted as zero reading. Small incremental volumes of standard potassium dichromate solution from the burette are added into the beaker containing ferrous ammonium sulphate slowly with vigorous stirring. The correspondent reading in the digital panel is noted against the volume added in the table. After every addition of potassium dichromate solution, the volume added and the potential displayed in the meter should be noted. There will be a gradual raise in the potential and soon after the oxidation of ferrous iron present in the solution of the beaker is complete, there will be a steep upward jump in the potential value. The addition of potassium dichromate from burette is

Engineering Chemistry lab manual 2016-17 (II Semester)
M V G R College of Engineering (Autonomous), Vizianagaram. Page 73
continued until the equivalence point has been passed by 0.5 –1.0ml. All the readings are tabulated. Volume of the sample of ferrous ammonium sulphate taken = 10ml Temperature = oC
Pilot table S. No Volume of K2Cr2O7 added, ml. Potential measured, mV 1
2
3
4
5
6
7
8
9
10
11
12
Accurate table S.No Volume of K2Cr2O7 added, ml. Potential measured, mV 1
2
3
4
5
6
7
8
9

Engineering Chemistry lab manual 2016-17 (II Semester)
M V G R College of Engineering (Autonomous), Vizianagaram. Page 74
10
11
12
13
14
15
17
18
19
20
A graph is plotted to the volume of potassium dichromate added on X-axis and corresponding potential in mV measured on Y-axis to obtain a smooth curve through the obtained points. The steep upward jump in potential in the curve causing a change of 200 – 300mV in the EMF is the point of neutralization and the corresponding volume of potassium dichromate gives the volume required to oxidize the 10ml of ferrous ammonium sulphate taken. The concentration of ferrous ammonium sulphate is calculated as below.
CALCULATIONS:
M1= Concentration of ferrous iron solution = ?
V1 = Volume of ferrous iron solution pipetted out = 10.0 ml
n1 =No. of moles of ferrous Iron = 6
M2 =Concentration of potassium dichromate solution =
V2 = Volume of dichromate solution rundown =
n2 =No. of moles of dichromate = 1
=
=
Concentration of ferrous iron present in given 100 ml of solution (M1) =
Amount of ferrous iron [Iron (II)] present in given 100ml solution =

Engineering Chemistry lab manual 2016-17 (II Semester)
M V G R College of Engineering (Autonomous), Vizianagaram. Page 75
Atomic weight of iron = 55.86
RESULT: The amount of ferrous iron [Fe (II)] present in a given sample 100ml = g
PRECAUTIONS:
1. All the glass apparatus used in the experiment have to be thoroughly cleaned first with a solution of detergent and then rinsed twice with distilled water. The burette and pipette should then be rinsed with the corresponding experimental solution.
2. The entire content of the weighing bottle should be transferred into the volumetric flask
through the funnel. The specks of the weighed solid in the funnel should be washed into the volumetric flask completely. The solute should be dissolved in water before make up.
3. The burette should be filled with the experimental solution up to the zero mark including the nozzle and should be allowed to stand five minutes before experimentation. There should be no air bubbles in the solution in burette or in pipette. The last drop of the pipette nozzle should not be blown off in release of the solution through pipette.
4. Distilled water should only be used throughout the experiment. The titration vessel should
only be cleaned and rinsed with distilled water before and after each titration.
5. Care must be taken to avoid parallax error in balance measurements as well as in burette readings noted from time to time. The lower meniscus reading of the solution in the burette is to be taken as burette reading.
7. Weights must be handled only with forceps and should not be touched with hand as they may add additional weight or spoil weights. Balance should be adjusted for free oscillations on both sides of the scale equally before weighing. In case of use of a digital balance, it should be set to zero before weighing.
8. Swirling of the titration vessel is necessary on each addition of the solution from the burette.
The equivalence point should be observed carefully and burette reading be noted immediately.
9. The colour change at the end point should be persistent for at least for 30 seconds.
10. The potentiometer should be switched on 15 minutes before start of experiment for warm
up. All knobs should be adjusted as per manual of the instrument. It should be standardized with the inbuilt Weston Cadmium cell only.
11. The solution of potassium dichromate used in the burette must be 10 times more
concentrated than the acid taken in the cell.
12. The electrodes of the cell should never be touched with hand while in cleaning or during operation the electrode must be fully covered with solution and immersed in it.
13. Stable readings of potential attained after proper stirring should only be recorded.
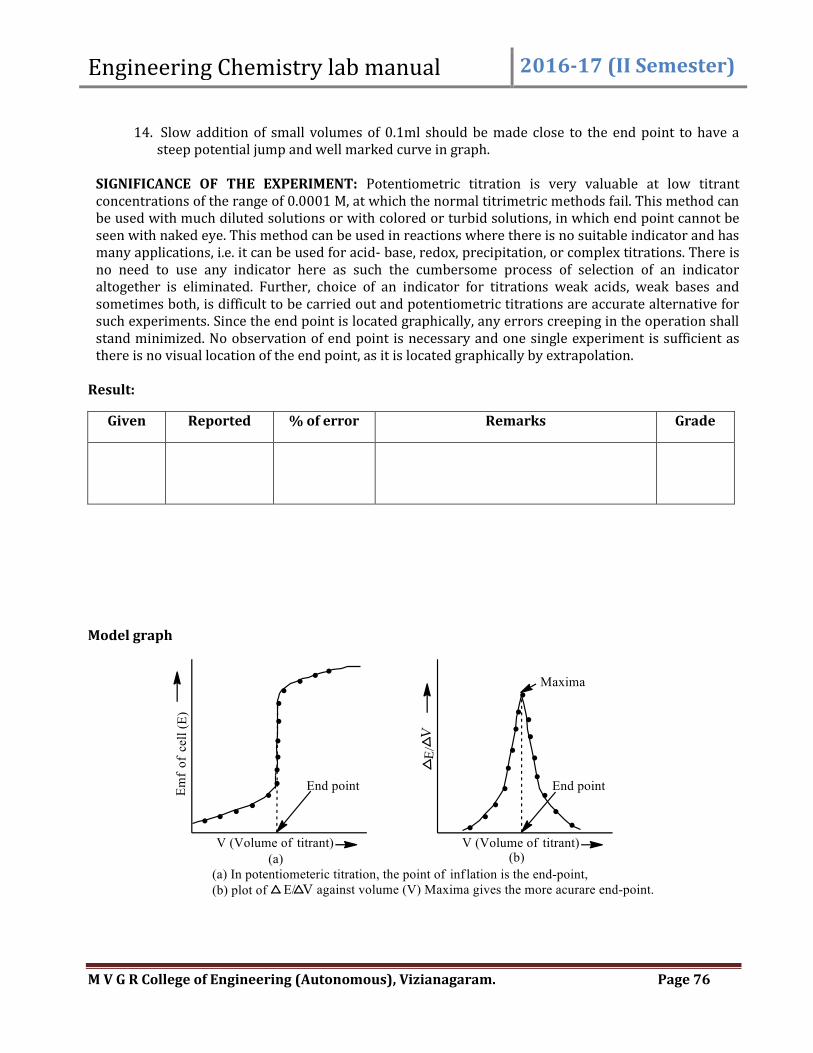
Engineering Chemistry lab manual 2016-17 (II Semester)
M V G R College of Engineering (Autonomous), Vizianagaram. Page 76
14. Slow addition of small volumes of 0.1ml should be made close to the end point to have a
steep potential jump and well marked curve in graph.
SIGNIFICANCE OF THE EXPERIMENT: Potentiometric titration is very valuable at low titrant concentrations of the range of 0.0001 M, at which the normal titrimetric methods fail. This method can be used with much diluted solutions or with colored or turbid solutions, in which end point cannot be seen with naked eye. This method can be used in reactions where there is no suitable indicator and has many applications, i.e. it can be used for acid- base, redox, precipitation, or complex titrations. There is no need to use any indicator here as such the cumbersome process of selection of an indicator altogether is eliminated. Further, choice of an indicator for titrations weak acids, weak bases and sometimes both, is difficult to be carried out and potentiometric titrations are accurate alternative for such experiments. Since the end point is located graphically, any errors creeping in the operation shall stand minimized. No observation of end point is necessary and one single experiment is sufficient as there is no visual location of the end point, as it is located graphically by extrapolation.
Result:
Given Reported % of error Remarks Grade
Model graph

Engineering Chemistry lab manual 2016-17 (II Semester)
M V G R College of Engineering (Autonomous), Vizianagaram. Page 77
Student Report :

Engineering Chemistry lab manual 2016-17 (II Semester)
M V G R College of Engineering (Autonomous), Vizianagaram. Page 78
EXPERIMENT NO. 11A Date:
REDWOOD VISCOMETER-I
Aim: To determine the kinematic and absolute viscosity of given oil sample and study the variation of viscosity with temperature using Redwood Viscometer-I.
Apparatus: Redwood, viscometer-I, Thermometer, stopwatch, 50cc gravity bottle, analytical balance.
Scope: 1. The flow time measurements of petroleum products on Redwood apparatus should be made
at 21oC, 37.8 oC, 50 oC, 93 oC, 121oC, 149 oC and 204 oC for 50cc of collection.
Procedure:
Level the apparatus by adjusting the leveling screws with the help of spirit level. Clean the oil cup and place the ball valve in position and fill the oil cup to the pointer level
with filtered oil sample. Fill the heating bath with water up to the level. Place the 50ml gravity bottle just below the jet of oil for 50ml collection of given oil in
seconds at room temperature. Replace the oil sample up to the mark. Heat the oil sample through water bath with the help
of immersion heater. After attaining a steady temperature by continuous stirring determine time taken for 50ml of oil collection in seconds.
Repeat the above particulars or procedure for given temperature and report the values. For study of variation of viscosity, note down at least five readings starting from room
temperature and inclusive of required Redwood temperatures and calculate the readings. Calculate the density of oil with the help of analytical balance and determine absolute
viscosity. Precautions:
1. Ensure proper seating of the ball valve to avoid leakage. 2. Stir the water bath continuously during heating for homogeneous rise in temperature. 3. Oil should be free from suspended particles and jet should be cleaned well to avoid chocking.
Characteristic Curves:
Plot the following curves
a. Temperature vs. time in Redwood seconds. b. Temperature vs. Kinematic viscosity. c. Temperature vs. Absolute viscosity.
Table showing conversion formulae:
Viscosity Scale Range of time in Seconds Kinematic Viscosity in stokes
Redwood-I 30-100 seconds
100-2000 seconds (0.00264T)-(1.79/T) (0.00247T)-(0.5/T)

Engineering Chemistry lab manual 2016-17 (II Semester)
M V G R College of Engineering (Autonomous), Vizianagaram. Page 79
Observation Table:
S. No. Temp. in oC
Flow time in
sec
W1 in grams
W2 in grams
[W2-W1] [W2-W1]/50 Kinematic
Viscosity in stokes
Absolute Viscosity in poise
1
2
3
4
W1 = Weight of the empty gravity bottle in grams.
W2 =Weight of the bottle with 50ml oil sample in grams.
[W2-W1]/50 = Density of the oil sample in gm/cm3.
Absolute Viscosity = Kinematic Viscosity X Density
Result:
Flow time for collection of 50cc at different temperatures is noted. The Kinematic Viscosity and Absolute Viscosity at different temperatures is to be calculated and graphs should be plotted.
Analysis:
Result should be compared with master value to find out any deviations from it. If there is any deviation analyze the reasons for that. The probable reasons for the deviation are sudden rise in the temperature, obstruction in the Jet which increases the flow time, improper stirring, and error in the thermometer reading and error in measuring the flow time.
Student Report:
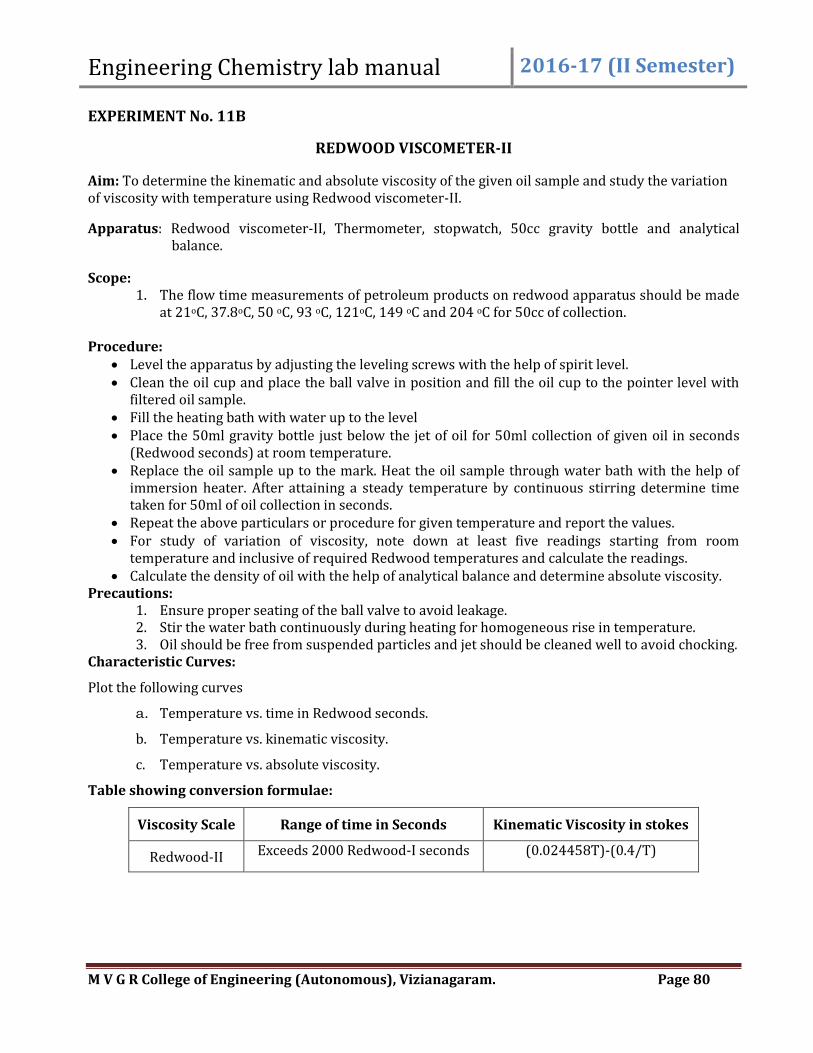
Engineering Chemistry lab manual 2016-17 (II Semester)
M V G R College of Engineering (Autonomous), Vizianagaram. Page 80
EXPERIMENT No. 11B
REDWOOD VISCOMETER-II
Aim: To determine the kinematic and absolute viscosity of the given oil sample and study the variation of viscosity with temperature using Redwood viscometer-II.
Apparatus: Redwood viscometer-II, Thermometer, stopwatch, 50cc gravity bottle and analytical balance.
Scope: 1. The flow time measurements of petroleum products on redwood apparatus should be made
at 21oC, 37.8oC, 50 oC, 93 oC, 121oC, 149 oC and 204 oC for 50cc of collection.
Procedure: Level the apparatus by adjusting the leveling screws with the help of spirit level. Clean the oil cup and place the ball valve in position and fill the oil cup to the pointer level with
filtered oil sample. Fill the heating bath with water up to the level Place the 50ml gravity bottle just below the jet of oil for 50ml collection of given oil in seconds
(Redwood seconds) at room temperature. Replace the oil sample up to the mark. Heat the oil sample through water bath with the help of
immersion heater. After attaining a steady temperature by continuous stirring determine time taken for 50ml of oil collection in seconds.
Repeat the above particulars or procedure for given temperature and report the values. For study of variation of viscosity, note down at least five readings starting from room
temperature and inclusive of required Redwood temperatures and calculate the readings. Calculate the density of oil with the help of analytical balance and determine absolute viscosity.
Precautions: 1. Ensure proper seating of the ball valve to avoid leakage. 2. Stir the water bath continuously during heating for homogeneous rise in temperature. 3. Oil should be free from suspended particles and jet should be cleaned well to avoid chocking.
Characteristic Curves:
Plot the following curves
a. Temperature vs. time in Redwood seconds.
b. Temperature vs. kinematic viscosity.
c. Temperature vs. absolute viscosity.
Table showing conversion formulae:
Viscosity Scale Range of time in Seconds Kinematic Viscosity in stokes
Redwood-II Exceeds 2000 Redwood-I seconds (0.024458T)-(0.4/T)

Engineering Chemistry lab manual 2016-17 (II Semester)
M V G R College of Engineering (Autonomous), Vizianagaram. Page 81
Observation Table:
S.No. Temp in oC
Flow Time in
sec
W1 in grams
W2 in grams
[W2-W1] [W2-W1]/50 Kinematic
Viscosity in stokes
Absolute Viscosity in poise
1
2
3
4
W1 = Weight of the empty gravity bottle in grams.
W2 =Weight of the bottle with 50ml oil sample in grams.
[W2-W1]/50 = Density of the oil sample in gm/cm3.
Absolute Viscosity = Kinematic Viscosity X Density
Result:
Flow time for collection of 50cc at different temperatures is noted. The Kinematic Viscosity and Absolute Viscosity at different temperatures is to be calculated and graphs should be plotted.
Analysis: Result should be compared with master value to find out any deviations from that. If there is
any deviation analyze the reasons for that. The probable reasons for the deviation are sudden rise in the temperature, obstruction in the Jet which increases the flow time, improper stirring, and error in the thermometer reading and error in measuring the flow time. Student Report:
Engineering Chemistry lab manual 2016-17 (II Semester)
M V G R College of Engineering (Autonomous), Vizianagaram. Page 82
EXPERIMENT No.11C SAYBOLT’S VISCOMETER
Aim: To determine the kinematic and absolute viscosity of the given oil sample and study the variation of viscosity with temperature using Say bolt’s viscometer.
Apparatus: Say bolt Viscometer, oil thermometer, water thermometer, stopwatch, 60cc gravity bottle, and analytical balance.
Scope:
1. The Saybolt universal viscometer determinations shall be made at 25 oC, 37.5 oC, 50 oC and 98 oC.
Procedure:
Level the apparatus by adjusting the leveling screws with the help of spirit level. Clean the oil cup and place the ball valve in position and fill the oil cup to the pointer level with
filtered oil sample. Fill the heating bath with water up to the level. Place the gravity bottle just below the oil jet, and open the cork oil is flowing through the jet into
the bottle. Note down the time taken for 60ml collection of given oil in seconds at room temperature.
Replace the oil sample up to the mark and heat the oil sample through water bath with the help of immersion heater, after attaining a steady temperature by continuous stirring determine time taken for 60ml of oil collection in seconds.
Repeat the above procedure for a given temperature and report the values. For study of variation of viscosity, note down at least five readings starting from room
temperature and inclusive of required say bolt temperatures and tabulate readings. Calculate the density of oil with the help of simple balance and determine the absolute viscosity.
Precautions:
1. Ensure proper closing of the cork to avoid leakage.
2. Stir the water bath continuously during heating for homogeneous rise in temperature.
3. Oil should be free from suspended particles and jet should be cleaned well to avoid chocking.
Characteristic Curves:
Plot the following curves
a. Temperature vs. time in Redwood seconds.
b. Temperature vs. kinematic viscosity.
c. Temperature vs. absolute viscosity.
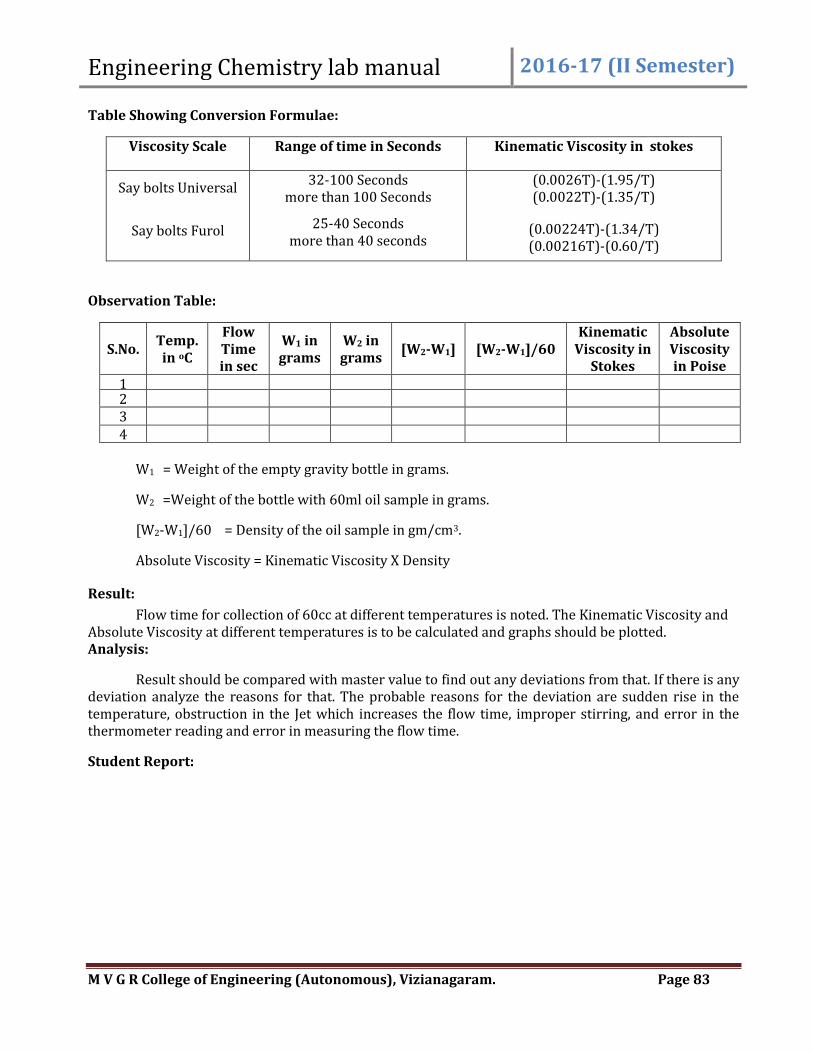
Engineering Chemistry lab manual 2016-17 (II Semester)
M V G R College of Engineering (Autonomous), Vizianagaram. Page 83
Table Showing Conversion Formulae:
Viscosity Scale Range of time in Seconds Kinematic Viscosity in stokes
Say bolts Universal
Say bolts Furol
32-100 Seconds more than 100 Seconds
25-40 Seconds more than 40 seconds
(0.0026T)-(1.95/T) (0.0022T)-(1.35/T)
(0.00224T)-(1.34/T) (0.00216T)-(0.60/T)
Observation Table:
S.No. Temp. in oC
Flow Time in sec
W1 in grams
W2 in grams
[W2-W1] [W2-W1]/60 Kinematic
Viscosity in Stokes
Absolute Viscosity in Poise
1 2 3 4
W1 = Weight of the empty gravity bottle in grams.
W2 =Weight of the bottle with 60ml oil sample in grams.
[W2-W1]/60 = Density of the oil sample in gm/cm3.
Absolute Viscosity = Kinematic Viscosity X Density
Result:
Flow time for collection of 60cc at different temperatures is noted. The Kinematic Viscosity and Absolute Viscosity at different temperatures is to be calculated and graphs should be plotted. Analysis:
Result should be compared with master value to find out any deviations from that. If there is any deviation analyze the reasons for that. The probable reasons for the deviation are sudden rise in the temperature, obstruction in the Jet which increases the flow time, improper stirring, and error in the thermometer reading and error in measuring the flow time.
Student Report:

Engineering Chemistry lab manual 2016-17 (II Semester)
M V G R College of Engineering (Autonomous), Vizianagaram. Page 84
EXPERIMENT No.12
Determination of flash point by Cleaveland’s apparatus
Aim:
To determine the flash point and fire point of the given oil sample using the Cleveland’s open cup
apparatus.
Apparatus:
Cleveland’s open cup apparatus, standard thermometer.
Theory:
1. Flash Point:
Flash point is the lowest temperature at which the oil sample gives off enough vapors for
a momentary flash when a test flame is brought near to it.
2. Fire point:
Fire point is the temperature at which the vapors given off by oil ignites and continues to
burn at least for five seconds.
Knowledge related to flash point and fire point of oil is quite essential in deciding its
applicability in a given area in view of range of varying temperature.
Procedure:
Clean the oil cup thoroughly and fill with oil sample up to mark.
Insert the thermometer into the oil cup that indicates the oil temperature.
Heater is connected to the mains through rheostat and the range of heating is adjusted.
The oil sample is tested for flash with a test flame for every one-degree rise in temperature.
At the flash point the test flame burns with a blue flame momentarily. The corresponding
temperature is recorded as flash point of the oil.
The heating is continued thereafter and test flame is applied as before. When the oil ignites and
continues to burn at least for five seconds and respective temperature is recorded as fire point.
Repeat the experiment twice with fresh oil to increase accuracy.
Precautions:
1. The thermometer bulb should not touch the bottom of the cup.
2. The regulator should be so adjusted that the heating is slowly and steady.
3. The test flame should be introduced for testing after every one degree rise in temperature.
4. After every trial, the sample should be changed and thermometer cup should be cooled.
5. The difference between the flash point and fire point should be observed carefully with visible
observation.
Observation Table:-
S.No. Flash Point Temperature in oC Fire Point Temperature in oC
1
2
Engineering Chemistry lab manual 2016-17 (II Semester)
M V G R College of Engineering (Autonomous), Vizianagaram. Page 85
Result:
The flash point temperature of the given oil sample is oC
The fire point temperature of the given oil sample is oC
Analysis:
Result should be compared with master value and find out any deviations from that. If there is
any deviation analyze the reasons for that. The reasons for the deviations are error in the thermometer
reading, and sudden rise in temperature.
Questions for viva - voce:
1. What are the constructional differences between Cleavelands apparatus and Abels apparatus.
2. What is the range of temperature for which this apparatus is suitable.
3. Why it is called as open cup apparatus.
4. To learn about the accuracy levels that can be obtained when compared to Abels apparatus.
Student Report :

Engineering Chemistry lab manual 2016-17 (II Semester)
M V G R College of Engineering (Autonomous), Vizianagaram. Page 86
EXPERIMENT NO. 13 Date: PRODUCTION OF BIO-DIESEL
INTRODUCTION:
Biodiesel is a mono alkyl esters of long chain fatty acids derived from a renewable vegetable oil or
animal fat. Bio represents biological source and Diesel refers to its use in diesel engines.
Biodiesel, as an alternative fuel, has many merits. It is derived from a renewable, domestic
resource. It is biodegradable and non-toxic. Compared to petroleum-based diesel, biodiesel has a more
favorable combustion emission profile, such as low emissions of carbon monoxide, particulate matter and
unburnt hydrocarbons. Biodiesel has a relatively high flash point (150 OC), which makes it less volatile and
safer in transport or handling than petroleum diesel. It provides lubricating properties that can reduce
engine wear and extend life of an engine.
MAKING BIODIESEL
The most common way to produce biodiesel is trans esterification of vegetable oil. When tri acyl
glycerol reacts with an alcohol, the three fatty acid chains are released from the glycerol skeleton and
combine with the alcohol to yield fatty acid alkyl esters. Glycerol is produced as a byproduct. Methanol is
the most commonly used alcohol because of its low cost. In general excess of methanol is used to shift
equilibrium far to the right.
A schematic representation of the trans esterification of triglycerides with methanol to produce
fatty acid methyl esters is given.
H2C
HC
O C R
O
H2C
O CO R'
O C
O
R"
H3C OH3Catalyst
H3C O C R
O
CH3 O C R'
O
CH3 O C R"
O
H2C OH
HC
H2C
OH
OH
Triacylgylcerol (Triglyceride)
Methanol
Fatty acid methyl esters (FAME)
Glycerol
+
++ +
MATERIALS:
1. 2x250 ml Erlenmeyer flasks and stoppers.
2. 250ml separating funnel
3. 100ml graduated cylinder
4. 50ml graduated cylinder
5. Disposable pipettes or a turkey baster
6. Thermometer

Engineering Chemistry lab manual 2016-17 (II Semester)
M V G R College of Engineering (Autonomous), Vizianagaram. Page 87
7. Water bath
8. Safety goggles, gloves, and aprons.
REAGENTS:
1. Oil(100ml oil)
2. Alcohol(20ml methanol)
3. Base catalyst[ one of the following base solutions or solid base crystals: 15ml of 1.0 M NaOH(aq)
/0.6 g of NaOH(s) or 15ml of 1.0 M KOH(aq)/ 0.9 g of KOH(s)]
PROCEDURE
Measure out 100ml of oil using a graduated cylinder, and drop the oil into one of the Erlenmeyer
flasks. Record observations of colors, viscosity, clarity, and other aspects of the appearance of the starting
material. Check that the temperature of the water bath is between 40 oC and 65 oC. Place the Erlenmeyer
flask containing the oil sample into the water bath. While the oil is warming, measure out 20ml of
methanol using a 50ml graduated cylinder and drop it into a second Erlenmeyer flask. To the Erlenmeyer
flask containing methanol add one of the following: 15ml of 1.0 M NaOH solution, 15ml of 1.0 M KOH(aq)
solution,0.6 g of NaOH(s), or 0.9 g of KOH (s). Swirl the mixture of methanol and base gently. This mixture
is called methoxide. If a solid base is used the mixture should be swirled until the solid base dissolves
completely. To prevent evaporation, the mixture should be stoppered until it is ready to be added to the
oil. Pour the methoxide mixture into the Erlenmeyer flask. Gently shake the mixture for several minutes.
The mixture will become cloudy and into turn a milky color. A stopper or aluminum foil can be used on
the flask to control fumes if any. If the reaction is successful, two layers developing inside the flask can be
seen. Take the mixture into a separating funnel. Then the heavier glycerine will start to settle to the
bottom. The biodiesel will be in the upper layer. The biodiesel varies in color depending on the oil used.
This will take at least an hour, or more for the better result. The mixture should be kept overnight to
completely react. Collect the glycerin from bottom of the separating funnel carefully. The crude biodiesel
remains in the separating funnel.
WASHING
1. Add sufficient volume of water to the crude biodiesel oil and shake vigorously the contents to mix
the water\fuel mixture for about 5 min until it looks homogeneous.
2. Let it settle for one hour
3. Drain the water from the bottom and repeats steps1, 2 and 3 for two more times.
4. Let the fuel be left for air-dry or heat it to 120 oF (48 oC) to dry.
Transfer the biodiesel into a graduated measuring jar and measure the volume

Engineering Chemistry lab manual 2016-17 (II Semester)
M V G R College of Engineering (Autonomous), Vizianagaram. Page 88
Quantitative observations of reaction
S.No Observations Quantity
1 Volume of oil(ml)[reactant]
2 Volume of biodiesel(ml)[product]
Percent yield of the reaction
3 % Yield= Product/Reactant X 100
Result:
Given Reported % of error Remarks Grade
Student Report :
Engineering Chemistry lab manual 2016-17 (II Semester)
M V G R College of Engineering (Autonomous), Vizianagaram. Page 89
EXPERIMENT NO. 14 Date:
Construction of a Galvanic cell
AIM: To introduce the student to electrochemistry and oxidation-reduction reactions through the
construction and operation of a simple galvanic cell.
MATERIALS:
Chemicals 1. 0.5 M copper(II) sulfate 2. 0.5 M zinc sulfate 3. zinc, copper strips (approximately 1 cm x 10 cm)*
Equipment
1. 100-mL beaker* 2. Dialysis tubing* 3. Hook-up wire or bell wire 4. 1.5-volt flashlight lamp with less than 100 milliamp rating 5. Alligator clamps 6. Crimping tool 7. Soldering iron and resin core solder 8. Clamps(for dialysis tubing) 9. Sandpaper or steel wool
PROCEDURE: Prepare a test lamp by soldering wire test leads to a 1.5-volt flashlight lamp. Attach alligator clips to the ends of the leads. Obtain strips of copper, each strip should be 2.5 cm longer than the height of the beaker being used. Sand the strips until they are shiny. Tie a knot with string or use a non-reactive clamp in one end of dialysis tubing that has been soaked in distilled water. The length of tubing should be long enough so that it overlaps the edge of the beaker by 2.5 cm. Fill the dialysis tubing with the prepared copper(II) sulfate solution. Place the copper strip in this piece of dialysis tubing that is now filled with copper(II) sulfate solution and use string or a rubber band to secure the top of the dialysis tubing around the copper. Leave 2.5 cm of copper sticking out of the tubing. Fill the beaker with the prepared zinc sulfate solution; place both the dialysis tubing, containing the copper and copper (II) sulfate solution, and the Zinc strip in the beaker.. Secure both the zinc strip and the copper strip in the dialysis tubing in the beaker by bending them over the edge of the beaker. Complete the circuit by attaching one alligator clip to the copper strip and the other to the zinc strip. Observe and record any activity taking place at the metal strips, the solution (especially color changes), and the test lamp. Connect several cells in series and operate a small radio or some other direct current device. Try making cells with magnesium or aluminum in place of the zinc.
DISCUSSION
1. The following discussion applies when copper and magnesium strips are used as the metal strips. If other metals are used, similar explanations can be used.
2. Zn(s) + Cu2+(aq) → Zn2+(aq) + Cu(s) + 1.1v

Engineering Chemistry lab manual 2016-17 (II Semester)
M V G R College of Engineering (Autonomous), Vizianagaram. Page 90
3. This reaction is an oxidation-reduction reaction in which the Zn is oxidized by the copper to Zn2+ ions. The result of this reaction is a transfer of electrons which provides the power required to light the flashlight lamp.
4. Students performing this experiment should be familiar with the following terms: anode,
cathode, oxidizing agent, reducing agent, and electromotive series. Students should be presently studying a unit on electrochemistry and oxidation-reduction reactions in order to fully understand the "chemistry" of this experiment.
TIPS
1. The metal strips used in this experiment should have a large surface area to minimize resistance within the cell.
2. Use a voltmeter instead of the light bulb to eliminate the need for soldering. 3. Aluminum strips may not work unless sanded thoroughly and acid treated with 6.0 M HCl. 4. Soldering techniques should be mastered by teacher so that any soldering can be
S .No Metal Metal Potential 1 Copper Cu+2 Zinc Zn+2 1.1V 2 Zinc Zn+2 Iron Fe+2 0.354V 3 Copper Cu+2 Iron Fe+2
1.11V
Result:
Given Reported % of error Remarks Grade
Student Report :

Engineering Chemistry lab manual 2016-17 (II Semester)
M V G R College of Engineering (Autonomous), Vizianagaram. Page 91
EXPERIMENT NO. 15 Date:
Identification of potability or otherwise of water samples by measuring pH, Electrical conductivity, TDS, total hardness of water, hardness due to calcium, hardness due to magnesium and total alkalinity. Aim: To identify the potability of a water samples by measuring pH, Electrical conductivity, TDS, total hardness of water, hardness due to calcium, hardness due to magnesium and total alkalinity. APPARATUS & CHEMICALS REQUIRED: Burette, pipette, volumetric flasks, funnel, conical flasks, wash bottle with distilled water, burette stand with suitable burette clamp, white porcelain glazed tile, Analytical balance, weight box with fractional weights& aluminum rider, weighing bottle, EDTA solution, zinc sulphate AR(solid), Eriochrome black T (EBT) indicator solution, buffer solution (NH4Cl +NH4OH) of pH 10, watch glass.
1. Determination of pH of water sample:
Procedure: About 50 ml of this water sample is taken in a clean100 ml beaker. A calibrated pH meter is taken and its glass electrode is dipped in the water sample, care should be taken such that the electrode is completely immersed in the water and not touching the bottom of the beaker. Stir the sample for homogeneity and record the value displayed after attainment of stable value. The value thus obtained is noted in the table along with the temperature at which it is measured.
Temperature of the solution = oC 2.
S.No Volume of water sample in ml pH of the water sample
pH of water sample =
3. Determination of Electrical conductivity of water sample:
Produce: About 50 ml of this water sample is taken in a clean100 ml beaker. A calibrated conductivity meter is taken and its conductivity cell is dipped in the water sample, care should be taken such that the electrode is completely immersed in the water and not touching the bottom of the beaker. Stir the sample for homogeneity and record the value displayed after attainment of stable value. The value thus obtained is noted in the table along with the temperature at which it is measured.
Temperature of the solution = oC
S.No Volume of water sample in ml Conductivity in µs (C)
Electrical conductivity of the water sample = ………. µs

Engineering Chemistry lab manual 2016-17 (II Semester)
M V G R College of Engineering (Autonomous), Vizianagaram. Page 92
4. Determination of TDS of water sample:
As per US EPA (United States Environmental Protection Agency) TDS = 0.06 X Electrical Conductivity of water sample in µS/cm in ppm TDS of water sample =…………………….ppm 5. Determination of total hardness of water PART A – Preparation of 0.01M standard zinc sulphate solution :
About 0.71g of AR grade zinc sulphate solid sample is weighed accurately in a clean, dry weighing bottle and transferred into a 250ml volumetric flask through a glass funnel. The substance is dissolved completely in a minimum amount of distilled water and the solution is made up to the mark. The solution is made homogeneous by thorough shaking in the stoppered volumetric flask. The particulars of the weights used are tabulated and the concentration of zinc sulphate is calculated using the given formula.
OBSERVATIONS:
S. No Contents in the pan grams milligrams Total weight(g)
1 W1
2 W2
CALCULATIONS:
W1 = Weight of weighing bottle with zinc sulphate = g
W2 = Weight of weighing bottle after transferring the zinc sulphate = g
Amount of the zinc sulphate transferred = W1–W2 = g
Concentration of the zinc sulphate= x = M
Gram molecular weight (GMW) of zinc sulphate = 287.54g
PART B – Standardization of EDTA solution:
Exactly 10ml of standard zinc sulphate solution is drawn with a pipette into a clean 250ml conical flask previously rinsed with distilled water. To this solution, 20ml of distilled water, 3ml of previously prepared ammonia buffer solution and a drop of EBT indicator solution are added. The contents of the flask are titrated with the supplied EDTA solution taken in a burette. The mixture in the conical flask is swirled throughout the titration till the end point is reached. The end-point of titration can be identified by the color change of the solution from wine red color to pale blue color. The pale blue color obtained at the end point in the white back drop of the porcelain tile and noting the initial and final burette readings marks the end of the titration. The titration is repeated as above until concurrent readings are obtained and all the observations are tabulated in the table given below.
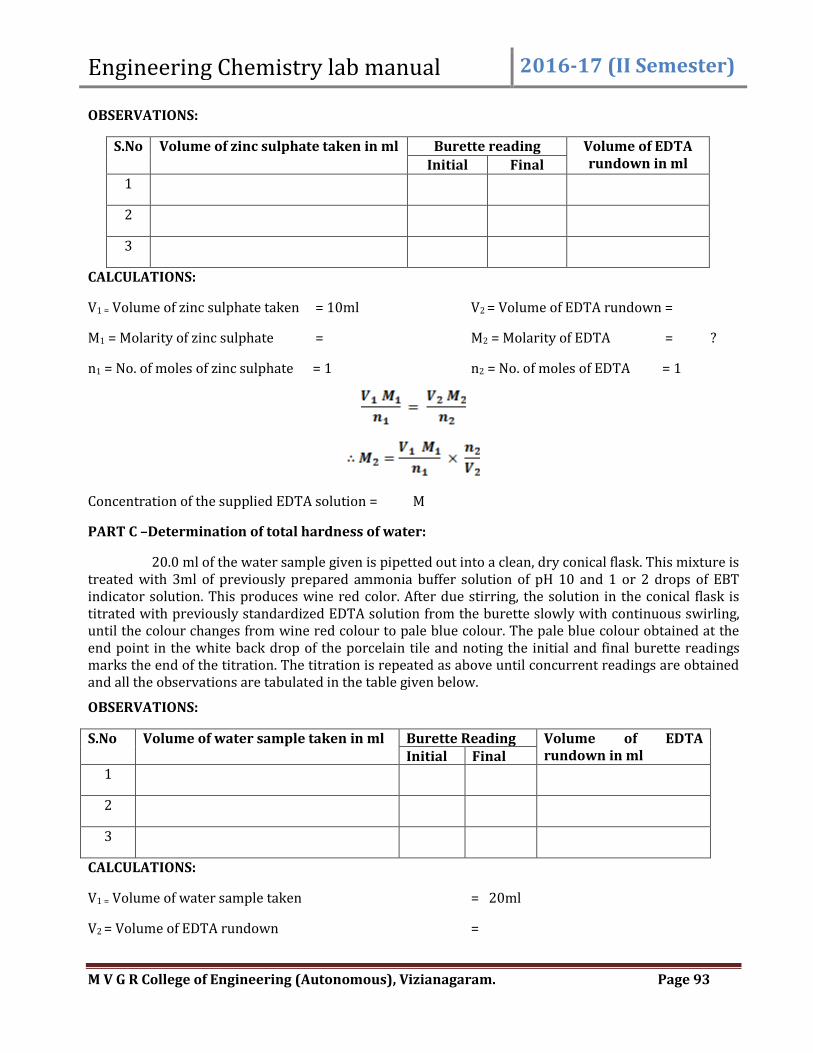
Engineering Chemistry lab manual 2016-17 (II Semester)
M V G R College of Engineering (Autonomous), Vizianagaram. Page 93
OBSERVATIONS:
S.No Volume of zinc sulphate taken in ml Burette reading Volume of EDTA rundown in ml Initial Final
1
2
3
CALCULATIONS:
V1 = Volume of zinc sulphate taken = 10ml V2 = Volume of EDTA rundown =
M1 = Molarity of zinc sulphate = M2 = Molarity of EDTA = ?
n1 = No. of moles of zinc sulphate = 1 n2 = No. of moles of EDTA = 1
Concentration of the supplied EDTA solution = M
PART C –Determination of total hardness of water:
20.0 ml of the water sample given is pipetted out into a clean, dry conical flask. This mixture is treated with 3ml of previously prepared ammonia buffer solution of pH 10 and 1 or 2 drops of EBT indicator solution. This produces wine red color. After due stirring, the solution in the conical flask is titrated with previously standardized EDTA solution from the burette slowly with continuous swirling, until the colour changes from wine red colour to pale blue colour. The pale blue colour obtained at the end point in the white back drop of the porcelain tile and noting the initial and final burette readings marks the end of the titration. The titration is repeated as above until concurrent readings are obtained and all the observations are tabulated in the table given below.
OBSERVATIONS:
S.No Volume of water sample taken in ml Burette Reading Volume of EDTA rundown in ml Initial Final
1
2
3
CALCULATIONS:
V1 = Volume of water sample taken = 20ml
V2 = Volume of EDTA rundown =

Engineering Chemistry lab manual 2016-17 (II Semester)
M V G R College of Engineering (Autonomous), Vizianagaram. Page 94
M1 = Concentration of Ca2+and Mg2+ in water sample = ?
M2 = Molarity of EDTA =
n1 = No. of moles of Ca2+ and Mg2+ = 1
n2 = No. of moles of EDTA = 1
Total hardness in CaCO3mg/lit is given by the formula:
Volume of EDTA X Conc. Of EDTA X100.1 X1000 Total hardness of water = ----------------------------------------------------- ppm Volume of water sample titrated
The total hardness the given water sample is ………………….. ppm
Determination of permanent hardness of water:
Procedure: Take 100ml of water sample in a 250ml beaker, heated the water sample to its boiling point until the volume of water sample is reduced to 20ml, then filter the water sample in to a 100ml volumetric flask and then makeup the solution up to the mark by the addition of distilled water.
20.0 ml of the water sample given is pipetted out into a clean, dry conical flask. This mixture is treated with 3ml of previously prepared ammonia buffer solution of pH 10 and 1 or 2 drops of EBT indicator solution. This produces wine red color. After due stirring, the solution in the conical flask is titrated with previously standardized EDTA solution from the burette slowly with continuous swirling, until the color changes from wine red color to pale blue color. The pale blue color obtained at the end point in the white back drop of the porcelain tile and noting the initial and final burette readings marks the end of the titration. The titration is repeated as above until concurrent readings are obtained and all the observations are tabulated in the table given below.
OBSERVATIONS:
S.No Volume of water sample taken in ml Burette Reading Volume of EDTA rundown in ml Initial Final
1
2
3
CALCULATIONS:
V1 = Volume of water sample taken = 20ml
V2 = Volume of EDTA rundown =
M1 = Concentration of Ca2+and Mg2+ in water sample = ?
M2 = Molarity of EDTA =

Engineering Chemistry lab manual 2016-17 (II Semester)
M V G R College of Engineering (Autonomous), Vizianagaram. Page 95
n1 = No. of moles of Ca2+ and Mg2+ = 1
n2 = No. of moles of EDTA = 1
Permanent hardness of water in CaCO3mg/lit is given by the formula:
Volume of EDTA X Conc. Of EDTA X100.1 X1000 Permanent hardness of water = ----------------------------------------------------- ppm Volume of water sample titrated
Permanent hardness of the given water sample is ………………….. ppm
Temporary hardness of water sample
Temporary hardness = Total hardness – permanent hardness
= ------------------- - ---------------------------
= ---------------------ppm
Determination of hardness due to calcium and hardness due to magnesium
a. Ca-Hardness: Take 20 ml of the sample and add 1 ml Sodium Hydroxide solution (8%) in it and add pinch of Mercurex Powder. Titrate with standard EDTA solution until the light pink color of solution converts into light blue color.
S.No Volume of water sample taken in ml
Burette Reading Volume of EDTA rundown in ml Initial Final
1
2
3
V1 = Volume of water sample taken = 20ml V2 = Volume of EDTA rundown = M1 = Concentration of Ca2+ in water sample = ? M2 = Molarity of EDTA = n1 = No. of moles of Ca2+ = 1 n2 = No. of moles of EDTA = 1
Ca- Hardness in CaCO3mg/lit is given by the formula:
Volume of EDTA x Conc. of EDTA x 100.1 x 1000

Engineering Chemistry lab manual 2016-17 (II Semester)
M V G R College of Engineering (Autonomous), Vizianagaram. Page 96
Ca- Hardness of water = ----------------------------------------------------- ppm Volume of water sample titrated
Hardness due to calcium = ………… ppm b. Mg-Hardness:
Mg-Hardness
Temporary hardness of water sample
Mg-Hardness = Total hardness (Ca+2 & Mg+2) – Ca-Hardness = ------------------- - ---------------------------
= ---------------------ppm
6. Determination of alkalinity of water sample PRINCIPLE: Alkalinity of water means the total content of those substances in it which causes an increased OH- ion concentration up on dissociation or due to hydrolysis. The alkalinity of water is attributed to the presence of (i) Caustic alkalinity (Due to OH- and CO32-) (ii) Temporary hardness (Due to HCO3-) Alkalinity is a measure of ability of water to neutralize the acids Determination of alkalinity: OH-, CO32- and HCO3- can be estimated separately by titration against standard acid using phenolphthalein and methyl orange as indicators The determination is based on the following reactions
(i) OH- + H+ → H2O
(ii) CO32- + H+ → HCO3-
(iii) HCO3- + H+ → H2O + CO2
The titration of water sample against a standard acid up to phenolphthalein end point (P) marks
the completion of reaction (i) and (ii) only. This amount of acid used thus corresponds to OH- plus one half of the normal CO3
2- present. On the other hand, titration of the water sample against a standard acid to methyl orange end point (M) marks the completion of reaction (i), (ii) and (iii) Hence the total amount of acid used represent the total alkalinity. The possible combination of ions causing alkalinity in water are:
1. OH- only, CO32- only, HCO3- only Or 2. OH- and CO32-, CO32- and HCO3- together 3. The possibility of OH- and HCO3- ions together is not possible since they combine
together to form CO32- ions. Thus, P = OH- + ½ CO32-
M = OH- + CO32- + HCO3
-

Engineering Chemistry lab manual 2016-17 (II Semester)
M V G R College of Engineering (Autonomous), Vizianagaram. Page 97
PROCEDURE: - 1. Pipette out 50 ml of water sample into a conical flask. Add 1-2 drops of Phenolphthalein indicator. 2. Titrate the water sample in conical flask with N/10 HCl till the pink colour just disappears. 3. Note down the reading and repeat to get concurrent readings. 4. Again take 20 ml of water sample in conical flask and add methyl orange indicator to it. 5. Titrate the water sample in conical flask with N/10 HCl till the yellow orange colour changes to orange red. 6. Note down the reading and repeat to get concurrent readings. OBSERVATION TABLES: - The table1 below shows the type and amount of alkalinity in water a) Using Phenolphthalein (Table 1) Normality of the acid used: N/10 S.No. Volume of the solution taken in
the titration flask(ml) Burette readings Volume of the
titrant used in ml Initial Reading Final Reading 1 Say V1ml =P
2 3
b) Using Methyl orange (Table 2) Normality of the acid used: N/10
S.No. Volume of the solution taken in the titration flask(ml)
Burette readings Volume of the titrant used in ml Initial Reading Final Reading
1 Say V2 ml= M
2 3
OBSERVATIONS AND CALCULATIONS: - Volume of the sample taken for each titration (V1) = 50 ml Volume of N/50 HCl used to Phenolphthalein end-point (V2) = ml Volume of N/50 HCl used to Methyl orange end-point (V3) = ml
Alkalinity of the given water sample is in ppm.

Engineering Chemistry lab manual 2016-17 (II Semester)
M V G R College of Engineering (Autonomous), Vizianagaram. Page 98
Result:
S.No Characteristic of water sample
Experimental value
BIS value Remarks
1 pH 6.5-8.5 2 Electrical
conductivity
3 Total hardness 200-600ppm 4 Hardness due to
Calcium 75-200ppm
5 TDS 500 -2000 ppm 6 Hardness due to
Megnisum 30-100ppm
7 Alkalinity 100-600 PRECAUTIONS: - 1. All glass wares should be properly washed. 2. Before use, rinse burette and pipette properly 3. Find the correct end point. Student report:

Engineering Chemistry lab manual 2016-17 (II Semester)
M V G R College of Engineering (Autonomous), Vizianagaram. Page 99
B U R E A U O F I N D I A N S T A N D A R D S May 2012 Indian Standard DRINKING WATER — SPECIFICATION
,
For the purpose of this standard the following definition shall apply.
Drinking Water — Drinking water is water intended for human consumption for drinking and cooking
purposes from any source. It includes water (treated or untreated) supplied by any means for human
consumption.
Drinking water shall comply with the requirements given in Tables 1 to 3.
Table 1. Physical Parameters
S.No Characteristic Requirement Method of Test,
(Acceptable Limit )
Permissible Limit in the absence of Alternate Source
Remarks
1 Colour 5 15 Extended to 15 only, if toxic substances are not suspected in absence of alternate sources
2
Odour
Agreeable
Agreeable a) Test cold and when heated
b) Test at several dilutions
3 pH value 6.5-8.5 No relaxation ------
4
Taste
Agreeable
Agreeable Test to be conducted only after safety has been established
5 Turbidity 1 5 ------ 6 Total dissolved
solids, mg/l 500 2000 ------
Table 2. General Parameters Concerning Substances Undesirable in Excessive Amounts
S.No Characteristic Requirement Method of Test,
(Acceptable Limit )
Permissible Limit in the absence of
Alternate Source
Remarks
1 Aluminium (as Al), mg/l, Max
0.03 0.2 ------
2 Ammonia (as total ammonia-N), mg/l, Max
0.5 No relaxation ------
3 Barium (as Ba), mg/l, Max 0.7 No relaxation ------ 4 Calcium (as Ca), mg/l, Max 75 200 ------ 5 Magnesium (as Mg), mg/l,
Max 30 100 ------
6 Chloride (as Cl), mg/l, Max 250 1000 ------ 7 Copper (as Cu), mg/l, Max 0.05 1.5 ------
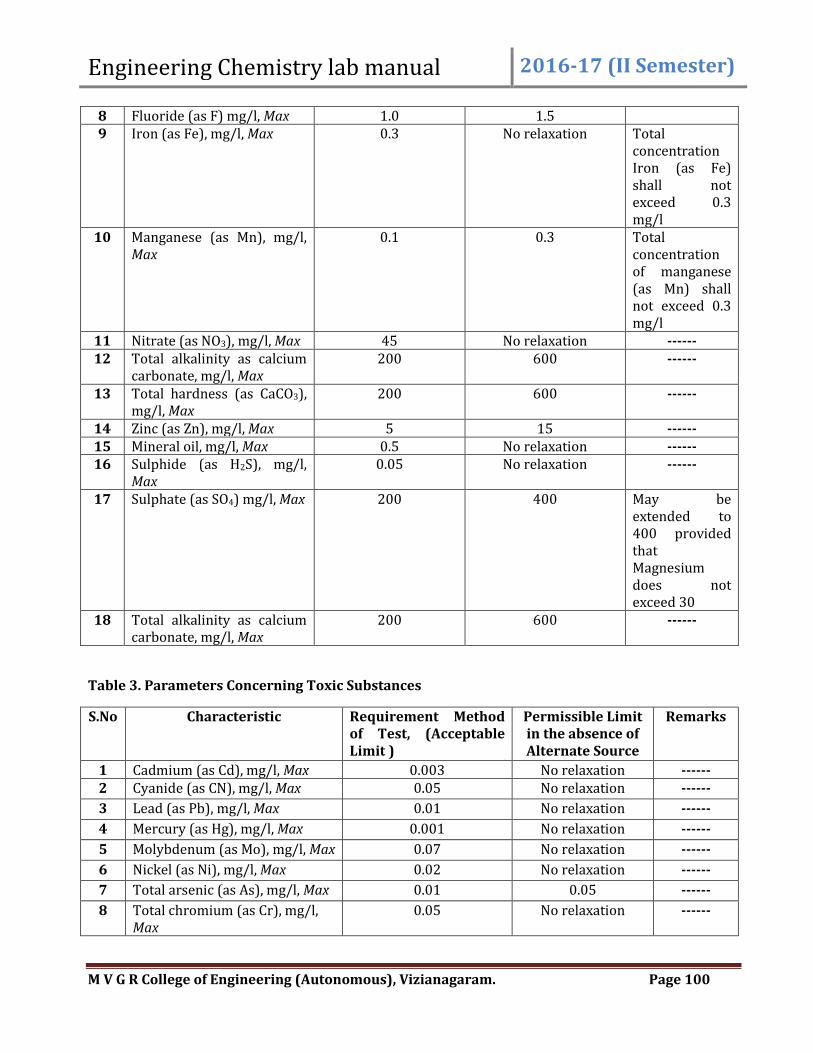
Engineering Chemistry lab manual 2016-17 (II Semester)
M V G R College of Engineering (Autonomous), Vizianagaram. Page 100
8 Fluoride (as F) mg/l, Max 1.0 1.5 9 Iron (as Fe), mg/l, Max 0.3 No relaxation Total
concentration Iron (as Fe) shall not exceed 0.3 mg/l
10 Manganese (as Mn), mg/l, Max
0.1 0.3 Total concentration of manganese (as Mn) shall not exceed 0.3 mg/l
11 Nitrate (as NO3), mg/l, Max 45 No relaxation ------ 12 Total alkalinity as calcium
carbonate, mg/l, Max 200 600 ------
13 Total hardness (as CaCO3), mg/l, Max
200 600 ------
14 Zinc (as Zn), mg/l, Max 5 15 ------ 15 Mineral oil, mg/l, Max 0.5 No relaxation ------ 16 Sulphide (as H2S), mg/l,
Max 0.05 No relaxation ------
17 Sulphate (as SO4) mg/l, Max 200 400 May be extended to 400 provided that Magnesium does not exceed 30
18 Total alkalinity as calcium carbonate, mg/l, Max
200 600 ------
Table 3. Parameters Concerning Toxic Substances
S.No Characteristic Requirement Method of Test, (Acceptable Limit )
,,,
Permissible Limit in the absence of Alternate Source
Remarks
1 Cadmium (as Cd), mg/l, Max 0.003 No relaxation ------ 2 Cyanide (as CN), mg/l, Max 0.05 No relaxation ------
3 Lead (as Pb), mg/l, Max 0.01 No relaxation ------
4 Mercury (as Hg), mg/l, Max 0.001 No relaxation ------
5 Molybdenum (as Mo), mg/l, Max 0.07 No relaxation ------
6 Nickel (as Ni), mg/l, Max 0.02 No relaxation ------
7 Total arsenic (as As), mg/l, Max 0.01 0.05 ------
8 Total chromium (as Cr), mg/l, Max
0.05 No relaxation ------
Engineering Chemistry lab manual 2016-17 (II Semester)
M V G R College of Engineering (Autonomous), Vizianagaram. Page 101
Student report The present experiment carried out infers the following observations:
1. The type of titration---------------------
2. It is a traditional(classical)/ instrumental method of determination
3. The experiment procedure followed in the current experiment requires preparation of
standard solutions, standardization of intermediate solution and determination of unknown.
4. Representation of the completeness of the reaction either by using an indicator or
identifying the equivalence point from the graph.
5. The equivalence point to be determined can be obtained by plotting a graph between --------
and ---------, where in the shape of the graph and the physical parameter being tested is
represented.
6. Calculation of concentration is carried out using the formula--------- and report the end
result.
7. The results reported is verified with respect to the given value.
8. The errors obtained and the result reported for further comparison with the values.
9. The skill and knowledge gained by carrying out the above experiment is observed to be the
requirement which can find its place in metallurgical, process industries and Research and
development labs.

M V G R College of Engineering (Autonomous), Vizianagaram. Page 1