engineering cost week4a
TRANSCRIPT

Engineering CostEngineering CostEvaluating a set of feasible alternatives requires that many costs be analyzed. Examplesinclude costs for initial investment, new construction, facility modification, general labor,parts and materials, inspection and quality, training , computer hardware and software, material handling, tooling, data management,and technical support, as well as general support costs (overhead).
Week 4Week 4Week 4Week 4

Types of CostTypes of Costss• Fixed Costs & Variable CostsFixed Costs & Variable Costs• Marginal Costs & Average CostsMarginal Costs & Average Costs• Sunk Costs & Opportunity CostsSunk Costs & Opportunity Costs• Recurring & Non-recurring CostsRecurring & Non-recurring Costs• Incremental CostsIncremental Costs• Cash Costs & Book CostsCash Costs & Book Costs• Life-Cycle CosLife-Cycle Coststs

Fixed Costs and Variable CostsFixed Costs and Variable Costs
• Fixed Costs: constant, independent of the output or activity level.– Property taxes, insurance– Management and administrative salaries– License fees, and interest costs on borrowed capital– Rental or lease
• Variable Costs: Proportional to the output or activity level. – Direct labor cost– Direct materials

Breakeven AnalysisBreakeven Analysis• Total Variable Cost = Unit Variable Cost * Quantity• Total Cost = Fixed Cost + Total Variable Cost• Total Revenue = Unit Selling Price * Quantity• Breakeven point: the output level at which total
revenue is equal to total cost. • Applications of Breakeven analysis:
Determining minimum production quantityForecast production profit / loss

Breakeven AnalysisBreakeven Analysis
Production Quantity
$
Break-even Point
Fixed Costs
Variable Costs
Total Costs
Total Revenue
Loss
Profit

Marginal Costs and Average CostsMarginal Costs and Average Costs
• Marginal Costs: the variable cost for one more unit of output– Capacity Planning: excess capacity– Basis for last-minute pricing
• Average Costs: total cost divided by the total number of units produced.– Basis for normal pricing

Sunk Costs & Opportunity CostsSunk Costs & Opportunity Costs
• Sunk Costs: Cost that has occurred in the past and has no relevance to estimates of future costs and revenues related to an alternative– Purchasing price of current equipment in
deciding new equipment (except for capital gain/loss consideration)
• Opportunity Costs: Cost of the foregone opportunity and is hidden or implied– Existing equipment in replacement analysis

Past (Sunk) Costs VS Past (Sunk) Costs VS Future (Opportunity) CostsFuture (Opportunity) Costs
• Sunk cost - money spent due to a past decision. We cannot do anything about these costs.– Purchase price paid for a car two years ago.
• Opportunity cost - a benefit that is foregone by engaging a resource in a chosen activity instead of engaging that same resource in some other activity. We make a choice or decision.– Buying lunch instead of DVD.

Which amount is the value at present?Which amount is the value at present?
ExampleExample
• A distributor of electric pumps must decide what to do with a "lot" of old electric pumps that was purchased 3 years ago.
• Soon after the distributor purchased the lot, technology advances were made.
• These advances made the old pumps less desirable to customers.
• The pumps are becoming more obsolescent as they sit in inventory.
• The pricing manager has the following information.

Which amount is the value at present?Example 3
Price when purchased 7,000.00$ Sunk cost Past decisionsStorage costs 1,000.00$ Sunk cost Past decisionsList price when purchased 9,500.00$ Old list Past decisionsCurrent list price of new pumps 12,000.00$ New list different features Past decisionsAmount offered for pumps 2 years ago 5,000.00$ Foregone opportunity Past decisionsCurrent price that the pumps could be sold for 3,000.00$ Market value Present opportunity

Recurring Costs and Non-recurring CostsRecurring Costs and Non-recurring Costs
• Recurring Costs: Repetitive and occur when a firm produces similar goods and services on a continuing basis– Office space rental
• Non-recurring Costs: Not repetitive, even though the total expenditure may be cumulative over a period of time– Typically involve developing or establishing a
capability or capacity to operate– Examples are purchase cost for real estate and
the construction costs of the plant

Incremental CostsIncremental Costs
• Incremental Costs: Difference in costs between two alternatives.– Suppose that A and B are mutually exclusive
alternatives. If A has an initial cost of $10,000 while B has an initial cost of $14,000, the incremental initial cost of (B - A) is $4,000.

Brain storming

Example Example Choosing between Model A & BChoosing between Model A & B
Cost Items Model A Model BIncremental
Cost
Purchase Price $10,000 $17,500 $7,500
Installation Costs 3,500 5,000 1,500
Annual Maintenance 2,500 750 -1,750
Annual Utility 1,200 2,000 800
Disposal Cost 700 500 -200
Which Plan you will prefer (A or B)?Which Plan you will prefer (A or B)?

We will prefer Model BWe will prefer Model BBecause the
Annual MaintenanceAnnual Maintenance and
Disposal cost Disposal cost of Model BModel B is less than Model AModel A

Life-Cycle CostsLife-Cycle Costs
• Life-Cycle Costs: Summation of all costs, both recurring and nonrecurring, related to a product, structure, system, or service during its life span.
• Life cycle begins with the identification of the economic needs or wants (the requirements) and ends with the retirement and disposal activities.

Example
A Blue RayBlue Ray tourist Company gathered the following data about a bus service for tourists.Fixed cost Variable costFixed cost Variable costBus Rental $80 Event ticket (per person) $12.50Gas Expense 75 Refreshment(per person) $7.5Other fuel 20Bus driver 50
Total fixed cost $225 Total variable cost 20$ per person

Total cost = $225 + $ 20 (per person)Now to calculate total cost for any number of people:Let number of people are = xVariable Cost x number of people = 20xNow total cost = $225 + 20xIf the ticket is raised to $35 If no of people = xThe total revenue will be = 35 xTo find at least howexpenses many people(x=?) will be needed in order to just cover?

Total cost =Total revenue$225 + 20 x = 35 x225 = 35 x – 20 x225 = 15 x15 x = 225X = 225/15
X= 15 (this is called break even point)
So in $35 ticket per person , at least 15 people will be needed to cover the expenses.

ExampleExample
X# of Customers15
Fixed Costs= $225
Variable Costs= 20X
Total Costs= $225 + 20X
Total Revenue= 35X
Loss
Profit
$1000
$800
$600
$400
$200
$0105 20 25

X# of Customers15
Fixed Costs= $225
Variable Costs= 20X
Total Costs= $225 + 20X
Total Revenue= 35X
Loss
Profit
$1000
$800
$600
$400
$200
$0105 20 25
The level of business activity at which the total costs to providethe product, good, or service are equal to the revenue (or savings) generated by providing the service. This is the level at which one "just breaks even."
BreakevenBreakevenPointPointBreakevenBreakevenPointPoint

ProfitProfit region
X# of Customers15
Fixed Costs= $225
Variable Costs= 20X
Total Costs= $225 + 20X
Total Revenue= 35X
Loss
Profit
$1000
$800
$600
$400
$200
$0105 20 25
The output level of the variable x greater than the breakeven point, wheretotal revenue is greater than total costs.

LossLoss region
X# of Customers15
Fixed Costs= $225
Variable Costs= 20X
Total Costs= $225 + 20X
Total Revenue= 35X
Loss
Profit
$1000
$800
$600
$400
$200
$0105 20 25
The output level of the variable x less than the breakeven point, wheretotal costs are greater than total revenue.

Cash Costs vs. Book CostCash Costs vs. Book Costs
• Cash costs - movement of money from one owner to another - also known as a cash flow.– Payment this month on an auto loan.
• Book cost - cost of a past transaction that is recorded in an accounting book.– Down payment recorded in your checkbook
from last years automobile purchase.

COST ESTIMATINGCOST ESTIMATINGEngineering economic analysis focuses on the future consequences of current decisions.Because these consequences are in the future, usually they must be estimated and cannotbe known with certainty. Examples of the estimates that may be needed in engineeringeconomic analysis include purchase costs, annual revenue, yearly maintenance, interest ratesfor investments, annual labor and insurance costs, equipment salvage values, and tax rates.

Why to Estimate Cost?Why to Estimate Cost?Estimating is the foundation of economic analysis. As is the case in any analysis procedure, the outcome is only as good as the quality of the numbers used to reach the decision. For example, a person who wants to estimate her federal income taxes for a given year could do a very detailed analysis, including social security deductions, retirement savings deductions, itemized personal deductions, exemption calculations, and estimates of likely changes to the tax code.

Types of EstimatTypes of EstimateeRough estimates:Rough estimates:Rough estimates are estimates with little detail or accuracy. These estimates require minimum resources to develop, and their accuracy is generally
-30% to +60%.-30% to +60%.
Semi detailed estimates:Semi detailed estimates:The are used for budgeting purposes at a project's conceptual or preliminary design stages. These estimates are more detailed, and they require additional time and resources to develop. Greater sophistication is used in developingSemi detailed estimates than the rough-order type, and their accuracy is generally
-15 to +20%.-15 to +20%.
Detailed estimates: Detailed estimates: The are used during a project‘s detailed design.These estimates are made from detailed quantitative models, blueprints, productspecification sheets, and vendor quotes. Detailed estimates involve the most timeand resources to develop and thus are much more accurate than rough or semi detailed
estimates. The accuracy of these estimates is
generally -3 to +5%.-3 to +5%.
Estimating BenefitsEstimating Benefits• So far we have focused on cost terms and cost
estimating. • However, engineering economists must often also
estimate benefits. • Example benefits include sales of products, revenues
from bridge tolls and electric power sales, cost reductions from reduced material or labor costs, reduced time spent in traffic jams, and reduced risk of flooding.
• These benefits are the reasons that many engineering projects are undertaken.
• The cost concepts and cost estimating models can also be applied to economic benefits.

ProblemProblem
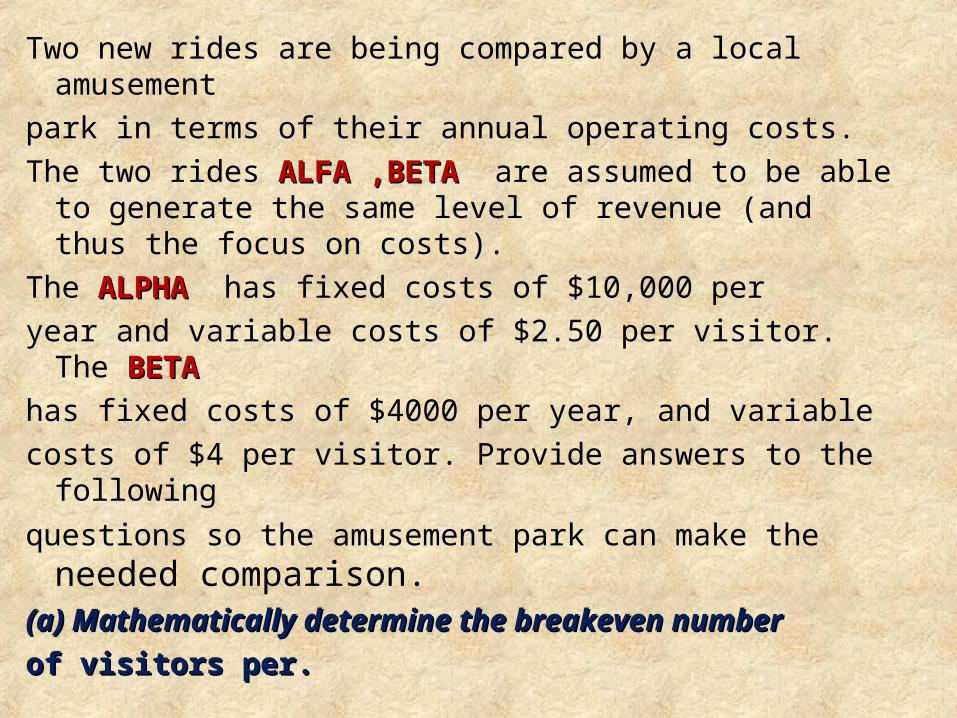
Two new rides are being compared by a local amusementpark in terms of their annual operating costs.The two rides ALFA ,BETA ALFA ,BETA are assumed to be able to
generate the same level of revenue (and thus the focus on costs).
The ALPHAALPHA has fixed costs of $10,000 peryear and variable costs of $2.50 per visitor. The BETABETAhas fixed costs of $4000 per year, and variablecosts of $4 per visitor. Provide answers to the following
questions so the amusement park can make the needed comparison.
(a) Mathematically determine the breakeven number(a) Mathematically determine the breakeven numberof visitors per.of visitors per.

SolutionSolution : : (a) x = number of visitors per year
Break-even when: Total Costs (Alpha) = Total Costs (Beta)$10,000 + $2.5 x = $4,000 + $4.00 xx = 400 visitors is the break-even quantity
X Y1 (Tug) Y2 (Buzz)
0 10,000 4,000
4,000 20,000 20,000
8,000 30,000 36,000
(b) See the figure below:
