engineering failure analysis -...
TRANSCRIPT

Engineering Failure Analysis xxx (2015) xxx–xxx
EFA-02805; No of Pages 13
Contents lists available at ScienceDirect
Engineering Failure Analysis
j ourna l homepage: www.e lsev ie r .com/ locate /engfa i lana l
A global model for corrosion-induced cracking in prestressedconcrete structures
Lizhao Dai, Lei Wang ⁎, Jianren Zhang, Xuhui ZhangSchool of Civil Engineering & Architecture, Changsha University of Science & Technology, Changsha, Hunan 410114, China
a r t i c l e i n f o
⁎ Corresponding author.E-mail address: [email protected] (L. Wang).
http://dx.doi.org/10.1016/j.engfailanal.2016.01.0131350-6307/© 2015 Elsevier Ltd. All rights reserved.
Please cite this article as: L. Dai, et al., A globing Failure Analysis (2015), http://dx.doi.o
a b s t r a c t
Article history:Received 26 October 2015Received in revised form 15 January 2016Accepted 23 January 2016Available online xxxx
A global model is proposed in this study to predict prestressed concrete (PC) cracking inducedby strand corrosion. The proposed model considers the three stages: micro-crack formations,cover cracking initiation, and crack width growth. The prestress and geometric properties ofthe strand have been incorporated into the prediction. Six PC beams were designed and accel-erated toward corrosion-induced cracking. Observing the strands supported visual evidence ofpitting corrosion and crevice corrosion. The effects of corrosion-induced crack on the failure ofbeams are analyzed. The proposed model is verified by the experimental results and this workpresents the effects of parameters on corrosion-induced cracking. The results show that pre-stress has an adverse effect on corrosion-induced cracking. Prestress leads to a decrease inthe critical corrosion loss at the three stages. This decrement becomes more noticeable with in-creasing cover and decreasing concrete tensile strength, but shows no remarkable changeswith an increasing strand diameter and rust expansion ratio.
© 2015 Elsevier Ltd. All rights reserved.
Keywords:Prestressed concreteStrandCorrosionCorrosion-induced crackingPrestress
1. Introduction
Chloride-induced steel corrosion has been identified as one of the most prevalent deterioration factors in concrete structures[1,2]. Over recent years, deterioration caused by strand corrosion has been also found in some existing prestressed concrete (PC)structures. Strands subjected to high stress are more prone to corrosion than ordinary steel [3,4]. Practical experience and exper-imental observations suggest that corrosion-affected structures deteriorate faster in serviceability (e.g., cracking) than safety(e.g., strength) [5–7]. The failure of the Ynysygwas bridge in Port Talbot and the Saint Stefano bridge in Sicily were induced bystrand corrosion [8,9]. Strands usually have a large diameter and any corrosion may induce the concrete cracking. Thiscorrosion-induced cracking is harmful for PC structures and can provide a channel for harmful substances into those structures,accelerating the strand's corrosion rate. In addition, concrete cracking degrades the stiffness and capacity of structures [10–12].Corrosion-induced cracking is a key element in evaluating the normal serviceable failure of PC structures.
Very few works have reported on corrosion-induced cracking of PC structures. However, a considerable number of studieshave been undertaken on corrosion-induced cracking of reinforced concrete (RC) structures. These studies can be divided intothe three categories: empirical models, numerical models, and analytical models [13,14]. In the experimental investigations, thespecimens were deteriorated by artificial corrosion or natural corrosion [13,15–18]. Some empirical models were developedwith a regression analysis of experimental data and observations. Unfortunately, one of the primary disadvantages of empiricalmodels is that only the selected variables are investigated. Consequently, these models may make it difficult when consideringall parameters. In the numerical models, the continuum is divided into a finite number of individual elements. The system's
al model for corrosion-induced cracking in prestressed concrete structures, Engineer-rg/10.1016/j.engfailanal.2016.01.013

2 L. Dai et al. / Engineering Failure Analysis xxx (2015) xxx–xxx
solution is found in an assembly of its individual elements [1,10,19–21]. The numerical models are strictly relevant to the object.Validating the accuracy of numerical models is a complex matter. The analytical models are primarily based on the concepts ofsolid mechanics [14,15,22,23]. Concrete is considered to be a thick-walled cylinder. The expansive pressure is typically simulatedas the cyclic stress state with uniform corrosion. The high stress level and geometric properties of the strands may modify theconcrete cracking process. The corrosion-induced cracking process in PC structures may be different from RC structures. Thisstudy's purpose is to establish a global model of corrosion-induced cracking in PC structures.
The high stress levels in strands accelerate the corrosion process of PC structures [24,25]. Concrete around the strand suffersunder a biaxial stress state during the corrosion process: transverse expansive pressure, and compressive stress due to the pre-stress force in a longitudinal direction. Additionally, a strand consists of several outer wires spiraled around a core wire andhas a flower-like cross-section [26]. Determining the area loss and the contact area with concrete of a corroded strand is a com-plex process. The above factors would be considered in the corrosion-induced cracking model of PC structures. For reinforced con-crete structures, the three-stage model has been widely accepted when describing the corrosion-induced cracking process: thefree expansion of corrosion products, the stress initiation in concrete, and the cover cracking [15,16,27,28]. The concrete's porositydetermines the free expansion of corrosion products. The corrosion loss at this stage is usually small; therefore, in the presentstudy the free expansion of corrosion products and the stress initiation in the concrete stage combined in the micro-crack forma-tion stage. Crack width is the direct data of corrosion-induced cracking. A formula to calculate the crack width should be includedin the prediction. The corrosion-induced cracking of PC structures has been divided into the three stages: micro-crack formations,cover cracking initiation, and crack width growth.
The objective of this study is to propose a global model for corrosion-induced cracking of PC structures. The study has beenorganized as follows. First, a global model for the corrosion-induced cracking of PC structures was derived. The proposedmodel considers the three cracking stages: micro-crack formations, cover cracking initiation, and crack width growth. Next,using accelerated corrosion, six PC beams were designed to different strand corrosion degrees. The crack widths on the concretesurface were observed. The proposed model has been verified with experimental results. Following this, the effects of parameterson corrosion-induced cracking are discussed, such as prestress, cover, concrete tensile strength, strand diameter and rust expan-sion ratio. Finally, several conclusions have been drawn based on the proposed study and are presented in the final section.
2. Critical corrosion loss at the micro-crack formation stage
Corrosion products create expansive stress at the strand-concrete interface. The micro-crack forms when the tangential stressreaches the concrete tensile strength. The critical corrosion loss at the micro-crack formation stage can be determined accordingto the radial deformation at the strand-concrete interface. In prestressed concrete structures, concrete is restrained by expansivepressure and prestress during the corrosion process. In addition, the strand consists of several outer wires spiraled around a corewire; the area loss of the strand after corrosion should be considered in relation to the geometric properties of strand. The pro-posed model in this section focuses on the two factors.
Since concrete is a heterogeneous material, a porous zone surrounds the strand-concrete interface. Corrosion products first dif-fused into the porous zone. As corrosion products exceed the quantity needed to fill the porous zone, these products generateexpansive pressure. Fig. 1 shows the stress distribution around the strand-concrete interface.
Fig. 1. Stress distribution around the strand-concrete interface.
Please cite this article as: L. Dai, et al., A global model for corrosion-induced cracking in prestressed concrete structures, Engineer-ing Failure Analysis (2015), http://dx.doi.org/10.1016/j.engfailanal.2016.01.013

3L. Dai et al. / Engineering Failure Analysis xxx (2015) xxx–xxx
As Fig.1 shows, concrete in the corrosion process is under the biaxial stress state: tensile stress, σt, generated by expansivepressure, and compressive stress, σp, created by prestress. The compressive stress of the concrete at the location of strand, σp,can be determined from:
Pleasing F
σp ¼ Np
Aþ Npe
2p
Ið1Þ
where Np is the prestressing force of the strand, A is the cross-sectional area of the concrete, I is the inertia moment of the crosssection, ep is the eccentricity of the strand.
The expansive pressure at the end of the micro-crack, Qe, can be obtained with the stress distribution principle:
Qe ¼4R0Qe
ð2Þ
where R0 is the radius of the wire before corrosion, Q is the expansive pressure at the strand-concrete interface, e is the lengthfrom the end of the micro-crack to the center of the strand.
Concrete is modeled as a thick-walled cylinder. The tangential stress, σt, can be obtained with an elastic mechanics axisymmet-ric stress solution:
σ t ¼C þ 3R0ð Þ2 þ e2
h iC þ 3R0ð Þ2−e2� Qe ð3Þ
where C is the cover.The biaxial stress state of the concrete can be expressed as [29]
σp
f ck¼ 1
1þ KSð4Þ
where K = σt/σp;S = fck/ftk,fck is the concrete compressive strength, ftk is the concrete tensile strength.The expansive pressure can be expressed by substituting Eqs. (1)-(3) into Eq.(4). The length from the end of the micro-crack
to the center of the strand, e, can be obtained using the derivation of function, e = 0.486(C + 3R0). Thus, the maximum expansivepressure can be written as:
Q ¼ 0:225þ 0:075CR0
� � f ck−σp
� �f tk
f ckð5Þ
A seven-wire steel strand was used in this study's analysis. Six outer wires were in contact with the surrounding concrete. Thecontact area of the outer wire is equal to two-thirds of the surface area, as shown in Fig.2.
Fig. 2. Radial deformation at the strand-concrete interface.
e cite this article as: L. Dai, et al., A global model for corrosion-induced cracking in prestressed concrete structures, Engineer-ailure Analysis (2015), http://dx.doi.org/10.1016/j.engfailanal.2016.01.013

Fig. 3. Schematic of cover cracking.
4 L. Dai et al. / Engineering Failure Analysis xxx (2015) xxx–xxx
Considering the geometric relationship, the relationship of R0, Rc, and Rρ can be written as:
Pleasing F
Rc ¼ffiffiffiffiffiffiffiffiffiffiffiffiffiffiffiffiffiffiffiffiffiffiffiffiffiffiffiffiffiffiffiffiffiffiffiffiffiR20 þ
n−1ð ÞAp
4πρm
sð6Þ
Rρ ¼ffiffiffiffiffiffiffiffiffiffiffiffiffiffiffiffiffiffiffiffiffiffiffiR20−
Ap
4πρm
sð7Þ
where Rc is the radius of the wire with the free-expansion corrosion products, Rρ is the residual radius of the wire after cor-rosion, Ap is the cross-sectional area of the strand, ρm is the critical corrosion loss of the strand at the micro-crack formation stage,n is the volume ratio between corrosion products and the strand, which is referred to as the rust expansion ratio.
As Fig.2 shows, the radial deformation of concrete and corrosion products at the strand-concrete interface is Δ1 and Δ2, respec-tively. The expansive pressure at the strand-concrete interface is Q. The expansive pressure at the concrete surface is zero. Theradial displacement at the location of Rρ is zero.
With the stress distribution in the axial symmetrical structure, the radial deformation of the concrete is:
Δ1 ¼ M1Q ð8Þ
where M1 ¼ R0Ec½ð1þ vcÞ þ 2R2
0Cð2R0þCÞ�, Ec and νc are the elastic modulus and Poisson's ratio of concrete.
The radial deformation of corrosion products can be obtained using the stress distribution and the displacement boundary con-dition:
Δ2 ¼ M2Q ð9Þ
where M2 ¼ nð1−v2r ÞRc
Erf½ð1þvrÞn−2�þ8πR20
.Apρm
g, Er and νr are the elastic modulus and Poisson's ratio of corrosion products.
The radial deformation at the strand-concrete interface satisfies the deformation coordination relationship, R0 + Δ1 = Rc-Δ2.
By this relationship, the expansive pressure can be computed as:Q ¼ Rc−R0
M1 þM2ð10Þ
Combining Eqs. (5), (6) and (10), the radius of the wire with the free-expansion corrosion products, Rc, can be written as:
a1R3c þ a2R
2c þ a3Rc þ a4 ¼ 0 ð11Þ
wherea1 ¼ N2−t1; a2 ¼ N1N3 þ R0t1; a3 ¼ R2
0t1−t2−R20N2; a4 ¼ 2ðn−1ÞR2
0N1 þ R0t2−R20N1N3−R3
0t1;
N1 ¼ R0Ec½ð1þ vcÞ þ 2R2
0Cð2R0þCÞ�;N2 ¼ nð1−v2r Þ
Er;N3 ¼ ð1þ vrÞn−2; t1 ¼ N3
ð0:225þ0:075 CR0Þð f ck−σp Þ f tk
f ck
; t2 ¼ 2ðn−1ÞR20
ð0:225þ0:075 CR0Þð f ck−σp Þ f tk
f ck
e cite this article as: L. Dai, et al., A global model for corrosion-induced cracking in prestressed concrete structures, Engineer-ailure Analysis (2015), http://dx.doi.org/10.1016/j.engfailanal.2016.01.013

Fig. 4. Schematic of crack width growth.
5L. Dai et al. / Engineering Failure Analysis xxx (2015) xxx–xxx
The radius of the wire with free-expansion corrosion products, Rc, can be obtained from Eq. (11). The critical corrosion loss andradial loss at the micro-crack formation stage (ρm and δm) can be determined with Rc.
3. Critical corrosion loss at the cover cracking initiation stage
After the micro-crack formation, corrosion products accumulate around the strand, generating expansive pressure and leadingto cover cracking. Assuming the internal cracks as a triangle and taking into consideration the filling extent of corrosion products,the critical corrosion loss at the cover cracking initiation stage can be computed.
The radial loss is δm, the radial increment of corrosion products at the strand-concrete interface is (n-1)δm. The sum of thecrack widths are the same as the increase of the external perimeter of corrosion products [21]. The sum of the crack widths atthe strand-concrete interface can be computed as:
Pleasing F
∑wi ¼ 6� 23� 2π n−1ð Þδm
� �¼ 8π n−1ð Þδm ð12Þ
where wi is the crack width at the strand-concrete interface.Fig. 3 shows the schematic diagram of cover cracking. The total volume of internal cracks, Vc, can be calculated by assuming
the shape of internal cracks form a triangle and the length of each crack extends to the concrete surface, Vc ¼ 12∑wiC.
Corrosion products fill the crack space at the cover cracking stage. The filling extent of the corrosion products depends on thecorrosion rate. Lu et al. [18] introduced a modified coefficient, k1, to consider the filling extent of corrosion products before covercracking. With regard to the filling extent of the corrosion products, the critical radial loss at the cover cracking initiation stage, δp,can be written as:
δp ¼ k1 R0−
ffiffiffiffiffiffiffiffiffiffiffiffiffiffiffiffiffiffiffiffiffiffiffiffiffiffiffiffiffiffiR20−
Vc
4π n−1ð Þ
s !ð13Þ
Fig. 5. Details of the beam (Unit: mm).
e cite this article as: L. Dai, et al., A global model for corrosion-induced cracking in prestressed concrete structures, Engineer-ailure Analysis (2015), http://dx.doi.org/10.1016/j.engfailanal.2016.01.013

Fig. 6. Accelerated corrosion test of beams.
6 L. Dai et al. / Engineering Failure Analysis xxx (2015) xxx–xxx
With this geometric relationship, the relationship of the critical corrosion loss and radial loss at the cover cracking initiationstage can be expressed as:
Pleasing F
ρp ¼4� πR2
0−π R0−δp� �2� �
Apð14Þ
where ρp is the critical corrosion loss at the cover cracking initiation stage.Combining Eqs. (12)-(14) allows for the computation of the critical corrosion loss at the cover cracking initiation stage.
4. Critical corrosion loss at the crack width growth stage
With further increase of the corrosion degree, the visible crack propagates to the concrete surface. The visible crack usuallygrows from a triangular shape to that of a rectangle after cover cracking. With consideration to the filling extent of corrosionproducts, the critical corrosion loss at the crack width growth stage can be obtained based on the geometric relationship.
Fig. 4 shows the growth of the crack width in the radial direction. Corrosion products partly fill in the cracks. A modified co-efficient, k2, was introduced to describe the filling extent of corrosion products after cover cracking. The relationship betweencrack width, w, and the critical radial loss at the crack width growth stage, δw, is:
k2 ∑wC−Vcð Þ ¼ 4 n−1ð Þ πR20−π R0−δwð Þ2
h ið15Þ
Fig. 7. Crack width along beam length: C = 67.4 mm.
e cite this article as: L. Dai, et al., A global model for corrosion-induced cracking in prestressed concrete structures, Engineer-ailure Analysis (2015), http://dx.doi.org/10.1016/j.engfailanal.2016.01.013

Fig. 8. Crack width along beam length: C = 52.4 mm.
7L. Dai et al. / Engineering Failure Analysis xxx (2015) xxx–xxx
As mentioned above, the relationship between the critical corrosion loss and radial loss at the crack width growth stage can bewritten as:
Table 1Corrosio
Beam
AverMaximAver
Maxim
Pleasing F
ρw ¼4� πR2
0−π R0−δwð Þ2h i
Apð16Þ
where ρw is the critical corrosion loss at the crack width growth stage.By substituting Eq. (15) into Eq. (16), the relationship of ρw and w can be expressed as:
ρw ¼ k2 ∑wC−Vcð Þn−1ð ÞAp
ð17Þ
The critical corrosion loss at the crack width growth stage can be computed using the above analysis.In some existing structures, crack widths on the concrete surface can be measured easily. The corrosion loss of strand can be
predicted using crack width.
5. Model verification
To verify the proposed model, six post-tensioned concrete beams were designed with a rectangular cross-section of b × h =150 × 220 mm, 2000 mm length. The specimen was reinforced with a seven-wire steel strand with an ultimate strength, fp, of1910 MPa. The yield strength of strand was 1830 MPa and nominal diameter was 15.2 mm. The prestress of the strand was0.75 fp. A 32 mm diameter duct was reserved inside each beam during casting in the laboratory to ensure the strand's arrange-ment. Two plain bars of R235 with an 8 mm diameter were at the bottom of beam. Two deformed bars of HRB335 with a12 mm diameter were on the top of beam. The stirrups were 8 mm diameter plain bars with 100 mm spacing in the beam.The 28-day compressive strength of concrete was 31.8 MPa. The covers on the side of beam and on the bottom of beam were67.4 mm and 52.4 mm, respectively. The details of the specimen are shown in Fig.5.
The artificial accelerated corrosion test was employed to obtain various corrosion degrees of the strand in PC beams. To clarify the ef-fect of strand corrosion on the corrosion-induced cracking alone, the steel reinforcement was protectedwith epoxy resin so it would not
n-induced cracks of beams.
s B1 CB4 CB5 CB2 CB3 CB1
Average mass loss (%) 0.00 2.95 5.39 9.25 12.33 14.73age crack width (mm): C = 67.4 mm 0.00 0.10 0.22 0.42 0.50 0.63um crack width (mm): C = 67.4 mm 0.00 0.20 0.38 0.60 0.70 0.90
age crack width (mm): C = 52.4 mm 0.00 0.14 0.29 0.45 0.61 0.77um crack width (mm): C = 52.4 mm 0.00 0.24 0.38 0.70 0.88 1.00
e cite this article as: L. Dai, et al., A global model for corrosion-induced cracking in prestressed concrete structures, Engineer-ailure Analysis (2015), http://dx.doi.org/10.1016/j.engfailanal.2016.01.013
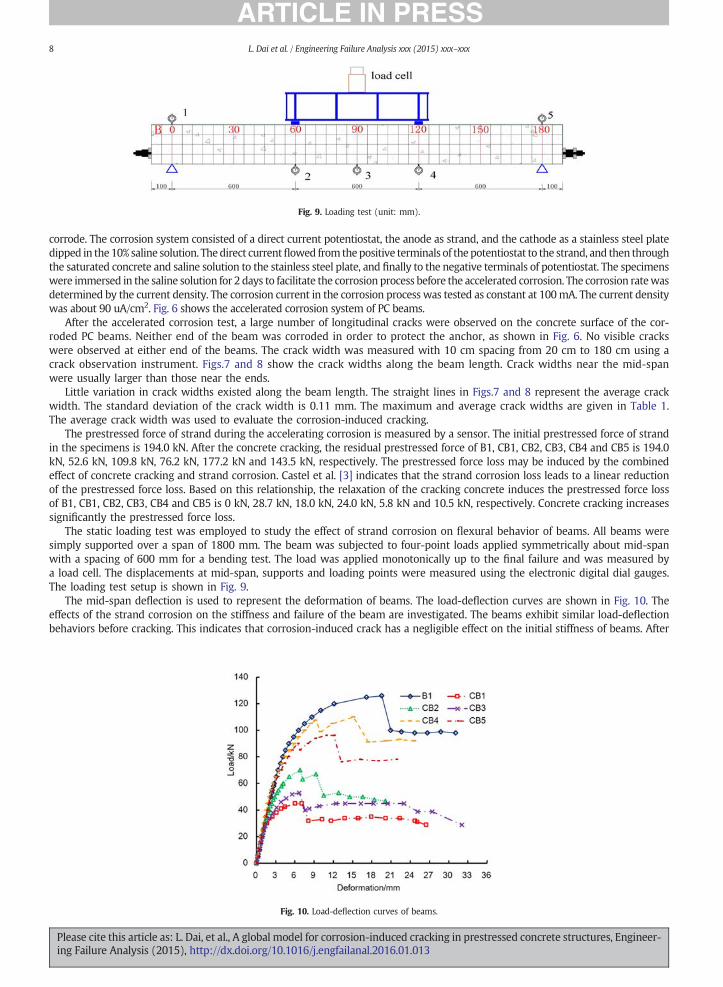
Fig. 9. Loading test (unit: mm).
8 L. Dai et al. / Engineering Failure Analysis xxx (2015) xxx–xxx
corrode. The corrosion system consisted of a direct current potentiostat, the anode as strand, and the cathode as a stainless steel platedipped in the10% saline solution. Thedirect currentflowed from thepositive terminals of thepotentiostat to the strand, and then throughthe saturated concrete and saline solution to the stainless steel plate, and finally to the negative terminals of potentiostat. The specimenswere immersed in the saline solution for 2 days to facilitate the corrosion process before the accelerated corrosion. The corrosion ratewasdetermined by the current density. The corrosion current in the corrosion process was tested as constant at 100mA. The current densitywas about 90 uA/cm2. Fig. 6 shows the accelerated corrosion system of PC beams.
After the accelerated corrosion test, a large number of longitudinal cracks were observed on the concrete surface of the cor-roded PC beams. Neither end of the beam was corroded in order to protect the anchor, as shown in Fig. 6. No visible crackswere observed at either end of the beams. The crack width was measured with 10 cm spacing from 20 cm to 180 cm using acrack observation instrument. Figs.7 and 8 show the crack widths along the beam length. Crack widths near the mid-spanwere usually larger than those near the ends.
Little variation in crack widths existed along the beam length. The straight lines in Figs.7 and 8 represent the average crackwidth. The standard deviation of the crack width is 0.11 mm. The maximum and average crack widths are given in Table 1.The average crack width was used to evaluate the corrosion-induced cracking.
The prestressed force of strand during the accelerating corrosion is measured by a sensor. The initial prestressed force of strandin the specimens is 194.0 kN. After the concrete cracking, the residual prestressed force of B1, CB1, CB2, CB3, CB4 and CB5 is 194.0kN, 52.6 kN, 109.8 kN, 76.2 kN, 177.2 kN and 143.5 kN, respectively. The prestressed force loss may be induced by the combinedeffect of concrete cracking and strand corrosion. Castel et al. [3] indicates that the strand corrosion loss leads to a linear reductionof the prestressed force loss. Based on this relationship, the relaxation of the cracking concrete induces the prestressed force lossof B1, CB1, CB2, CB3, CB4 and CB5 is 0 kN, 28.7 kN, 18.0 kN, 24.0 kN, 5.8 kN and 10.5 kN, respectively. Concrete cracking increasessignificantly the prestressed force loss.
The static loading test was employed to study the effect of strand corrosion on flexural behavior of beams. All beams weresimply supported over a span of 1800 mm. The beam was subjected to four-point loads applied symmetrically about mid-spanwith a spacing of 600 mm for a bending test. The load was applied monotonically up to the final failure and was measured bya load cell. The displacements at mid-span, supports and loading points were measured using the electronic digital dial gauges.The loading test setup is shown in Fig. 9.
The mid-span deflection is used to represent the deformation of beams. The load-deflection curves are shown in Fig. 10. Theeffects of the strand corrosion on the stiffness and failure of the beam are investigated. The beams exhibit similar load-deflectionbehaviors before cracking. This indicates that corrosion-induced crack has a negligible effect on the initial stiffness of beams. After
Fig. 10. Load-deflection curves of beams.
Please cite this article as: L. Dai, et al., A global model for corrosion-induced cracking in prestressed concrete structures, Engineer-ing Failure Analysis (2015), http://dx.doi.org/10.1016/j.engfailanal.2016.01.013
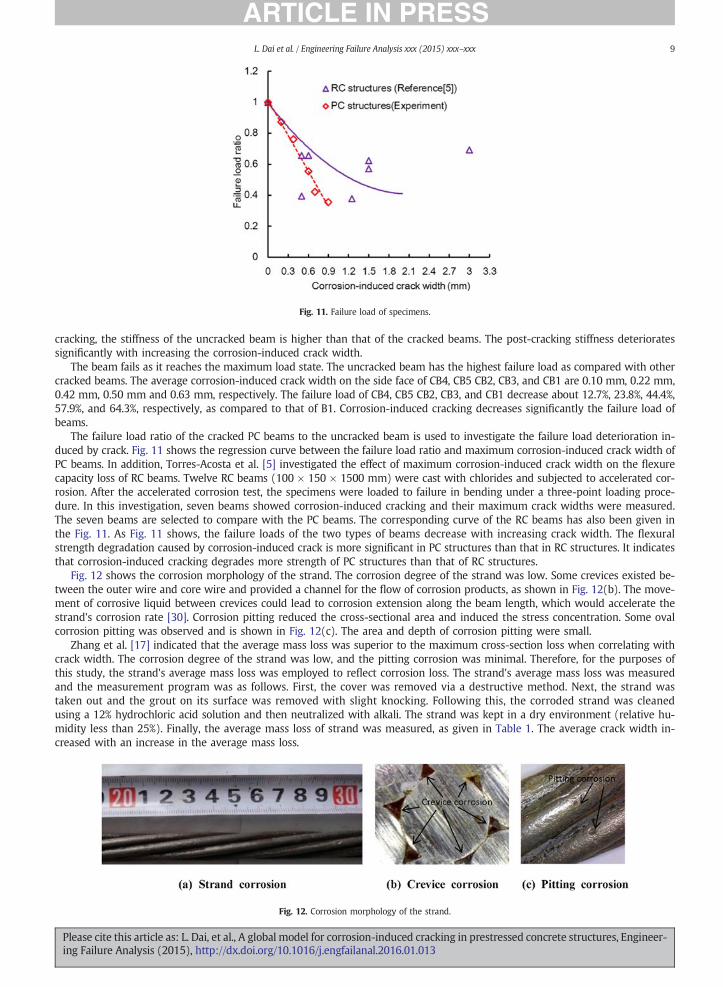
Fig. 11. Failure load of specimens.
9L. Dai et al. / Engineering Failure Analysis xxx (2015) xxx–xxx
cracking, the stiffness of the uncracked beam is higher than that of the cracked beams. The post-cracking stiffness deterioratessignificantly with increasing the corrosion-induced crack width.
The beam fails as it reaches the maximum load state. The uncracked beam has the highest failure load as compared with othercracked beams. The average corrosion-induced crack width on the side face of CB4, CB5 CB2, CB3, and CB1 are 0.10 mm, 0.22 mm,0.42 mm, 0.50 mm and 0.63 mm, respectively. The failure load of CB4, CB5 CB2, CB3, and CB1 decrease about 12.7%, 23.8%, 44.4%,57.9%, and 64.3%, respectively, as compared to that of B1. Corrosion-induced cracking decreases significantly the failure load ofbeams.
The failure load ratio of the cracked PC beams to the uncracked beam is used to investigate the failure load deterioration in-duced by crack. Fig. 11 shows the regression curve between the failure load ratio and maximum corrosion-induced crack width ofPC beams. In addition, Torres-Acosta et al. [5] investigated the effect of maximum corrosion-induced crack width on the flexurecapacity loss of RC beams. Twelve RC beams (100 × 150 × 1500 mm) were cast with chlorides and subjected to accelerated cor-rosion. After the accelerated corrosion test, the specimens were loaded to failure in bending under a three-point loading proce-dure. In this investigation, seven beams showed corrosion-induced cracking and their maximum crack widths were measured.The seven beams are selected to compare with the PC beams. The corresponding curve of the RC beams has also been given inthe Fig. 11. As Fig. 11 shows, the failure loads of the two types of beams decrease with increasing crack width. The flexuralstrength degradation caused by corrosion-induced crack is more significant in PC structures than that in RC structures. It indicatesthat corrosion-induced cracking degrades more strength of PC structures than that of RC structures.
Fig. 12 shows the corrosion morphology of the strand. The corrosion degree of the strand was low. Some crevices existed be-tween the outer wire and core wire and provided a channel for the flow of corrosion products, as shown in Fig. 12(b). The move-ment of corrosive liquid between crevices could lead to corrosion extension along the beam length, which would accelerate thestrand's corrosion rate [30]. Corrosion pitting reduced the cross-sectional area and induced the stress concentration. Some ovalcorrosion pitting was observed and is shown in Fig. 12(c). The area and depth of corrosion pitting were small.
Zhang et al. [17] indicated that the average mass loss was superior to the maximum cross-section loss when correlating withcrack width. The corrosion degree of the strand was low, and the pitting corrosion was minimal. Therefore, for the purposes ofthis study, the strand's average mass loss was employed to reflect corrosion loss. The strand's average mass loss was measuredand the measurement program was as follows. First, the cover was removed via a destructive method. Next, the strand wastaken out and the grout on its surface was removed with slight knocking. Following this, the corroded strand was cleanedusing a 12% hydrochloric acid solution and then neutralized with alkali. The strand was kept in a dry environment (relative hu-midity less than 25%). Finally, the average mass loss of strand was measured, as given in Table 1. The average crack width in-creased with an increase in the average mass loss.
Fig. 12. Corrosion morphology of the strand.
Please cite this article as: L. Dai, et al., A global model for corrosion-induced cracking in prestressed concrete structures, Engineer-ing Failure Analysis (2015), http://dx.doi.org/10.1016/j.engfailanal.2016.01.013

Fig. 13. The experimental and predicted crack widths.
10 L. Dai et al. / Engineering Failure Analysis xxx (2015) xxx–xxx
Crack widths were calculated using the proposed model. The Poisson's ratio and elastic modulus of corrosion products werechosen as νr = 0.49, Er = 6000(1-2νr), respectively [21]. Zhao et al. [28] indicated that the rust expansion ratio ranged from 2to 4; it was selected as 3 in this calculation. A modified coefficient was introduced to consider the filling extent of the corrosionproducts. Lu et al. [18] indicated that the modified coefficient could take approximately 0.1–0.3 and 0.7–0.8 for the acceleratedcorrosion and natural corrosion, respectively. The coefficient, k1, was selected as 0.2. The filling extent of the corrosion productsafter cover cracking was assumed to be similar to that of natural corrosion. The coefficient, k2, was selected as 0.75. The thicknessof the porous zone ranged from 10 um to 20 um [13]. PC structures generally used high strength concrete, so the thickness of theporous zone was selected as 10 um.
Fig. 13 shows the experimental and predicted crack widths. The predicted values are in reasonable agreement with experi-mental values, though the observed results were slightly higher than the predicted widths. The average error is 10.4%. The theo-retical errors may be attributed to the measurement uncertainty of crack width and corrosion loss. Another reason for this may bethe assumption of uniform corrosion and it may underestimate internal pressure induced by corrosion products. Additionally, theheterogeneity and variability of materials might also have affected the prediction. Some differences exist between the predictedand experimental values. This error can be accepted in view of the complexity of corrosion process. It is evident that the proposedmodel can predict the corrosion-induced crack width in PC structures.
The critical corrosion loss for cover crackingwas difficult tomeasure in the experiment. Some studies found that crackwidth had aline relationship with corrosion loss when the corrosion degree was low [17]. Based on this relationship, a linear regression methodwas employed to determine the critical corrosion loss for cover cracking. Fig. 14 shows the linear regression relationship betweencrack width and corrosion loss. Using this regression, it is possible to determine the critical corrosion loss for cover cracking.
For a cover of 52.4 mm, the predicted corrosion loss for cover cracking is 0.1656%. For a cover of 67.4 mm, the predicted valueis 0.3764%. The average error is 8.8%. The predicted widths correlate well with the experimental values. Results show that a littlecorrosion loss would induce the cover cracking in PC structures.
The other alternatives on parameters of corrosion products to match the experimental data with the analytical model are inves-tigated. Based on the proposed model in the present study, the critical corrosion loss of cover cracking increases about 3% as the
Fig. 14. Critical corrosion loss of cover cracking.
Please cite this article as: L. Dai, et al., A global model for corrosion-induced cracking in prestressed concrete structures, Engineer-ing Failure Analysis (2015), http://dx.doi.org/10.1016/j.engfailanal.2016.01.013

Fig. 15. Effects of prestress on: (a) ρm, (b) ρp, (c) ρw under various covers.
11L. Dai et al. / Engineering Failure Analysis xxx (2015) xxx–xxx
Poisson's ratio of corrosion products changed from 0.3 to 0.49, and decreases about 67% as the rust expansion ratio changed from 2 to4. It indicates that the rust expansion ratio has the more effects on the corrosion loss than the Poisson's ratio of corrosion products.
Munoz et al. [31] investigated the expansive pressure induced by reinforcement corrosion in concrete members. It was found thatthe expansive pressure at the steel-concrete interface builds up after corrosion products fill the porous zone. With increasing corro-sion, the expansive pressure relaxeswhen the radial crack (or crack) opened until reaching amaximumvalue. In the proposedmodel,the critical corrosion loss at themicro-crack formation stage is obtained with themaximum expansive pressure. The relaxation of ex-pansive pressure due to concrete cracking is neglected. Compared with the experimental and modeling results in this study, the av-erage error is less than 10.4%. This error can be accepted in view of the complexity of corrosion process. How to consider the effect ofthe relaxation of expansive pressure on the corrosion-induced cracking model will be performed in the future study.
The global model of corrosion-induced cracking was verified with the experimental results. The results show that the proposedmodel can efficiently calculate the corrosion-induced cracking of PC structures.
6. Influencing parameters for critical corrosion loss
The corrosion-induced cracking is influenced by prestress, cover, strand diameter, concrete tensile strength and rust expansionratio. The effects of the above parameters on critical corrosion loss for micro-crack formation, cover cracking initiation, and0.1 mm crack width (ρm, ρp and ρw, respectively) will be discussed. JTG D62-2004 [32] indicates that the crack widths shouldnot exceed 0.1 mm, and defines this value as the ultimate serviceability state of concrete structures. Torres-Acosta et al. [7,31]considered that the structures would reach the end of service life when the crack widths on the concrete surface exceeded0.1 mm. In addition, the visible crack width is usually 0.1 mm. Therefore, this value (0.1 mm) is chosen as the critical crackwidth for the normal serviceable failure of PC structures and selected as the analysis object in this section.
Fig. 15 shows the influences of prestress on the critical corrosion loss under various covers. Prestress adversely affectscorrosion-induced cracking in structures. The JTG D62 [32] shows that strand stress in stretching control should be less than0.75 times of tensile strength, 0.75fp. For a cover of 70 mm, the decrease of ρm、ρp and ρw are 27%, 37% and 11%, respectively,by varying prestress from zero to 0.75fp. When cover changes from 30 mm to 70 mm, the decrement of ρm, ρp, and ρw increase9%, 14% and 5%, respectively. Prestress leads to a decrease in critical corrosion loss. This decrement becomes more noticeable ascover increases. Increasing cover is a direct measure to delay corrosion-induced cracking.
Fig. 16 shows the effects of prestress on critical corrosion loss under various concrete tensile strengths. The slope of the lineincreases with increasing concrete tensile strength. ρm, ρp, and ρw decrease 28%, 41% and 11%, respectively, with an increase ofprestress when ft. is 2.01 MPa. By varying ft. from 2.01 MPa to 3.0 MPa, the decrement of ρm, ρp, and ρw decrease 14%, 20%
Fig. 16. Effects of prestress on: (a) ρm, (b) ρp, (c) ρw under various concrete tensile strengths.
Please cite this article as: L. Dai, et al., A global model for corrosion-induced cracking in prestressed concrete structures, Engineer-ing Failure Analysis (2015), http://dx.doi.org/10.1016/j.engfailanal.2016.01.013

Fig. 17. Effects of prestress on: (a) ρm, (b) ρp, (c) ρw under various strand diameters.
12 L. Dai et al. / Engineering Failure Analysis xxx (2015) xxx–xxx
and 5%, respectively. Prestress significantly affects ρm and ρp, especially for a low concrete tensile strength. The critical corrosionloss decreases with prestress increases. This decrement becomes more noticeable with decreasing concrete tensile strength. Aftercover cracking, the slope of the line shows a minor increase with varying concrete tensile strengths. This indicates that the effectof concrete tensile strength on the critical corrosion loss depends on cover cracking.
The influences of prestress on critical corrosion loss under various strand diameters are shown in Fig. 17. The critical corrosionloss decreases as the prestress increases. Prestress leads to a decrease of ρm, ρp and ρw (23%, 32% and 9%, respectively) when thestrand diameter is 15.2 mm. The decrement of ρm, ρp, and ρw increase 14%, 17% and 6%, respectively, by varying the strand diam-eter from 9.5 mm to 15.2 mm. Prestress leads to a decrease in the critical corrosion loss. This decrement shows no remarkablechanges with an increasing strand diameter, which shows that the strand diameter changes the quantity of corrosion products,and has little effect on the concrete cracking process.
Fig. 18 shows the effects of prestress on critical corrosion loss under various rust expansion ratios. Prestress has an adverseeffect on the critical corrosion loss at the three stages. ρm, ρp, and ρw decrease 24%, 33% and 6%, respectively, with an increaseof prestress when rust expansion ratio is 2. The decrement of ρm, ρp, and ρw shows no remarkable changes with the increaseof rust expansion ratio. The critical corrosion loss at the three stages increases with decreasing rust expansion ratio. Rust expan-sion ratio is a very important parameter to analyze the corrosion-induced cracking.
Non-prestressed concrete member is a special case in the proposed model as the prestress in members is equal to zero. Asdiscussed before, prestress has an adverse effect on corrosion-induced cracking. The critical corrosion loss decreases with increas-ing the prestress. Corrosion leads more easily to concrete cracking in PC structures than that in RC structures. PC structures aremore sensitive to corrosion-induced cracking than RC structures.
Reducing the prestress, strand diameter and rust expansion ratio and increasing the cover and concrete tensile strength candelay corrosion-induced cracking in PC structures.
7. Conclusions
Based on theoretical analysis and experimental results, the following conclusions were drawn:
• The proposed model can predict, within reason, the corrosion loss of strand in PC structures from corrosion initiation to concretecracking by using the comparison between theoretical and experimental results. The predicted errors are acceptable in view ofthe complexity of the corrosion process.
Fig. 18. Effects of prestress on: (a) ρm, (b) ρp, (c) ρw under various rust expansion ratios.
Please cite this article as: L. Dai, et al., A global model for corrosion-induced cracking in prestressed concrete structures, Engineer-ing Failure Analysis (2015), http://dx.doi.org/10.1016/j.engfailanal.2016.01.013

13L. Dai et al. / Engineering Failure Analysis xxx (2015) xxx–xxx
• The movement of corrosive liquid between crevices could lead to corrosion extension along the beam length and could accel-erate the corrosion rate of the strand. Under the coupling effects of prestress, twisted shape and large diameter of strand,very slightly corrosion can lead to the cover cracking in PC structures.
• Corrosion-induced crack increases significantly the risk of beam failure. The failure load degradation caused by corrosion-induced cracking is more significant in PC structures than that in RC structures.
• Prestress has an adverse effect on corrosion-induced cracking in PC structures and can decrease critical corrosion loss at thethree stages. This decrement becomes more noticeable with increasing cover and decreasing concrete tensile strength, but dem-onstrates no remarkable changes with an increasing strand diameter and rust expansion ratio.
• The critical corrosion loss at the three stages increases with increasing concrete tensile strength and concrete cover, and de-creases with an increasing strand diameter and rust expansion ratio.
It should be pointed out that the specimens used in present study were subjected to the accelerated corrosion. This may bedifferent from the natural field corrosion. Additionally, concrete is assumed as the ideal elastic body in the analytical model.The questions of how to reconcile the difference caused by the above factors still needs more studies.
Acknowledgements
This work reported here was conducted with financial support from the State Key Development Program for Basic Research ofChina (Grant No. 2015CB057705), the National Natural Science Foundation of China (Grant No. 51478050, 51178060, 51508036)and the National Science Foundation for Distinguished Young Scholars of Hunan Province (Grant No. 14JJ1022). Their support isgratefully acknowledged.
References
[1] K. Bhargava, A. Ghosh, Y. Mori, S. Ramanujam, Analytical model for time to cover cracking in RC structures due to rebar corrosion, Nucl. Eng. Des. 236 (2006)1123–1139.
[2] Y. Ma, J. Zhang, L. Wang, Y. Liu, Probabilistic prediction with Bayesian updating for strength degradation of RC bridge beams, Struct. Saf. 44 (2013) 102–109.[3] A. Castel, D. Coronelli, N.A. Vu, R. Françoi, Structural response of corroded, Unbonded Posttensioned Beams, J. Struct. Eng. 137 (2011) 761–771.[4] Z. Rinaldi, S. Imperatore, C. Valente, Experimental evaluation of the flexural behavior of corroded P/C beams, Constr. Build. Mater. 24 (2010) 2267–2278.[5] A. Torres-Acosta, S. Navarro-Gutierrez, J. Terán-Guillén, Residual flexure capacity of corroded reinforced concrete beams, Eng. Struct. 29 (2007) 1145–1152.[6] A. Muñoz, C. Andrade, A. Torres-Acosta, J. Rodríguez, Relation between crack width and diameter of rebar loss due to corrosion of reinforced concrete members,
ECS Trans. 13 (2007) 29–36.[7] A. Torres-Acosta, M. Martı'nez-Madrid, Residual Life of Corroding Reinforced Concrete Structures in Marine Environment, J. Mater. Civ. Eng. 15 (2003) 344–353.[8] F. Li, Y. Yuan, Effects of corrosion on bond behavior between steel strand and concrete, Constr. Build. Mater. 38 (2013) 413–422.[9] D. Coronelli, A. Castel, N. Vu, R. François, Corroded post-tensioned beams with bonded tendons and wire failure, Eng. Struct. 31 (2009) 1687–1697.
[10] L. Chernin, D. Val, Prediction of corrosion-induced cover cracking in reinforced concrete structures, Constr. Build. Mater. 25 (2011) 1854–1869.[11] Y. Ma, L. Wang, J. Zhang, Y. Xiang, Y. Liu, Bridge remaining strength prediction Integrated with Bayesian network and In situ load testing, J. Bridg. Eng. 19 (2014)
137–147.[12] S. Yang, X. Liu, Y. Leng, Prediction of flexural deformation of a corroded RC Beamwith a polynomial tension-stiffening model, J. Struct. Eng. 139 (2013) 940–948.[13] A. Jamali, U. Angst, B. Adey, B. Elsener, Modeling of corrosion-induced concrete cover cracking: A critical analysis, Constr. Build. Mater. 42 (2013) 225–237.[14] C. Li, R. Melchers, J. Zheng, Analytical model for corrosion-induced crack width in reinforced concrete structures, ACI Struct. J. 103 (2006) 479–487.[15] Y. Zhao, Y. Wu, W. Jin, Distribution of millscale on corroded steel bars and penetration of steel corrosion products in concrete, Corros. Sci. 66 (2013) 160–168.[16] Y. Zhao, J. Yu, B. Hu, W. Jin, Crack shape and rust distribution in corrosion-induced cracking concrete, Corros. Sci. 55 (2012) 385–393.[17] R. Zhang, A. Castel, R. François, Concrete cover cracking with reinforcement corrosion of RC beam during chloride-induced corrosion process, Cem. Concr. Res. 40
(2010) 415–425.[18] C. Lu, W. Jin, R. Liu, Reinforcement corrosion-induced cover cracking and its time prediction for reinforced concrete structures, Corros. Sci. 53 (2011) 1337–1347.[19] X. Du, L. Jin, Meso-scale numerical investigation on cracking of cover concrete induced by corrosion of reinforcing steel, Eng. Fail. Anal. 39 (2014) 21–33.[20] B. Šavija, M. Luković, J. Pacheco, E. Schlangen, Cracking of the concrete cover due to reinforcement corrosion: A two-dimensional lattice model study, Constr.
Build. Mater. 44 (2013) 626–638.[21] F. Molina, C. Alonso, C. Andrade, Cover cracking as a function of bar corrosion: part2-numberical model, Mater. Struct. 26 (1993) 535–548.[22] G. Malumbela, M. Alexander, P. Moyo, Model for cover cracking of RC beams due to partial surface steel corrosion, Constr. Build. Mater. 25 (2011) 987–991.[23] T. El Maaddawy, K. Soudki, A model for prediction of time from corrosion initiation to corrosion cracking, Cem. Concr. Compos. 29 (2007) 168–175.[24] N.A. Vu, A. Castel, R. François, Response of post-tensioned concrete beams with unbonded tendons including serviceability and ultimate state, Eng. Struct. 32
(2010) 556–569.[25] G. Cavell, P. Waldron, A residual strength model for deteriorating post-tensioned concrete bridges, Comput. Struct. 79 (2001) 361–373.[26] J.R. Martí-Vargas, L.A. Caro, P. Serna, Experimental technique for measuring the long-term transfer length in prestressed concrete, Strain 49 (2013) 125–134.[27] Y. Liu, R. Weyers, Modeling the time-to-corrosion cracking in chloride contaminated reinforced concrete structures, ACI Mater. J. 95 (1998) 675–681.[28] Y. Zhao, W. Jin, Modeling the amount of steel corrosion at the cracking of concrete cover, Adv. Struct. Eng. 9 (2006) 687–696.[29] C. Wang, Z. Teng, Principle of Concrete Reinforcement Structure, China Architecture & Building Press, Beijing, 1985.[30] L. Wang, X. Zhang, J. Zhang, Y. Ma, Y. Xiang, Y. Liu, Effect of insufficient grouting and strand corrosion on flexural behavior of PC beams, Constr. Build. Mater. 53
(2014) 213–224.[31] A. Munoz, C. Andrade, A. Torres-Acosta, Corrosion products pressure needed to crack the concrete cover, Adv. Construct. Mater (2007) 359–370.[32] JTG D62-2004, Code for design of highway reinforced concrete and prestressed concrete bridges and culverts, Transport Ministry of PR China, Beijing, 2004.
Please cite this article as: L. Dai, et al., A global model for corrosion-induced cracking in prestressed concrete structures, Engineer-ing Failure Analysis (2015), http://dx.doi.org/10.1016/j.engfailanal.2016.01.013