engineering geology and site investigationscrb/web/engineer/engineer.pdf · engineering geology and...
TRANSCRIPT

Engineering Geology and Site Investigations
Purpose • Documenting strengths and behavioural
characteristics of rocks and engineering soils present (Solid and Drift Geology)
• Recognising potentially hazardous groundNote Much of engineering practice involves Quaternary
Deposits!
• What skills/subjects are of importance?- Sedimentology- Glaciology- Soil Science - hydrogeology - engineering What is this information used for?

Engineering Geology and Site Investigations
Read:Hutchinson, J. N. 2001 Reading the Ground:
Morphology and Geology in Site Appraisal. Q. Jn. Eng. Geol and Hydrogeol. V. 34
Fookes, P. G. 1997. Geology fo Engineers: The Geological Model, Prediction and Performance. Q. Jn. Eng Geol. V. 30, pp. 293-424

Engineering Geology and Site Investigations
• What is this information used for?
? Selection of construction sites? Selection of transportation routes? Establishing design specifications? Choice of material? Location of material? Designing work program? Evaluating QA/QC

Engineering Geology and the Law
• There is a bigger issue in engineering geology than any other aspect of geo with liability. Even though oil and gas decisions often involve a much larger budget/cost rarely do decision have a life or death element. Construction usually does.
• As almost all construction relies on building on a site the site investigation is fundamental.
• In Britain over 30% of all major civil engineering projects are delayed by poor ground conditions.
• What does poor mean? The fact that the initial site investigation did not properly classify the ground.
• This leads to over 50% of projects going over budget!!
Site Investigation
? Regional or Reconnaissance Site Investigation
? Site Documentation
? Material Evaluation
Site Investigation - Holistic in nature
Assess:• Surface and near surface rocks, lithology,
weathering, diagenesis• rock structure and discontinuities• climatic and sea-level changes• resulting active and relict erosional fluvial
and marine features• hydrogeological features• fluvial and coastal changes• mass movements on slopes• volcanic and seismic activity

Regional or Reconnaissance Site Investigation
This is done with the following objectives:1. Establish Alternative Sites and Route Corridors• Note in densely populated countries such as in
Europe there may not be alternatives possible or other factors may predetermine the location of an engineering construction.
2. Terrain Evaluation• Types of information acquired
? Geographic maps - geomporhological maps? Geological maps - solid and drift? Remote sensing? Hazard maps? Hydrogeological maps
Example Fookes et. al. 1985, Engineering Geology, v21, p18

Site Documentation
Two complementary phases are conducted here:
? Desk Study
? Field Study - including field and laboratory material analysis
Desk Study - Information Sources
• Published data, unpublished data, memoirs, papers, miscellaneous maps such as cave systems, planning submissions to local government
• Historical maps showing rates of landscape change, mining history, previous hazard areas, previous landfill areas
• Topographic maps showing basic slope, drainage patterns, springs etc.
• Remote sensing maps, air photographs and satellite images
• Borehole logs - in Britain the BGS keeps logs for all data of this sort, water well information
• National surveys or databases, for example these are available for landslips, natural cavities, erosion, flooding
• Mining or other mineral exploitation records. Often of variable quality, in Britain only post-1947 information is available.
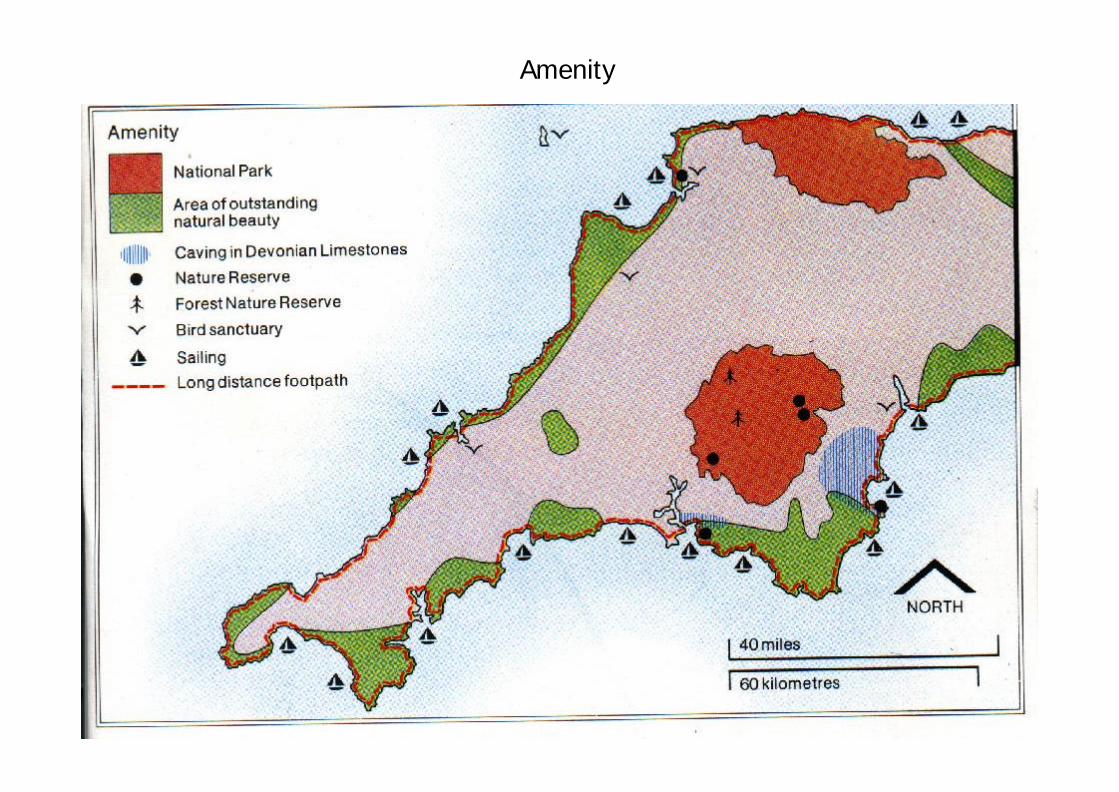
Amenity

Land Use

Desk Study - Information Sources
• Published data, unpublished data, memoirs, papers, miscellaneous maps such as cave systems, planning submissions to local government
• Historical maps showing rates of landscape change, mining history, previous hazard areas, previous landfill areas
• Topographic maps showing basic slope, drainage patterns, springs etc. (handout 1)
• Remote sensing maps, air photographs and satellite images
• Borehole logs - in Britain the BGS keeps logs for all data of this sort, water well information
• National surveys or databases, for example these are available for landslips, natural cavities, erosion, flooding
• Mining or other mineral exploitation records. Often of variable quality, in Britain only post-1947 information is available.

Topographic Maps -Drainage etc.
Field Survey - Information Sources
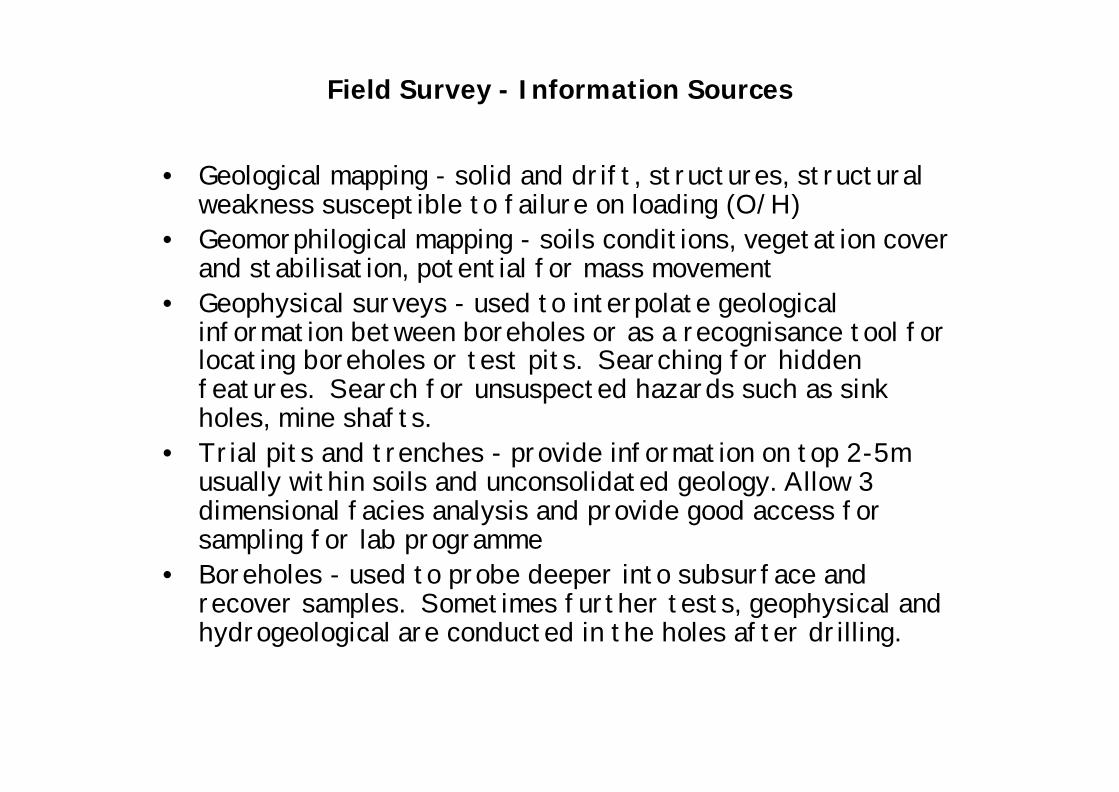
• Geological mapping - solid and drift, structures, structural weakness susceptible to failure on loading (O/H)
• Geomorphilogical mapping - soils conditions, vegetation cover and stabilisation, potential for mass movement
• Geophysical surveys - used to interpolate geological information between boreholes or as a recognisance tool for locating boreholes or test pits. Searching for hidden features. Search for unsuspected hazards such as sink holes, mine shafts.
• Trial pits and trenches - provide information on top 2-5m usually within soils and unconsolidated geology. Allow 3 dimensional facies analysis and provide good access for sampling for lab programme
• Boreholes - used to probe deeper into subsurface and recover samples. Sometimes further tests, geophysical and hydrogeological are conducted in the holes after drilling.

Geological mapping
Specific Mapping Targets:• Type of Rock - geological description but based on
strength properties - micro properties (Example, See Later Lab Testing)
• Continuity of Rock - structural integrity, primary and secondary weaknesses - faults and joints
• Fracture/joint evaluation (Handout 2)? Fracture density? Fracture clustering? Fracture orientation with respect of slope? Fracture fill type? Weathering of fractures
• Geometry of Rock - layering, relations• Weathering (handout 3)

Geology
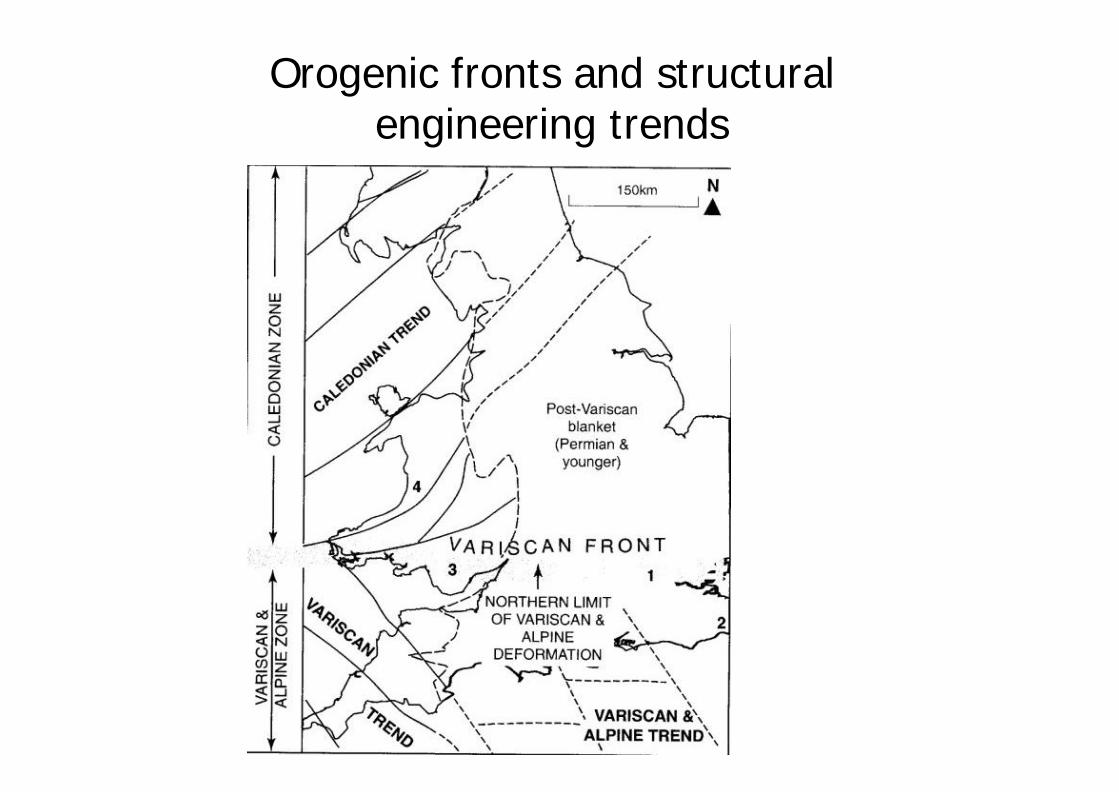
Orogenic fronts and structural engineering trends

Geomorphologic mapping
Specific Objectives• Mapping distribution of Drift/Unconsolidated
deposits• Mapping geometry of deposits• Mapping surface features - runoff, drainage
patterns, slope angles
Quaternary history -• depth and extent of permafrost• periglacial solifluction of clayey materials• periglacial and post-glacial landslides and rockfalls• superficial valley disturbances (cambering and
bulging)
• Mapping by surveying – field surveying, air photo, satellite

Geomorphologic mapping
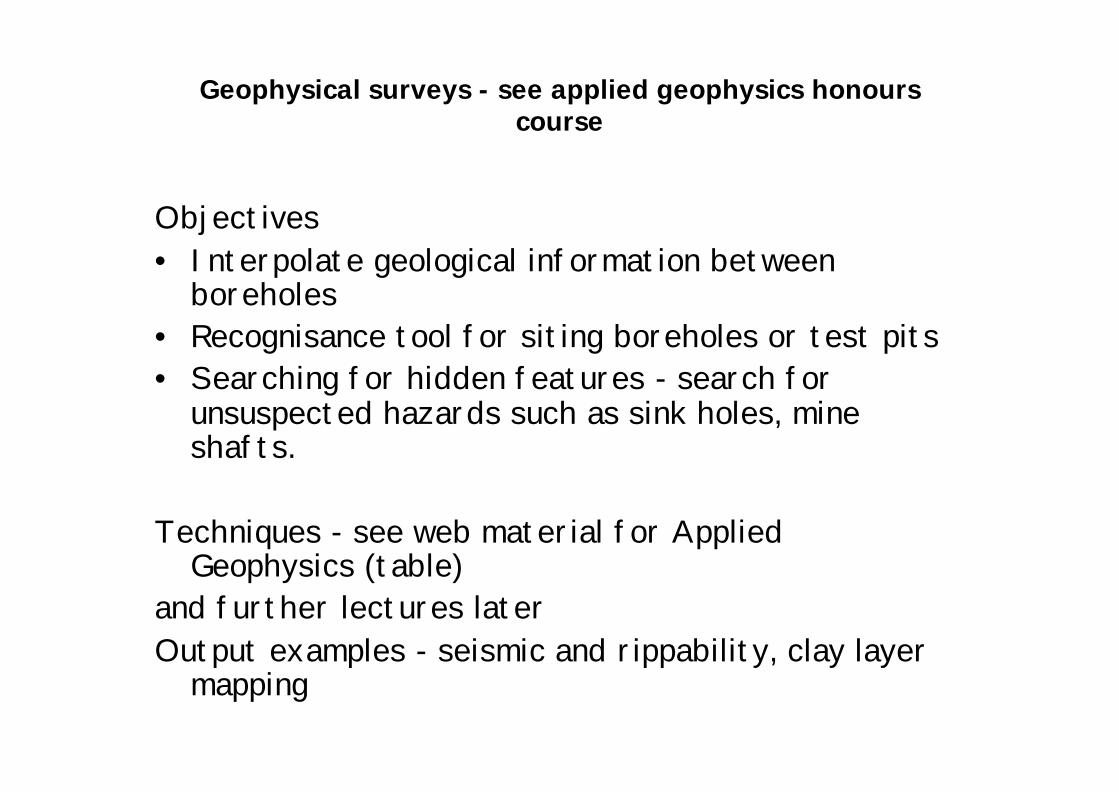
Geophysical surveys - see applied geophysics honours course
Objectives• Interpolate geological information between
boreholes• Recognisance tool for siting boreholes or test pits• Searching for hidden features - search for
unsuspected hazards such as sink holes, mine shafts.
Techniques - see web material for Applied Geophysics (table)
and further lectures laterOutput examples - seismic and rippability, clay layer
mapping

Geophysical surveys
Method Property Major Influence Typical Ranges
Electrical &Electromagnetic
ElectricalConductivity(resistivity)
Lithology (claycontent)Moisture (dissolvedsolids)
104 (sea water) to 10-4 (dry sand)millimohs/m
Gravity Density Lithology (magneticmineral)
0 (air filled void) to 1 (sediments) to 3(massive rocks) gm/km
Magnetic MagneticSusceptability
Lithology (mineral,porosity)
10-6 (sediments) to 102 (iron alloys)
Seismic Seismicvelocity/attentuation
Lithology (porosity,saturation, pressure)
102 (soil) to 104 (massive rocks) m/sec
GroundPenetratingRadar
Dielectric constant Lithology,watercontent,density
10 (ice) to 102 (water)

Factors influencing Strength and Geophysical Signatures
In homogeneous, isotropic media the velocities of compression and shear waves can be described in simple terms of elastic modulii and density.
Bulk Modulus (k)- incompressibility of the medium
Shear Modulus( µ ) - resistance to shearing; shear stress/shear strain. Note that from the above equations, it is implied that fluids and gases do not allow the propagation of S waves.
Any changes in the shear or bulk modulii or the density will therefore cause a change in shear and compression velocity
?
? )34( k
Vp
?? Vs ?
??
VvP
k/?
??
??
? ?
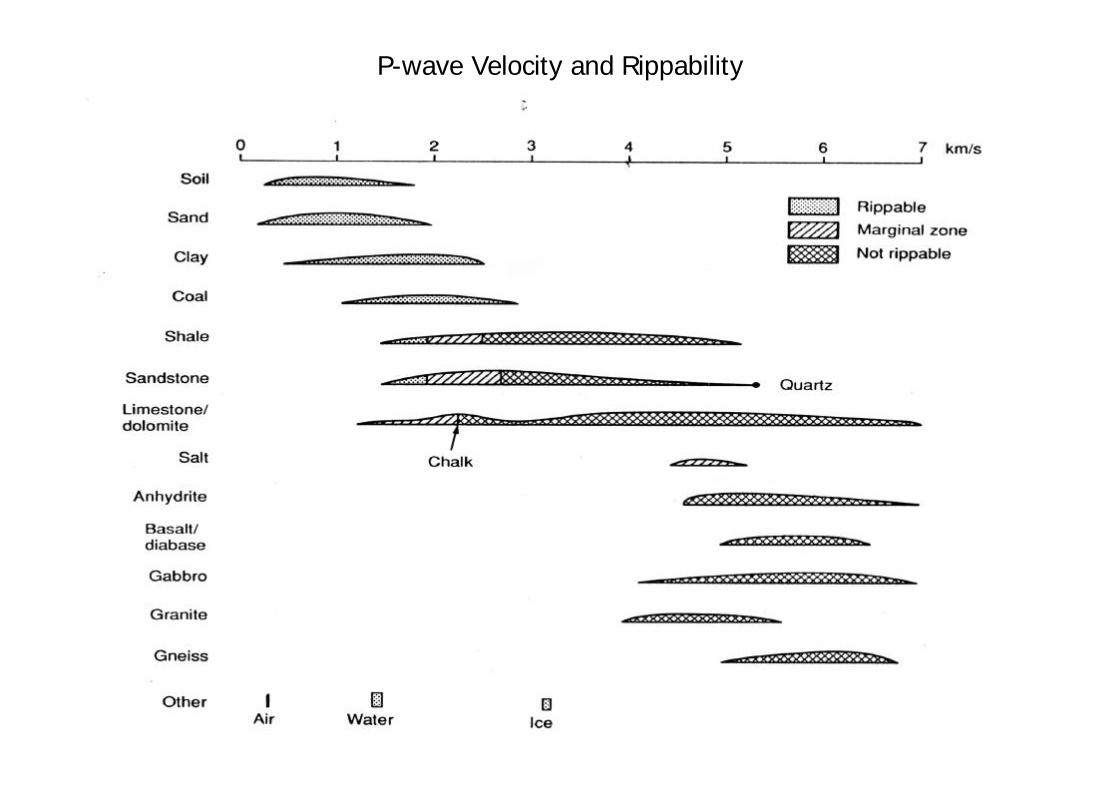
P-wave Velocity and Rippability

Direct Sampling
Trial Pits and Trenches (slides)• Assess 3D nature of drift deposits (and
sometimes rock)• Obtain samples for testing• Conduct insitu test

Boreholes Borehole Spacing dependant on Project Type and ground conditions
• Typically boreholes should penetrate a depth to 1.5 times the building foundation width
• Plus if 'sound' bedrock (rockhead) is not encountered in this depth then at least one borehole should penetrate to rockhead
Project Type MinimumSpacing
MaximumSpacing
Buildings 10m 30m
Road Sections 30m 300m
Road sections inHazard area
1m 5m
Drilling TypeLight Percussion Drilling • Light A-frame rig usually
trailer mounted• Light frame and small
motor to raise and lower hammer onto drill core
• Sampling is possible• Air or water lubrication• Penetration rates used to
indicate rock strength - N value (See spt later and handout 5)
Drilling TypeRotary Coring• Truck mounted rig• Rotary drill bit with tungsten carbide or diamond studded
tip• Core recovery in hollow drill bitRock Probing • Large rotary percussion rig with hammer action• Tricone roller or drag bit• Penetration >100m• No core recovery only cuttings flushed out by drill fluid• Borehole logging - example of engineering log • Strength Properties
• See handout 5

Drilling Types
Rotary Coring
Gravity-coring Vibro-coring

Hard Rock Testing
• Rarely is it necessary to test intact rock strength for bearing capacity as the strength envelopes are well know. (Example table Handout 4, Table 4-1)
• Also note some primary rock features that can influence strength such as:– Porosity, micro-porosity and saturation coefficient (Fig
4-3)• However, intact rock strength ignores macro
features e.g.- Jointing- Faulting- Weathering
• Rock testing where required includes- Unconfined compressive testing
- Cube loaded between two metal plates
Hard Rock Testing
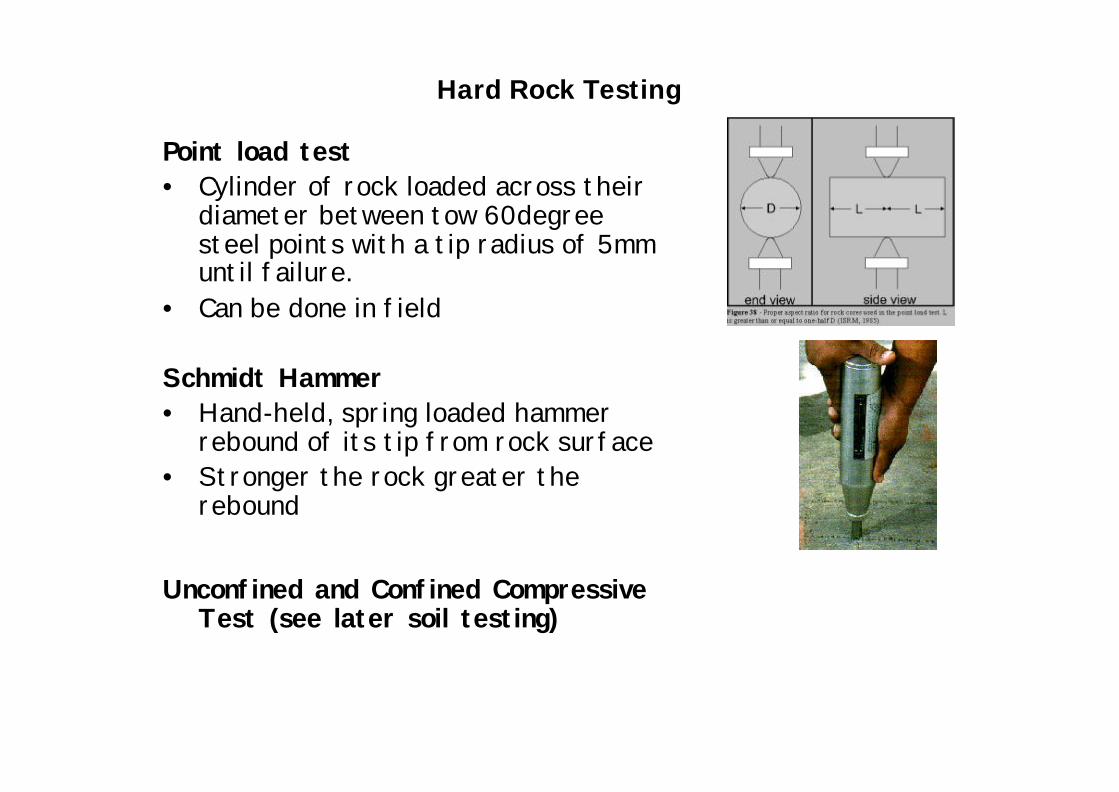
Point load test• Cylinder of rock loaded across their
diameter between tow 60degree steel points with a tip radius of 5mm until failure.
• Can be done in field
Schmidt Hammer• Hand-held, spring loaded hammer
rebound of its tip from rock surface• Stronger the rock greater the
rebound
Unconfined and Confined Compressive Test (see later soil testing)

Effective Rock Mass Strength
• Combination of fracture/joint pattern and extent of weathering together with rock type
• Holistic view of rock strength combines a number of parameters (sheet 8)
? Intact rock uncombined compressive strength (MPa)? RQD (%) - Quality Designation gives the fracture
density in a core. The maximum length of unfractured core material - shorter the length the poorer the rock quality. (>70 good rock)
? Mean fracture spacing? Fracture conditions? Groundwater state? Fracture orientation
• Components are given different ratings

Use of Rock Strength/Engineering Properties
Aggregate Crushing Value (AGV) handout 6• Measure the percentage of fines (<2.36mm
diameter) left after application of 400kN load for 10 min.
Aggregate Impact Value (AGI)• Measure the fines after dropping a hammer onto a
sample of aggregateAggregate Abrasion Value (AAV)• Measure of mechanical abrasion through
comparison of the weight of an aggregate sample before and after it has been abraded (Fig 4-8)
Soil Testing
• Routine part of all investigations includes both insitu, field testing and laboratory analysis on samples taken from boreholes, test pits and the surface.
• Engineering soil is defined as any unlithified(unconsolidated) material (sediment)
• Description follows Section 8 of BS 5930Aim
- Measure Strength- Determine sensitivity to Failure
Initial classification of material based on:? Grain size? Mineralogy? Grain arrangement? Water content

Atterberg Limits • Measure of consistency of soil - this is the
moisture content at which soil behaves in a plastic or liquid fashion
• As water content increases soil goes from solid to plastic to liquid
Plastic Limit (PL) - minimum water content at which soil is rolled into a 3mm diameter cylinder (approximate shear strength of 100kPa)
Liquid Limit (LL) - minimum moisture content at which soil will flow under own weight
Plasticity Index (PI) - difference between PL and LL, indicates the amount of moisture required to go from liquid to plastic
Liquidity Index (LI) - mobility of the soil at a particular moisture content (W)
LI=(W-PL)/PI• The higher the liquidity index the more unstable a
soil is.

Mohr Circles and Soil Shear Strength/Failure
• Shear strength expressed by Coulomb Failure Envelope
• Changes/differences in Shear Strength (?) can result from • Changes in normal stress (? )• porewater pressure (P) changes due to drainage (porosity)• differences in the angle of internal friction (?) due to
interparticle roughness and cohesion (c)• weathering reducing cohesion and angle of internal friction• remoulding of the sediment
(Slide of anisotropy and clay particle preferential orientation)
Handout 7
??? tan)( Pc ???

Consolidation of Soil
A - Water expulsionB - reorientation/restructuring of clay particles
Load
Degree of subsidencea function of porosity and load
Time
Cha
nge
in s
ubsi
denc
e
A B

Measurement of Shear Strength
Uniaxial Test (typically lab test)• Cube or cylinder loaded axially
with unconfined conditionsTriaxial Test (typically lab test)• Cube or cylinder loaded axially
while pressure maintained around the sample
• Experiment repeated for different loads and pressures.

Measurement of Shear Strength
Cone Penetration Test (typically lab test)
• Steel cone 60 degree cone, 36mm in diameter driven into soil. Penetration depth measures strength

Measurement of Shear Strength
Standard Penetration Test - SPT (typically field test)
Test 19 of BS 1377:1975• A 51mm split tube is driven into
sediment for 150mm.• 64kg weight hammer dropped onto
it over a distance of 760mm• Number of blows recorded to drive
tube a further 300mm

Measurement of Shear Strength
Cone Penetrometer Test - CPTCone pushed into ground at
steady rate• Measure of cone resistance,• Sleeve friction• Porewater pressure• Seismic values

Measurement of Shear Strength
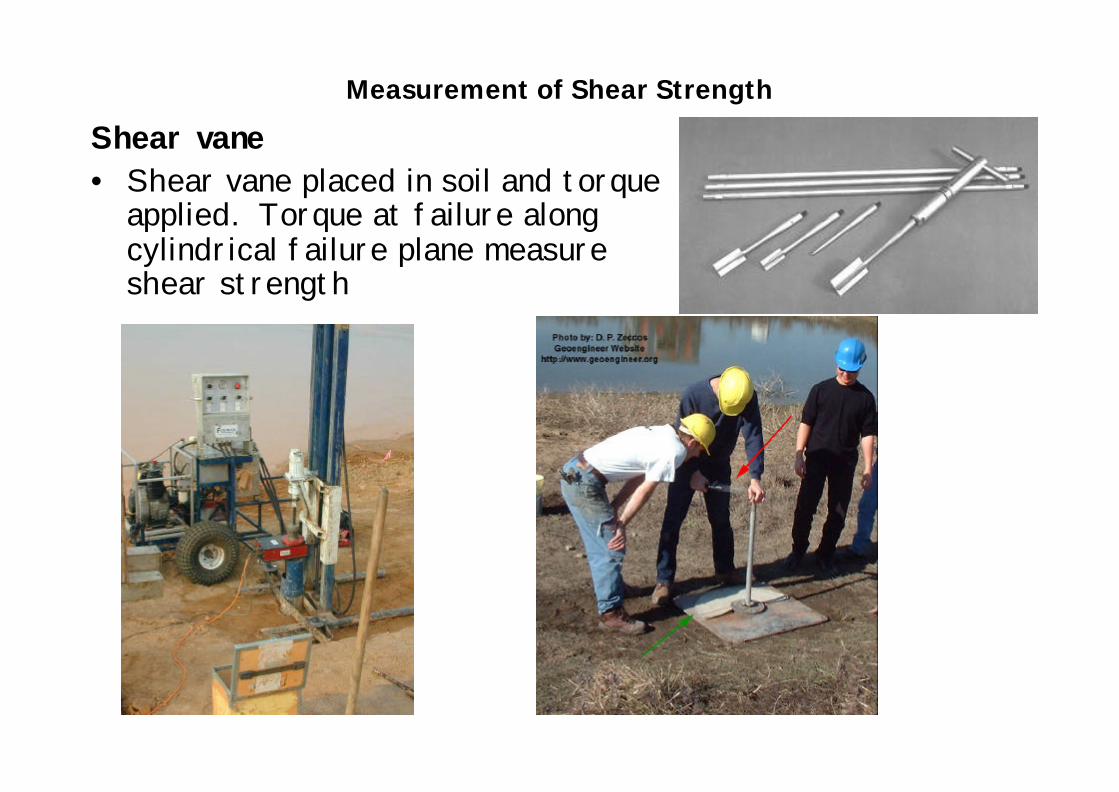
Measurement of Shear Strength
Shear vane• Shear vane placed in soil and torque
applied. Torque at failure along cylindrical failure plane measure shear strength
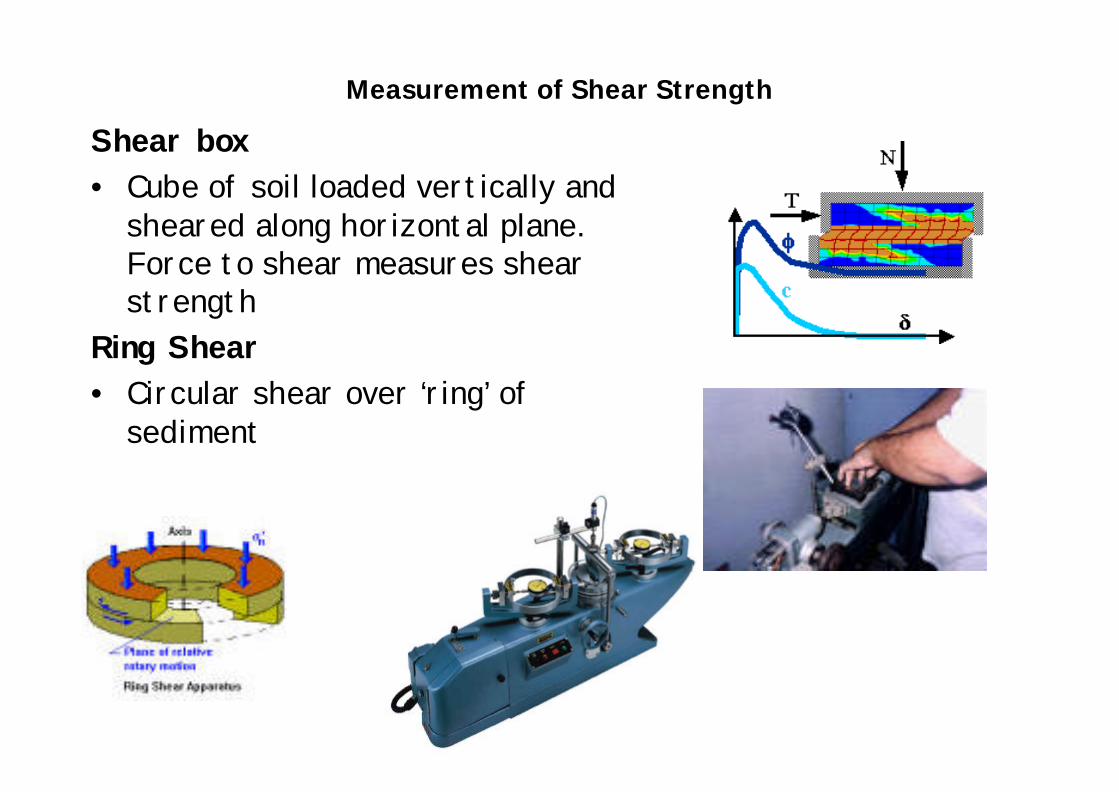
Measurement of Shear Strength
Shear box• Cube of soil loaded vertically and
sheared along horizontal plane. Force to shear measures shear strength
Ring Shear• Circular shear over ‘ring’ of
sediment
Grain Type
Illite Kaolinite Montmorillonite
Physio-chemistry
Clay Sand Silt
Grain Size
Deposit Type
Energy
FreshDispersed
SalineFlocculated
Salinity
Chemistry
Depo. Environment
Depositional History Stress History
Leaching
Weathering
Sediment structure and fabric
Engineering Behaviour
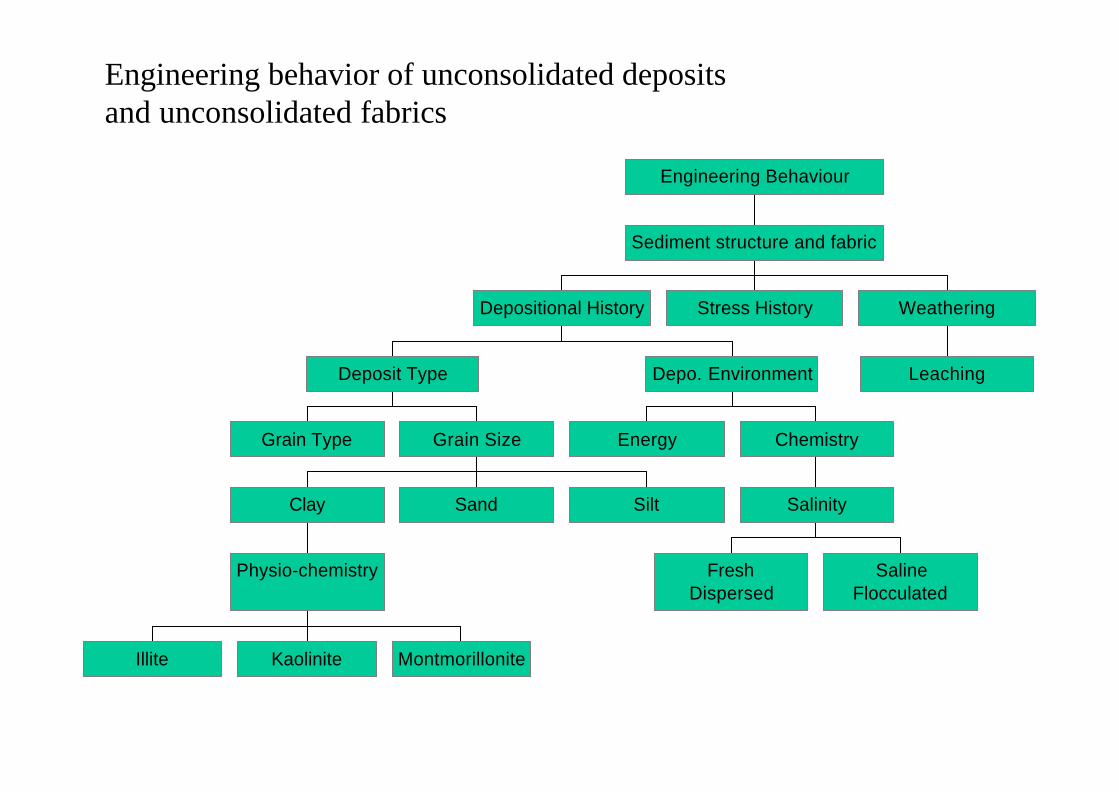
Engineering behavior of unconsolidated deposits and unconsolidated fabrics

Reporting - Site Reports and Engineering Geology Maps
- Synthesis of observations and measurements (handout 8)
- Based on the aims of the site investigation and its scale
- Engineering Geology Maps- Landsystem Map - thematic map used to classify
larger areas of land based on broad engineering classification, somewhat follows OS drift maps
- Detailed Site Plan - geomorph, geology, topo, point engineering data, groundwater, hazards

Summary
What is critical to Engineering Geology?- Know your rocks and soils- Know their properties as a whole and as constituent
parts- Know the conditions/properties within the rocks and
soils - moisture content etc.- Know what processes they have undergone and are
undergoing - e.g. weathering, diagenesis- Know how they are used - loaded, stressed etc

Hydrogeology
hydrology - the study of waterhydrogeology - inter-relationship of geologic materials and processes with water (c.f.geohydrology)
The Hydrologic System and the Hydrologic Cycle (fig)
inflow = outflow +/- changes in storage


Hydrogeologic units
• aquifer - a geologic unit that can store and transmit water at resource development rates (>10-2 darcy)
• aquifuge - impermeable unit • aquitard - low permeability unit that slow
water movement • aquiclude - confining unit consisting of an
aquitard

Further Terminology
Porosity - the ratio of the aggregate volume of the interstices in a rock or soil to its total volume.
Factors influencing porosity - primary and secondary porosity
• Fabric - packing, sorting, grain shape, size etc
• Cements
Permeability - The permeability of a rock is its capacity for transmitting a fluid.
Hydrogeology - terminology
Primary Porosity - the porosity that represents the original pore openings when a rock or sediment was formed (fig)
Secondary Porosity - the porosity that has been caused by fractures or weathering in a rock or sediment after it has been formed (fig)
Effective Porosity - the volume of rock or sediment through which water can travel divided by the total rock volume

Factors influencing Porosity - fabric
Packing
Porosity = 47.65%
Porosity = 25.95%
??
???
???
?
d
b
t
v
n
VV
n
??
1100
100
Where Vv - void volumeVt - total volumeb - bulk density
d - particle density
Density (rock type)is important

Factors influencing Porosity - fabric
Shape
mixed grain sizesreduce porosity
Fabric(rock type)is important
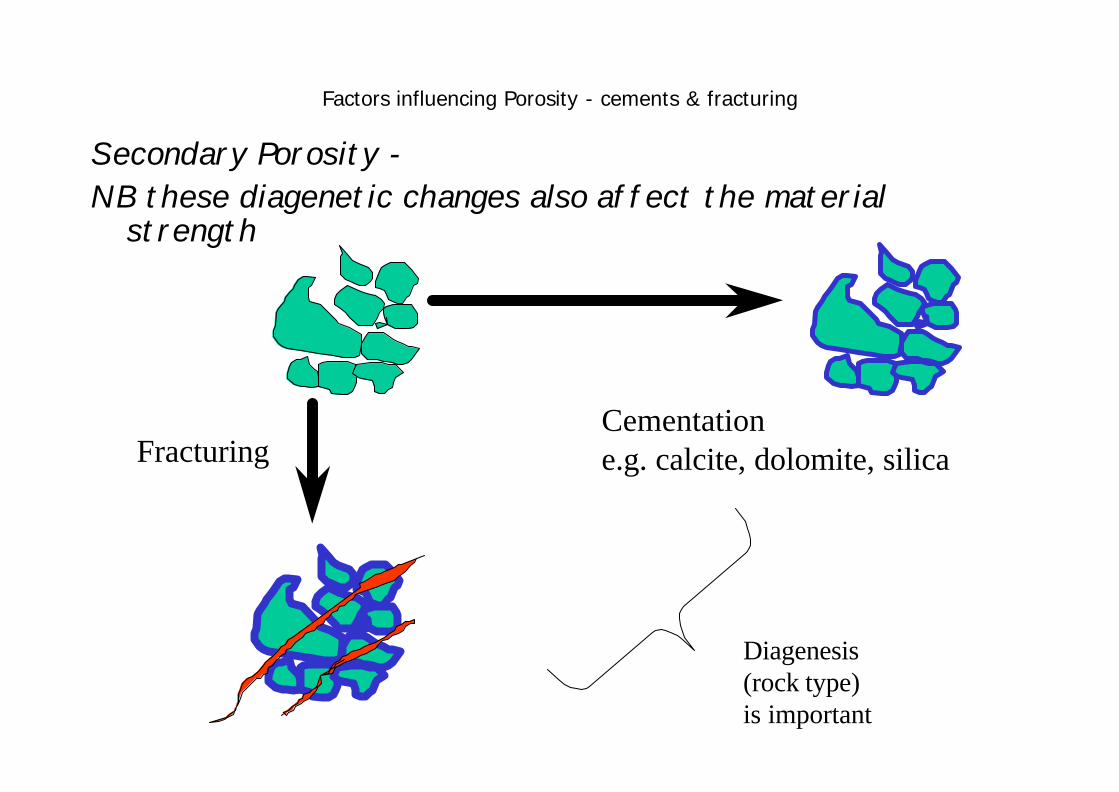
Factors influencing Porosity - cements & fracturing
Secondary Porosity -NB these diagenetic changes also affect the material
strength
FracturingCementatione.g. calcite, dolomite, silica
Diagenesis(rock type)is important

Hydrogeological factors of geophysical interest
Specific yield - ratio of the volume of water that drains from a saturated rock owing to attraction of gravity, to the total rock volume (Sy)
Specific retention - ration of water retention to total rock volume (Sr)
specific retention
specific yield
Porosity, n = Sy + Sr, also remember ??
???
????
d
b
t
v nV
Vn
??
1100,100

Hydraulic Conductivity and Specific Yield
Specific Yield in % (after Fetter)Material Maximum Minimum AverageClay 5 0 2Sandy Clay 12 3 7Silt 19 3 18Fine sand 28 10 21Medium sand 32 15 26Coarse sand 35 20 27Fine gravel 35 21 25Medium gravel 26 13 23Coarse gravel 26 12 22


Darcy’s Law
Henry Darcy, mid 1800 in Dijon experimented with water flow in tubes and filters of sand
Hydraulic Gradient• difference in hydraulic head
• water flows faster through coarser material
• Darcy’s Law
h1
h2
distance, ddhhv /)( 21 ??
Kv ?
dhhKv /)( 21 ??
Darcy’s Law cont.
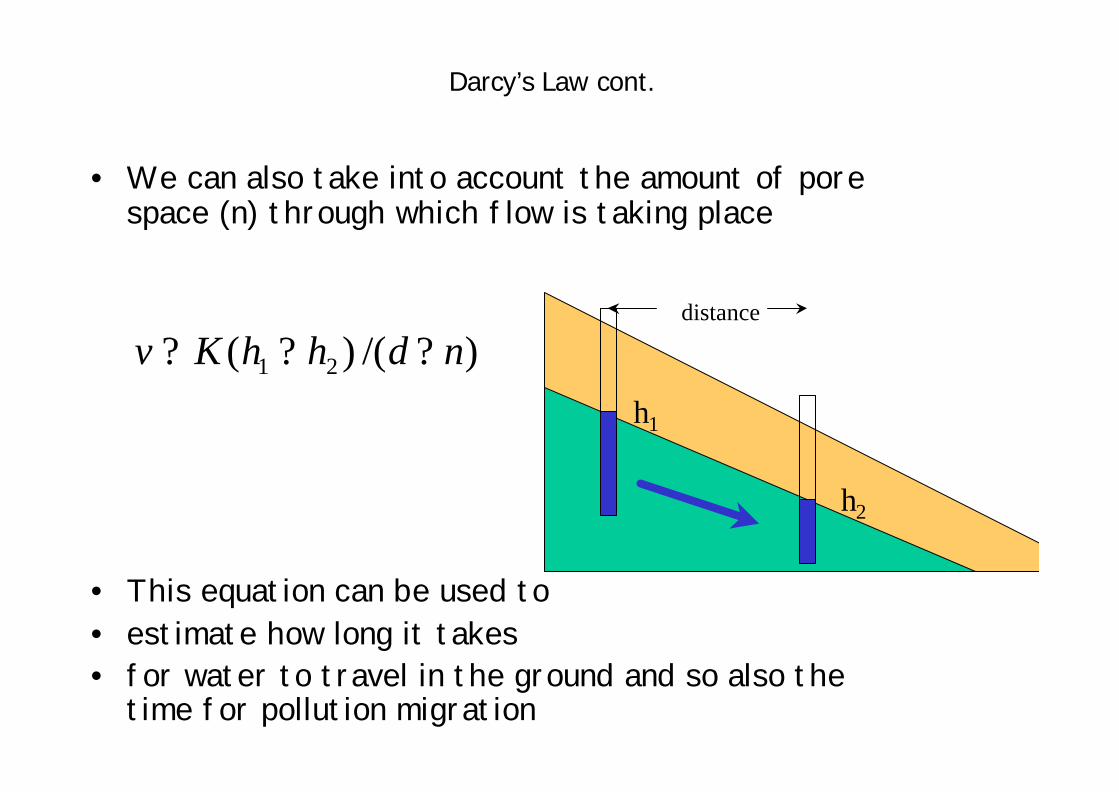
• We can also take into account the amount of pore space (n) through which flow is taking place
• This equation can be used to • estimate how long it takes• for water to travel in the ground and so also the
time for pollution migration
h1
h2
distance
)/()( 21 ndhhKv ???
Darcy’s Law cont.
h1
h2
distance
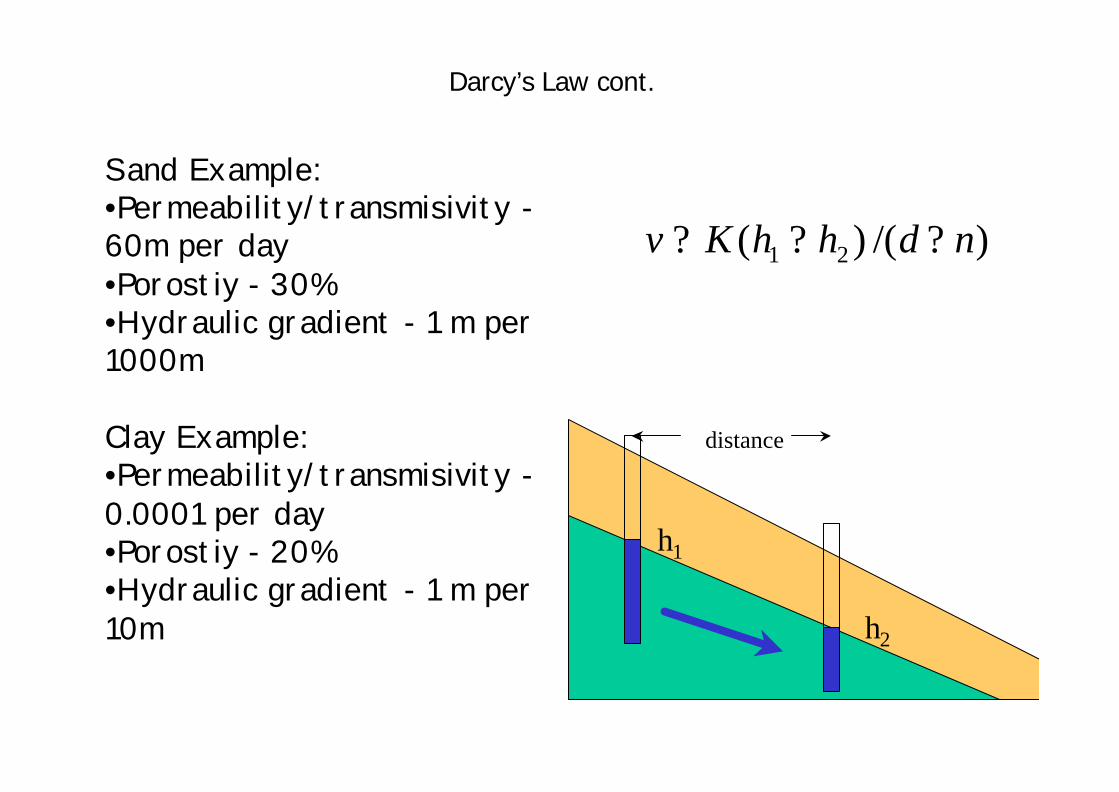
Sand Example:•Permeability/transmisivity -60m per day•Porostiy - 30%•Hydraulic gradient - 1 m per 1000m
Clay Example:•Permeability/transmisivity -0.0001 per day•Porostiy - 20%•Hydraulic gradient - 1 m per 10m
)/()( 21 ndhhKv ???
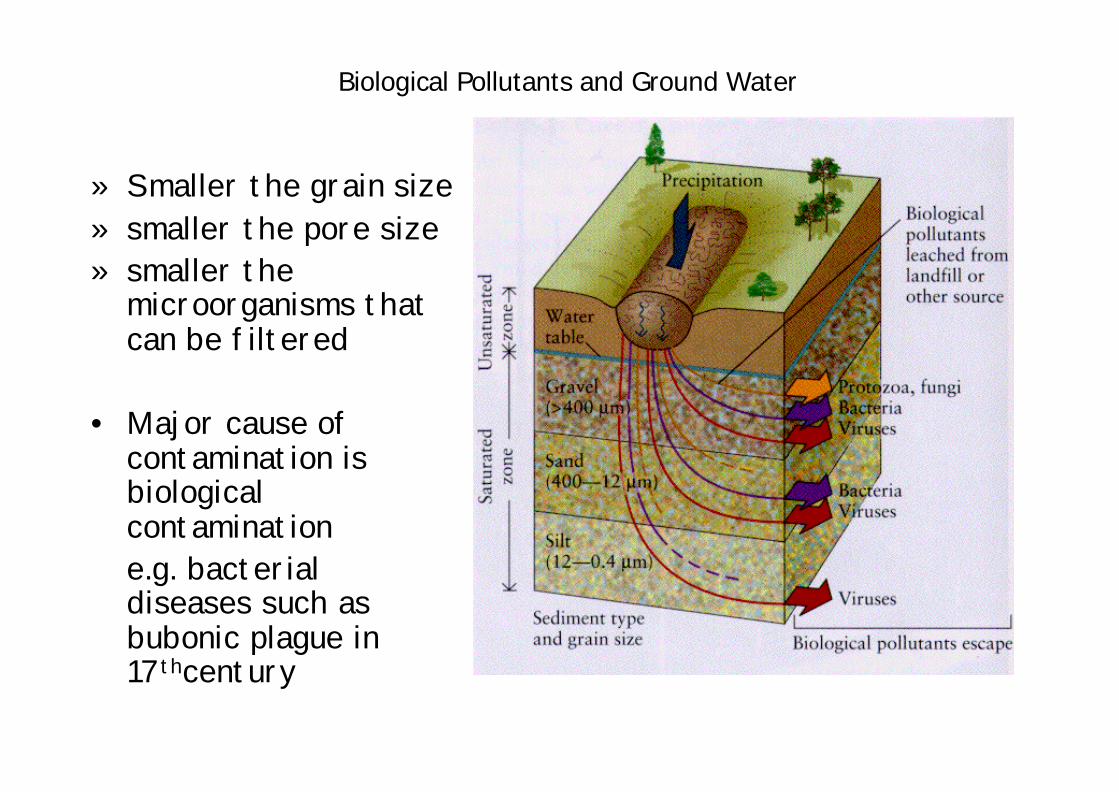
Biological Pollutants and Ground Water
» Smaller the grain size» smaller the pore size» smaller the
microorganisms that can be filtered
• Major cause of contamination is biological contaminatione.g. bacterial diseases such as bubonic plague in 17thcentury

Hydrogeology - Groundwater flow
hydraulic gradient - with all other factors constant the rate of ground water movement is the hydraulic gradient or change in head per unit of distance in a given direction.
potentiometric surface - surface to which water will rise in well cased to an aquifer.
potentiometric map - contour map ofpotentiometric surface of a particular hydrogeologic unit. Usually measured using a piezometer
water table is the potentiometric head (surface) for an unconfined aquifer, here pore water pressure is equal to atmospheric pressure.

Sewage Plume Cape Cod, MA
•Contamination from Sewage Treatment Plant, •1936-1986 2.5 billion gallons into outwash sand and gravel•Porosity 35%•Permeability/transmisivity 116m per day!! (ground water flow velocity of 0.3-0.5m per day•plume contaminated 7 million m3 of aquifer

Desk Study - Practical ClassGlenrothes Town Expansion
Specific objectives• Expansion of Glenrothes Town - where is the best
place for development to take place
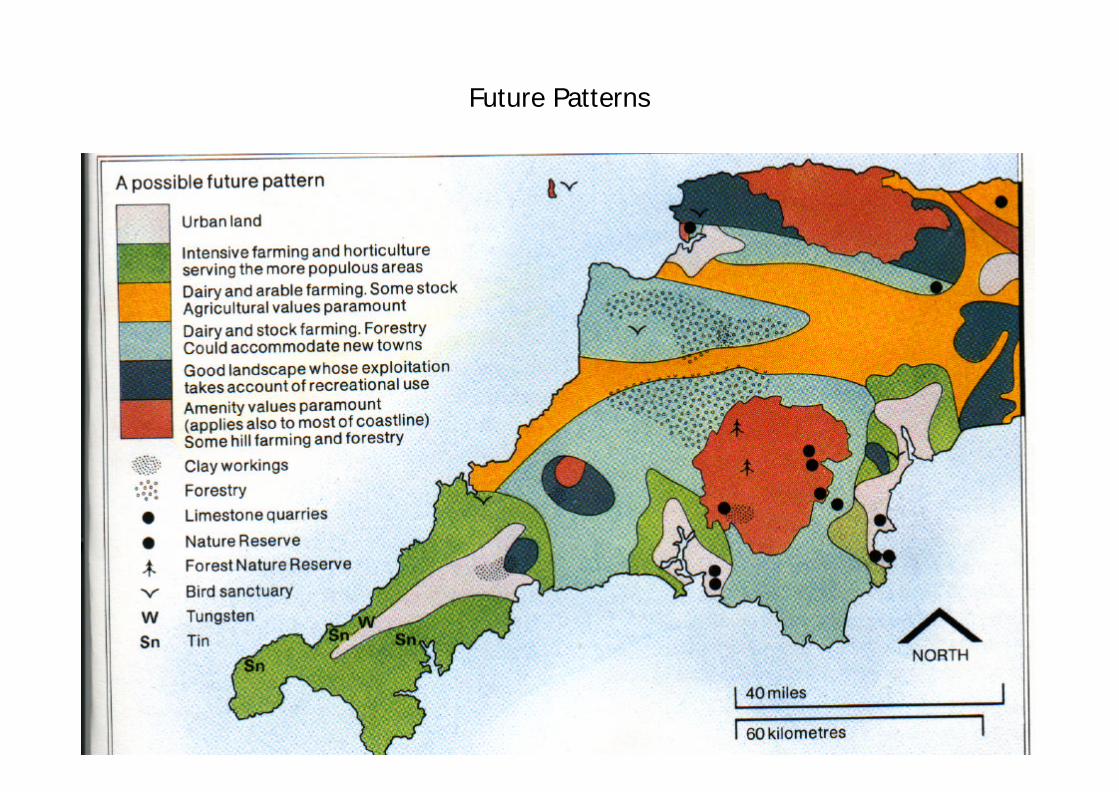
Future Patterns