engineering january 1984 volume 16 field notes
TRANSCRIPT
~. United States Department of Agriculture
Forest Service
Engineering Staff
Washington, D.C.
Engineering Field Notes Engineering Technical Information System
Volume 16 January 1984
Technological Improvements: What's in It for You?
The HP-41 CV Electronic Notebook System
"Subdivision" Program for the HP-41 C
A Partner in Equipment Development
A Method of Measuring Road Surface Wear
Flood Prediction-Using the National Weather Service Dam-Break Program
m Engineering Field Notes Administrative Distribution
• Professional Development
• Management
• Data Retrieval
This publication is an administrative document that was developed for the guidance of employees of the Forest Ser-vice - U.S. Department of Agriculture, its contractors, and its cooperating Federal and State Government Agencies. The text in the publication represents the personal opinions of the respective authors. This information has not been approved for distribution to the public, and must not be construed as recom-mended or approved policy, procedures, or mandatory instruc-tions, except by Forest Service Manual references.
The Forest Service-U.S. Department of Agriculture assumes no responsibility for the interpretation or application of this in-formation by other than its own employees. The use of trade names and identification of firms or corporations is for the con-venience of the reader; such use does not constitute an official endorsement or approval by the United States Government of any product or service to the exclusion of others that may be suitable.
This information is the sole property of the Government, with unlimited rights in the usage thereof, and cannot be copyrighted by private parties.
Please direct any comments or recommendations about thi.s publication to the following address:
FOREST SERVICE - USDA Engineering Staff - Washington Office Att: G.L. Rome, Editor
D.J. Carroll, Editorial Assistant P.O. Box 2417 - Washington, D.C. 20013 Telephone: Area Code 703/FTS-235-8198
IN'rRODUCT ION
ilHAT IS 'r I?
Technological Improvements: What's in It for You?
Dale R. PeteJ:sen Engineering Staff Washington Office
Technology is everywhere, and our lives are con-stantly touched by new technological developments. Th e Ch i e f s tat e din the Ma y 6, 1 983, F rid a y N e ~v s-letter that "the productivity of our forests will be based less on current forest resources than on the science and technology we bring to bear for their management and wise use. Forest science and tech-nology are frontiers which we have only begun to open up and explore."
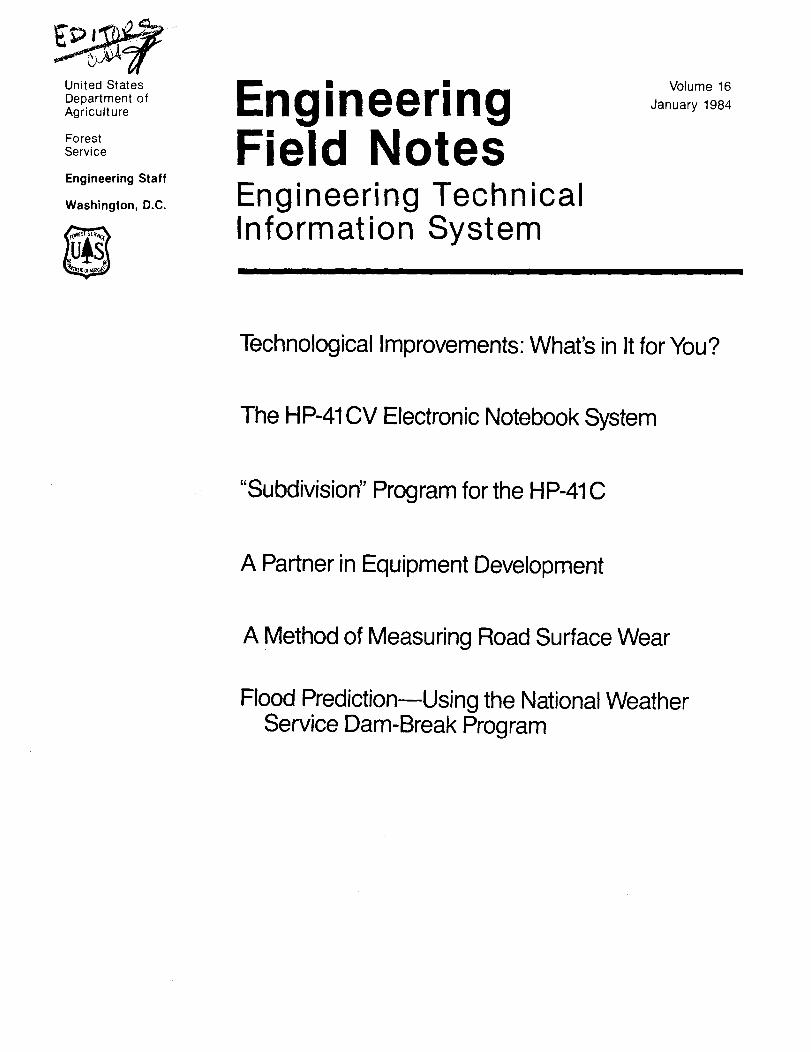
Technological Improvements (TI) is one of three Assistant Director areas in Washington Office Engi-neering. Figure 1 shows the activities in TI and who is responsible for each of them. TI's mission is to produce improved technology for programs throughout the Forest Service. Most TI projects serve Staff Units within the National Forest System by improving work processes and reducing costs. Some of the projects serve State and Private Forestry and Forest Service Research needs.
As the Pinchot Institute has stated, "the most impor-tant factor influencing trial implementation of a new technology on a Forest ls the identification of spe-cific needs that the technology might satisfy." In the National Forest System, TI is the only organiza-tion responsible for the identificat'ion, development and testing, and implementation of new technology. The following paragraphs describe the six TI development activities and how they affect you.
Geometronics is responsible both for national policy matters and for the development of national systems to support photographic, photograrnmetric, carto-graphic, and other graphic applications. Major development efforts are directed at support of engi-neering, resource planning, and the Geometronics Service Center production operations. Geometronics is rapidly replacing manual methods with computer-assisted methods to produce graphic products, with
I
TERRY GoSSARD FTS 235-8187
ADRIAN PELZNER FTS 235-8030
LEE NORTHCUTT FTS 585-3157
JOHN RICHARDSON FTS 235-1259
HAROLD L. STRICKLAND FTS 235-8046
BOB SWARTHOUT FTS 235-2376
BOONE RICHARDSON FTS 793-8211
RAY ALLISON FTS 235-2138
DALE PETERSEN FTS 235-2378
FARNUM BURBANK FTS 235-2266
PHIL WEBER FTS 525-2081
1COMPUTER SYSTEM COORDINATOR--WO ENGINEERING COORDINATOR FOR ALL COMPUTER SYSTEMS--DEVELOPMENT AND MAINTENANCE.
2REMOTE SENSING COORDINATOR--COORDINATOR FOR ALL USDA FOREST SERVICE REMOTE SENSING ACTIVITIES. 3pESIP ENGINEER--RESPONSIBLE FOR LEADERSHIP IN SELECTING. MONITORING. AND IMPLEMENTING
PROJECTS AS PART OF PROJECT EVALUATION SELECTION IMPLEMENTATION PROCESS (PESIP).
Figure l.--Washington Office personnel responsible for Technological Improvements.
conventional line graphics being replaced by digital data as an operational data base for field use. Because of new technology developed by Geometronics, Forest Service maps now are being produced faster and at a lower cost.
Materials Engineering is responsible for Service-wide geotechnical and materials engineering efforts. The work involves developing geotechnical standards and
2
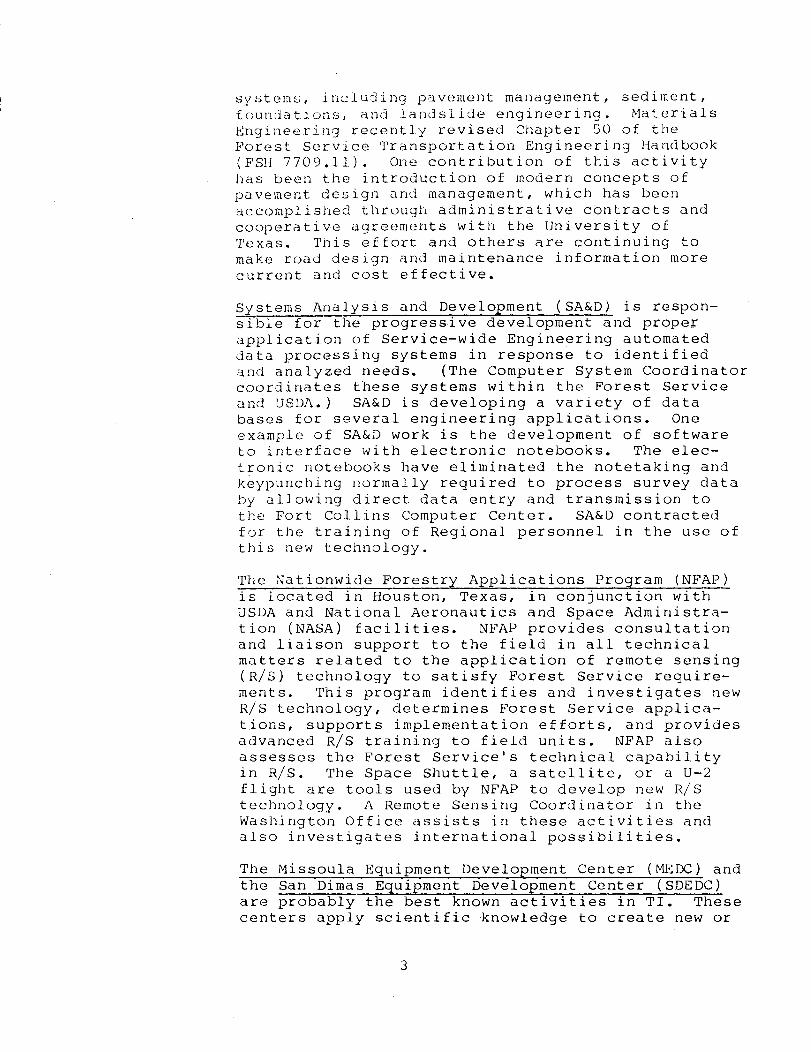
systems, including pavement management, sediment, foundations. and landslide engineering. Materials Engineering recently revised Chapter 50 of the Forest Service Transportation Engineering Handbook (FSH 7709.11). One contribution of this activity has been the introduction of modern concepts of pavement design and management, which has been accomplished through administrative contracts and cooperative agreements with the University of Texas. 1~is effort and others are continuing to make road design and maintenance information more current and cost effective.
Systems Analysis and Development (SA&D) is respon-sible for the progressive development and proper application of Service-wide Engineering automated data processing systems in response to identified and analyzed needs. (The Computer System Coordinator coordinates these systems within the Forest Service and USDA.) SA&D is developing a variety of data bases for several engineering applications. One example of SA&D work is the development of software to interface with electronic notebooks. The elec-tronic notebooks have eliminated the notetaking and keypunching normally required to process survey data by allowing direct data entry and transmission to the Fort Collins Computer Center. SA&D contracted for the training of Regional personnel in the use of this new technology.
The Nationwide Forestry Applications Program (NFAP) is located in Houston, Texas, in conjunction with USDA and National Aeronautics and Space Administra-tion (NASA) facilities. NFAP provides conSUltation and liaison support to the field in all technical matters related to the application of remote sensing (RIS) technology to satisfy Forest Service require-ments. This program identifies and investigates new Rls technology, determines Forest Service applica-tions, supports implementation efforts, and provides advanced Rls training to field units. NFAP also assesses the Forest Service's technical capability in Rls. The Space Shuttle, a satellite, or a U-2 flight are tools used by NFAP to develop new Rls technology. A Remote Sensing Coordinator in the Washington Office assists in these activities and also investigates international possibilities.
The Missoula Equipment Development Center (MEDC) and the San Dimas Equipment Development Center (SDEDC) are probably the best known activities in TI. These centers apply scientific knowledge to create new or
3
WHAT IS PESI P7
substantially improved equipment, systems, materials, processes, techniques, and procedures that will perform a useful function or be suitable to meet the objectives of advanced management and utilization of National Forests. Projects result in cost savings, methods for making work easier and safer for our per-sonnel, or ways of making the environment more enjoy-able for Forest visitors. If you have ever worn a fire shirt or seen a srnokejumper in action, you have seen the products of some of MEDC's work. This work is under contract by Foster-Hiller, Inc., of Boston. A truck-mounted rock rake developed by MEDC is used in more than a dozen Forests. This unit saves signi-ficant road maintenance costs by eliminating a grader for some \vork. SDEDC developed the speci fications for and developed and tested the original spark arrestors on chain saws and heavy equipment, and it continues arrestor compliance testing on a reimbur-sible basis. A current SDEOC project is developing logging system anchors for use in areas where there are no suitable stumps for anchoring yarders or tail-holds. SDEDC is not limited to equipment development and novv is emphasizing civil engineering work to reduce costs.
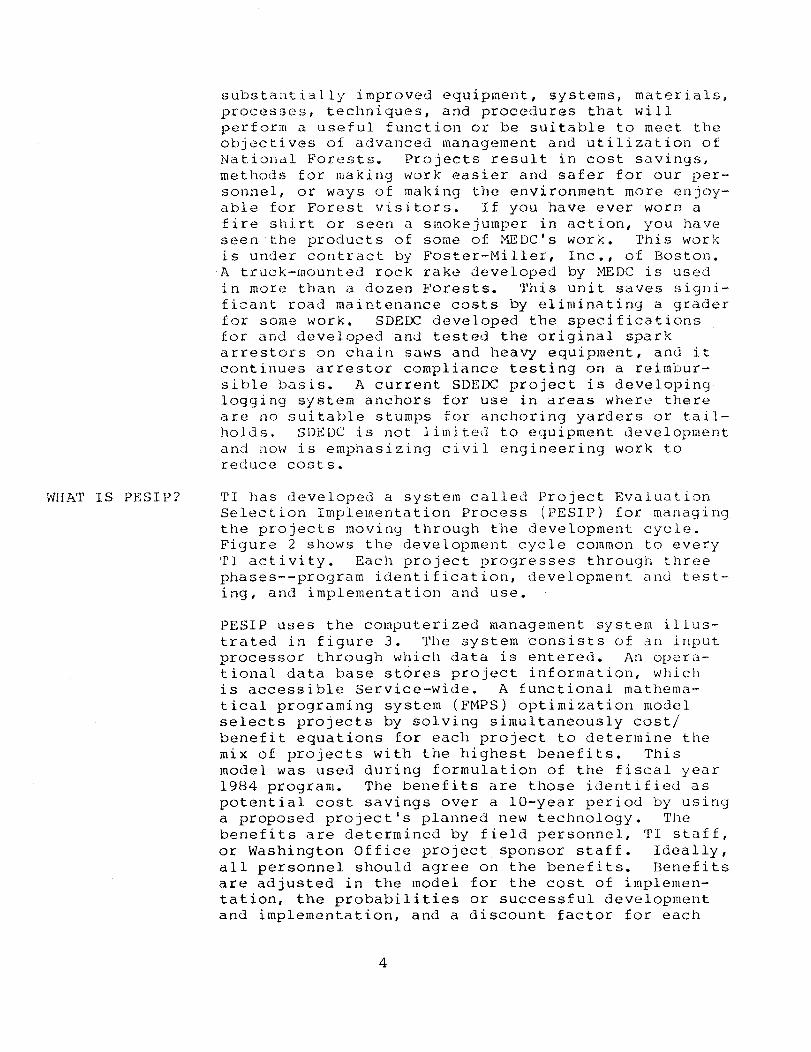
TI has developed a system called Project Evaluation Selection Implementation Process (PESIP) for managing the projects moving through the development cycle. Figure 2 shows the development cycle common to every TI activity. Each project progresses through three phases--program identification, development and test-ing, and implementation and use.
PESIP uses the computerized management system illus-trated in figure 3. The system consists of an input processor through which data is entered. An opera-tional data base st6res project information, which is accessible Service-wide. A functional mathema-tical programing system (FHPS) optimization model selects projects by solving simultaneously cost/ benefit equations for each project to determine the mix of projects with the highest benefits. This model was used during formulation of the fiscal year 1984 program. The benefits are those identified as potential cost savings over a IO-year period by using a proposed project's planned new technology. The benefits are determined by field personnel, TI staff, or Washington Office project sponsor staff. Ideally, all personnel should agree on the benefits. Benefits are adjusted in the model for the cost of implemen-tation, the probabilities or successful development and implementation, and a discount factor for each
4
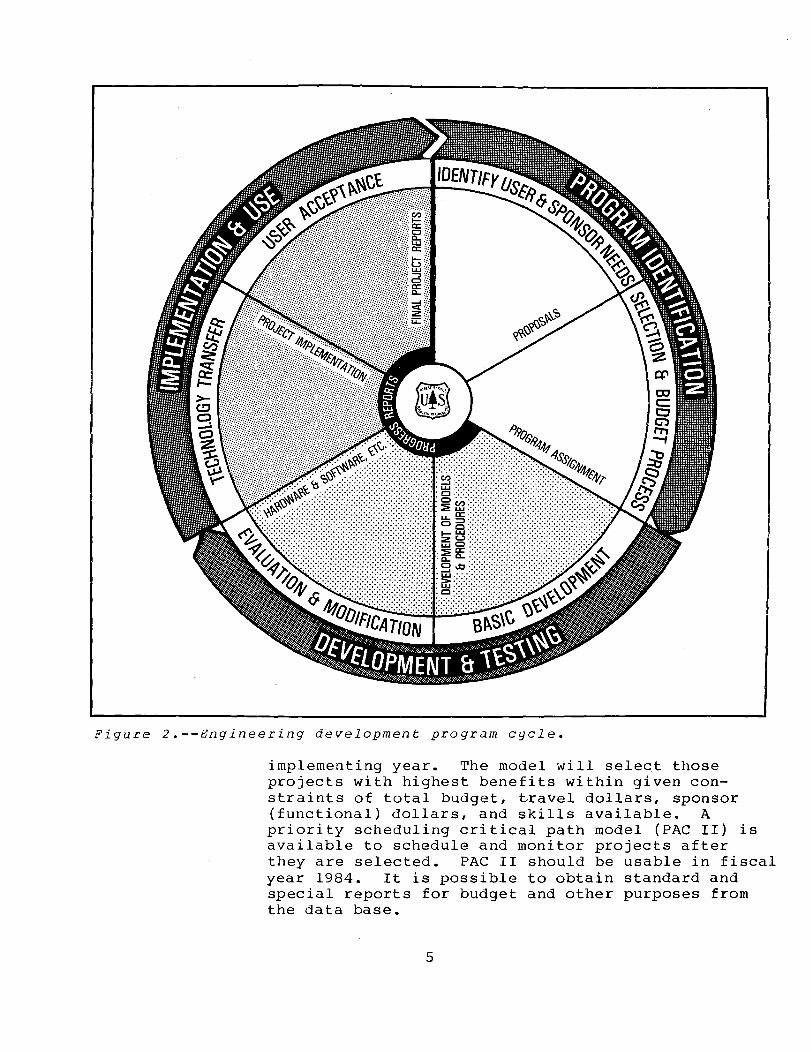
Figure 2.--Engineering development program cycle.
implementing year. The model will select those projects with highest benefits within given con-straints of total budget, Lravel dollars, sponsor (functional) dollars, and skills available. A priority scheduling critical path model (PAC II) is available to schedule and monitor projects after they are selected. PAC II should be usable in fiscal year 1984. It is possible to obtain standard and special reports for budget and other purposes from the data base.
5
MONITOR (6)
. MONITOR PROJECTS &
TASKS ~._-"'---_ (7)
PAClI PLAN
(5)
USER
(1)
INPUT PROCESSOR (2)
PESIP DATA BASE S2K (3)
PLAN PROJECTS &
TASKS ~ __ ---. (7)
STANDARD & SPECIAL REPORTS ____ ~-.......... (7)
FMPS SELECTION
MODEL
SELECT PROJECTS
(4)
KEYS TO OPERATION (1) ENTER DATA (2) INTERACTIVE PROMPTED (3) STORE DATA (FILES) (4) SELECT PROJECTS (5) PLAN TASKS/PROJECTS (6) MONITOR & REPLAN
TASKS/ REPORTS (7) OBTAIN REPORTS
Figure 3.--The PESIP selection and management system.
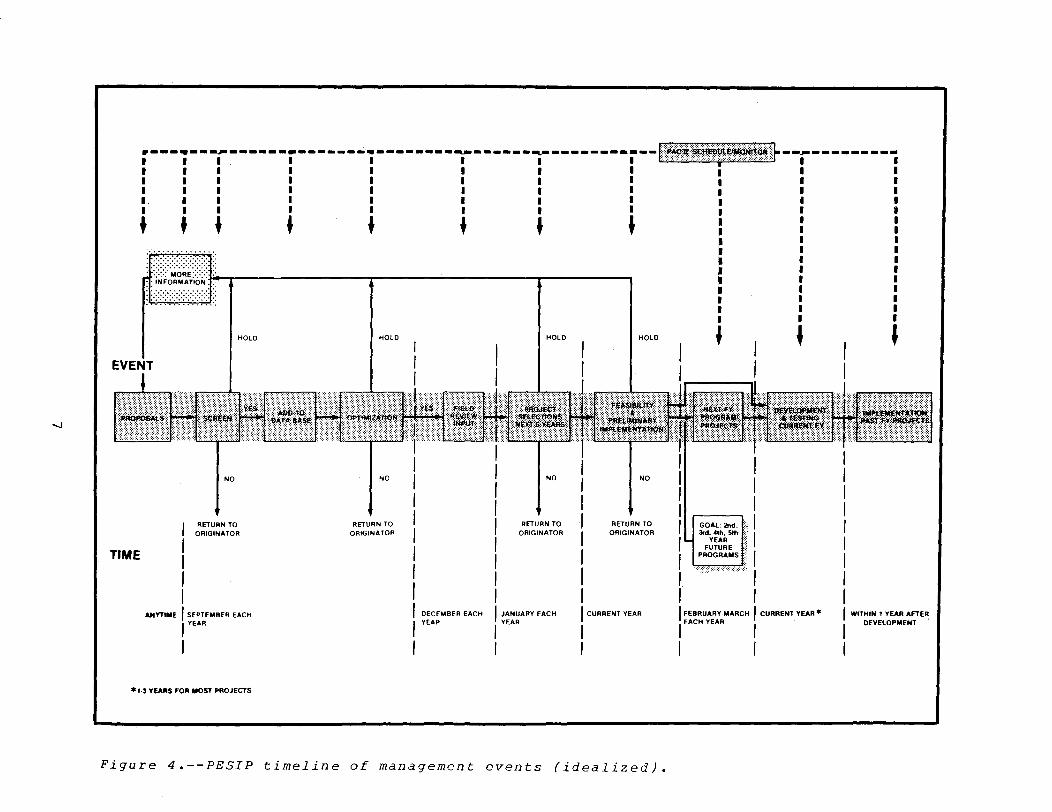
As shown in figure 4, PESIP can be thought of as a timeline of management events. Proposals can be con-sidered anytime from anyone; but, ideally, potential sponsors screen the proposals before adding them to the data base. Preliminary optimization runs tenta-tively select projects before field reviewers vali-date the input and comment on the results. Final optimization runs, field input, and sponsor recom-mendations determine future-year programs of selected projects. The goal is to have a 5-year program with strongly supported projects. Feasibility reports and preliminary implementation plans should provide more data to judge future,projects,before beginni~gd f development and testlng. Project plans provl e or
6
r ----:---i - - - - - - i - - - - - - -i - - - - - - - -.-- - - - -.-- - - - - - -i - -liir:m$mm~&.~;· r ------------III 1 1 1 1 1 I III 1 I I 1 1 1 III 1 1 1 I 1 1 I. 1 1 I 1 I I I I I I I I I I I I I . .. . . . . . :
TIME
HOLD
NO
RETURN TO ORIGINATOR
ANYTIME I SEPTEMBER EACH I YEAR
I
.'·3 'fEAIIS FOR MOST PROJECTS
HOLD
NO
RETURN TO ORIGINATOR
DECEMBER EACH YEAR
HOLD
NO
RETURN TO ORIGINATOR
I JANUARY EACH I YEAR
I
HOLD
NO
RETURN TO ORIGINATOR
I CURRENT YEAR
I I
Figure 4.--PESIP timeline of management events (idealized).
I I 1 1 1
•
GOAL: 2nd, 3rd. 4th, 5th
YEAR FUTURE
PROGRAMS
I FEBRUARY· MARCH I CURRENT YEAR· I EACH YEAR I I
WITHIN' YEAR AFTER DEVELOPMENT
FIELD INPUT DUE in DECEMBER
FUTURE ART ICLES on TI ACTIVITIES & PROJECTS
implementation to begin immediately following devel-opment and testing in order to gain the predicted benefits. PAC II is intended to plan and monitor all the events in the timeline.
Field input is a very important part of the PESIP process. For the past 2 years, the Washington Office has solicited new project proposals and suggestions regarding exciting proposals. In December, field personnel will once again have this opportunity. What is needed is validation of benefits for existing project proposals and submission of new proposals. This is an opportunity to use TI for solving some of your project work problems. TI's unwritten goal is to have a minimum of 80 percent of its projects strongly supported by the field to improve day to day operations. Twenty percent of the projects should involve future-oriented ideas to keep the Forest Service" ahead technologically. We very much want your ideas and input to solve both near-term and long-term problems. Feel free to discuss future possibilities with any of the Staff shown in figure 1.
We hope this article will give you a better under-standing of Forest Service technology and will encourage you to become involved by contributing your ideas. In the past, articles about specific TI projects have appeared in Field Notes, and we will continue to contribute information about new tech-nological developments.
8
INTRODUCTION
DESCRIPT ION of PROGRAMS
The HP-41 CV Electronic Notebook System
Randy J. Lunsford Civil Engineer Deschutes National Forest Region 6
The Hewlett-Packard HP-4lCV hand-held programmable calculator has been successfully programed for use in the field as an electronic notebook. The HP-4lCV Electronic Notebook System practically eliminates errors associated with current methods of gathering and reducing data. T'he HP-4lCV also can be programed to reduce some data in ~ne field, such as traverse closure.
Road design field data gathered by conventional survey methods can be entered directly into the calculator's storage. The HP-4ICV can store 600 topography shots (that is, rod elevation and dis-tance readings, and comments) in its internal storage or can store an unlimited amount of numbers or alpha characters onto a tape with a cassette recorder. These data can be transferred directly into any other computer for data processing, thus saving time for data entry by manual methods.
In the field, the HP-41CV can print a copy of all its stored data with the use of a small portable thermal printer. This allows the user to field check data and to generate a "hard copy" of the field data collected.
In June 1982, the Deschutes National Forest created an interface between the HP-4ICV and the HP-9845 minicomputer. During the summer and fall of 1982, Region 6 field tested this system on the Willamette, Malheur, and Deschutes National Forests. Results show the system to be potentially inexpensive and of practical use for the Forest Service.
Several programs have been written to aid the road surveyor in data collection. The existing programs, written in Hewlett-Packard's BASIC-type language, are for cross sections, levels, and traversing, utilizing several different survey methods. In the
9
~oncept stagG of progrlmin~ are timber programs for cruisi.n], scalinJ', 3.n,1 nurser:y oprations.
'Vhe programs are written with questions or prompts that ask tht:.:! user for the next data entry. This simplifies tne amount of time it takes to train an operator and reduces errors.
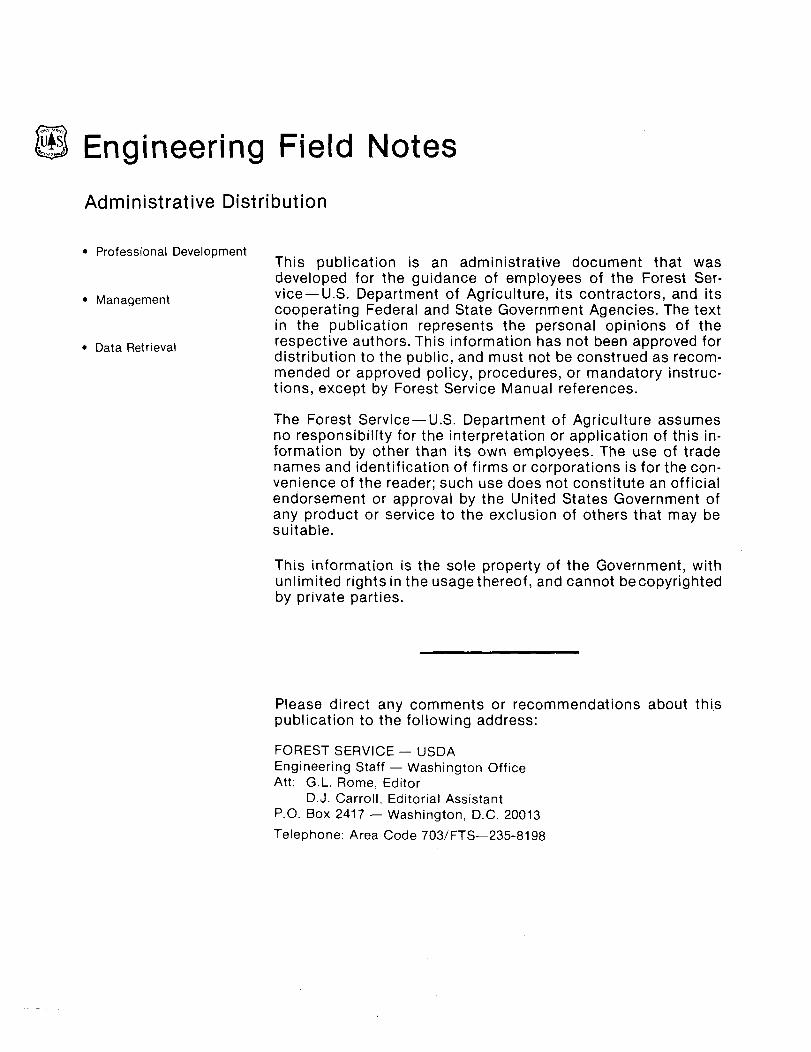
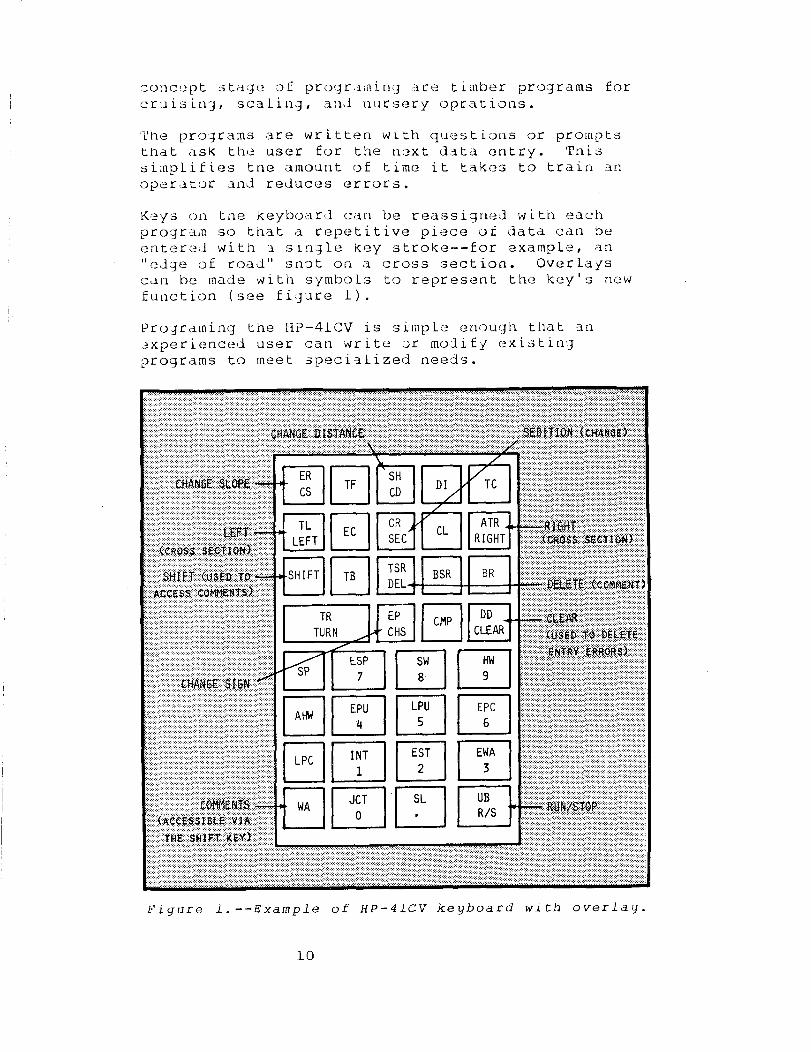
Keys on tne keyboard can be reassigned with each progra~ so that a repetitive piece of data can be entered with ~ sio]le key stroke--for example, an "eJge of road" sn:Jt on a cross section. Overlays can be made with symboLs to represent the key's new function (see fiJure 1).
Pro]raming the HP-41CV is simple enough that an 2xperienced user can write Jr modify existinJ programs to meet specialized needs.
Figure l.--Example of HP-41CV keyboard with overlay.
10
HARDWARE DESCRIP'rION
The following hardware is needed to use the HP-41CV as an electronic notebook:
HP-4lCV. The HP-41CV is a small, portable calculator/ computer with 2,233 programmable bytes. The memory storage contains 319 registers, but can be expanded by 600 re,)isters with the use of an "extended func-tion" module and two "extended memory" modules. These I-inch by I-inch modules plug into the end of the HP-41CV. When using the HP-41CV as an electronic notebook, the main memory is used for the program storage, and the extended function module and the extended memory modules are used for data storage.
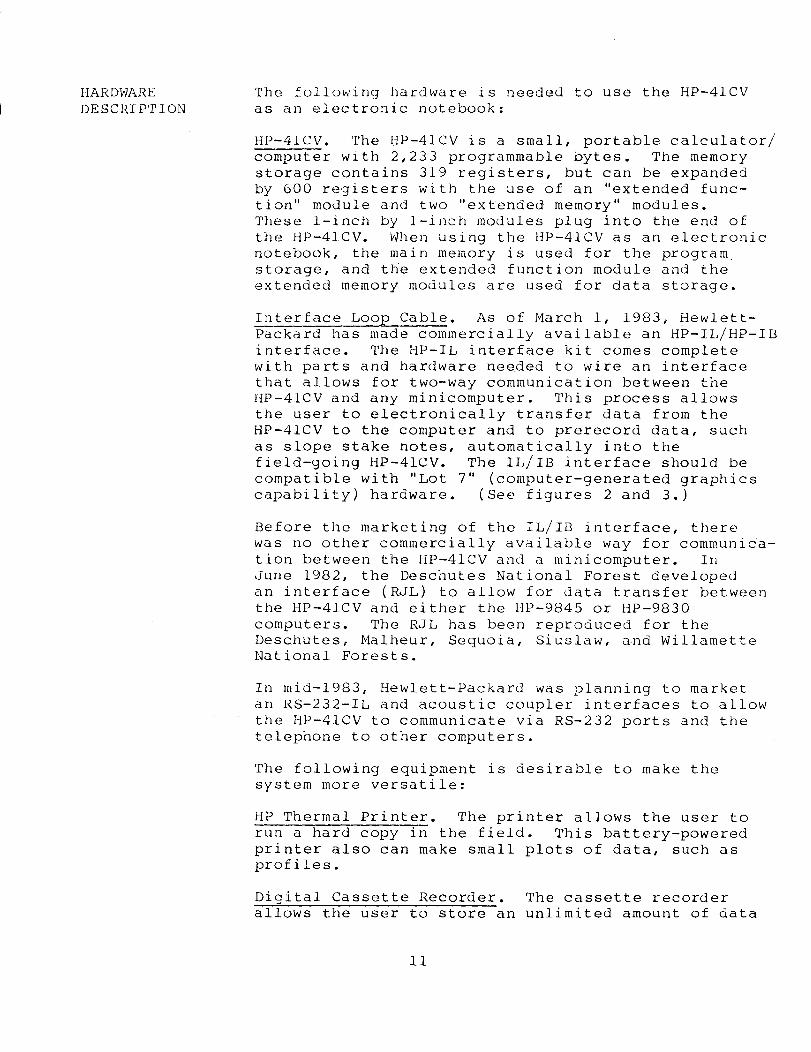
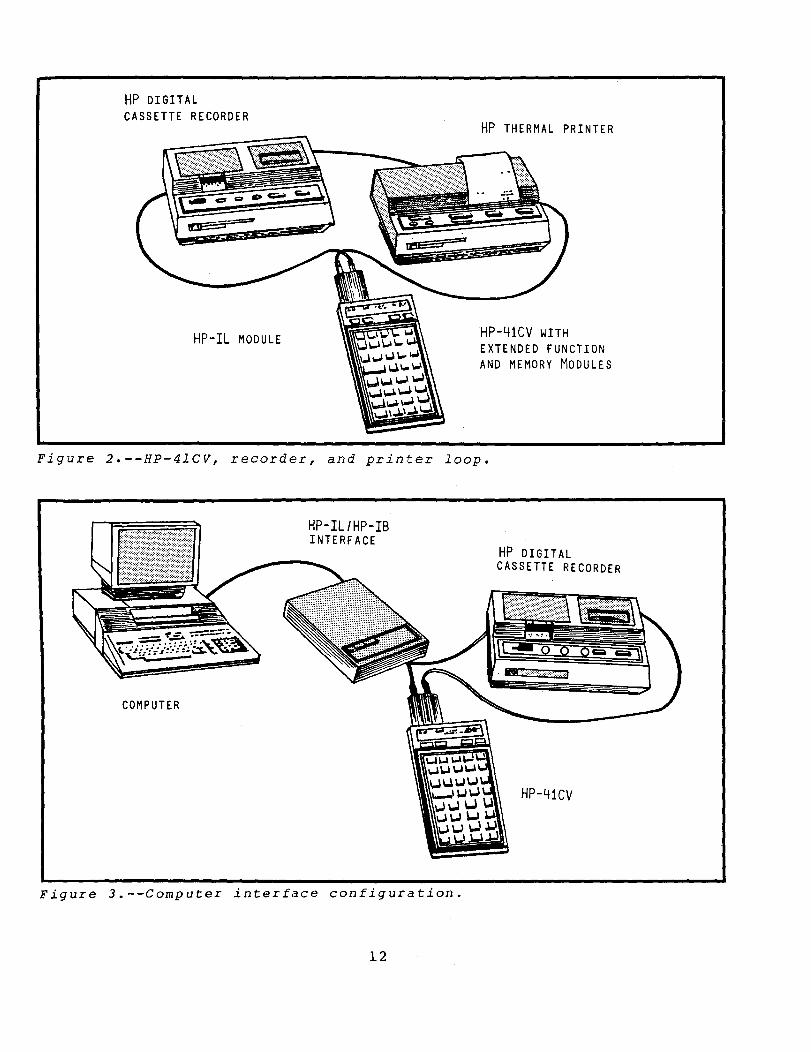
Interface Loop Cable. As of March 1, 1983, Hewlett-Packard has made commercially available an H~-IL/HP-IB interface. The HP-IL interface kit comes complete with parts and hardware needed to wire an interface that allows for two-way communication between the HP-4ICV and any minicomputer. This process allows the user to electronically transfer data from the HP-4lCV to the computer and to prerecord data, such as slope stake notes, automatically into the field-going HP-4lCV. The IL/IB interface should be compatible with "Lot 7" (computer-generated graphics capability) hardware. (See figures 2 and 3.)
Before the marketing of the IL/IB interface, there was no other commercially available way for communica-tion between the HP-4lCV and a minicomputer. In June 1982, the Deschutes National Forest developed an interface (RJL) to allow for data transfer between the HP-4lCV and either the HP-9845 or HP-9830 computers. The RJL has been reproduced for the Deschutes, Malheur, Sequoia, Siuslaw, and Willamette National Forests.
In mid-1983, Hewlett-Packard was planning to market an RS-232-IL and acoustic coupler interfaces to allow the HP-41CV to communicate via RS-232 ports and the telephone to other computers.
The following equipment is desirable to make the system more versatile:
HP Thermal Printer. The printer allows the user to run a hard copy in the field. This battery-powered printer also can make small plots of data, such as profiles.
Digital Cassette Recorder. The cassette recorder allows the user to store an unlimited amount of data
11
HP DIGITAL CASSETTE RECORDER
HP-IL MODULE
HP THERMAL PRINTER
HP-41CV WITH EXTENDED FUNCTION AND MEMORY MODULES
Figure 2.--HP-41CV, recorder, and printer loop.
COMPUTER
HP-III HP- IB INTERF ACE
Figure 3.--Computer interface configuration.
12
HP DIGITAL CASSETTE RECORDER
HP-41CV
FIELD TESTS
and programs. Each cassette tape has the capability of storing 131,000 bytes of data (approximately 160 miles of cross-section data). The user can store each day's data cumulatively onto tapes to be dumped at convenience into a larger computer.
Card Reader. A card reader is a small portable device that allows the user to store programs on magnetic cards. The data on these cards can be entered directly into the HP-41CV's program memory. If programs could be standardized nationally, they could be prerecorded into a read-only memory (ROM) module. The ROM would be inserted into one of the ports of the HP-41CV, and the user would instantly have all the programs in the HP-41CV program memory.
An interface was built for both the HP-9830 and HP-9845 computers on the Malheur, Willamette, Deschutes, and Sequoia National Forests. The HP-41CV users who were fami~iar with the calculator learned to use the system with little difficulty, but users new to the calculator took longer. One of the problems with the electronic notebook concept is fear by the user that everything might suddenly dis-appear. Because of internal checks and the reassign-ment of keys during program operation, data cannot be unintentionally altered or lost.
At present, 1 mile of road survey data has been gathered using the HP-41CV in the field. The test-ing proved, in most cases, that the user could enter data faster, more easily, and more legibly into the HP-41CV than into a standard notebook. During the testing, the weather conditions varied from dusty to rainy. No problems or loss of data occurred during these tests.
The HP-41CV Electronic Notebook System can be and has been successfully used as an intel,ligent computer terminal. The test Forests have found the system to pay for itself in a short time by utilizing the HP-41CV system as a remote terminal for data entry. This usage allows several users to be keypunching data at the same time i~to HP-41CVs, thereby allowing the larger computers to be used for design and other organization use. A combinatioq of 4 miles of data have been entered on the test Forests via this process, with no problems or loss of data. Further testing and analyzing willb~ conducted during the 1984 summer season •
13
OTHER USES
COST
CONCLUSION
The HP-41CV is a powerful hand-held programmable calculator/computer. Its use as an electronic notebook eliminates the need to purchase calcula-tors. The HP-41CV has numerous programs available, ranging from surveying to accounting, microchemistry to games. Because it is easily programed, it can nandle many problems. (The HP-41CV also can be pro-gramed to be self-teaching, thus reducing training needs.) In addition, as discussed earlier, the HP-41CV can be used as a computer terminal. Using the HP-41CV as a multipurpose unit greatly increases cost savings.
The total cost for the field unit is $377. The total cost for a field station is an additional $602. These prices include Government discounts. The prices of the equipment could be reduced if bought in quantity. The unit cost breakdown is shown in table 1.
Using the HP-41CV Electronic Notebook System for field and office use rias proven effective in reduc-ing errors and costs associated with the present methods of collecting, transferring, and reducing data. This has been accomplished through programed prompts that simpli fy data entry by guiding the user through the data collection. The use of manual and programed internal checks also eliminates chances for errors. Combine these advantages of error reduc-tion with the time savings of collecting and trans-ferring data and freeing computer time, and the result is a time- and cost-saving idea. The HP-41CV appears to be an excellent use of Forest Service time and funds.
14
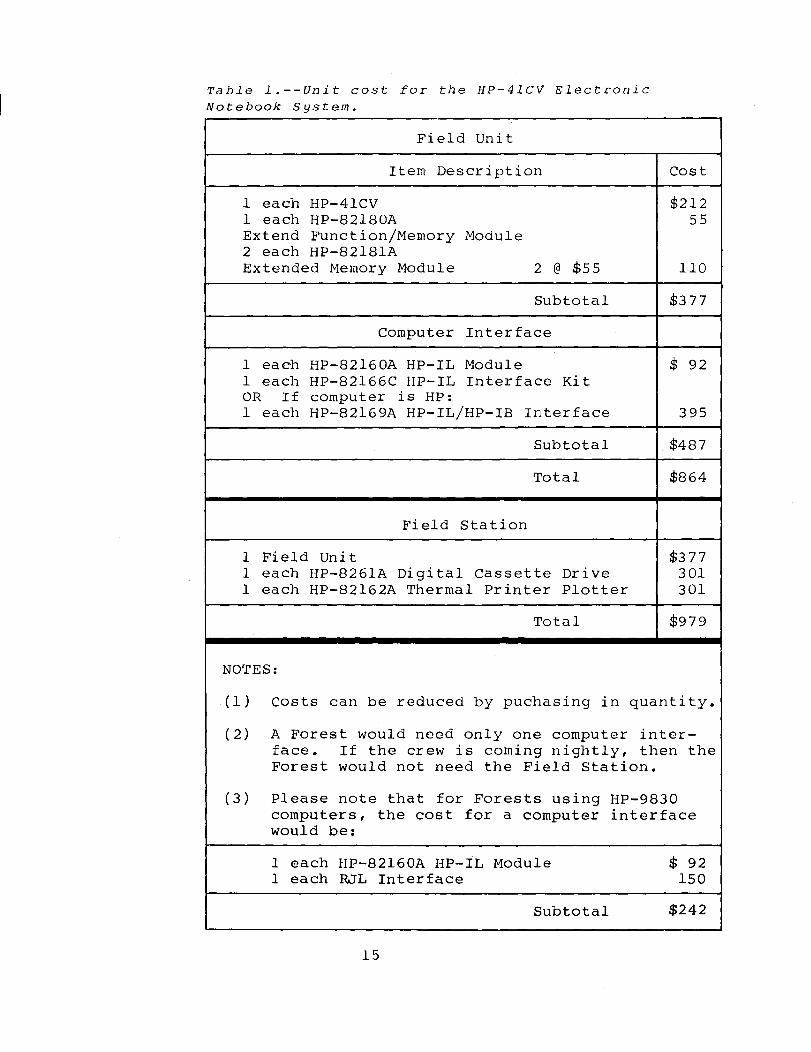
Table l.--Unit cost for the HP-4lCV Electronic Notebook System.
Field unit
Item Description
1 each HP-4lCV 1 each HP-82180A Extend Function/Memory Module 2 each HP-82l81A Extended Memory Module 2 @ $55
Subtotal
Computer Interface
1 each HP-82160A HP-IL Module 1 each HP-82166C HP-IL Interface Kit OR If computer is HP: 1 each HP-82169A HP-IL/HP-IB Interface
Subtotal
Total
Field Station
1 Field Unit 1 each HP-8261A Digital Cassette Drive 1 each HP-82162A Thermal Printer Plotter
Total
NOTES:
Cost
$212 55
110
$377
$ 92
395
$487
$864
$377 301 301
$979
(1 ) Costs can be reduced by puchasing in quantity.
( 2) A Forest would need only one computer inter-face. If the crew is coming nightly, then the Forest would not need the Field Station.
( 3 ) please note that for Forests using HP-9830 computers, the cost for a computer interface would be:
1 each HP-82160A HP-IL Module $ 92 1 each RJL Interface 150
Subtotal $242
15

INTRODUCTION
PROGRAM DEVELOPMENT
"Subdivision" Program for the HP-41C
Robert A. Grauberger Land Surveyor Plumas National Forest Region 5
The "Ordinance of May 20, 1785" established the rectangular system for surveying the public lands of the United States. Since then, surveyors continually have been confronted with the mathematical computa-tions for subdividing sections into their aliquot parts. Because very few, if any, sections laid out by the original surveyors are true square miles, the US Bureau of Land Management's "Manual of Instruc-tions for the Survey of the Public Lands of the United States" describes specific methods for deter-mining the positions of subdivisional corners. The computations required by this process not only are redundant and time consuming, but also are very sus-ceptible to human error. In an effort to alleviate somE" of these problems, the "Subdivision" program ("SUB") was developed for the Hewlett-Packard HP-41C calculator.
In early 1980, the Cadastral Survey Department of the Plumas National Forest purchased its first HP-41C calculator. It became apparent while designing pro-grams for reducing field,data that the system was capable of handling much more sophisticated problems. Because the majority of landline projects on the Forest required sectional subdivisions, an attempt was made to develop a program that could automati-cally determine coordinate positions for desired subdivisional corners from established section and quarter-section corner coordinates.
The first step in developing,this program was to decide on a coding system to identify the individual corners. Initially, it was thought some type of coordinate system would be easiest to manipulate. However, this type of system had several shortcomings that became obvious almost immediately; therefore, a totally different approach was taken. The system specified in the user's manual for identifying
17
RUNNING the PROGRAM
corners by quadrants or cardinal directions became the basis for deriving a number code compatible with the program function.
Once a coding system was conceived, the second step was to write a program, within the limits of the HP-4lC, that could properly manipulate the input data. Several unsuccessful attempts were made before Hewlett-Packard marketed the "quad" memory module. With the added data and program storage afforded by this single module, the HP-4lC was then capable of holding a program that could subdivide any section in a township, including sections in the north and west tiers, with the exception of Section 6, elon-gated sections, and fully lotted sections. Because almost all the available data and program storage were required by the program and the program was applicable in all but a few cases, no further effort was made to incorporate subroutines to handle the excepted sections.
The final step in program development was to format the input and output of data. The alphanumeric fea-tures of the HP-4IC lend themselves to full prompting and labeling. Thus, the user simply follows the prompts for input as requested by the program, and the output data is displayed with proper labels. To conserve program steps, a card read function is used during initial steps to store alpha characters neces-sary for corner labeling. The card reader, as well as the printer, are an essential part of the system.
To operate the program, the user sizes the calculator to 67 data registers. The program then is loaded into the calculator from magnetic cards or a mass storage device. When the "SUB" program is executed, the prompt "LABELS" appears in the display. The user then inserts a prerecorded "LABELS" data card in the card reader. The program next asks the user if the section is not in the north or west tier. If the section is in the north or west tier, prompts for the proper record distances will appear; for other sec-tions, these prompts will be inhibited. Program execution continues with a series of prompts request-ing coordinate values for each of the section and quarter-section corners. No information need be entered for section corners not involved with the subdivision or quarter-section corners that require prorating between section corners. Completion of the initial routine results in a prompt for the code of the desired corner.
18
SAMPLE RUN
PROGRAM IMPROVEMENTS
If any quarter-section corners require prorating, the positions should be determined before proceeding to subordinate subdivisional corners. The code for each quarter-section corner is entered, and the proration subroutine is executed. The coordinates are calcu-lated, stored as initial input, and displayed as labeled output. When all prorating is complete, the program is ready to perform the sectional sUbdivision.
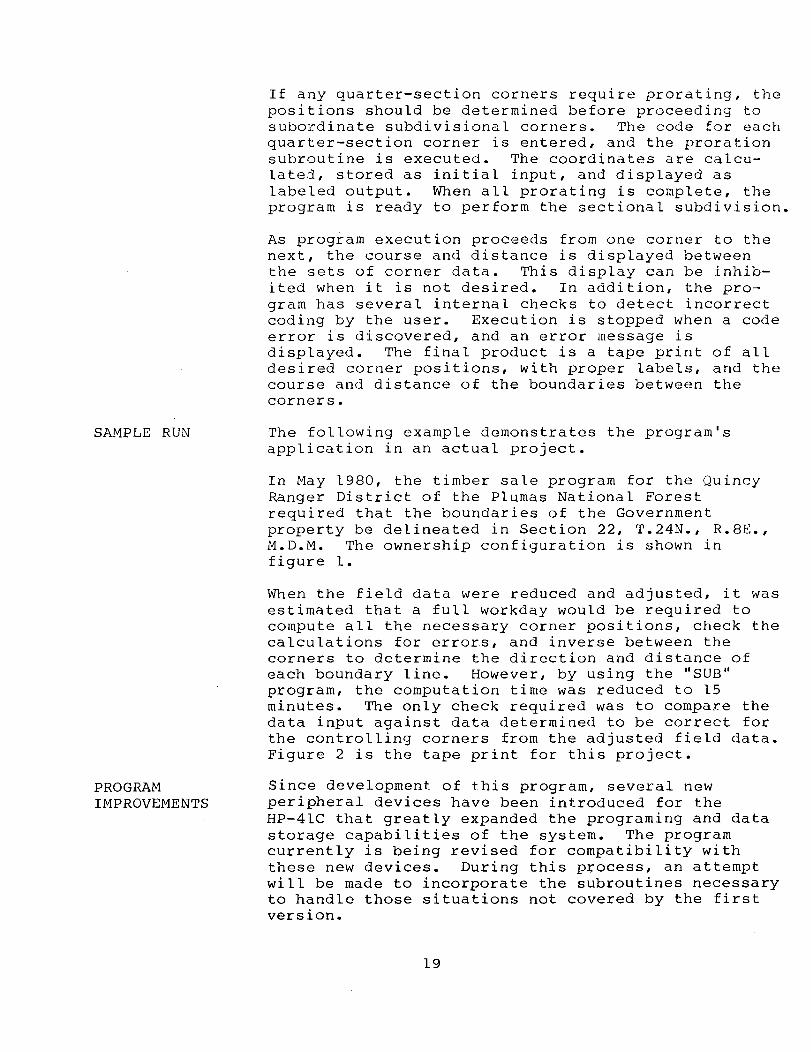
As program execution proceeds from one corner to the next, the course and distance is displayed between the sets of corner data. This display can be inhib-ited when it is not desired. In addition, the pro-gram has several internal checks to detect incorrect coding by the user. Execution is stopped when a code error is discovered, and an error message is displayed. The final product is a tape print of all desired corner positions, with proper labels, and the course and distance of the boundaries between the corners.
The following example demonstrates the program's application in an actual project.
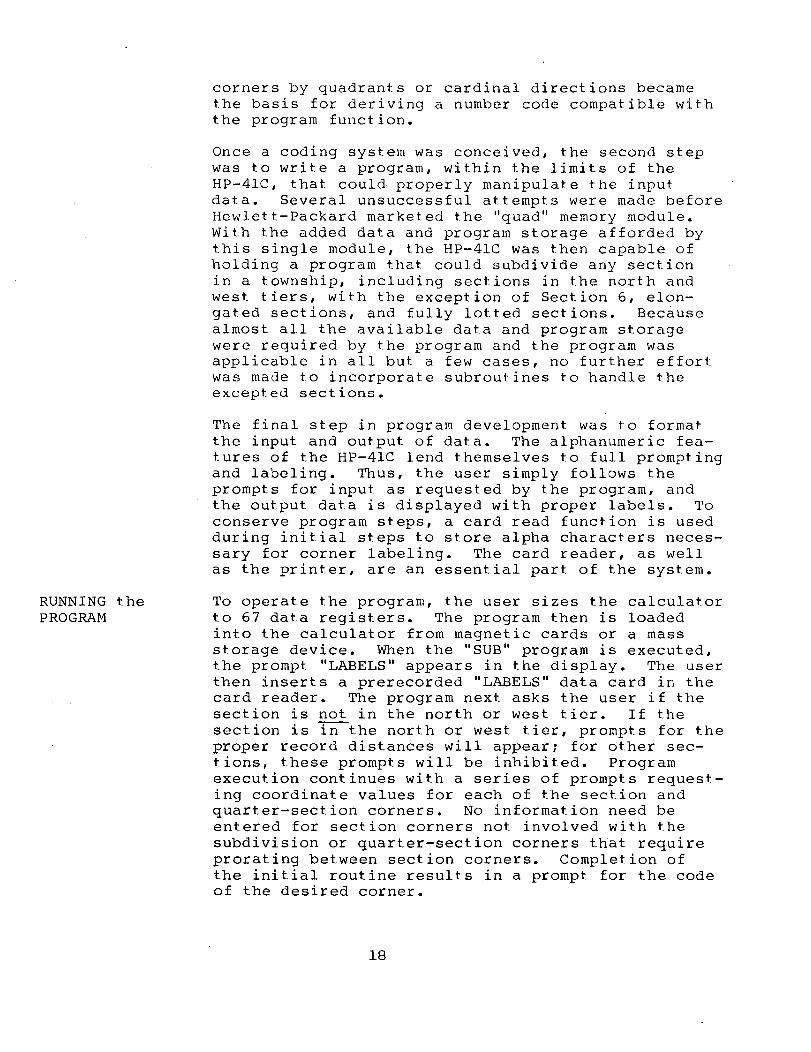
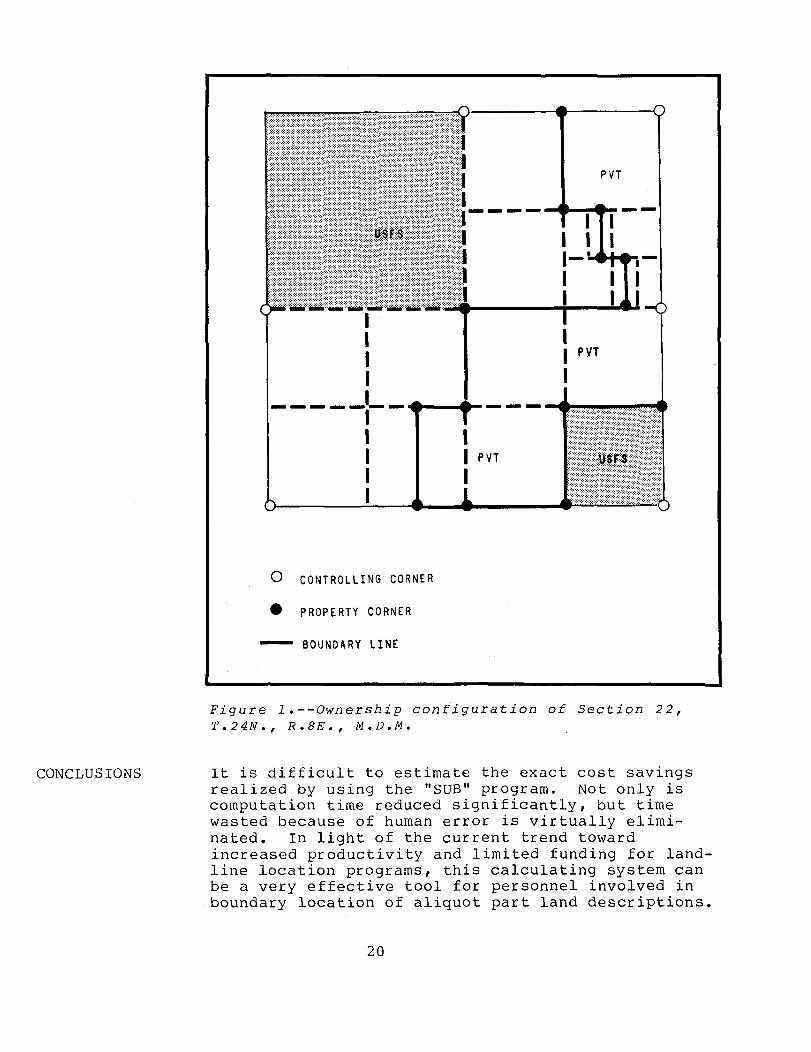
In May 1980, the timber sale program for the Quincy Ranger District of the Plumas National Forest required that the boundaries of the Government property be delineated in Section 22, T.24N., R.8E., M.D.M. The ownership configuration is shown in figure 1.
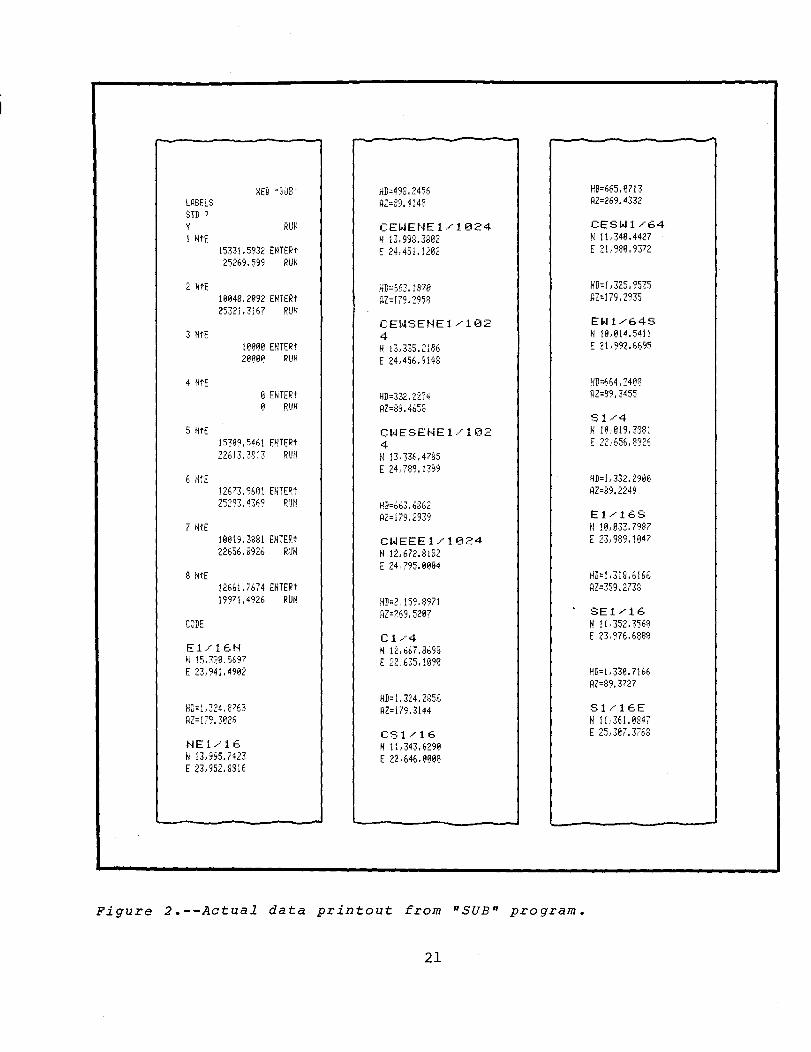
When the field data were reduced and adjusted, it was estimated that a full workday would be required to compute all the necessary corner positions, check the calculations for errors, and inverse between the corners to determine the direction and distance of each boundary line. However, by using the IISUB II program, the computation time was reduced to 15 minutes. The only check required was to compa~e the data input against data determined to be correct for the controlling corners from the adjusted field data. Figure 2 is the tape print for this project.
Since development of this program, several new peripheral devices have been introduced for the HP-41C that greatly expanded the programing and data storage capabilities of the system. The program currently is being revised for compatibility with these new devices. During this process, an attempt will be made to incorporate the subroutines necessary to handle those situations not covered by the first version.
19
CONCLUSIONS
I I I
- - - - _1- _ "-..-.4 ___ _ I I I I I
I I PVT
I
() CONTROLLING CORNER
• PROPERTY CORNER
---- BOUNDARY LINE
PVT
...-41 .... ....-4 .... --
I I PYT
I
Figure 1.--0wnership configuration of Section 22, T.24N., R.BE., M.D.M.
It is difficult to estimate the exact cost savings realized by using the "SUB" program. Not only is computation time reduced significantly, but time wasted because of human error is virtually elimi-nated. In light of the current trend toward increased productivity and limited funding for land-line location programs, this calculating system can be a very effective tool for personnel involved in boundary location of aliquot part land descriptions.
20
LH.8ELS
v RUN 1 NtE
3 HtE
5 HtE
7 litE
B HtE
CODE
15331 ~ 5932 EH TE~'-t· 25269.59'3 RUN
laa43.2en EHTERt 25321. 3167 RUN
10eee ENTERt 2ee0e RiHl
e EHTER·t e RUN
1539'3.5461 EHTERt 22613.381.3 RUH
12673.9601 EtHER·t 25293.4369 RUN
101319,3881 EHTERt 22656.15926 RUN
12661. 7674 Elm~t 19'371.4926 RUN
El/16N H 15_,320.5697 E n,941.49B2
HD= 1.. 324,8763 HZ= 179.3026
NE1/16 N 13.,995.7423 E 23,952.8816
HD=498.2456 AZ=89.4148
CE~..jENE 1./ 1024 N 13 .. 998.3802 E 24,451. 1262
HD=66].i8?8 \lZ=f?9.2958
CE\>.ISE"'~E 1./ 102 4 N 13 .. 335.2186 E 24,456.9148
HD=332.2274 R2=8'3.465B
CWESE"'~E 1./ 102 4 H 13,336.4785 E 24.,78'3.1399
Hfi=663.6262 R2=i79.2939
CWEEE1/1024 H 12,672.8182 E 24,795.ge94
HD=2,159.8971 RZ=269.5207
C1.---A N 12,667. 869S E 22,635.1i3'30
HI!= 1 , 324.28% 112=179.3144
CS1/16 N 11,343.6290 E 22.,646. eeeB
Figure 2.--Actual data printout from "SUB" program.
21
HD=665.0713 112=269.4]32
CES~..j1 /64 NIL 340.4427 E 21..9159.9372
fiD=L 325.9535 142=179.2935
EW 1-/64S N 19,014.5411 E 2L 99V;,&9S
HD=664.2413:3 AZ=S9.3455
S1,-'4 N 1e,819.3881 E 22 .. 656.:392f,
HD= 1, 332. 2'j% A2=89.2249
E1-----16S H lB,e33.7987 E 23..989.1047
HD=L31B.6166 AZ=359.ms
SE1/16 II 11.352,356:3 E 23..976.6888
HD=L33fJ.7166 AZ=89.3727
Sl/16E N 1 1..36 J.e84? E 2S} 387.3768
persons interested in receiving more information about the "SUB" program should contact:
Robert A. Grauberger plumas National Forest P.O. Box 1500 Quincy, California 95971 Telephone: (916) 283-2050
22
ORIGINS
A Partner in Equipment Development
Farnum M. Burbank Mechanical Engineer Equipment Development Group Washington Office
During the past 35 years, several special interest groups have been associated with the Forest Service's Equipment Development Group, effectively using our skills for evaluating and developing unique equip-ment. Some groups functioned satisfactorily for a few years, then disbanded. However, one has per-sisted since 1946 and has proven its value year after year. Officially, this group does not exist; it is so loosely structured that it should not have survived; and it is so informal that there is no possibility of its achieving anything useful or being recognized for its contributions. Yet, the group's record of accomplishment during the past 37 years has been outstanding. I am describing the Vegetation Rehabilitation and Equipment Workshop (VREW), a true partner to Equipment Development.
Back in 1946, some 15 to 20 range specialists got together to share their knowledge and exchange infor-mation about range seeding equipment. Recognizing the need for effective and suitable equipment, they decided to form a committee to tackle the problem. Within a short time, the group became known as the Interagency Range Seeding Equipment Committee.
When the American Society of Range Management (later, the Society for Range Manageme~t) was founded in 1948,' the Interagency Range Seeding Equipment Commi t-tee began holding meetings just prior to and in the same location as the Society's annual meeting. Since many Equipment Committee participants were members of the Range Society, this scheduling stimulated attendance at both meetings, and this relationship has continued to this day.
Membership and participation grew and its composi-tion varied over the years. In the Department of Agriculture, membership has included the Agricul-tural Research Service, Forest Service, Extension
23
OBJECTIVES & ACTIVITIES
Service, Soil Conservation Service, and the Agri-cultural Stabilization and Conservation Service; in the Department of the Interior, it has included the Bureau of Land Management, Bureau of Indian Affairs, Bureau of Reclamation, and the Fish and wildlife Service. Representation has included various State agencies (fish and game departments, highway depart-ments, and universities and other educational insti-tutions); industrial representatives (chemical, equipment, mining, and seed companies); ranchers: and--more recently--environmental consultants. Many countries, including Australia, Canada, Mexico, and South Africa, also have participated.
The broad objectives of the VREW have been to keep abreast of the field of commercially developed equip-ment, to make modifications as required for adapta-tion to wildland use, and to develop equipment not commercially available. Generally, the work can be described as evaluating commercially available equip-ment: identifying development needs; developing specifications and standards: arranging for construc-tion; evaluating results: disseminating information; and implementing the successful equipment.
The Workshop is divided into a number of active work groups that develop proposals, monitor project prog-ress, assist in field testing, and report accom-plishments. Names of these work groups include Exploratory; Information; Seeding and Planting; Plant Materials; Seed Harvesting: Steep Slope Stabi-lization; Disturbed Land Reclamation; and Mechanical, Chemical, and Thermal Plant Control. Over the years, other work groups have evolved as they were needed, operated as long as necessary, then disbanded.
The Forest Service Equipment Development Centers at San Dimas, California, and Missoula, Montana, nor-mally handle project work on equipment development or evaluation activities. These professionally staffed engineering organizations were chartered by the Forest Service to help resource managers be more effective and efficient through mechanization and improved systems and techniques. This effort, how-ever, is not limited to the Development Centers. Cooperative work is undertaken with private industry; research is conducted at universities: and &rajJD~projects and evaluations are being executed by field personnel.
The Forest Service, the Bureau of Land Management, and the Bureau of Indian Affairs provide most of the
24
EQUIPMENT DEVELOPED
financial support. In addition, these agencies and other organizations also contribute considerable time and equipment to field testing and evaluation. Based on agency needs and priorities, specific proj-ect proposals may be financed through the Workshop. For private companies with identified needs for equipment development, there are procedures for cooperative financing.
Before discussing our most recent activities, I would like to mention a few examples of equipment developed by the Interagency Range Seeding Equipment Committee. Most of this equipment ,was associated with range improvement work, which received heavy emphasis beginning in the mid-forties. One of the first items developed was the Rangeland Drill, which is still in demand. A version of a farm grain drill, this drill is very heavy and has independently sprung furrow arms for use on rough, irregular terrain. The Brush-land Plow, a close second in popularity, is an adap-tation of the Australian Stump-Jump Plow, with each disk arm separately sprung for use in heavy brush. Each arm can lift over an obstruction without rais-ing the entire plow. Contour trenching, .which has been studied freque~tly, brought about such devices as modified front-end plows: a small Holt Plow: the Rocky Mountain Disk Trencher; and a contour furrower that furrows, dams, seeds, and fertilizes in one operation.
In addition, the Committee has developed a great variety of seeders: the seed dribbler, interseeder, browse seeder, and various types of broadcast seeders. The collection of browse seed has long been a problem, and several attempts have been made to develop a device to collect a variety of seeds under adverse conditions. The Committee developed one truck-mounted piece of equipment, and we are still working on a backpack unit. Much activity has focused on control of sagebrush and other plant species, developments in aerial applica-tion equipment and techniques, and ground sprayers for chemicals. However, with the recent criticism surrounding the use of chemicals, greater emphasis has been placed on mechanical methods of brush con-trol. We evaluated several types of brush cutters and crushers for various terrains and conditions, and we found thermal treatment useful in small areas for sagebrush and small conifer control. This list could go on, but these few examples show the great diversity of our endeavors and how they led us into even broader aspects of rehabilitation work.
25
NEW DIRECTIONS
CONCLUSION
In the early seventies, there was a rapidly growing interest in, and demand for, rehabilitation of disturbed lands--largely stemming from the envi-ronmental concerns connected with strip mining.
Because of our many years of experience in range improvement, we were suddenly called upon to help in related disturbed vegetation problems. It immedi-ately became obvious that a new role was evolving for the Committee. Therefore, in 1973, the Committee changed its name to the Vegetative Rehabilitation and Equipment Workshop and instituted a new work group on Disturbed Land Reclamation. Since then, the overall program has become quite heavily oriented toward stabilization of disturbed lands, although project work continues on range improvement equipment.
Through equipment development efforts, the VREW produced a gouger that dlspenses seeds as it builds basins; refined the Vermeer Tree Spade to transplant trees in rough terrain (as well as a transporter to make the operation economically feasible); evaluated the Howard Rotovator for mixing additives; modified a commercial manure spreader to dispense hay; built a new basin blade and a plug planter; and developed a large sod mover. Smaller, more localized devices also have been developed for disturbed land operations.
In summary, the VREW has been a true partnership between resource managers and engineers in equipment development. As mentioned earlier, it has been an informal group--no charter, bylaws, or direction by a single agency; yet, the results have been signifi-cant. Perhaps the cooperative spirit engendered by the Workshop is as important as any of its achieve-ments. It is a classic example of what can be accomplished if no one is too concerued about who gets the credit!
26
INTRODUCTION
MEASU REMENT TECHNIQUE
A Method of Measuring Road Surface Wear
Clinton L. Armstrong Civil Engineer Kaibab National Forest Region 3
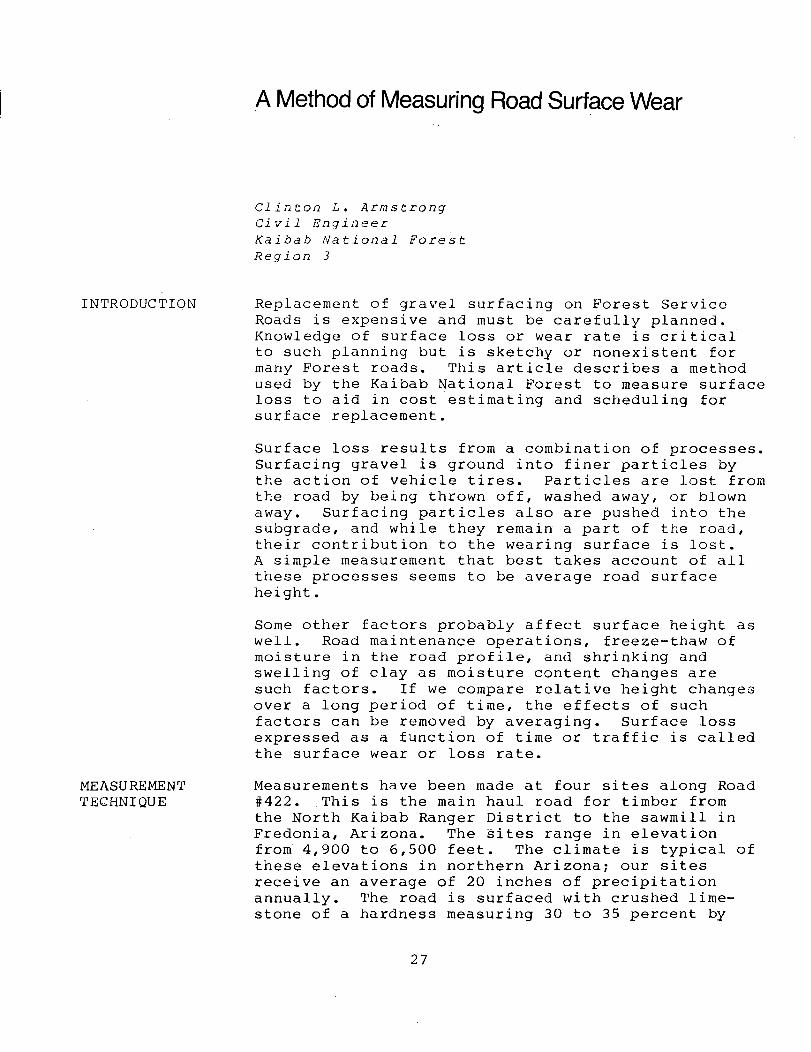
Replacement of gravel surfacing on Forest Seivice Roads is expensive and must be carefully planned. Knowledge of surface loss or wear rate is critical to such planning but is sketchy or nonexistent for many Forest roads. This article describes a method used by the Kaibab National Forest to measure surface loss to aid in cost estimating and scheduling for surface replacement.
Surface loss results from a combination of processes. Surfacing gravel is ground into finer particles by the action of vehicle tires. Particles are lost from the road by being thrown off, washed away, or blown away. Surfacing particles also are pushed into the subgrade, and while they remain a part of the road, their contribution to the wearing surface is lost. A simple measurement that best takes account of all these processes seems to be average road surface height.
Some other factors probably affect surface height as well. Road maintenance operations, freeze-thaw of moisture in the road profile, and shrinking and swelling of clay as moisture content changes are such factors. If we compare relative height changes over a long period of time, the effects of such factors can be removed by averaging. Surface loss expressed as a function of time or traffic is called the surface wear or loss rate.
Measurements have been made at four sites along Road #422. This is the main haul road for timber from the North Kaibab Ranger District to the sawmill in Fredonia, Arizona. The sites range in elevation from 4,900 to 6,500 feet. The climate is typical of these elevations in northern Arizona; our sites receive an average of 20 inches of precipitation annually. The road is surfaced with crushed lime-stone of a hardness measuring 30 to 35 percent by
27
DATA ANALYSIS
the Los Angeles Abrasion Test. The e~isting surfacing was 6 inches thick and 40 feet wide when it was placed in 1969. Since then, it has received traffic of about 38 million board feet per year, plus 200 vehicles per day of associated light traffic. A 2S0-day use season from April through December is normal. Much of the original surfacing has now worn away.
The measurement sites were selected to best meet the following criteria: safety for survey crew (good traffic visibility); most representative of whole road; uniformity of surfacing material over measure-ment section; inclusion of straight, curved, sloped, and flat sections; and a range of elevations, which in the long term would lead to a range of temperature and moisture conditions. More than four sites would have taken too much survey time, while fewer than four might have produced too little information to be dependable.
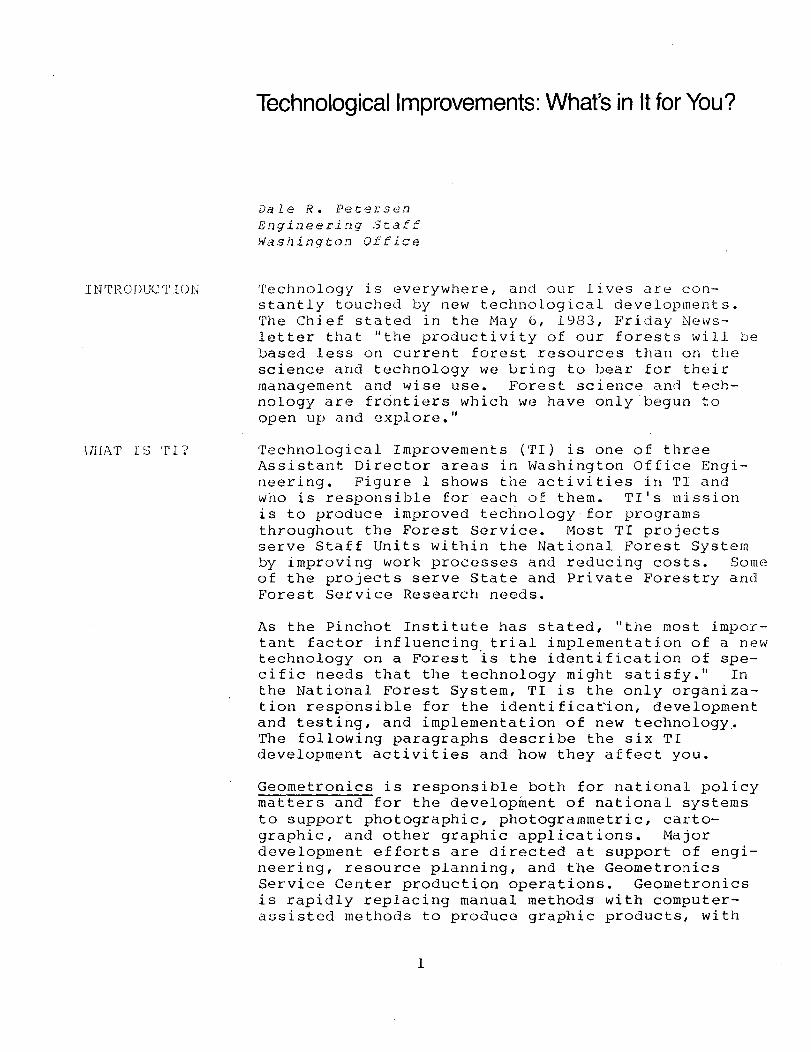
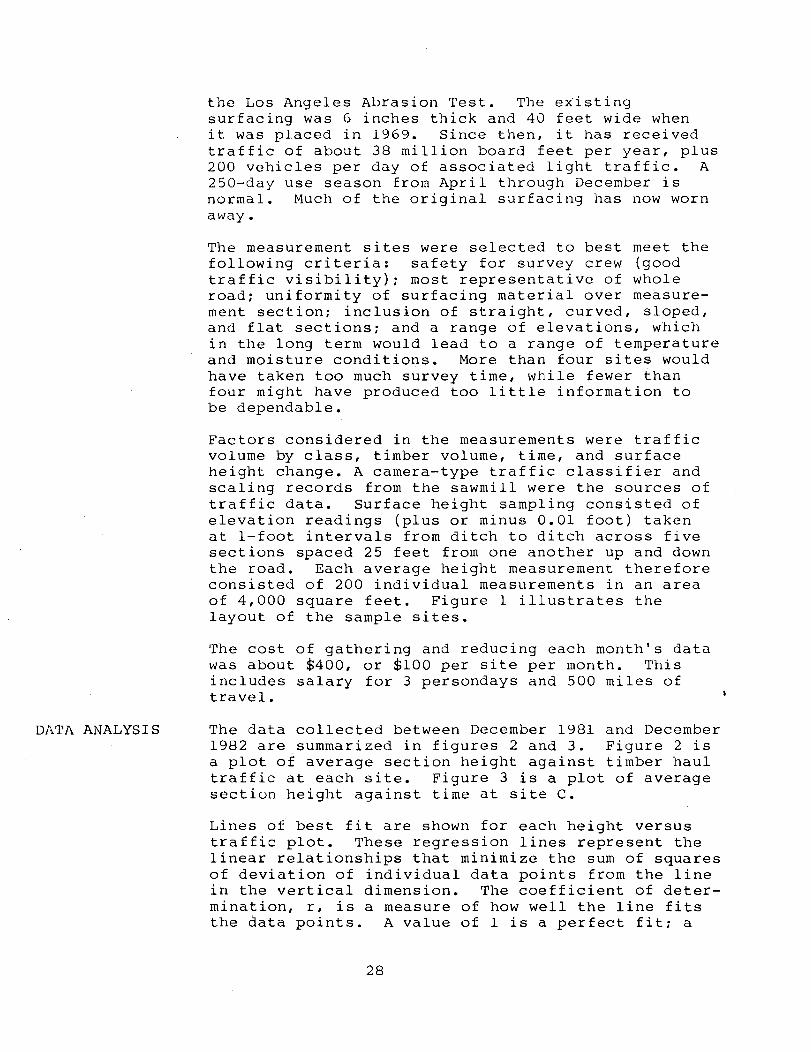
Factors considered in the measurements were traffic volume by class, timber volume, time, and surface height change. A camera-type traffic classifier and scaling records from the sawmill were the sources of traffic data. Surface height sampling consisted of elevation readings (plus or minus 0.01 foot) taken at I-foot intervals from ditch to ditch across five sections spaced 25 feet from one another up and down the road. Each average height measurement therefore consisted of 200 individual measurements in an area of 4,000 square feet. Figure 1 illustrates the layout of the sample sites.
The cost of gathering and reducing each month's data was about $400, or $100 per site per month. This includes salary for 3 persondays and 500 miles of travel.
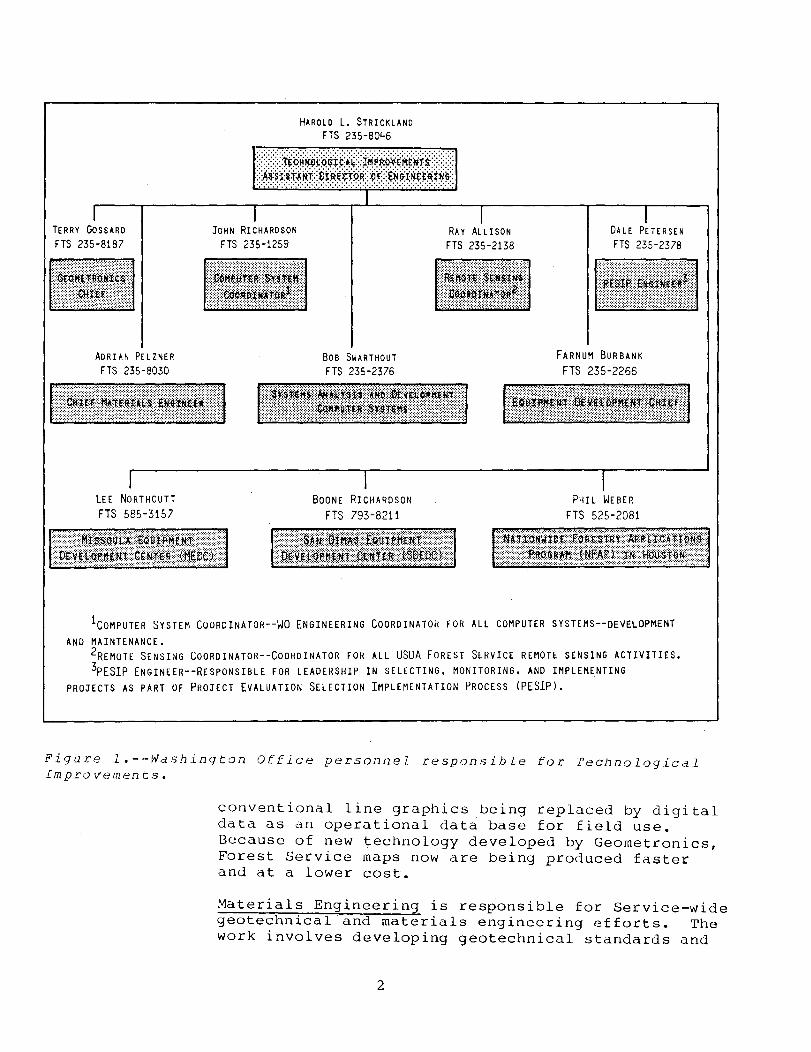
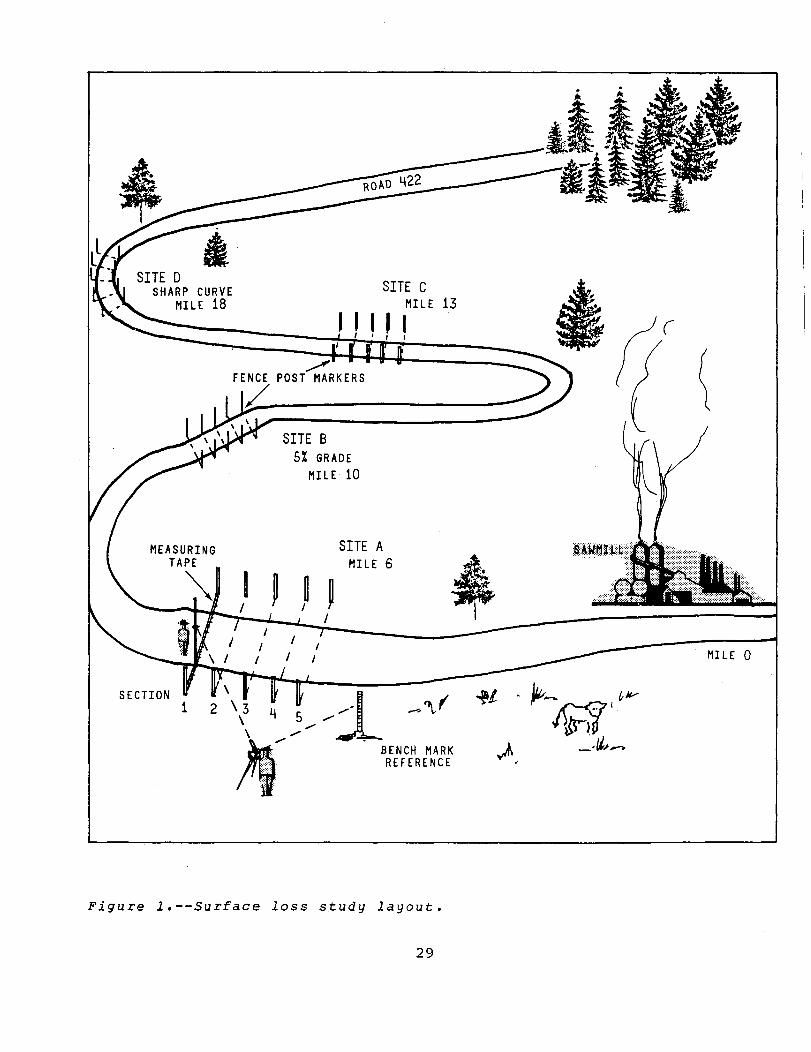
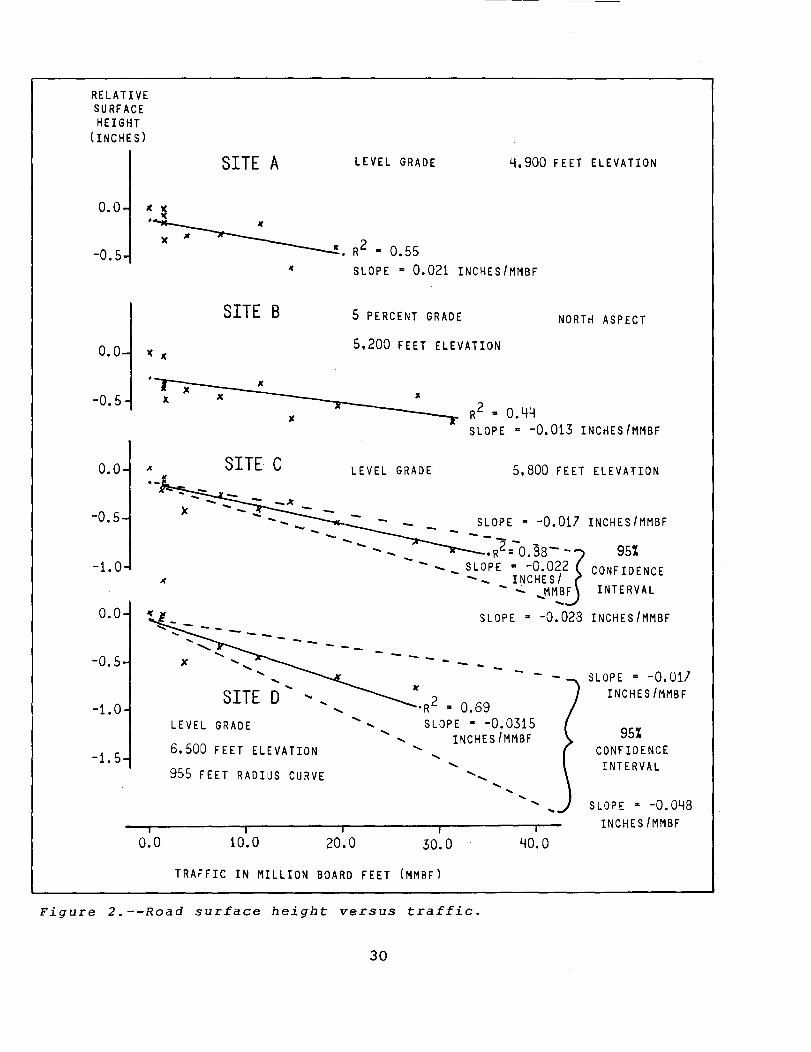
The data collected between December 1981 and December 1982 are_summarized in figures 2 and 3. Figure 2 is a plot of average section height against timber haul traffic at each site. Figure 3 is a plot of average section height against time at site c. Lines of best fit are shown for each height versus traffic plot. These regression lines represent the linear relationships that minimize the sum of squares of deviation of individual data points from the line in the vertical dimension. The coefficient of deter-mination, r, is a measure of how well the line fits the data points. A value of 1 is a perfect fit; a
28
./'" FENCE POST MARKERS
SITE B 5% GRADE
MILE 10
SITE A
SITE C
MILE 6
13
£.. ~ ---------------j
SECTION \
2 \3 4 5 .,; ,.. ....... ~ I
11\ .............. ...)-4--
BENCH MARK REFERENCE
Figure l.--Surface loss study layout.
29
MILE 0
RELATIVE SURFACE HEIGHT
(INCHES)
0.0
-0.5
0.0 l( J(
'-r-x-
SITE A
SITE B
It
-0.5 II x
It
0.0 " SITE C .-
-0.5 )C
-1. 0 )(
0.0
--- ---0.5 )C
.... .... ...
~~~~--
LEVEL GRADE ~.900 FEET ELEVATION
1(, R2 .. 0.55
J(
SLOPE ~ 0.021 INCHES/MMBF
5 PERCENT GRADE NORTH ASPECT
5.200 FEET ELEVATION
LEVEL GRADE
R2 .. 0.44 T SLOPE a -0.013 INCHES/MMBF
5.800 FEET ELEVATION
lLOPE = -0.017 INCHES/MMBF
- - - - - :,2'-0.38-J 951 - - - _ SLOPE .. -0.022 CONFIDENCE
- _ INCHES / - ..:.. _MMBF INTERVAL -SLOPE" -0.023 INCHES/MMBF
--- - -- - - SLOPE .. -0.017 " INCHES/MMBF
-1.0 SITE D ... 'R 2 .. 0.69 .....
LEVEL "- SLOPE .. -0.0315 GRADE .... 95% "- INCHES/MMBF ....
6.500 FEET ELEVATION "- CONFIDENCE -1. 5 .... ..... INTERVAL 955 FEET RADIUS CURVE .......... .... .... .... SLOPE" -0.048 .... ..
i I INCHES/MMBF 0.0 10.0 20.0 30.0 ~O.O
TRAFFIC IN MILLION BOARD FEET (MMBF)
Figure 2.--Road surface height versus traffic.
30
RELATIVE SURFACE HEIGHT
(INCHES)
0.0
·-0.5
--1. 0
( -
o
SLOPE" 0.33 INCHES/YEAR
I(
N co (J) ......
o N
r ¥ ......
R2 .. 0.53
100 200
SLOPE· 0.99 INCHES/YEAR
HEAVY TIMBER HAUL BEGAN
JUNE 1, 1982
300
If) ...... IX: ..... al ~ ..... N u co ..... (J) 0 ......
400 TIME (DAYS)
Figure 3.--Surface height change at site C as an effect of heavy traffic.
value of 0 is no linear relationship at all. Many scientific calculators can be easily programed to calculate these regression parameters.
It is possible to statistically define limits of con-fidence in the slope of these lines. In the case of sites C and D, we can be 95 percent confident that the true line slope is contained in the interval between -0.017 inch per million board feet (in/MMBF) and -0.028 in/MMBF and between -0.017 in/MMBF and -0.048 in/MMBF, respectively. The data from sites A and B show less definite relationships between the road height and traffic. However, it can be shown with 95 percent confidence that the slope of the regression line is not zero, but rather some nega-tive value. The conclusion here is that the road is wearing because of traffic; exactly how much we do not know. The best estimate of wear rate is still the slope of the line of best fit.
It could be argued that surface loss is a function of time and weather--that is, wind and rain erosion carry away the surfacing regardless of traffic. Figure 3 puts this argument in perspective. It
31
CONCLUSIONS
shows that the rate of surface loss with heavy truck traffic in6reases nine times over that resulting from normal erosion with light traffic. Both erosional forces and traffic are necessary for high rates of loss. This idea is consistent with our description of the wear process where large particles must be ground up by traffic before wind or water can remove them.
Comparing plots of site C (a straight section of road) and site D (a sharp curve) there seems to be a 45-percent higher rate of wear on the curve. The precise difference is not known, but a difference can be statistically proven.
We can conclude that there is surface loss occurring on Road #422. It is caused in large part by heavy vehicular traffic. The best estimate of the rate of loss is 0.022 inch per million board feet on straight, flat sections. This rate is somewhat greater on sharp curves.
Factors such as surfacing material hardness, rainfall and wind erosivity, and vehicle characteristics, to mention a few, can have such a large effect on wear rate that extrapolation of this data to other roads is not recommended.
The methods just described do, however, offer a straightforward and economical means for a Forest to estimate wear rates for their unique conditions.
32
~
DAM NAME
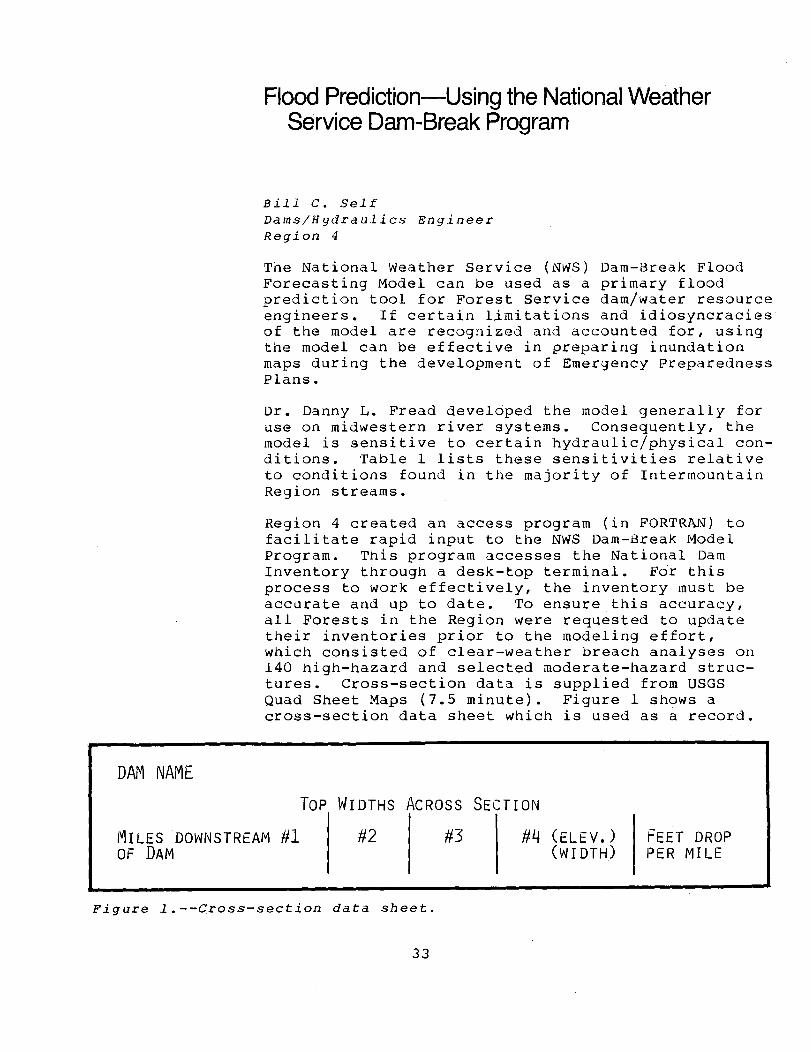
Flood Prediction-Using the National Weather Service Dam-Break Program
Bill C. Self Dams/Hydraulics Engineer Region 4
The National Weather Service (NWS) Dam-Break Flood Forecasting Model can be used as a primary flood prediction tool for Forest Service dam/water resource engineers. If certain limitations and idiosyncracies of the model are recognized and accounted for, using the model can be effective in preparing inundation maps during the development of Emergency Preparedness Plans.
Dr. Danny L. Fread developed the model generally for use on midwestern river systems. Consequently, the model is sensitive to certain hydraulic/physical con-ditions. Table I lists these sensitivities relative to conditions found in the majority of Intermountain Region streams.
Region 4 created an access program (in FORTRAN) to facilitate rapid input to the NWS Dam-Break Model Program. This program accesses the National Dam Inventory through a desk-top terminal. For this process to work effectively, the inventory must be accurate and up to date. To ensure this accuracy, all Forests in the Region were requested to update their inventories prior to the modeling effort, which consisted of clear-weather breach analyses on 140 high-hazard and selected moderate-hazard struc-tures. Cross-section data is supplied from USGS Quad Sheet Maps (7.5 minute). Figure 1 shows a cross-section data sheet which is used as a record.
Top WIDTHS ACROSS SECTION
MILES DOWNSTREAM #1 OF DAM
#2 #3 #4 (ELEV.) (WIDTH)
FEET DROP PER MILE
Figure l.--Cross-section data sheet.
33

Table l.--Comparison of sensitivities of NWS Dam-Break Model to conditions in the Intermountain Region.
Physical Influences
Stream slope
Channel width
Variation of channel course
Model Favors
Gentle, no rapid changes, slopes usually constant or exhibit moderate changes of constant nature
Very little dramatic change
Change gentle and winding channel course
Intermountain Region
Severe rapid changes, common flow frequently can go critical, sub-critical, or super-critical
Dramatic changes common; narrow canyons to open valleys; front conditions
Narrow canyons with abrupt changes
Result
Mannings "N" number adjustment necessary; in cases where dramatic changes were not accepted by model, use of "N" value of 0.15 may be.come necessary
Increase ~n x-section frequency; may have to use false channels in some cases
Increase in x-section frequency; adjust flow by raising Manning's "N" value
The access program is as follows:
By executing a processor, then interacting with it. @M*I.S R4-DAM-BREAK/ANALYSIS LIBRARY INDEX SYSTEM TYPE A FOLLOWING SUBJECT, OR STOP, AND/OR DEPRESS RETURN *
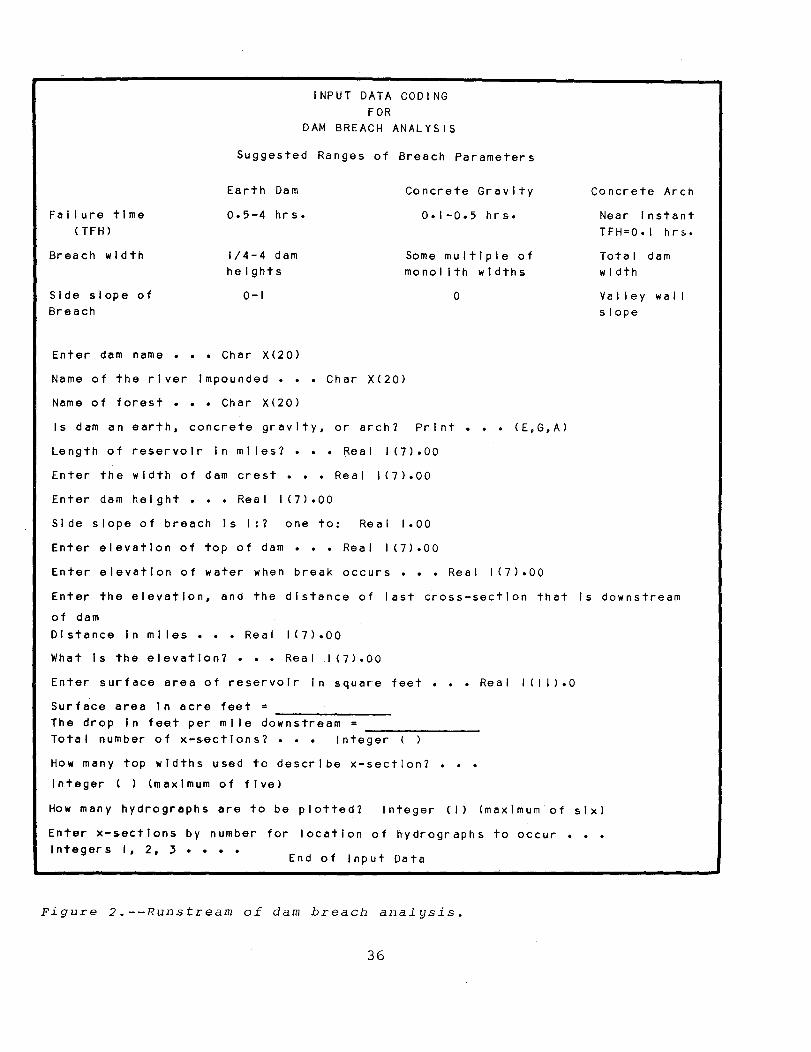
The runstream shown in figure 2 compiles and executes a program to solicit information from the user, and it produces a keypunch format and actual data to be punched as input to the National Weather Service Dam-Break Program. This program will compute the values for the input data according to the card format on the NWS DAM-Break Flood Forecasting model program.
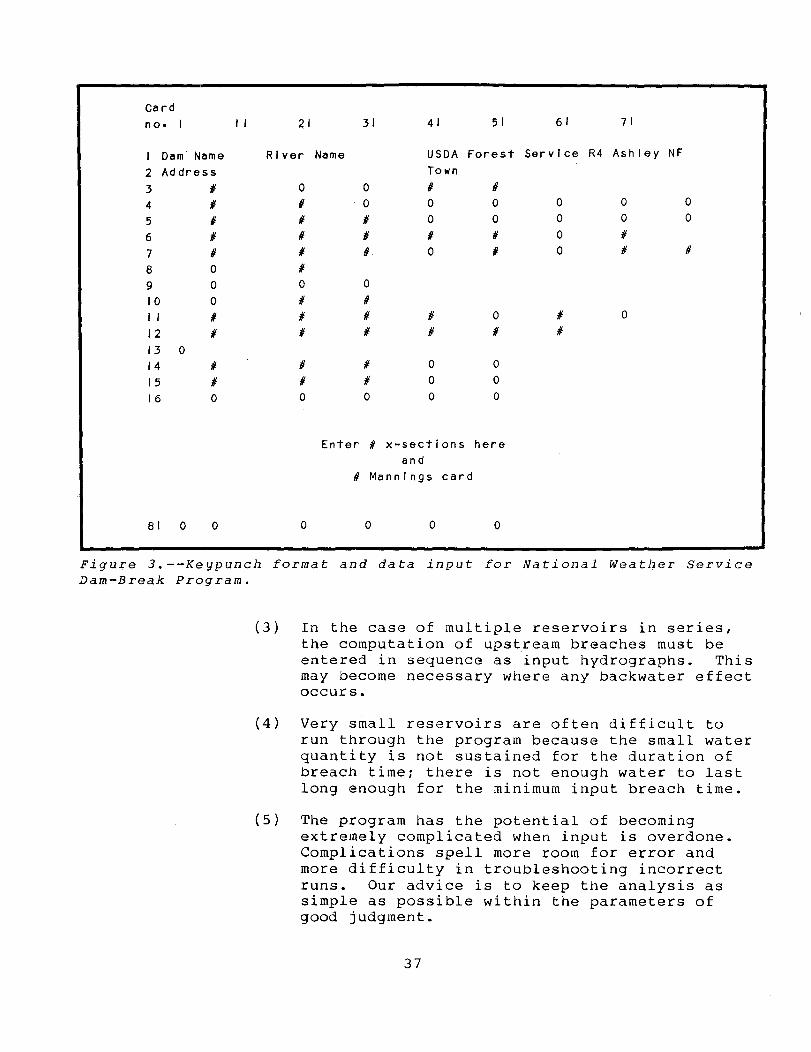
The runstream input to the program (figure 2) will result in a keypunch format shown in figure 3. The numbers are according to "Dam-Break Users Guide Direction."
Region 4 performed all breach analyses with the following assumed conditions:
(1) The dam was overtopping by 1 foot.
(2) The breach occurred in clear weather without inflow hydrographs.
(3) Outlet works and spillways were flowing at full design capacity.
(4) Earthfill dams failed within 1 hour.
The experience Region 4 had with the program high-lighted a few areas:
(1) Because the program translates hydraulic input numerically, the initial flow conditions were found to be extremely critical. One of the biggest causes of run termination occurred when the program ran out of water. Make sure enough initial flow exists to avoid this situation.
(2) Use of downstream such constrictions as bridges and culverts can be misleading. There may be a situation in which, despite all efforts, the end product will represent only a narrow channel with highly increased stream cross-section input.
35
INPUT DATA CODING FOR
DAM BREACH ANALYSIS
Suggested Ranges of Breach Parameters
Fal lure time (TFH)
Breach width
Side slope of Breach
Earth Dam
0.5-4 hrs.
1/4-4 dam heights
0-1
Enter dam name ••• Char X(20)
Concrete Gravity
0.1-0.5 hrs.
Some multiple of monolith widths
o
Name of the river Impounded ••• Char X(20)
Name of forest ••• Char X(20)
Is dam an earth, concrete gravity, or arch? Print ••• (E,G,A)
Length of reservoir Inmlles? •• Real 1(7).00
Enter the width of dam crest ••• Real 1(7).00
Enter dam height ••• Real 1(7).00
Side slope of breach Is I:? one to:
Enter elevation of top of dam
Re a I 1.00
Re a I I (7) .00
Enter elevation of water when break occurs ••• Real 1(7).00
Concrete Arch
Near Instant TFH=O. I hr~.
Total dam width
Valley wall slope
Enter the elevation, and the distance of last cross-section that Is downstream of dam Distance In miles ••• Real 1(7).00
What Is the elevation? ••• Real l(n.OO
Enter surface area of reservoir In square feet ••• Real 1(11).0
Surface area In acre feet = The drop In feet per ml Ie downstream Total number of x-sections? Integer ( )
How many top wIdths used to describe x-section? Integer ( ) (maximum of five)
How many hydrographs are to be plotted? Integer (I) (maximum of six)
Enter x-sections by number for locatIon of hydrographs to occur ••• Integers I, 2, 3 ••••
End 0 fin put Da t a
Figure 2.--Runstream of dam breach analysis.
36
Card no. I II 21
Dam Name River 2 Ad dress 3 II 0 4 II II 5 # II 6 II II 7 II /I 8 0 /I 9 0 0 10 0 II I I II /I J 2 /I II 13 0 14 II /I 15 1/ /I 16 0 0
81 0 o o
31
Name
0 0 1/ /I /I
0 II II II
1/ 1/ 0
41
USDA Town II 0 0 /I 0
II II
51
Forest
/I 0 0 /I /I
o II
o 0 o 0 o 0
Enter II x-sections here and
II Mannlngs card
o o o
61
Service
0 0 0 0
II 1/
R4
71
Ashley NF
0 0 0 0 fI 1/ 1/
o
Figure 3.--Keypunch format and data input for National Weather Service Dam-Break Program.
(3) In the case of multiple reservoirs in series, the computation of upstream breaches must be entered in sequence as input hydrographs. This may become necessary where any backwater effect occurs.
(4) Very small reservoirs are often difficult to run through the program because the small water quantity is not sustained for the duration of breach time; there is not enough water to last long enough for the minimum input breach time.
(5) The program has the potential of becoming extremely complicated when input is overdone. Complications spell more room for error and more difficulty in troubleshooting incorrect runs. Our advice is to keep the analysis as simple as possible within the parameters of good judgment.
37
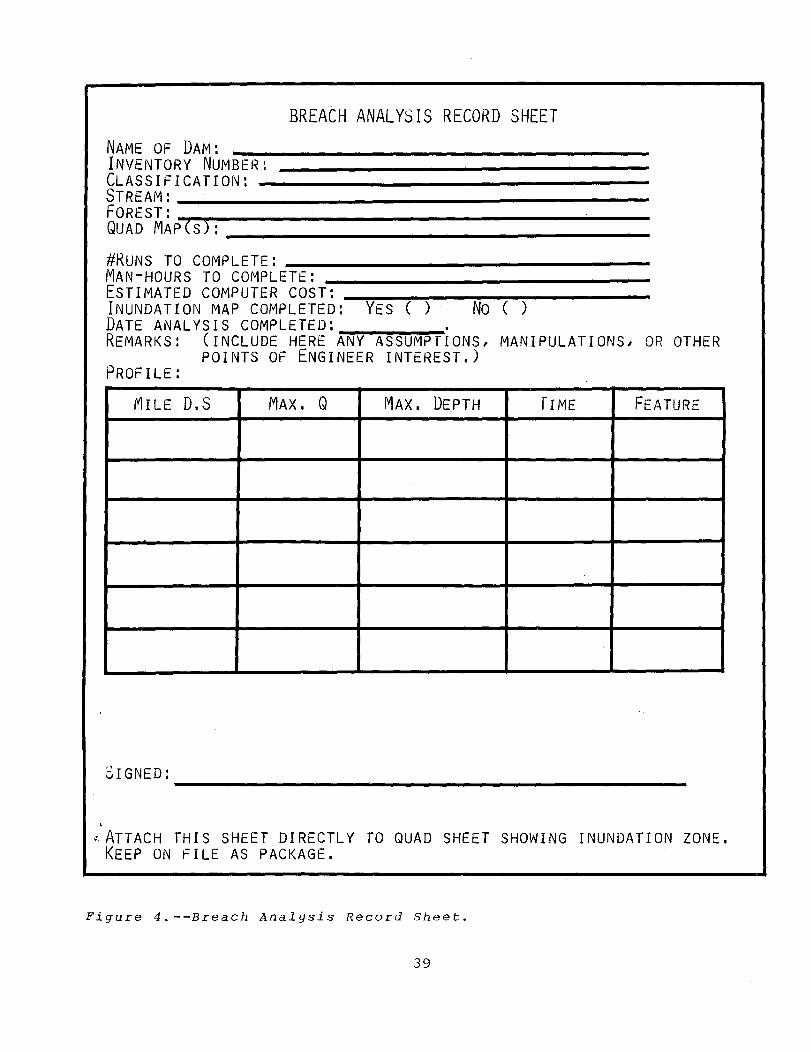
The hydrographs produced by this analysis are conservative. They are translated onto USGS quad maps to produce an inundation zone that is refer-enced downstream to features of interest by mileage, flow time, and depth. These maps were forwarded to the Forests with tabular displays identifying inunda-tion of said features (see figure 4).
Although the results do not encompass factors such as logjam damming and sequential release, they do provide a reasonable estimate of a conservative flood.
A test case was the Lawn Lake Dam (Colorado) failure in 1982. with recorded data as input, this case was run through the program, using Region 4 assumptions and modifications to produce a hydrograph printout that was within 13 percent of actual flow conditions.
38
,
BREAtH ANALYSIS RECORD SHEET
NAME OF DAM: INVENTORY NUMBER: CLASSIFICATION: STREAM: FOREST: -,---------------------QUAD MAP(S): _________________ _
#RUNS TO COMPLETE: ________________ _ MAN-HOURS TO COMPLETE: ESTIMATED COMPUTER COST: I NUNDAT ION MAP COMPLETED :-':"'l"YE-S~(~)-,--:"N"!""'o~(-)~-----DATE ANALYSIS COMPLETED: . REMARKS: (INCLUDE HERE ANY ASSUMPTIONS, MANIPULATIONS, OR OTHER
POINTS OF ENGINEER INTEREST.) PROFILE:
11ILE D.S MAX. Q MAX. DEPTH rIME FEATURE
SIGNED: ------------------------~ATTACH THIS SHEET DIRECTLY TO QUAD SHEET SHOWING INUNDATION ZONE.
KEEP ON FILE AS PACKAGE.
Figure 4.--Breach Analysis Record Sheet.
39

The Series:
Distribution:
Submittals:
Inquiries:
Regional Coordinators:
Engineering Technical Information System THE ENGINEERING FIELD NOTES SERIES is published periodically as a means of exchanging engineering-related ideas and information on activities, problems encountered and solutions developed, or other data that may be of value to engineers Service-wide. Articles are usually less than six pages, and include material that is not appropriate for an Engineering Technical Report, or suitable for Engineering Management publications (FSM 1630 and 7113).
Each Field Notes edition is distributed to the Engineering Staff at Regional Offices, Forests, Stations, and Area Headquarters, as well as to Forest Service Engineering Retirees. If your office is not receiving the Field Notes, ask your Office Manager or Regional Information Coordinator to increase the number of copies for your location. Copies of back issues are available in limited quantities from the Washington Office.
Every reader is a potential author of a Field Notes article. If you have a news item or short description about your work that you wish to share with Forest Service Engineers, we invite you to submit the article for publication. Field Personnel should send material to their Regional Information Coordinator for review by the Regional Office to assure inclusion of information that is accurate, timely, and of interest Service-wide; short articles and news items are preferred. Type the manuscript double-spaced; include original drawings and black-and-white photographs (if only color photographs are available, send transparencies or negatives), and two machine copies of the manuscript.
Regional Information Coordinators should send articles for publication and direct questions concerning format, editing, publishing schedules, etc., to:
FOREST SERVICE - USDA Engineering Staff - Washington Office Att: G.L. Rome, Editor
D.J. Carroll, Editorial Assistant P.O. Box 2417 - Washington, D.C. 20013 Telephone: Area Code 703/FTS-235-8198
R-1 Larry Bruesch R-2 Mike Clinton R-3 Jerry Martinez
R-4 Ted Wood R-5 Phillip Russell R-6 Kjell Bakke R-B Tom Poulin
R-9 Mujeebul Hasan R-10 Mel Dittmer WO AI Calley

Volume 16 January 1984
Engineering Field Notes