engineering physics lab manual lab manual 2017 (ne… · zero. the vernier scale coincidence is...
TRANSCRIPT

1
SCHOOL OF PHYSICAL AND CHEMICAL SCIENCES
DEPARTMENT OF PHYSICS
ENGINEERING PHYSICS
LAB MANUAL
(As per 2017 Academic Regulation)
Common to all branches of B. Tech. First Year

2
CONTENTS
LAB INSTRUCTIONS
MEASURING INSTRUMENTS
I. Screw Gauge
II. Vernier Calipers
III. Travelling Microscope
IV. Spectrometer
LIST OF EXPERIMENTS
1. Determination of Velocity of Ultrasonic waves in a given liquid using Ultrasonic
Interferometer.
2. Determination of thickness of a thin wire using Air Wedge method.
3. Determination of wavelength of light using spectrometer diffraction grating.
4. Determination of angle of divergence of a laser beam using He-Ne laser.
5. Determination of particle size of lycopodium powder using semiconductor laser.
6. Determination of wavelength of laser light using semiconductor laser diffraction.
7. Determination of Acceptance angle and Numerical Aperture using fiber optic
cable.
8. Determination of thermal conductivity of a bad conductor by Lee’s disc method.
9. Determination of wavelength of ultrasonic waves using Kundt’s tube method.
10. Determination of thermal conductivity of a good conductor by Forbe’s method.
11. Determination of solar cell characteristics.

3
GENERAL LAB INSTRUCTIONS
1. The students should attend the lab neatly with proper prescribed uniform.
2. The record notebook should be covered with the laminated brown sheet neatly
and they should bring it to every lab class.
3. Before any cycle of experiments, a class is spent on demonstrating those
experiments. The students should not miss that class for any reason and they
have to be very attentive in that class.
4. They should read the procedure thoroughly for the lab experiment from the
manual and come well prepared.
5. They should bring the required things like scientific calculator, eraser,
pencil, pen etc to every lab class. Borrowing things is not allowed.
6. They should not go to others table leaving their place without taking
permission from the staff. They should maintain silence in the class.
7. They should do the experiment systematically and write their observations
neatly in the record note book with pen. After writing a few readings in the
beginning, they should show the record note book to their faculty member
and get attestation for the readings from the faculty . After completing the
experiment, they should do the calculations neatly.
8. They should complete the calculation in the lab class itself and get the
signature from the staff. In case if they are not able to complete, they should
get attestation from the staff in the record note book for the readings taken
and get the result corrected the next day itself, by submitting the notebook in
the lab. They have to collect their note book from the staff after a day.
9. They should not miss any lab class. This will be viewed very seriously. If
they miss the lab class due to unavoidable reason, they will be allowed for the
next lab provided they submit a letter signed by the parent or Deputy warden
(hosteller) stating the reason. It is the responsibility of the students to complete

4
the missed experiments as soon as possible after getting permission from the
faculty incharge.
10. In every lab class, the students have to sign in a register while receiving
the apparatus from the lab assistants. After completing the experiment, they
should hand over the apparatus and sign in the register again, failing
which it would be assumed that they haven't returned the apparatus and
the cost of the apparatus will be collected from them. So it is the
responsibility of the students to return the apparatus to the lab assistants as
soon as they complete the lab work.

5
INSTRUCTIONS FOR WRITING IN RECORD NOTE
• Before coming to the lab, the students should write the experiment
number, date, aim, formula, least count calculation, ray diagram or
circuit diagram, tabular column neatly in the record note book. The
record note book will be checked in the beginning of the lab class.
RECORD NOTE LAYOUT
1. Title of the Experiment : (Right hand side)
2. Date of Commencement : (Right hand side)
3. Date of Completion and reporting : (Right hand side)
4. Objectives of the experiment : (Right hand side)
5. Aim of the experiment : (Right hand side)
6. Apparatus required : (Right hand side)
7. Formula in detail : (Right hand side)
8. Procedure of the experiment : (Right hand side)
9. Experimental setup/Circuit diagram : (Left hand side)
10. Tabular column : (Left hand side)
11. Calculation : (Left hand side)
12. Result : (Right hand side)
13. Learning outcome achieved : (Right hand side)

6
I. SCREW GAUGE
Aim
To determine the thickness of a glass plate.
Apparatus required
Screw gauge and glass plate
Description
It is based upon the principle of a screw. It consists of a U-shaped metal frame. One
end of which carries a fixed stud A whereas the other end B is attached to a
cylindrical tube as shown in Fig. 1. A scale graduated in millimetres is marked on
the cylindrical tube along its length. It is called Pitch scale.
Fig.1 Screw Gauge
The screw carries a head H which has a beveled edge. The edge is divided
into 100 equal divisions. It is called the Head scale H.S. When the head is rotated,
the head scale moves on the pitch scale.
Procedure:
1. To find the least count (LC) of the screw gauge
Least count of a screw gauge is the distance through which the screw tip moves
when the screw is rotated through one division on the head scale.
𝐷𝐷𝐷𝐷𝐷𝐷𝐷𝐷 𝐷𝐷𝐷𝐷𝐷 𝐷𝐷 𝐷ℎ 𝐷 ℎ 𝐷𝐷𝐷 𝐷𝐷𝐷𝐷𝐷 𝐷𝐷 𝐷ℎ 𝐷 𝐷𝐷𝐷𝐷ℎ 𝐷𝐷𝐷𝐷𝐷 𝐷𝐷𝐷𝐷ℎ =
𝐷𝐷𝐷𝐷𝐷𝐷 𝐷𝐷 𝐷𝐷𝐷𝐷𝐷𝐷𝐷𝐷𝐷 𝐷𝐷𝐷𝐷𝐷 𝐷𝐷 𝐷ℎ 𝐷 ℎ 𝐷𝐷𝐷 𝐷𝐷𝐷𝐷𝐷

7
𝐷𝐷𝐷𝐷𝐷 𝐷𝐷𝐷𝐷𝐷 (𝐷𝐷) =
𝐷𝐷𝐷𝐷ℎ
𝐷𝐷𝐷𝐷𝐷 𝐷𝐷𝐷𝐷𝐷𝐷 𝐷𝐷 𝐷𝐷𝐷𝐷𝐷𝐷𝐷𝐷𝐷 𝐷𝐷 ℎ 𝐷𝐷𝐷 𝐷𝐷𝐷𝐷𝐷
To find the pitch, the head or the screw is given say 5 rotations and t he distance
moved by the head scale on the pitch scale is noted. Then by using the above formula,
the least count of the screw gauge is calculated.
Pitch = 5 mm / 5 = 1 mm
Least Count = 1 mm / 100 = 0.01 mm
The screw head is rotated until the two plane faces A and B are just in contact.
2. To find the zero correction (ZC)
i) Nil error
If the zero of the head scale coincides with the zero of the pitch scale and also
lies on the base line (B.L), the instrument has no zero error and hence there is no zero
correction (See Fig.
ii) Positive zero error
If the zero of the head scale lies below the base line (B.L) of the pitch scale
then the zero error is positive and zero correction is negative. The division on
the head scale, which coincides with the base line of pitch scale, is noted.
The division multiplied by the least count gives the value of the positive zero
error. This error is to be subtracted from the observed reading i.e. the zero
correction is negative (See Fig.3).

8
Fig. 3. Positive Zero Error
Example
If 5th division of the head scale coincides with the base line of the pitch
scale then Zero error = +5 divisions
Zero correction = (Z.E x LC) = -(5 x 0.01) = - 0.05 mm.
iii) Negative zero error
If the zero of head scale lies above the base line (B.L) of the pitch scale,
then the zero error is negative and zero correction is positive. The division on the
head scale which coincides on the base line of pitch scale is noted. This value
is subtracted from the total head scale divisions. This division multiplied by the
least count gives the value of the negative error. This error is to be added to the
observed reading i.e. zero correction is positive (See Fig. 4).
Fig. 4 Negative Zero Error
Example
If the 95th division of the head scale coincides with the base line of the pitch
scale then, Zero error = -5 divisions
Zero correction = + 0.05 mm

9
3. To find the thickness of the glass plate
The glass plate is gently gripped between the faces A and B. The pitch scale
reading and the head scale coincidence are noted. The readings are tabulated.
Fig. 5 Screw Gauge Readings
Pitch Scale Reading (P.S.R)
Number of pitch scale division just in front of the head scale fully completed is
noted (see Fig. 5). It is measured in millimeter.
Head Scale Coincidence (H.S.C)
Coincidence of head scale division on the base line of the pitch scale is also
noted.
Example:
Screw gauge readings: (see Fig. 5)
LC = 0:01 mm Zero error = -3 divisions Zero correction (Z.C.) = +0.03 mm
S.No.
P.S.R
mm
H.S.C
div
H.S.R = (H.S. C x LC)
mm
Total Reading =
P.S.R+ H.S.R mm
Corrected
Reading
= T.R. ± Z.C. mm
1
2
3
4
4
56
0.56
4.56
4.59
,
Mean thickness of the glass plate =

10
II. VERNIER CALIPERS
Aim
To measure the dimensions of the given object.
Apparatus
Vernier Calipers and Wooden block
Description
The vernier calipers consist of a long rigid rectangular steel strip called
the main scale (M.S) with a jaw (A) fixed at one end at right angles to its length
as shown in Fig.l. The main scale is graduated both in centimeters and inches.
The second jaw (B) carrying a vernier scale and capable of moving along the
main scale can be fixed to any position by means of a screw cap S. The
vernier scale i s divided into 10 divi sions, which is equivalent to 9 main scale
divisions (M.S.D). So the value of 1 vernier scale division is equal to 9/10 M.S.D.
The value of 1 M.S.D. is 1 mm
Fig.1. Vernier Calipers
Procedure:
1. To find the Least Count (LC) of the vernier calipers (see Fig. 2)
It is the smallest length that can be measured accurately by the vernier
calipers and is measured as the difference between one main scale division
and one vernier scale division.

11
Fig. 2 Vernier scale and main scale
Least Count (LC) = 1 M.S.D — 1 V.S.D
Value of 1 M.S.D = 1 mm
No of divisions on the vernier scale = 10 divisions.
10 V.S.D =9 M.S.D
1 V.S.D =9/10 M.S.D = 9/10 x 1 mm = 9/10 mm
L.C.=1 M.S.D —1 V.S.D
= 1 mm - 9/10 mm
= 0.1 mm = 0.01 cm
L.C. = 0.01 cm
2. To find the Zero Correction (ZC)
Before taking the readings with the vernier calipers, we must note the zero
error of the vernier calipers. When the two jaws of the vernier calipers are pressed
together, if the zero of the vernier scale coincides with the zero of the main scale the
instrument has no error, otherwise there is a zero error. The zero error is positive if
the vernier zero is after the main scale zero. The zero error is negative when the
vernier zero is before the main scale zero. Ordinarily, the zero error is negligible in the
case of vernier calipers and so zero error can be considered to be nil.
3. To find the length of the given object
The given object is firmly gripped between the jaws, taking care not to press it
too hard. The main scale reading and the vernier coincidence are noted. The
main scale reading is the reading on the main scale that is just before the vernier

12
zero. The vernier scale coincidence is found by noting the vernier division that
coincides with any one of the main scale. Then the vernier scale reading is found by
multiplying the vernier coincidence with the least count. The observations are repeated
for various positions of the object.
Fig. 3 Vernier Caliper readings
Example:
Vernier Calipers readings: (See Fig. 3)
LC = 0.01cm
S.
No.
M.S.R
cm
V.S.C.-
div
V.S.R =
(V.S.0 x LC)
cm
Total Reading =
M.S.R+ V.S.R
cm
Corrected Reading
= T.R. ± Z.C.
cm
1 1.3 6 0.06 1.36 1.36
2
3
4
Mean length of the given object =

13
Aim:
III. THE TRAVELLING MICROSCOPE
To learn the parts of a Travelling Microcope and to read a reading.
Apparatus:
Reading lens and capillary tube
Description:
It is a compound microscope attached to a graduated vertical pillar, which is
mounted on rigid platform (Fig. 1). The platform is provided with three levelling screws.
The microscope can be set with its axis either in the vertical or the horizontal
position. The microscope can be moved in the vertical or horizontal direction by means
of a screw arrangement attached to it. The distance through which the microscope is
moved is read on the scale. There are two scales one for horizontal movement and the
other for the vertical movement. Each scale has a main scale (M1, M2) and a vernier
scale (V1, V2). The vernier moves with the microscope. As in the spectrometer, there is
a set of main screw and fine adjustment screw, for the horizontal and the vertical
movements. One set is fixed to the pillar for vertical movement and the other set is
fixed to the platform for horizontal movement. The eyepiece of the microscope is
provided with cross-wires. The image of an object is focussed by the microscope using
a side screw (focusing screw) attached to the microscope.
Procedure:
1. To find the Least Count (LC) of the travelling microscope
The main scale is graduated in mm. There are 50 V.S.D equivalent to 49 M.S.D.
The value of one M.S.D. is 0.5mm=0.05cm
LC = 1 M.S.D –1 V.S.D.
1 M.S.D = 0.05 cm
50 V.S.D = 49 M.S.D
1 V.S.D = 49/50 x 0.05 = 0.049 cm
LC = 0.05 -- 0.049 cm
LC = 0.001cm

14
Fig. 1 Travelling Microscope
2. To read a reading
When the microscope is clamped by the main screw or fine adjustment screw
at any position, the reading is taken in the vertical scale or in the horizontal scale
according to the requirement. M.S.R and V.S.R are taken as in the vernier calipers. For
example see Fig. 2. And write the M.S.R and V.S.R.
Fig. 2 Vernier and Main scale
Note:
In the Vernier calipers, travelling microscope and the spectrometer, the MS
zero may coincide with the VS zero. In such cases, the MSD, which coincides with
the VS zero is the MSR reading.

15
Example:
Travelling microscope readings:
LC = 0.001cm
S. No.
M.S.R
cm
V.S.C
div
V.S.R =
(V.S.C x LC)
Cm
T.R =
M.S.R + V.S.R
cm
1 5.05 20 0.02 5.07
2
3
4
5
Result:
The parts and functions of the travelling microscope are studied and a few readings
are taken.

16
IV. THE SPECTROMETER
Aim:
To learn the parts of a spectrometer and to read a reading.
Apparatus required:
Spectrometer, reading lens and spirit level
Description:
i. It has the following three main parts ( see Fig.1) .
1. The collimator 2. The telescope 3. The prism table
Fig. 1. Spectrometer
1. The collimator: Its purpose is to produce a parallel beam of light. It consists of
a lens and slit. The slit faces the source of light. The distance between the slit and
the lens can be adjusted by a screw fixed to the collimator tube C to obtain
parallel beam of rays. The slit consists of two sharp edges. One of the edges is
fixed while the other can be moved parallel to it by working the screw provided at
its side. The collimator cannot be rotated.
2. The telescope: The telescope T consists of an objective 0 at one and an eyepiece
fixed with the cross wires on the other end. The telescope is fixed to the
circular scale graduated in degrees. The circular scale is in between the collimator
and the telescope. The telescope can be turned with the scale about a vertical axis
passing through the center of the spectrometer. The eyepiece of the telescope
is provided with cross — wires. The telescope can be fixed in any position by a
main screw. Fine adjustment can be made by a fine adjustment screw which is

17
tangential to the main screw. The focusing of the telescope is done by a
screw to the side of the telescope.
3. The prism table: This consists of a upper plate and a lower plate separated by
three springs. Three screws pass through these springs. There are lines
engraved in the upper plate so as to mount the prism in proper position. The prism
table P can be mounted in any position by means of a screw at its bottom. The
prism table can be rotated about the same yertical axis as the telescope.
ii. The initial adjustments:
1. Telescope adjustment: The telescope is turned towards a distant object and
its focusing screw is adjusted till the image of the object is clearly seen. In
this position, the telescope is capable of receiving parallel rays.
2. Collimator adjustment: The slit is illuminated with sodium vapour lamp or Hg
vapour lamp. The telescope is turned so that the telescope and the col limator
are in a line. In this position one can see the image of the slit through the
telescope. The clear image of the slit is obtained by adjusting the collimator
screw. The slit must be adjusted to be narrow and vertical.
3. Levelling of the prism table: This is done with a spirit level. The spirit level is
kept on the prism table and the three leveling screws of the prism table are
adjusted till the air bubble comes to the centre.
Procedure:
1. To find the least count of the spectrometer:
The main scale is a circular scale graduated in degrees. The value of one MSD
is half degree. Each vernier scale consists of 30 divisions (Fig. 2).
29 MSD are equal to 30 VSD (Fig.2).
LC = I MSD — 1 VSD
1 MSD = 0.5° = 30' (10 = 60' )
30 VSD = 29 MSD
1 VSD = 29/30 MSD
= (29/30) X 30’
= 29'

18
1 LC = 30' - 29'
L C = 1’
Fig. 2 Circular scale of the spectrometer
2. To read a reading
Main scale reading (MSR) and vernier scale reading (VSR) are noted as explained in
the vernier calipers when the telescope and the disc (prism table) are fixed at the
required position by the main or fine adjustment screw.
The two vernier scales VA and VB are fixed to the disc, which can be rotated about the
same vertical axis. A main screw and a fine adjustment screw as in the telescope
control the movement of the vernier scales.
19
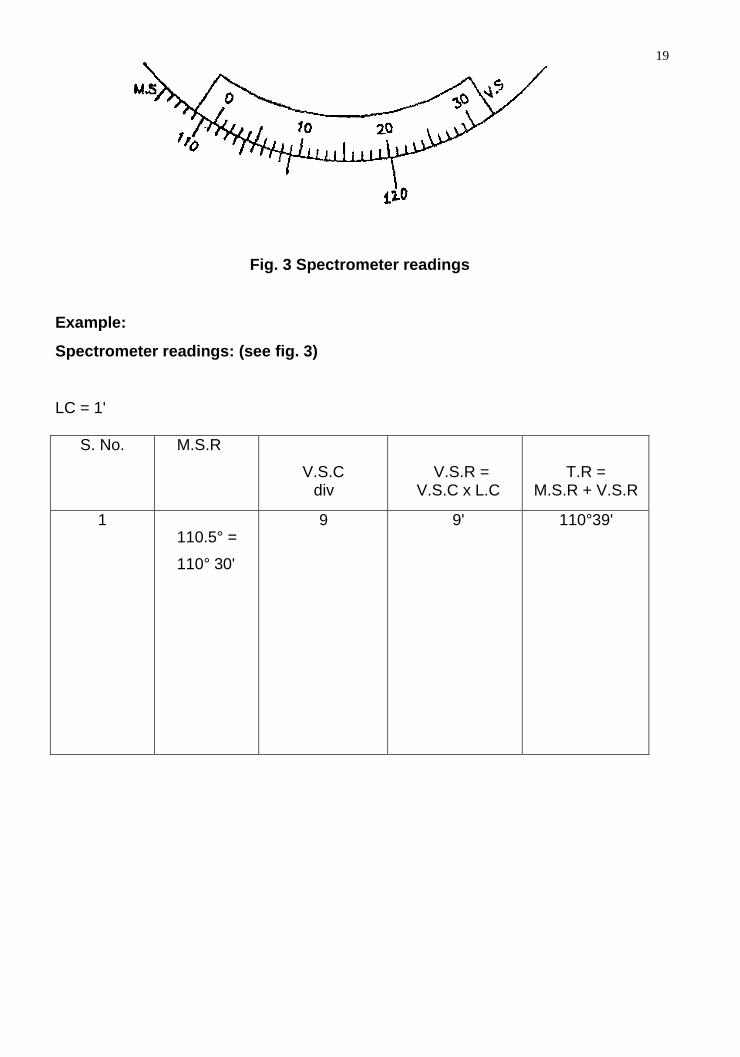
Fig. 3 Spectrometer readings
Example:
Spectrometer readings: (see fig. 3)
LC = 1'
S. No. M.S.R V.S.C
div
V.S.R =
V.S.C x L.C
T.R =
M.S.R + V.S.R
1
110.5° =
110° 30'
9 9' 110°39'

20
1. DETERMINATION OF VELOCITY OF ULTRASONIC WAVES IN
A LIQUID USING ULTRASONIC INTERFEROMETER
Objectives
• To make students to understand the principle of interferometer
• To make students to understand the principle of acoustical grating
• To determine the velocity of the ultrasonic waves in the liquid using acoustical
grating
• To determine the compressibility of the given liquid from the velocity of the
ultrasonic waves
Aim
To determine the velocity of ultrasonic waves in a given liquid and also to determine the
compressibility of the liquid
Apparatus required
Ultrasonic interferometer, measuring cell, frequency generator, given liquid, etc.
Formula
𝐷. 𝐷𝐷𝐷𝐷𝐷𝐷𝐷𝐷 𝐷𝐷 𝐷𝐷𝐷𝐷𝐷𝐷𝐷𝐷𝐷𝐷 𝐷𝐷𝐷𝐷𝐷 𝐷𝐷 𝐷𝐷𝐷 𝐷𝐷𝐷𝐷𝐷 𝐷𝐷𝐷𝐷𝐷𝐷, 𝐷 = 𝐷𝐷 𝐷/𝐷
𝐷. 𝐷𝐷𝐷𝐷𝐷𝐷𝐷𝐷𝐷𝐷𝐷𝐷𝐷𝐷 𝐷𝐷 𝐷𝐷𝐷 𝐷𝐷𝐷𝐷𝐷
𝐷𝐷𝐷𝐷𝐷𝐷, 𝐷 = 𝐷
𝐷𝐷𝐷
𝐷𝐷/𝐷
where λ = 2d/n is the wavelength of the Ultrasonic wave in m
f is the Frequency of Ultrasonic waves in Hz
d is the distance moved by the micrometer screw in m
n is the number of oscillations p is the density of the given liquid in kgm-3
Theory
An Ultrasonic Interferometer is a simple and direct device to determine
the velocity of Ultrasonic waves in liquid with a high degree of accuracy. Here
the high frequency generator generates variable frequency, which excites the
Quartz crystal placed at the bottom of the measuring cell (Fig. 1). The excited
Quartz crystal generates Ultrasonic waves in the experimental liquid. The liquid will

21
now serve as an acoustical grating element. Hence when Ultrasonic waves
passes through the rulings of grating, successive maxima and minima occurs,
satisfying the condition for diffraction.
Fig. 1 Ultrasonic interferometer
Initial adjustments: In high frequency generator two knobs are provided for
initial adjustments. One is marked with `Adi (set) and the other with 'Gain'
(Sensitivity). With knob marked `Adj' the position of the needle on the
ammeter is adjusted and with the knob. marked 'Gain', the sensitivity of the
instrument can be increased for greater deflection, if desired.

22
Procedure
The measuring cell is connected to the output terminal of the high frequency
generator through a shielded cable. The cell is filled with the experimental liquid
before switching ON the generator. Now, when the frequency generator is
switched ON, the Ultrasonic waves move normal from the Quartz crystal till they
are reflected back by the movable reflector plate. Hence, standing waves are
formed in the liquid in between the reflector and the quartz crystal.The distance
between the reflector and crystal is varied using the micrometer screw such
that the anode current of the generator increases to a maximum and then
decreases to a minimum and again increases to a maximum. The distance of
separation between successive maximum or successive minimum in the anode
current is equal to half the wavelength of the Ultrasonic waves in the liquid. (see
Fig.2). Therefore, by noting the initial and final position of the micrometer screw for
one complete oscillation (maxima—minima—maxima) the distance moved by the
reflector can be determined
To minimize the error, the distance (d) moved by the micrometer screw is
noted for 'n' number of oscillations (successive maxima), by noting the ini tial and
final reading in the micrometer screw and is tabulated. From the total distance
(d) moved by the micrometer screw and the number of oscillations (n), the
wavelength of ultrasonic waves can be determined using the formula λ = 2d/n.
from the value of k and by noting the frequency of the generator (f). The velocity
of the Ultrasonic waves and compressibility of the given liquid can be calculated
using the given formula.

23
(i) To find the velocity of Ultrasonic waves in the liquid
Type of liquid = Frequency of the Generator (f) = .....Hz
LC = 0.01 mm
S.
No.
No. of
oscillations
(n)
Reading for ' n' oscillations d=R1 -R2
X 10- 3
in m
λ= 2d/n
X 10- 3
in m
Velocity
v= f λ
in ms- 1
Initial reading ( RI) Final Reading( R2)
PSR
X 10- 3 m
HSC
div
HSR
X10- 3m
TR
X10- 3 m
PSR
X 10- 3 m
HSC
div
HSR
X 10- 3m
TR
X10- 3m
,.,
Mean =


25
Calculation
(i) Wavelength of the Ultrasonic waves =
Frequency of Ultrasonic waves =
The velocity of Ultrasonic waves in the given liquid, v =
(ii) Density of the given liquid (p) =
The Compressibility of the given liquid, K =
Velocity of Ultrasonic waves in the given liquid, v = λf
Compressibility of the given liquid, K= 1/v2 p
Result
1. Velocity of ultrasonic waves in the given liquid, v =
2. Compressibility of the given liquid, K =
Outcome
At the end of this experiment, the students would be able
• To know the principle underlying the formation of acoustical grating
• To know how to determine the velocity of ultrasonic waves in liquid
• To know how to determine the compressibility of the liquid from the velocity of the
ultrasonic waves

26
2. DETERMINATION OF THICKNESS OF A THIN WIRE USING AIR
WEDGE METHOD
Objectives
• To familiarize with the working knowledge of the principle of interference
• To determine the dimensions of very small specimen using the principle of Air
wedge
• To observe the variation of fringe width for different positions of specimen
• To determine the wavelength of monochromatic source with knowledge of
• dimension of specimen
Aim
To determine the thickness of a thin wire using air wedge method
Apparatus required
Two optically plane rectangular glass plates, thin wire, travelling microscope,
reading lens, sodium vapour lamp, condensing lens with stand, wooden box with glass
plate inclined at 45o.
Formula
𝐷. 𝐷𝐷𝐷 𝐷𝐷𝐷𝐷𝐷𝐷𝐷𝐷𝐷 𝐷𝐷 𝐷𝐷𝐷 𝐷𝐷𝐷𝐷, 𝐷 =
𝐷
𝐷𝐷
𝐷𝐷 𝐷
𝐷. 𝐷𝐷𝐷𝐷𝐷 𝐷𝐷𝐷𝐷𝐷, 𝐷 = 𝐷
𝐷𝐷𝐷𝐷𝐷𝐷𝐷
Where is the wavelength of sodium light in m
is the distance of the wire from the edge of contact (l) in m
is the width of one fringe in m
Procedure
The experimental arrangement and ray diagram are shown in Fig. 1. Two
optically plane glass plates are placed one over other and tied together by means of a
rubber band at one end. A thin wire is inserted between the plates at the other end. Now

27
a wedge shaped air film is formed between the two glass plates. The slide system is
kept on the platform of a travelling microscope. The light from a sodium vapour lamp is
rendered parallel with a condensing lens and is made to incident on a plane glass sheet
held over the wedge at an angle of 45o with the vertical. The light falling on the sheet is
partially reflected which is in turn incident normally on the air wedge. Adjusting the
arrangement properly, the microscope field of view is made bright to the maximum
extent. The microscope is moved vertically up and down till parallel fringes are visible
which are located on the surface of the air film (Fig.2). By moving the microscope in a
horizontal direction, the cross-wires of the microscope are set on one of the dark (nth)
fringes in the pattern. Its position is noted down in the horizontal scale.
The microscope is moved further using the tangential screw along the length of
the air film counting the number of dark fringes. After counting 2 dark fringes, the cross
wire is coincided with the (n+2)nd fringe and its position is noted. The measurements are
repeated similarly for every alternate dark fringe and are noted. The width of 10 dark
fringes is calculated from the table and the mean width of 10 fringes is averaged out.
From this, the fringe width is calculated. The length of the air film is measured as the
distance between the line of contact and the inner edge of the wire. The measurement
can be done using the travelling microscope or with the calibrated scale.

28
Fig. 1 Experimental arrangement
Fig. 2 Fringe pattern

29
To find the fringe width ()
Least count = 0.001cm
Order
of
fringes
Microscope reading Order
of
fringes
Microscope reading Width
of 25
fringes
cm
M.S.R
cm
V.S.C
div
V.S.R
cm
T.R
cm
M.S.R
cm
V.S.C
div
V.S.R
cm
T.R
cm
n n+25
n+5 n+30
n+10 n+35
n+15 n+40
n+20 n+45
Mean width of 25 fringes =
Calculations
Wavelength of sodium light () = m
Distance of the wire from the edge of contact (l) = m
Mean width of 25 fringes = m
Width of one fringe () = m
The thickness of the wire, t =
2
Wedge angle, = t
Result
1. The thickness of the wire, t =
2. Wedge angle, =

30
Outcome
At the end of this experiment, the students would be able
• To understand the principle of interference
• To determine the dimensions of a thin specimen such as wire, thin foil, thin
paper
• To determine the wavelength of monochromatic source applying the principle
of Air wedge
• To understand applications of interference

31
3. DETERMINATION OF WAVELENGTH OF LIGHT USING
SPECTROMETER DIFFRACTION GRATING
Objectives
• To understand the types of diffraction
• To familiarize with the principle of diffraction in plane transmission
grating
• To know the procedure for standardization of the grating
• To determine the wavelengths of prominent spectral lines of mercury
spectrum
Aim
To determine the wavelength of the prominent lines in the mercury spectrum
using spectrometer diffraction grating
Apparatus required
Spectrometer, plane transmission grating, sodium vapour lamp, mercury
vapour lamp, reading lens
Formula
𝐷𝐷𝐷𝐷𝐷𝐷𝐷𝐷𝐷𝐷 𝐷𝐷 𝐷𝐷𝐷 𝐷𝐷𝐷𝐷𝐷𝐷𝐷𝐷𝐷 𝐷𝐷𝐷𝐷𝐷 𝐷𝐷 𝐷𝐷𝐷 𝐷𝐷𝐷𝐷𝐷𝐷𝐷 𝐷𝐷𝐷𝐷𝐷𝐷𝐷𝐷, 𝐷 =
where is the angle of diffraction in degrees
n is the order of diffraction (spectrum)
N is the number of lines per metre in the grating
𝐷𝐷𝐷𝐷
𝐷𝐷 𝐷
Procedure
Initial adjustments
a. Telescope adjustment: The telescope is turned towards a distant object and
its focusing screw is adjusted till the image of the object is clearly seen. In this
position, the telescope is capable of receiving parallel rays.

32
b. Collimator adjustment: The slit is illuminated with sodium vapour lamp or
Hg vapour lamp. The telescope is turned so that the telescope and the
collimator are in a line. In this position one can see the image of the slit
through the telescope. The clear image of the slit is obtained by adjusting the
collimator screw. The slit must be adjusted to be narrow and vertical.
c. Levelling of the prism table : This is done with a spirit level. The spirit level
is kept on the prism table and the three levelling screws of the prism table are
adjusted till the air bubble comes to the centre.
Adjustment of the grating for normal incidence (Fig.1)
1. After making the initial adjustments, the plane transmission grating is
mounted on the grating table.
2. The telescope is released and placed in front of the collimator. The direct
reading is taken after making the vertical cross-wire to coincide with the
fixed edge of the image of the slit which is illuminated by a source of light.
3. The telescope is then rotated by an angle 900 (either left or right) and
fixed.
4. The grating table is rotated until on seeing through the telescope the
reflected image of the slit coincides with the vertical cross-wire. This is
possible only when a light emerging out from the collimator is incident at
an angle 450 to the normal to the grating.
The vernier table is now released and rotated by an angle 450 towards the
collimator. Now light coming out from the collimator will be incident normally on
the grating (Fig. 1).

33
To find the wavelengths of the spectral lines of the mercury spectrum
The slit is now illuminated by white light from mercury vapour lamp. (Fig. 2)
The central direct image will be an undispersed image. The telescope is
moved to either side of the direct image, the diffraction pattern of the spectrum of
the first order and second order are seen.
The readings are taken by coinciding the prominent lines namely violet,
green, yellow and red with the vertical cross wire. The readings are tabulated and
from this, the angles of diffraction for different colours are determined. The
wavelengths for different lines are calculated by using the given formula. The
number of lines per metre in grating is assumed.

34
To determine of the wavelengths of various spectral lines
Least count = 1’ N = Order of the spectrum n = 1
Spectral
lines
Reading for the diffracted image Diff.
Between
two readings
2
Mean
2
Mean
angle of
diffraction
x10-10 m
Left side
Right side
Vernier A
A1
Vernier B
B1
Vernier A
A2
Vernier B
B2
A1A2 B1B2
M.S.R V.S.R T.R M.S.R V.S.R T.R M.S.R V.S.R T.R M.S.R V.S.R T.R
Violet
Blue
Green
Yellow1
Yellow2
Red

35
Calculation
Order of diffraction (n) =
Number of lines per meter in the grating (N)
Angle of diffraction in degrees for violet line ( )
=
=
-----------lines/m
Wavelength of the violet line (V) =
Angle of diffraction in degrees for blue line ( ) =
Wavelength of the blue line (B) =
Angle of diffraction in degrees for green line ( ) =
Wavelength of the green line (G) =
Angle of diffraction in degrees for yellow line ( ) =
Wavelength of the yellow line (Y ) =
Angle of diffraction in degrees for red line ( ) =
Wavelength of the red line (R ) =
Result:
sin m =
Nn
sin m =
Nn
sin m =
Nn
sin m =
Nn
sin m=
Nn
1. Wavelength of the violet line (V) =
2. Wavelength of the blue line (b) =
3. Wavelength of the green line (g) =
4. Wavelength of the yellow line (y) =
5. Wavelength of the red line (r) =
Outcome
At the end of this experiment, the students would be able
• To understand the principle of diffraction
• To differentiate Fraunhofer and Fresnel’s diffraction
• To determine the wavelengths of prominent spectral lines of mercury
spectrum

36
4. DETERMINATION OF ANGLE OF DIVERGENCE OF
LASER BEAM
Objectives
▪ To learn about the characteristics of lasers
▪ To study angle of divergence of the laser beam
Aim
To determine the angle of divergence of laser beam using He-Ne laser and
Semiconductor laser and to find out which laser is highly directional.
Apparatus required
He-Ne laser, Semiconductor laser, optical bench, screen and ruler.
Formula
(𝐷𝐷 − 𝐷𝐷) 𝐷𝐷𝐷𝐷𝐷 𝐷𝐷 𝐷𝐷𝐷𝐷𝐷𝐷𝐷𝐷𝐷𝐷 𝐷𝐷 𝐷𝐷𝐷 𝐷𝐷𝐷𝐷𝐷 𝐷𝐷𝐷𝐷, 𝐷 = (𝐷
𝐷 − 𝐷𝐷 )
𝐷
where d1 is the distance between laser source and the screen in m
a1 is the spot size of the laser beam on the screen for distance d1in m
d2 is the new distance between laser source and the screen in m
a2 is the spot size of the laser beam on the screen for distance d2 in m
Procedure
The experimental setup used to find the angle of divergence of the laser beam is
shown as in fig.1.
a1
Screen
Fig.1. Measurement of Divergence of Laser beam
The Laser beam is allowed to fall on the screen and the spot of the beam is
He-Ne laser/
Diode Laser
d1

37
observed and the spot size of the beam is measured as shown in Fig.1.
1. The laser beam from He-Ne is made to fall on the screen which is kept at a
distance of d1 from the source.
2. The spot size of the beam is noted and is taken as a1.
3. Now the position of the screen is altered to a new position d2 from the laser
source and again the spot size of the beam is noted as a2.
4. The same procedure is repeated by changing the position of the
screen at equal intervals atleast 5 times.
5. The readings corresponding to the position of the screen and spot size of
the beam is tabulated.
6. From this, the angle of divergence of the laser beam is calculated using the
formula
Φ = (a2-a1)/(d2-d1) radians
7. The same is repeated by using semiconductor laser diode for the same
distances as done with He-Ne laser.
8. The angle of divergence calculated was compared and the results are
interpreted using two different types of laser beam.
1. Measurement of angle of divergence using He-Ne laser
S.
No.
Distance
between
laser
beam and
screen
X 10-2m
Diameter of the
spot
(Horizontal)
X 10-2m
Diameter of the
spot
( Vertical)
X 10-2m
Mean
Diameter
of the
spot
X 10-2m
φ = (a2-a1)/(d2-d1)
radians

38
2. Measurement of angle of divergence using semiconductor laser diode
S.
No.
Distance
between
laser
beam and
screen
X 10-2m
Diameter of the
spot
(Horizontal)
X 10-2m
Diameter of the
spot
( Vertical)
X 10-2m
Mean
Diameter
of the
spot
X 10-2m
φ = (a2-a1)/(d2-d1)
radians
Calculation
Distance between laser source and the screen (d1) = m
Spot size of the laser beam on the screen for distance d1 (a1) = m
Distance between laser source and the screen (d2) = m
Spot size of the laser beam on the screen for distance d2 (a2) = m
Angle of divergence of the laser beam, Φ = (a2-a1)/(d2-d1) radians
Result
1. Angle of divergence of the beam using He-Ne laser =
2. Angle of divergence of the beam using semiconductor laser =
Outcome
At the end of the experiment, the students would be able
• To understand the importance of laser beam compared to ordinary light
• To determine the angle of divergence of the laser beam
• To understand the applications of Lasers in Engineering and Medical fields

39
n
5. DETERMINATION OF PARTICLE SIZE OF LYCOPODIM
POWDER USING SEMICONDUCTOR LASER
Objectives
• To determine the concept of diffraction
• To determine the size of particles using the given Laser source
• To learn about the characteristics of Lasers
• To study the various types of Lasers
Aim
To determine the particle size of microparticles (lycopodium powder) using laser
diffracting grating.
Apparatus Required
Laser source , Fine micro particles having nearly same size (say Lycopodium
powder), Glass plate, Screen, and a Metre Scale.
Formula
𝐷𝐷𝐷𝐷 𝐷𝐷 𝐷𝐷𝐷 𝐷𝐷𝐷𝐷𝐷𝐷𝐷𝐷𝐷𝐷𝐷𝐷𝐷 𝐷𝐷𝐷𝐷𝐷 𝐷𝐷𝐷𝐷𝐷 𝐷𝐷𝐷𝐷𝐷𝐷𝐷𝐷𝐷𝐷𝐷 𝐷𝐷𝐷𝐷𝐷𝐷𝐷, 𝐷𝐷 =
where n is the order of diffraction
λ is the wave length of laser light used in m (690 nm)
D is the distance between the glass plate and the screen in m
𝐷𝐷𝐷
𝐷 𝐷𝐷
x is the distance between the central bright spot and the nth fringe in m.
Procedure
When LASER is passed through a glass plate spread with fine micro
particles, the beam gets diffracted by the particles and circular rings are obtained
on the screen as shown in Fig. 1. By measuring the radii of the rings and the
distance between the glass plate and the screen, the size of the particle can be
determined.

40
1. Sprinkle the fine micro particles (Lycopodium ) on the glass plate.
2. Mount the LASER source on a stand
3. Place a screen in front of the LASER source at some distance
4. Mount the glass plate on a separate stand and place it between the LASER
source and the screen.
5. Switch ON the laser source and allow the beam to pass through the glass
plate.
6. Adjust the distance (D) between the glass plate and the screen to get a
clear circular fringe pattern (diffraction pattern) on the screen. The intensity
is found to decrease from zeroth order (central spot) to higher orders.
7. Measure the distance (D) between the glass plate and the screen using
metre scale.
8. Measure the distance ( xn
) of the first order, second order and so on from
the central bright spot (radii of the rings).
9. Repeat the experiment by varying the distance (D) between the glass plate
and the screen and the readings are tabulated.

41
Fig. 1.
To determine the particle size
S.
No.
Distance bet
screen and t
plate (
x 10-2
ween the
he glass
D)
m
Order of
diffraction
n
Distance between
the central bright
and nth fringe ()
x 10-2 m
Particle size
2d
x 10-5 m
1 1
2
3
2 1
2
3
3 1
2
3
Mean 2d = ---------
xn

42
x
Calculation:
Order of diffraction (n) =
Wave length of laser light (λ) = m
Distance between the glass plate and the screen (D) = m
Distance between the central bright spot and the nth fringe ( ) = m n
The size of the microparticle using laser diffraction grating, 2d =
nD
xn
Result
The size of the microparticle using laser diffraction grating, 2d =
Outcome
At the end of the experiment, the students would be able
• To determine the size of particles using the given Laser source
• To understand the importance of laser beam compared to ordinary light
• To provide the use of Lasers for different applications
• To understand the applications of Lasers in Engineering and Medical fields
• To get the depth in knowledge about the Lasers and its applications in
various fields
Precautions :
It is dangerous to view the laser light directly. So direct exposure of eye to laser
light should be avoided.

43
6. DETERMINATION OF WAVELENGTH OF LASER
LIGHT USING DIFFRACTION GRATING
Objectives
• To determine the concept of diffraction
• To determine the wavelength of the given Laser source
• To learn about the characteristics of Lasers
• To study the various types of Lasers
Aim
To determine the wavelength of the laser light using diffraction grating.
Apparatus required
Spectrometer, Diffraction grating, He-Ne laser or Semiconductor
laser, optical bench and screen or scale arrangement.
Formula
𝐷𝐷𝐷𝐷𝐷𝐷𝐷𝐷𝐷𝐷 𝐷𝐷 𝐷𝐷𝐷𝐷𝐷 𝐷𝐷𝐷𝐷𝐷, 𝐷 =
where
𝐷𝐷𝐷𝐷
𝐷𝐷 𝐷
θ = tan - 1 (xn / l ) i s the angle of diffraction
N is the number of lines per metre in the grating in lines/m
xn is the distance of the spot from the central maximum in m
l is the perpendicular distance between grating and the scale in m
n is the order of the spectrum
Procedure
The laser is mounted on its saddle on the optical bench. The grating is
mounted on an upright next to laser. The screen or scale arrangement is
placed next to the grating as shown in Fig .1. The laser is switched on. The
relative orientation of laser with respect to grating is adjusted such that spectral

44
x1
x2
x3
spots are observed on the scale. The scale is moved towards and away
from the grating till at least three (for 7500 lines/inch) spots are cle arly seen
on the scale on the either side of the central spot. The central maximum and
other maxima corresponding to different orders of the spectrum on either side of
the central maximum are identified. The scale is again adjusted in such a
way that the central spot coincides with the zero in the scale. Now the
distances (xn ) of the spots corresponding to first order, second order etc on
either side of central maxi mum are noted. The distance between the
grating and the scale (/) is measured. The readings are tabulated.
Fig. 1. Experimental Setup
The experiment is repeated for at least three P values (15cm,
20cm &25cm). The value of xn is calculated for each case using the formula θ =
tan - 1 (xn / l ) .
Knowing the values of θ , n & N, the wavelength of laser light can
be calculated using the formula λ = S i n θ / n N

45
T o f i n d λ
S.
No.
Order
n
l
cm
xn cm
θ = t a n - 1(xn / l )
Sin θ
λ
m LHS RHS Mean
1 1
2 2
3 3
4 1
5 2
6 3
7 1
8 2
9 3
Mean value of λ =m.
C a l c u l a t i o n
Distance of the spot from the central maximum (xn ) = m
Perpendicular distance between grating & the scale (l) = m
Number of lines per metre in the grating (N)
Angle of diffraction, θ = tan - 1 (xn / l )
=
=
lines/m
Wavelength of laser light, λ = S i n θ / n N

46
R e s ul t
W a v e l e n g t h o f l a s e r l i g h t , λ =
Outcome
At the end of the experiment, the students would be able
• To determine the wavelength of the given Laser source
• To understand the importance of laser beam compared to ordinary light
• To provide the use of Lasers for different applications
• To understand the applications of Lasers in Engineering and Medical fields
• To get the depth in knowledge about the Lasers and its applications in
various fields

47
7. NUMERICAL APERTURE AND ACCEPTANCE ANGLE OF AN
OPTICAL FIBRE
Objectives
• To understand the basics of light propagation using fibre optic cable
• To understand the Numerical aperture and acceptance angle of the fibre.
AIM
To determine the acceptance angle and numerical aperture of the given fibre
optic cable.
APPARATUS REQUIRED
Diode laser source, fibre optic cable (typically 1 m ) and NA
FORMULA
𝐷. 𝐷𝐷𝐷𝐷𝐷𝐷𝐷𝐷𝐷 𝐷𝐷𝐷𝐷𝐷𝐷𝐷𝐷 𝐷𝐷 𝐷𝐷𝐷 𝐷𝐷𝐷𝐷𝐷 𝐷𝐷𝐷𝐷𝐷𝐷𝐷 𝐷𝐷𝐷𝐷𝐷, 𝐷𝐷 = 𝐷𝐷𝐷𝐷𝐷𝐷𝐷
𝐷 𝐷𝐷 =
(𝐷𝐷𝐷 + 𝐷𝐷)𝐷/𝐷
𝐷. 𝐷𝐷𝐷𝐷𝐷𝐷𝐷𝐷𝐷𝐷 𝐷𝐷𝐷𝐷𝐷 𝐷𝐷 𝐷𝐷𝐷 𝐷𝐷𝐷𝐷𝐷 𝐷𝐷𝐷𝐷𝐷𝐷𝐷 𝐷𝐷𝐷𝐷𝐷, 𝐷𝐷𝐷𝐷 = 𝐷𝐷𝐷−𝐷(𝐷𝐷)
where θ max is the acceptance angle of the fibre
D is the diameter of the laser spot noted on the screen in meter
L is the distance of the screen from the fibre end
PROCEDURE :
Measurement of numerical aperture and acceptance angle:
Numerical aperture of any optical system is a measure of how much light can be
collected by the optical system. It is the product of the refractive index of the

48
2 2 1⁄2
incident medium and the sine of the maximum ray angle. The schematic
diagram of the numerical aperture measurement system is shown in the figure.
One end of the 1 – metre optical fibre cable is connected to PO of source and the
other end to the NA JIG as shown in the figure. The AC main is switched on.
Light should appear at the end of the fibre on the NA JIG. Turn the set Po knob
clockwise to set to maximum intensity.
The white screen in the NA JIG with the 4 concentric circles each of 10, 15 20,
and 25 mm in diameter is kept vertically at a suitable distance so that the red
spot from the emitting fibre coincides with the smallest (10mm) circle. The
circumference of the spot outermost must coincide with the circle. A dark room
will facilitate good contrast. The distance of the screen from the fibre end L and
the diameter of the spot are noted. The diameter of the circle is measured
accurately with a suitable scale which is provided in the JIG itself. The
experiment is repeated for 15 min, 20 mm, and 25 mm diameters in the same
way. The readings are tabulated.
Then the numerical aperture of the optical fibre system is computed using the
formula,
NA = µ0 sinθ max = 𝐷
(4𝐷 +𝐷 )
49
2 2 1⁄2
where µ0 is the refractive index of the medium. For air µ0 =1, hence NA = sinθ
max and θ max is the acceptance ( maximum-ray ) angle of the fibre.
Acceptance angle of the optical fibre
θ max = sin -1(NA)
Note :
The intensity of the spot will not be evenly distributed if there are twists on the
fibre. So, the twists must be checked and removed before taking measurement.
Measurement of Numerical aperture
Sl.No.
Distance of the spot
from fibre end (L) in
10-3m
Diameter of spot
in 10-3m
NA =
𝐷
(4𝐷2+𝐷2 )1⁄2
θ max = sin -1(NA)
Calculation
Distance of the spot from the fibre end (L) = 10-3m
Diameter of the spot = 10-3m
Numerical Aperture (NA) = 𝐷
(4𝐷 +𝐷 )
=
Acceptance angle of the fibre (θ max ) = sin -1(NA)

50
RESULT :
1. Numerical aperture of the given fibre optic cable =
2. Acceptance angle of the fibre =
Outcome
At the end of this class, the students will be able :
• To determine the acceptance angle of the fibre
• To find out and compare the NA of the different optical fibres.

51
𝐷𝐷 )𝐷𝐷
8. DETERMINATION OF THERMAL CONDUCTIVITY OF A BAD
CONDUCTOR BY LEE’S DISC METHOD
Objectives
• To know about different modes of heat transfer, via conduction, convection
and radiation
• To understand the principle of Lee’s disc experiment
• To determine the coefficient of thermal conductivity of a bad conductor
using Lee’s disc
• To understand the heat loss with respect to dimensions of good conductor &
bad conductor
Aim
To determine the thermal conductivity of a bad conductor by lee’s disc method
Apparatus required
Lee’s disc apparatus, Bad conductor (thin cardboard or glass disc of uniform
thickness) , Two thermometers, Steam boiler, Heater, Stop watch, Screw gauge,
Vernier caliper, Balance.
Formula
𝐷𝐷𝐷𝐷𝐷𝐷𝐷 𝐷𝐷𝐷𝐷𝐷𝐷𝐷𝐷𝐷𝐷𝐷𝐷 𝐷𝐷 𝐷 𝐷𝐷𝐷 𝐷𝐷𝐷𝐷𝐷𝐷𝐷𝐷𝐷, 𝐷 =
where M - mass of the metal disc in kg
𝐷𝐷𝐷 (𝐷 + 𝐷𝐷)(
𝐷𝐷
𝐷𝐷𝐷(𝐷𝐷 − 𝐷𝐷)(𝐷𝐷 + 𝐷)
𝐷/𝐷/𝐷
S – specific heat capacity of the material of the disc in Jkg-1 K-1
d – thickness of a bad conductor in m
r – radius of the metallic disc in m
h – thickness of the metal disc in m
1 – steady state temperature of the steam chamber in °C
2 - steady state temperature of the metal disc in °C
d dt
- rate of cooling at steady state temperature 2
in Cs-1
2

52
Procedure
Lee’s disc apparatus is shown in Fig.1. It consists of a highly polished
brass disc B. It is suspended by three strings from a circular ring R which is fixed
to an iron stand. A circular cardboard whose diameter is the same as that of the
disc is placed on the disc and over it is placed a steam chamber S. The steam
chamber is also circular in shape having the same diameter as that of the disc.
Holes are provided in B and S to facilitate the insertion of thermometers T1 and
T2.
Steam is allowed to pass through the chamber as shown in the Fig.1. The
temperatures indicated by the two thermometers will start rising. After about half
an hour, a steady state is reached when the temperature of the lower disc no
longer rises. At this stage, find the temperature 2 ºC of the lower disc. Let the
temperature of the steam as indicated by the thermometer in the upper chamber
be 1 ºC.
Fig.1 Lee’s disc arrangement
Now, the cardboard is removed by gently lifting the upper chamber. The
lower disc is allowed to be heated directly by keeping it in contact with the steam
chamber. When the temperature of the lower disc attains a value of the about 10
more than its steady state temperature, the chamber is removed and the lower
disc is allowed to cool down on it own accord. The time- temperature
53
observations are taken every 30 seconds until the temperature falls to at least 5
below the steady state temperature.
The diameter (2r) and thickness (h) of the lower disc are found by vernier
calipers and screw gauge respectively. The mass of the disc is found by the
balance (M kg). The thickness (d) of the cardboard disc is measured by the
screw gauge.
Graph
A graph is drawn taking time along the X – axis and the temperature along the Y
– axis as shown in Fig. 2.
From the graph, the time taken (t sec) to cool from (2 + ½ ) ºC to (2 – ½ ) ºC
is found.
To find the rate of cooling
S.No Temperature () C Time (t) seconds

54
To find the diameter of the metallic disc (D)
L. C. = 0.01 cm
S.No. M.S.R
cm
V.S.C
div
V.S.R
cm
T. R.= MSR+ V.S.R
cm
1
2
3
4
5
Mean (D) = -------------- x 10-2 m
Mean radius of the metallic disc (r) = D/2 = ------------- x 10-2 m
To find the thickness of the card board (d)
L.C. =0.01 mm
Zero error = ---------div Zero correction = ----------- mm
S.No. P.S.R
mm
H.S.C H.S.R Total Reading
= PSR+ (HSC X
LC)
mm
Corrected Reading
= T.R. Z.C.
mm
1
2
3
4
5
Mean (d) = -------------- x 10-3 m

55
2 ºC
(2 - ½ ) ºC
Time (t in secs)
(2 + ½ ) ºC
2 ºC
(2 - ½ ) ºC
To find the thickness of the metallic disc (h)
L.C. = 0.01 mm Zero error = ------div Zero correction = ----------- mm
S.No. PSR
mm
HSC
div
Observed Reading
= PSR+ (HSC X LC)
mm
Correct Reading
= O.R Z.C.
mm
Mean (h) = -------------- x 10-3 m
Graph :
Fig. 2
Calculations
Mass of the lower disc by a berranger balance , M = kg
Specific heat capacity of the materials of the disc, S = J kg-1k-1
Radius of the lower metallic disc, r = m
Thickness of the lower metallic disc, h = m
2 ºC
(2 + ½ ) ºC
(2 - ½ ) ºC
Time (t in secs)
dt
dθ

56
Thickness of the card board, d = m
Steady temperature of the steam chamber, 2 = C
Steady temperature of the disc, 1 = C
Rate of cooling d
at steady temperature 2 C = C/s
dt 2
Result :
Thermal conductivity of the bad conductor using Lee’s disc method =
Outcome
At the end of this experiment, the students would be able
• To know about differentiate the different modes of heat transfer
• To understand the principle of Lee’s disc experiment
• To determine the coefficient of thermal conductivity of a bad conductor
using Lee’s disc
• To understand the difference in heat loss in good conductor & bad
conductor

57
VIVA VOCE QUESTIONS AND ANSWERS
1. DETERMINATION OF VELOCITY OF ULTRASONIC WAVES IN A
GIVEN LIQUID USING ULTRASONIC INTERFEROMETER.
1. What are ultrasonics?
Ultrasonics are sound waves having frequency more than 20,000 Hz. These
sound waves are inaudible to human ear.
2. What is piezo electric effect?
When two pair of opposite sides of a Quartz crystal is applied with
mechanical stress, then in other two pair of opposite sides electric charges
are induced. This phenomenon is called piezo electric effect.
3. What is resonance condition to produce Ultrasonic waves in a piezo electric
oscillator?
The resonance is condition is that the natural frequency of vibration of Quartz
must be matched with frequency of oscillatory tank circuit.
2. DETERMINATION OF THICKNESS OF A THIN WIRE USING AIR
WEDGE METHOD
1. What is an Air wedge?
Two plane glass plates inclined at a small angle forming a wedge shaped air
film between them is called an Air wedge.
2. What is the principle of physics involved in this experiment?
Interference of light waves reflected from first and second glass plates of air
wedge is the principle of physics involved.
3. What are the conditions for the light rays to obtain interference pattern?
Two light rays from coherent source should undergo superimposition with a
constant path difference between them.
4. What are the uses of Air wedge?

58
Using Air wedge experiment, we can determine the thickness of very thin
materials where conventional measuring instruments like screw gauge or
vernier calipers cannot be used.
5. What is Fringe width?
The distance between any two consecutive dark or bright fringes is called
fringe width.
6. What are coherent sources?
Two sources are said to be coherent if they have same frequency, same
amplitude and are in same phase with each other.
3. DETERMINATION OF WAVELENGTH OF LIGHT USING
SPECTROMETER DIFFRACTION GRATING
1. What is plane transmission grating?
It is an optically plane glass plate on which very fine equidistant close lines
or grooves are made by ruling using diamond point.
2. What is the principle of physics involved in this experiment?
The diffraction of light rays at the grating element when light rays are
incident on it is the principle in the experiment.
3. What is diffraction?
The bending of light rays when the pass through an opening or about an
obstacle is called diffraction.
4. What is called Standardization of Grating?
The process of determining the number of lines or grooves per meter
incorporated or drawn on the grating element in a Spectrometer experiment
using a source whose wavelength is known is called Standardization of
grating.
4. DETERMINATION OF ANGLE OF DIVERGENCE OF LASER BEAM
1. What are the characteristics of Laser
Lasers are highly coherent, highly intense, highly monochromatic and highly

59
directional beam of light.
2. What is stimulated emission?
A photon have energy E equal to the difference in the energy between two
levels, stimulate an atom in the higher energy state to make a transition to
the lower energy state with the creation of a second photon is called
stimulated emission.
3. Compare the angular spread in a laser beam with an ordinary light?
The light beam can travel as a parallel beam upto a distance of d2/λ where d
is the diameter of the aperture through which the light is passing and λ is the
wavelength of the light beam. After travelling the distance of d2/λ, the light
beam spreads radially. The angular spread is given by Δθ = λ/d. For laser
beam, the angular spread is 1mm per 1m while for an ordinary light, it is 1m
per 1m. This shows that laser beam is highly directional compared to
ordinary light.
5. DETERMINATION OF PARTICLE SIZE OF LYCOPODIUM POWDER
USING SEMICONDUCTOR LASER
1. What is the principle involved in this experiment.
Diffraction of laser light at the grating element is the principle in this
experiment.
2. What is the diffraction pattern observed on the screen in particle size
experiment?
In particle size experiment, concentric rings are observed as interference
pattern with a central maximum.
3. What are the characteristics of Laser?
Lasers are highly coherent, highly intense, highly monochromatic and highly
directional beam of light.

60
6. DETERMINATION OF WAVELENGTH OF LASER LIGHT USING
SEMICONDUCTOR LASER DIFFRACTION
1. What are the characteristics of Laser?
Lasers are highly coherent, highly intense, highly monochromatic and highly
directional beam of light.
2. What is population Inversion?
If the number of atoms in the excited state is greater than the number of
atoms in the ground state, it is called as population inversion.
3. What are the different pumping mechanisms in laser?
Optical pumping, electric discharge method, Inelastic atom-atom collision,
direct conversion and chemical pumping.
7. DETERMINATION OF ACCEPTANCE ANGLE AND NUMERICAL
APERTURE USING FIBER OPTIC CABLE
1. What is the principle of fibre optic communication?
The total internal reflection of light rays along the length of the fibre is the
principle in light s propagation in fibre optical communication.
2. What is Numerical Aperture?
Numerical Aperture (NA) is a measure of how much light can be collected by
an optical system such as an optical fibre or a microscope lens. The NA is
related to the acceptance angle a, which indicates the size of a cone of light
that can be accepted by the fibre.
3. What is Acceptance angle?
It is the maximum angle that a light ray can make at the face of the optical
fibre during entry which allows it to suffer total internal reflection along the
length of the fibre.

61
8. DETERMINATION OF THERMAL CONDUCTIVITY OF A BAD
CONDUCTOR BY LEE’S DISC METHOD
1. What is Conduction?
Conduction is a process in which heat is transferred from the hotter end to
colder end without the actual motion of particles.
2. What is Thermal conductivity?
It is the property of material to conduct heat. It is defined as the amount of
heat conducted through a conductor of unit area of cross section in unit time
when the opposite faces of it are maintained at 1 kelvin.
3. What are static and dynamic parts of Lee’s disc experiment?
Static part: During the first half an hour of experiment, the steam passes
through the chamber and the temperature in thermometers T1 and T2 will
reach a steady state(T1>T2).
Dynamic Part: In this part, the poor conductor is removed and Lees disc is
kept in direct contact with steam chamber and temperature of disc rises.
When this temperature comes to about 10 degrees above T2, then steam
chamber is removed and the disc is allowed to cool. The temperature fall is
noted with respect to time.
4. What is the use of Lee’s disc experiment?
Using this experiment of Lee’s disc, we can determine the thermal
conductivity of various poor conductors and compare them with the available
standard values.
5. Can we use Lee’s disc experiment to determine the thermal conductivity of
good conductors?
No, Experiment like Forbes method is used to determine thermal conductivity
of good conductors.