engineering project-i module 1: familiarization of labview … · · 2012-01-04ges 1220–...
TRANSCRIPT
Engineering Project-I
Module 1: Familiarization of LabVIEW and the Vernier Toolkit
PREPARED BY
Academic Services Unit
January 2012
© Applied Technology High Schools, 2012
GES 1220– Engineering Project-I
Module 1: Familiarization of LabVIEW and the Vernier Toolkit 2
Module 1: Familiarization of LabVIEW and the Vernier Toolkit
Module Objectives Upon successful completion of this module, students should be able to:
1. Define ‘data acquisition’ and state the significance of data acquisition systems.
2. Draw the block diagram of a DAQ system. 3. Identify the function and parts of a SensorDAQ interface. 4. State the functions of the Analog Express VI and the Digital
Express VI in the Vernier toolkit. 5. Perform practical tasks using the Vernier SensorDAQ interface
and Vernier sensors to collect data from anlaog and digital devices.
6. Build a simple sensor-based control system.
Module Contents: Topic Page No.
1.1 Introduction 3
1.2 Collecting Data from an Analog Sensor 8
1.3 Control a Digital Device 9
1.4 Sensor-Based Control System 11
1.5 Lab Activity 1 12
1.6 Lab Activity 2 16
1.7 Lab Activity 3 18
1.8 Review Exercise 22

GES 1220– Engineering Project-I
Module 1: Familiarization of LabVIEW and the Vernier Toolkit 3
1.1 Introduction
Data Acquisition is a process of measuring and recording physical or
electrical parameters over a period. DAQ systems are used in a wide range
of industries including process control, electricity generation and
transmission, oil and gas and steel production, as well as research and
development.
PC-based data acquisition systems use a combination of modular hardware,
application software, and a computer to take measurements as shown in
figure 1.1.
Figure 1.1: PC Based Data Acquisition System
The block diagram in figure 1.2 shows the elements of a DAQ system:
Figure 1.2: DAQ System Elements
Sensors and transducers
Signal condi0oning module
DAQ Device Driver and Applica0on So7ware
GES 1220– Engineering Project-I
Module 1: Familiarization of LabVIEW and the Vernier Toolkit 4
In this course, the Vernier SensorDAQ will be used as the DAQ interface and
LabVIEW will be used as the software. This module is designed to give you a
brief tutorial on LabVIEW programming and the Vernier Toolkit. As part of the
practical tasks, you will practice graphing data with an analog sensor, learn to
control a digital device, and then combine the two activities into a single
application. In the modules that follow, you will build projects, which require a
basic knowledge of LabVIEW programming.
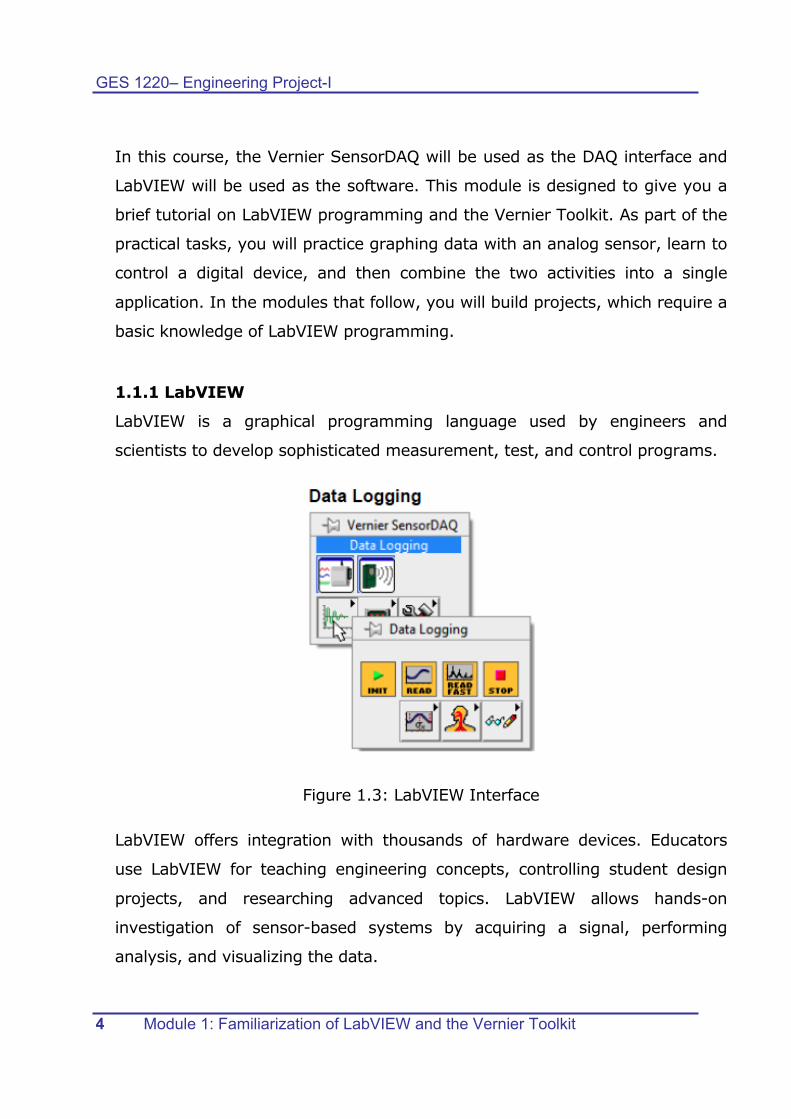
1.1.1 LabVIEW
LabVIEW is a graphical programming language used by engineers and
scientists to develop sophisticated measurement, test, and control programs.
Figure 1.3: LabVIEW Interface
LabVIEW offers integration with thousands of hardware devices. Educators
use LabVIEW for teaching engineering concepts, controlling student design
projects, and researching advanced topics. LabVIEW allows hands-on
investigation of sensor-based systems by acquiring a signal, performing
analysis, and visualizing the data.
GES 1220– Engineering Project-I
Module 1: Familiarization of LabVIEW and the Vernier Toolkit 5
LabVIEW is a graphical programming language that uses icons instead of lines
of text to create programs. It uses dataflow programming, where the flow of
data determines execution order. LabVIEW programs and subroutines are
called virtual instruments (VIs).
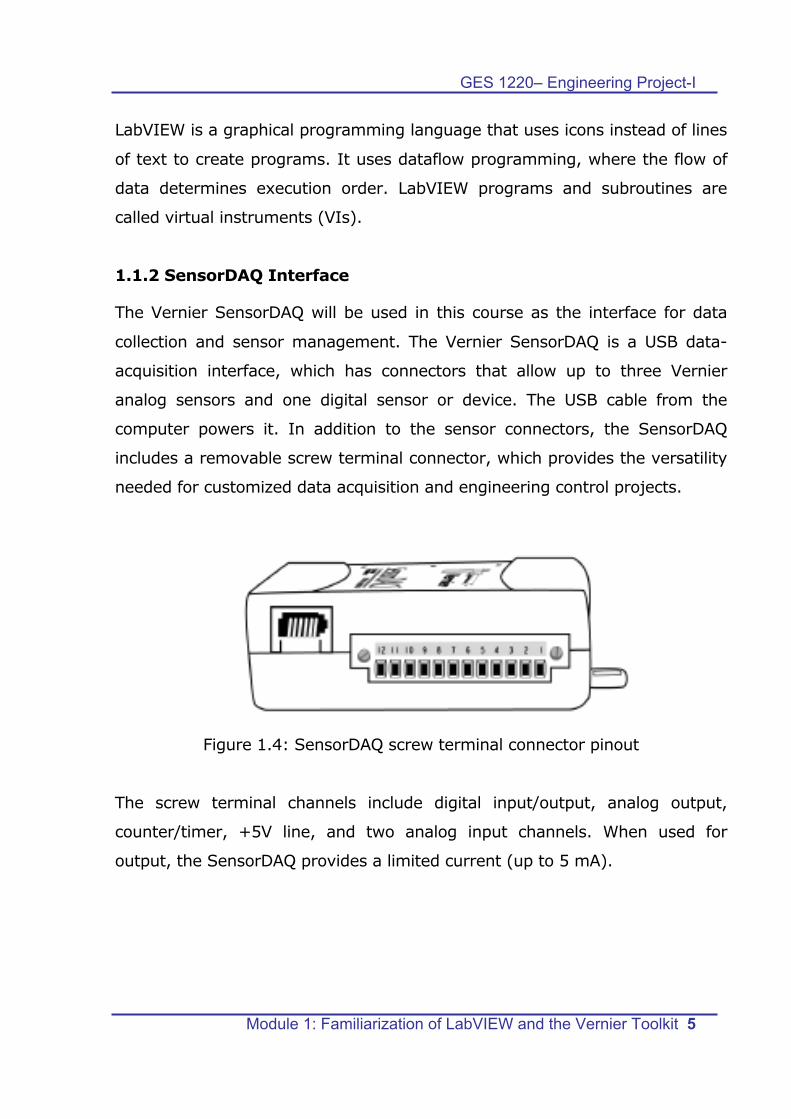
1.1.2 SensorDAQ Interface
The Vernier SensorDAQ will be used in this course as the interface for data
collection and sensor management. The Vernier SensorDAQ is a USB data-
acquisition interface, which has connectors that allow up to three Vernier
analog sensors and one digital sensor or device. The USB cable from the
computer powers it. In addition to the sensor connectors, the SensorDAQ
includes a removable screw terminal connector, which provides the versatility
needed for customized data acquisition and engineering control projects.
Figure 1.4: SensorDAQ screw terminal connector pinout
The screw terminal channels include digital input/output, analog output,
counter/timer, +5V line, and two analog input channels. When used for
output, the SensorDAQ provides a limited current (up to 5 mA).

GES 1220– Engineering Project-I
Module 1: Familiarization of LabVIEW and the Vernier Toolkit 6
Table 1.1 describes the signals available on the screw terminal.
Table 1.1: SensorDAQ screw terminals
GES 1220– Engineering Project-I
Module 1: Familiarization of LabVIEW and the Vernier Toolkit 7
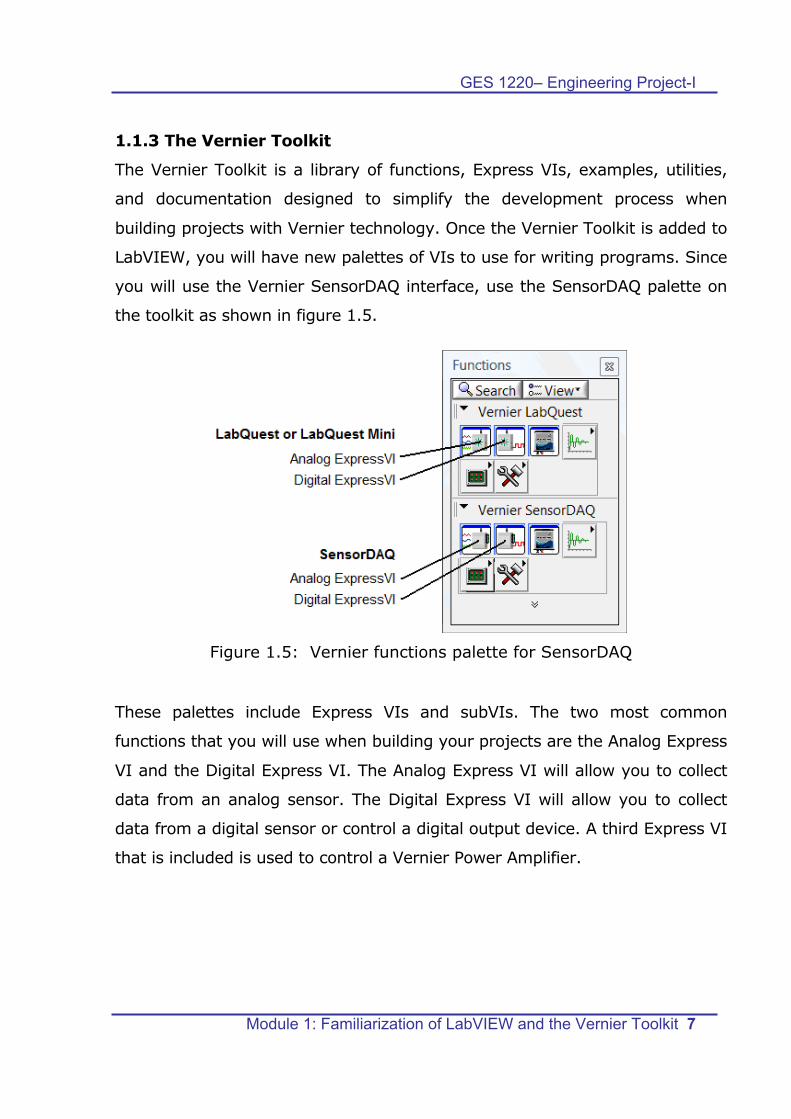
1.1.3 The Vernier Toolkit
The Vernier Toolkit is a library of functions, Express VIs, examples, utilities,
and documentation designed to simplify the development process when
building projects with Vernier technology. Once the Vernier Toolkit is added to
LabVIEW, you will have new palettes of VIs to use for writing programs. Since
you will use the Vernier SensorDAQ interface, use the SensorDAQ palette on
the toolkit as shown in figure 1.5.
Figure 1.5: Vernier functions palette for SensorDAQ
These palettes include Express VIs and subVIs. The two most common
functions that you will use when building your projects are the Analog Express
VI and the Digital Express VI. The Analog Express VI will allow you to collect
data from an analog sensor. The Digital Express VI will allow you to collect
data from a digital sensor or control a digital output device. A third Express VI
that is included is used to control a Vernier Power Amplifier.
GES 1220– Engineering Project-I
Module 1: Familiarization of LabVIEW and the Vernier Toolkit 8
1.2 Collecting Data from an Analog Sensor
In order to collect data from an analog sensor, the Analog Express VI could be
used. Examples include temperature, force, and light sensors. Analog sensors
that are plugged into any of the BTA channels are automatically detected and
their readings are displayed. The Analog Express VI is configured with a
default Sample Rate of 10 samples/second and a default Length of 10
seconds. The Sample Rate and Length can be adjusted by clicking the Set
Timing button in the configuration window. Sampling Rates less than 200
samples/second will configure the VI for Single Point Sampling, which means
data values will be delivered point-by-point in real time as they are collected.
With this configuration, the Express VI must be placed within a loop.
Specifying a Sampling Rate greater than 200 samples/second will configure
the Analog Express VI for Multi-Point Sampling, and data values will be
delivered as a set after the collection interval. This configuration does not
require the Analog Express VI be placed within a loop.
Conduct Lab Activity-1 to collect data from a light sensor.
GES 1220– Engineering Project-I
Module 1: Familiarization of LabVIEW and the Vernier Toolkit 9
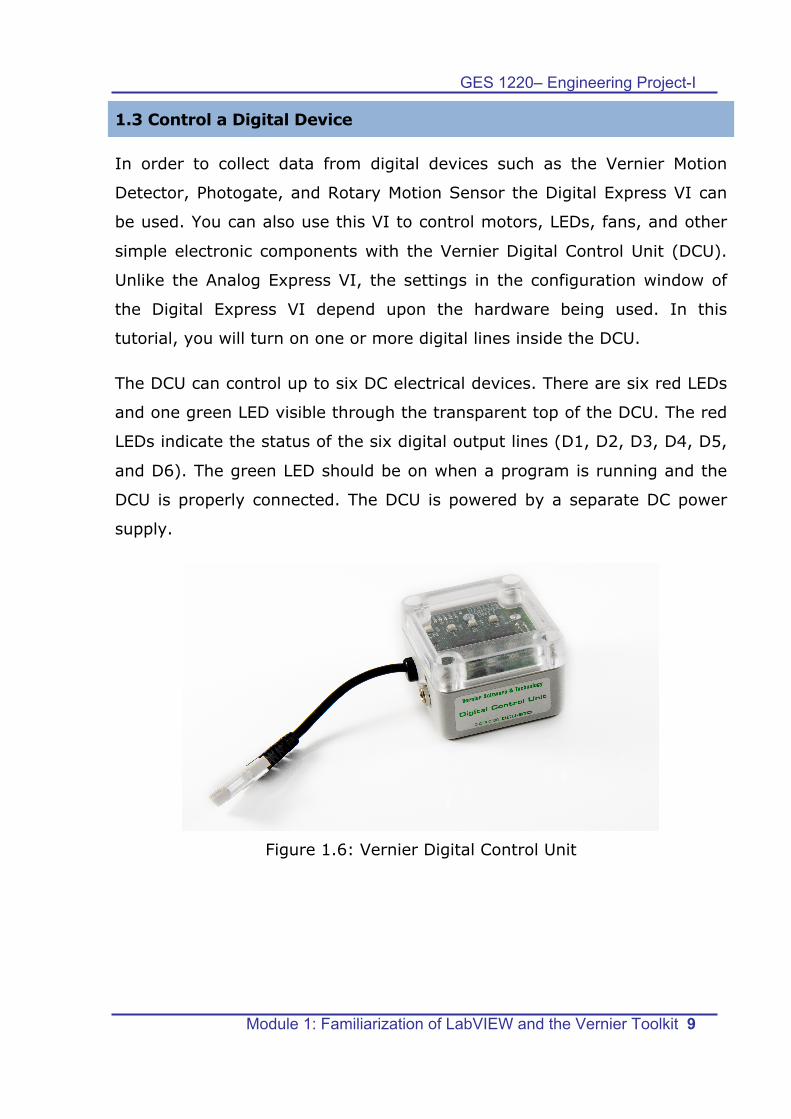
1.3 Control a Digital Device
In order to collect data from digital devices such as the Vernier Motion
Detector, Photogate, and Rotary Motion Sensor the Digital Express VI can
be used. You can also use this VI to control motors, LEDs, fans, and other
simple electronic components with the Vernier Digital Control Unit (DCU).
Unlike the Analog Express VI, the settings in the configuration window of
the Digital Express VI depend upon the hardware being used. In this
tutorial, you will turn on one or more digital lines inside the DCU.
The DCU can control up to six DC electrical devices. There are six red LEDs
and one green LED visible through the transparent top of the DCU. The red
LEDs indicate the status of the six digital output lines (D1, D2, D3, D4, D5,
and D6). The green LED should be on when a program is running and the
DCU is properly connected. The DCU is powered by a separate DC power
supply.
Figure 1.6: Vernier Digital Control Unit
GES 1220– Engineering Project-I
Module 1: Familiarization of LabVIEW and the Vernier Toolkit 10
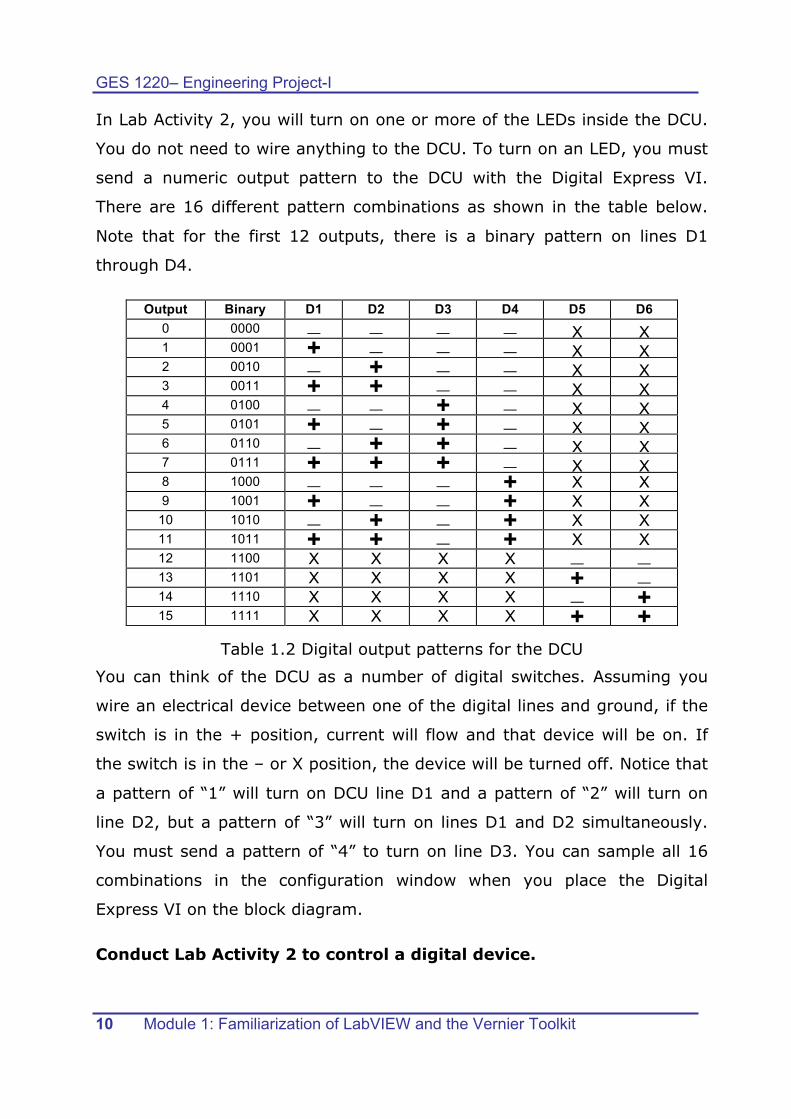
In Lab Activity 2, you will turn on one or more of the LEDs inside the DCU.
You do not need to wire anything to the DCU. To turn on an LED, you must
send a numeric output pattern to the DCU with the Digital Express VI.
There are 16 different pattern combinations as shown in the table below.
Note that for the first 12 outputs, there is a binary pattern on lines D1
through D4.
Output Binary D1 D2 D3 D4 D5 D6 0 0000 — — — — X X 1 0001 + — — — X X 2 0010 — + — — X X 3 0011 + + — — X X 4 0100 — — + — X X 5 0101 + — + — X X 6 0110 — + + — X X 7 0111 + + + — X X 8 1000 — — — + X X 9 1001 + — — + X X
10 1010 — + — + X X 11 1011 + + — + X X 12 1100 X X X X — — 13 1101 X X X X + — 14 1110 X X X X — + 15 1111 X X X X + +
Table 1.2 Digital output patterns for the DCU
You can think of the DCU as a number of digital switches. Assuming you
wire an electrical device between one of the digital lines and ground, if the
switch is in the + position, current will flow and that device will be on. If
the switch is in the – or X position, the device will be turned off. Notice that
a pattern of “1” will turn on DCU line D1 and a pattern of “2” will turn on
line D2, but a pattern of “3” will turn on lines D1 and D2 simultaneously.
You must send a pattern of “4” to turn on line D3. You can sample all 16
combinations in the configuration window when you place the Digital
Express VI on the block diagram.
Conduct Lab Activity 2 to control a digital device.
GES 1220– Engineering Project-I
Module 1: Familiarization of LabVIEW and the Vernier Toolkit 11
1.4 Sensor-Based Control System
Frequently when building your projects, you will use data from an analog
sensor to trigger a digital device. Sensor-based systems are much more
efficient than time-based systems, because the device is not activated until
an appropriate target value is reached. In Lab Activity 3, you will turn on
DCU line D1 when the reading from a Light Sensor is greater than 300 lux.
This type of sensor-based system could have many practical applications in
a home environment, such as signaling the start of a new day when the
sun rises. The DCU could be used to activate a wake-up alarm, open the
curtains, and/or turn off lights.
Conduct Lab Activity 3

GES 1220– Engineering Project-I
Module 1: Familiarization of LabVIEW and the Vernier Toolkit 12
1.5 Lab Activity 1
Objective: To plot data from a light sensor.
Equipment Used:
a) SensorDAQ Interface
b) Vernier Light Sensor
Procedure:
Connect Equipment 1. Connect a Vernier Light Sensor to Channel 1 of the SensorDAQ
interface.
2. Set the switch on the light sensor to the 0–600 lux range.
3. Connect the SensorDAQ interface to the computer.
Write a LabVIEW program to collect light intensity data 1. Start LabVIEW and open a Blank VI.
2. Place a Waveform Chart (found in the Modern - Graph control palette) on the front panel.
3. View the block diagram by choosing Show Block Diagram from the Window menu or use the <Ctrl-E> (<Command-E> on a Macintosh) shortcut.
4. Click and drag the Analog Express VI (found in the Vernier function palette) to the block diagram workspace. Note there may be a pause while initializing the Analog Express VI, depending on your computer.
Tip: Be sure to choose the Analog Express VI from the function palette that
matches your interface (SensorDAQ).
GES 1220– Engineering Project-I
Module 1: Familiarization of LabVIEW and the Vernier Toolkit 13
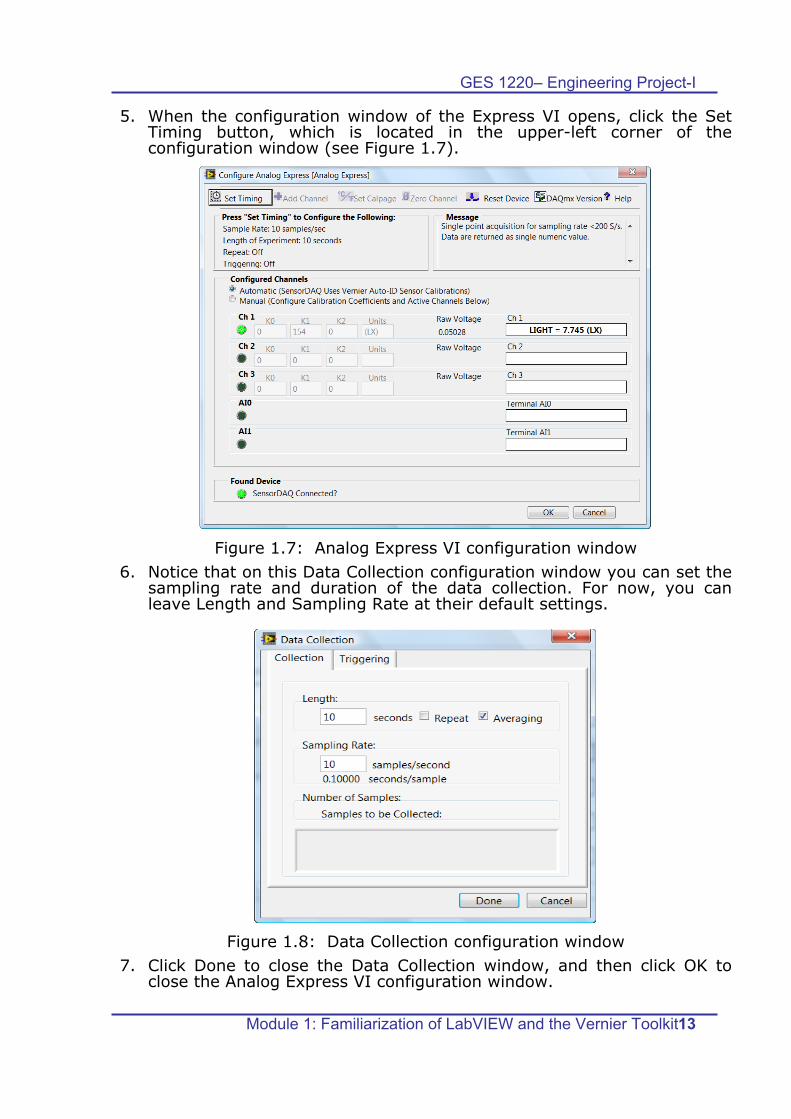
5. When the configuration window of the Express VI opens, click the Set Timing button, which is located in the upper-left corner of the configuration window (see Figure 1.7).
Figure 1.7: Analog Express VI configuration window
6. Notice that on this Data Collection configuration window you can set the sampling rate and duration of the data collection. For now, you can leave Length and Sampling Rate at their default settings.
Figure 1.8: Data Collection configuration window
7. Click Done to close the Data Collection window, and then click OK to close the Analog Express VI configuration window.

GES 1220– Engineering Project-I
Module 1: Familiarization of LabVIEW and the Vernier Toolkit 14
8. Wire the Analog Express VI’s CH 1 Auto-ID terminal to the icon for the Waveform Chart.
9. Drag a While Loop (found in the Programming - Structures function palette) around the Analog Express VI and the Waveform Chart.
10. Wire the “stop (F)” and “stopped” terminals on the Analog Express VI as shown in the figure below.
Figure 1.9: Sample program for graphing with the Light Sensor
Tip: The “stop (F)” and “stopped” terminals should always be wired as shown in the figure above to ensure that you will not leave your program and the hardware in an ambiguous state by having the loop terminate before data collection ends. You will certainly receive errors in your programs if you do not follow this convention.
11. To return to the front panel, choose Show Front Panel from the Window menu or use the <Ctrl-E> (<Command-E> on a Macintosh) shortcut.
12. Run your program. Shine the Light Sensor at various objects in the room while noticing how the chart plot changes with different amounts of reflected light. Try to reproduce a “W” shape on the graph, as shown below.
Figure 1.10: Sample graph using the Light Sensor

GES 1220– Engineering Project-I
Module 1: Familiarization of LabVIEW and the Vernier Toolkit 15
Tip: A Waveform Chart has a default X-Axis Maximum value of 100 and a Scaling Factor Multiplier of 1. It is your job as the programmer to modify these values to match your timing. Right-click the Waveform Chart and select Properties to view the Chart Properties configuration window. On the Scales tab, set the Multiplier for the Time axis to 0.1 and the X-Axis Maximum to 10.
Figure 1.11: Chart Properties configuration window

GES 1220– Engineering Project-I
Module 1: Familiarization of LabVIEW and the Vernier Toolkit 16
1.6 Lab Activity 2
Objective:
To turn on a DCU (Digital Control Unit) line for 3 seconds.
Equipment Used:
a) SensorDAQ Interface
b) Vernier Light Sensor
c) Digital Control Unit (DCU)
Procedure:
Connect Equipment 1. Connect a Vernier DCU to DIG 1 on the interface.
2. Connect a power supply to the DCU.
3. Connect the interface to the computer.
Write a LabVIEW program to turn on one or more DCU lines for 3 seconds
4. Start LabVIEW and open a Blank VI.
5. View the block diagram by choosing Show Block Diagram from the Window menu.
6. Click and drag the Digital Express VI (found in the Vernier function palette) to the block diagram workspace.
Tip: Be sure to choose the Digital Express VI from the function palette that matches your interface (SensorDAQ).
7. When the Express VI’s configuration window first opens, select DCU Output Lines 1–6 from the Device Selection panel to see the view shown in figure.

GES 1220– Engineering Project-I
Module 1: Familiarization of LabVIEW and the Vernier Toolkit 17
Figure 1.12: Digital Express VI configuration window
8. Click the radio button next to Lines On for Specified Time and keep the default value of 3 seconds. Click the OK button.
9. Right-click on the DCU Pattern input terminal of the Digital Express VI and select Create - Control.
Figure 1.13: Sample program for turning on one or more DCU lines for 3 seconds
10. Return to the front panel by choosing Show Front Panel from the Window menu or use the keyboard shortcut.
11. Input a value between 0 to 15 into your DCU Pattern control, and then run your program. One or more LEDs inside the DCU will light up for 3 seconds and then turn off.
Note: Patterns “0” and “12” will turn all lines off.

GES 1220– Engineering Project-I
Module 1: Familiarization of LabVIEW and the Vernier Toolkit 18
1.7 Lab Activity 3
Objective:
To control a DCU line with a light sensor.
Equipment Used:
a) SensorDAQ Interface
b) Vernier Light Sensor
c) Digital Control Unit (DCU)
Procedure:
Connect Equipment 1. Plug a Vernier Light Sensor into Channel 1 on the interface. Set the
switch to the 0–600 lux range.
2. Connect a Vernier DCU to DIG 1 on the interface.
3. Connect a power supply to the DCU.
4. Connect the interface to the computer.
Write a LabVIEW program for the control system 5. Start LabVIEW and open a Blank VI.
6. Place a Waveform Chart (found in the Modern ▶ Graph control palette) on the front panel.
7. View the block diagram by choosing Show Block Diagram from the Window menu or using the <Ctrl-E> (<Command-E> on a Macintosh) shortcut.
8. Click and drag the Digital Express VI (found in the Vernier function palette) to the block diagram workspace. Be sure to choose the Digital Express VI from the function palette that matches your interface.
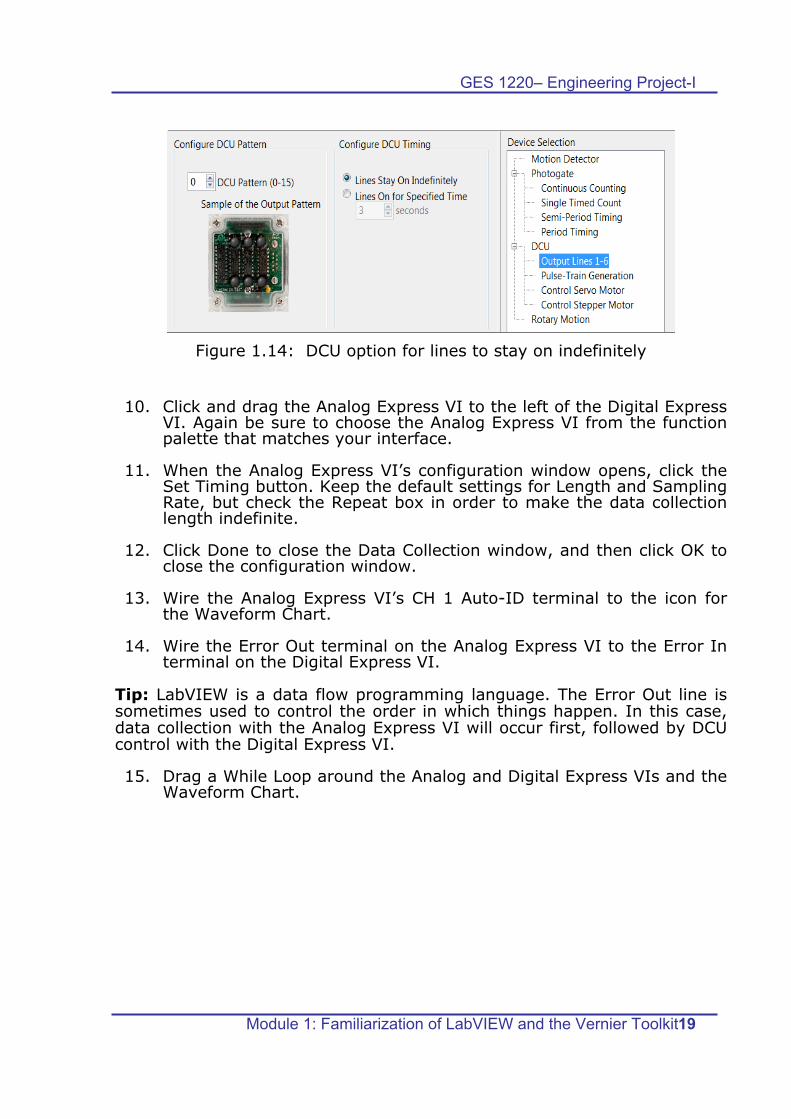
9. When the Express VI’s configuration window first opens, select DCU Output Lines 1–6 from the Device Selection panel. Note that under Configure DCU timing, the button for Lines Stay On Indefinitely is selected by default. Leave it this way. Click the OK button.
GES 1220– Engineering Project-I
Module 1: Familiarization of LabVIEW and the Vernier Toolkit 19
Figure 1.14: DCU option for lines to stay on indefinitely
10. Click and drag the Analog Express VI to the left of the Digital Express VI. Again be sure to choose the Analog Express VI from the function palette that matches your interface.
11. When the Analog Express VI’s configuration window opens, click the Set Timing button. Keep the default settings for Length and Sampling Rate, but check the Repeat box in order to make the data collection length indefinite.
12. Click Done to close the Data Collection window, and then click OK to close the configuration window.
13. Wire the Analog Express VI’s CH 1 Auto-ID terminal to the icon for the Waveform Chart.
14. Wire the Error Out terminal on the Analog Express VI to the Error In terminal on the Digital Express VI.
Tip: LabVIEW is a data flow programming language. The Error Out line is sometimes used to control the order in which things happen. In this case, data collection with the Analog Express VI will occur first, followed by DCU control with the Digital Express VI.
15. Drag a While Loop around the Analog and Digital Express VIs and the Waveform Chart.

GES 1220– Engineering Project-I
Module 1: Familiarization of LabVIEW and the Vernier Toolkit 20
16. Wire the “stop (F)” and “stopped” terminals on the Analog Express VI and Digital Express VI, as shown in figure 2.15.
Figure 1.15: Connecting the Analog Express VI to the Digital Express VI
Tip: Notice that the Digital Express VI is now showing “stop (F)” and “stopped” terminals just like the Analog Express VI. The “stop (F)/stopped” terminals will appear on the Digital Express VI whenever the response to an input is immediate. If the “stop (F)/stopped” terminals are not visible, it means the current action must complete before the VI can move on to the next action (as was the case with the 3 second wait in the previous exercise). As a general rule, if the “stop (F)” and “stopped” terminals are present, they should be wired to control the flow of the program.
17. Place a Greater function (found in the Programming - Comparison function palette) to the right of the Analog Express VI.
18. Wire the CH 1 Auto-ID terminal on the Analog Express VI to the upper terminal on the Greater? function.
19. Right-click the lower terminal of the Greater function and select Create � Constant. Enter 300 as the value of the constant.
Figure 1.16: Creating a comparison for the light intensity

GES 1220– Engineering Project-I
Module 1: Familiarization of LabVIEW and the Vernier Toolkit 21
20. Right-click on the upper terminal of the Select function and choose Create Constant. Enter 1 as the value of the constant.
21. Right-click on the lower terminal of the Select function and choose Create Constant. Enter 0 as the value of the constant.
22. Wire the output terminal of the Greater function to the middle terminal on the Select function.
23. Wire the output terminal on the Select function to the DCU Pattern terminal on the Digital Express VI. The final program is shown below.
Figure 1.17: Final program for controlling the DCU with the Light Sensor 24. Return to the front panel and run your program.
25. Shine the Light Sensor out the window or at a bright light source. The LED in the top of the DCU should turn on when the sensor reading goes above 300. Shine the Light Sensor at a dark object or cover it with your hand. The LED should turn off as the reading goes below 300. Repeat this process several times.
Figure 1.18: Sample graph for light intensity with DCU indefinite setting
26. Modify the Digital Express VI by selecting the Lines On for Specified Time option, and keep the default value of 3 seconds. Delete any broken wires and wire the Analog Express VI stopped terminal to the While Loop’s conditional terminal. Before running this modified VI predict the behavior. How will this change affect the Light Sensor readings? What changes occurred to the Digital Express VI terminals?
______________________________________________________________________
______________________________________________________________________
GES 1220– Engineering Project-I
Module 1: Familiarization of LabVIEW and the Vernier Toolkit 22
1.8 Review Exercise
1. Define the term ‘Data Acquisition’.
________________________________________________________
________________________________________________________
________________________________________________________
2. Differentiate between an Analog Express VI and a Digital Express VI.
________________________________________________________
________________________________________________________
________________________________________________________
________________________________________________________
________________________________________________________
3. What is the number of electrical devices that a DCU can control?
________________________________________________________
________________________________________________________
4. Draw the block diagram of a Data Acquisition System showing the
different elements.
5. In order to turn on DCU lines 2 and 3 simultaneously, the number
pattern that must be sent to the DCU is _________.