english language learners - council of the great … survey... · proficiency in reading and math...
TRANSCRIPT

English Language Learners
in America’s Great City
Schools:
Demographics, Achievement, and Staffing
Research conducted by the Council of the Great City Schools

Draft
English Language Learners in America’s Great City Schools:
Demographics, Achievement, and Staffing _______________________________________________________________________________________________________________________________________________________________________________________________________________
Prepared by the
Council of the Great City Schools Washington, DC
Gabriela Uro
Alejandra Barrio
2013

Draft
1
Table of Contents
Table of Contents ...........................................................................................................................1
Tables ..............................................................................................................................................3
Exhibits ...........................................................................................................................................5
Acknowledgements ........................................................................................................................7
Executive Summary .......................................................................................................................8
Introduction ..................................................................................................................................12
Methodology .................................................................................................................................13
Response Rate...............................................................................................................................14
Purpose of Report ........................................................................................................................15
I. ELL Placement and Identification ..........................................................................................17
Defining English Language Learners ..................................................................................... 17
Identifying English Language Learners .................................................................................. 19
Options for Enrolling in Instructional Programs for ELLs ..................................................... 22
II. ELL Enrollment ......................................................................................................................26
Enrollment of ELLs in Urban Districts ................................................................................... 26
Number of Refugee Students from 2007-08 through 2009-10 ............................................... 35
Number of Languages and Number of ELLs in Top Five Languages in 2009-10 ................. 35
Number of ELLs Identified as Requiring Special Education Services ................................... 39
III. Recruitment, Hiring, and Evaluation of Instructional Personnel for ELLs ....................42
Recruitment Efforts for Teachers by District.......................................................................... 42
Hiring Priorities for ELL Teachers by District ....................................................................... 43
Components of Staff Evaluation Process Related to ELL Instruction .................................... 44
IV. Teachers of ELLs: State Requirements and Number of Teachers with Relevant
Endorsements or Certification....................................................................................................47
State Requirements of Teachers Providing Instruction to English Language Learners ......... 47
Total Number of Teachers with Credentials, Certifications, or Endorsements Related to
Instruction of ELLs ................................................................................................................. 53
V. Assignments of Instructional Staff and Estimated Shortage of ELL Teachers ................54
Number of Teachers in 2009–10............................................................................................. 54
Number of Instructional Assistants by Grade Span ................................................................ 55
Assignments of ELL teachers with Endorsements and ELL teacher shortage ....................... 57
2
VI. Achievement Data ..................................................................................................................58
English Language Proficiency Data for 2009–10 by Level of Proficiency ............................ 58
Proficiency in Reading and Math on NAEP ........................................................................... 69
Successful Completion of Algebra I by Grade 8 or 9 and ELL Status. .................................. 75
ELL Participation in Gifted and Talented Programs .............................................................. 79
VII. Financial Information ..........................................................................................................83
Sources of Funding for ELL Programs ................................................................................... 83
Basic School Funding and Other Categories of Support for ELL Programs .......................... 84
Estimated Number of ELLs Served with Title III Funds ........................................................ 85
Stakeholders that Provide Input on the Use of Title III Funds ............................................... 85
Uses of Title III Funds ............................................................................................................ 87
Setting Budget Priorities ......................................................................................................... 92
VIII. Conclusion ...........................................................................................................................95
IX. Appendices .............................................................................................................................97
Appendix A. Full Names of Council Member Districts ......................................................... 99
Appendix B. Tests Used by the States for Initial Classification of English Language Learners
for the 2009–10 School Year ................................................................................................ 100
Appendix C. English Language Proficiency Assessments by State, SY2009–10 ................ 102
Appendix D. Entity Determining Hiring Priorities for ELL Teachers by District ............... 104
Appendix E. Tests of Statistical Significance on Changes and Gaps in NAEP Scores Between
ELLs, Non-ELLs, and Former ELLs (Large City and National Public Samples) ................ 106
Appendix F. Districts responding to each question .............................................................. 109
Draft
3
Tables Table A. Students identified as English Language Learners in U.S. public schools .......................9
Table B. ELLs in school districts served by Title III funds .............................................................9
Table C. District responses to survey ...........................................................................................16
Table 1. Criteria used in districts’ definition of ELLs ...................................................................19
Table 2. Number of responding districts following specified practices for identifying ELLs ......20
Table 3. Districts with state-defined or district-modified home language surveys .......................21
Table 4. Districts with opt-in or opt-out requirements defined by state law or regulation ............24
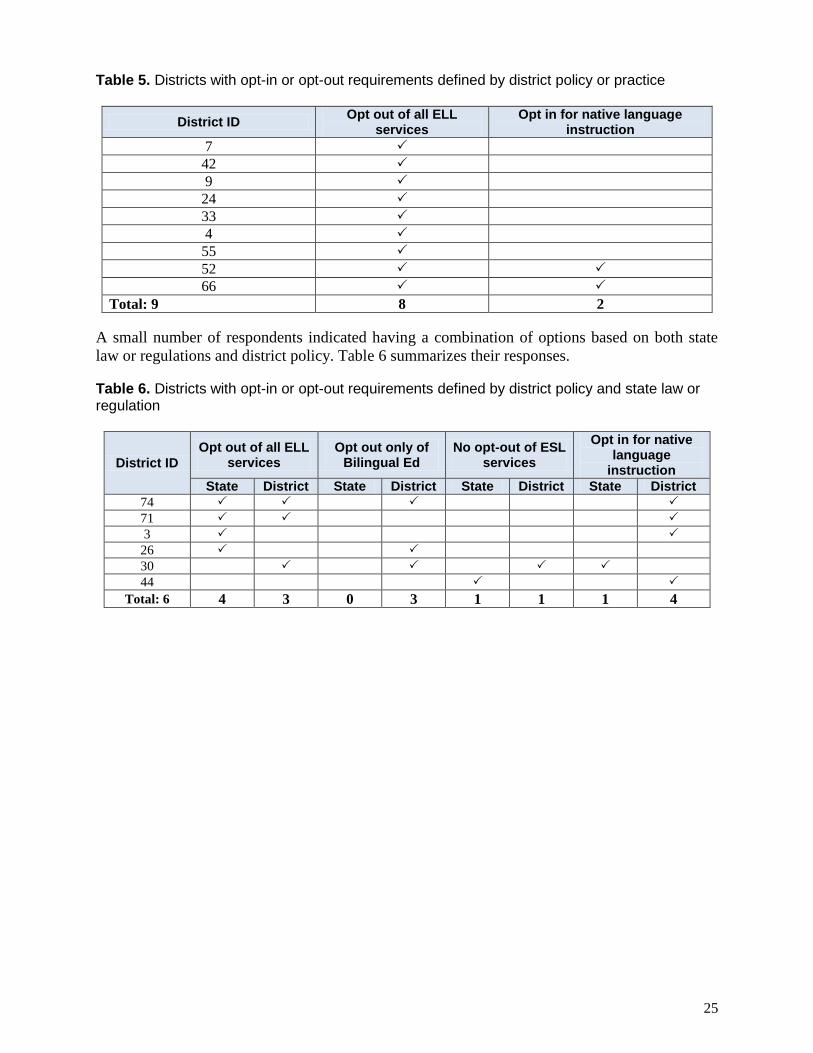
Table 5. Districts with opt-in or opt-out requirements defined by district policy or practice .......25
Table 6. Districts with opt-in or opt-out requirements defined by district policy and state law or
regulation .......................................................................................................................................25
Table 7. Total K-12 student and ELL enrollment in Council member districts, 2007–08 to 2009–
10....................................................................................................................................................26
Table 8. Districts with the greatest increase or decrease in the percentage of ELLs between
2007–08 and 2009–10 ....................................................................................................................27
Table 9. Total K-12 student and ELL enrollment ranked by ELL enrollment in 2009–10 ...........29
Table 10. Total K-12 student and ELL enrollment ranked by ELL percentage in 2009–10 .........32
Table 11. Number of refugees from 2007–08 to 2009–10.............................................................35
Table 12. Number and percentage of ELLs speaking the most frequently spoken languages,
2009–10..........................................................................................................................................36
Table 13. Districts with the highest number of ELLs speaking the top five languages* ..............38
Table 14. ELL and non-ELL participation in special education, 2007-08 through 2009-10.........39
Table 15. Special education disproportionality ratios for ELLs by district, 2009–10 ...................41
Table 16. Teacher recruitment efforts by district...........................................................................42
Table 17(a). Districts that incorporated components related to ELL instruction into the
evaluations of instructional staff (teachers and assistants) ............................................................44
Table 17(b). Districts that incorporated components related to ELL instruction into the
evaluations of instructional specialists and administrators ............................................................45
Table 18. State requirements for bilingual teachers.......................................................................48
Table 19. State requirements for ESL teachers ..............................................................................49
Table 20. State requirements for general education teachers of ELLs ..........................................50
Table 21. State requirements for special education teachers of ELLs ...........................................52
4
Table 22. Total number of teachers by type of credentials, certifications, or endorsements .........53
Table 23. ELL and non-ELL teachers by grade span, 2009–10 ....................................................54
Table 24. Numbers and Percentages of ELL and non-ELL teachers in selected districts by grade
span, 2009–10 ................................................................................................................................55
Table 25. Instructional assistants by grade span, 2009–10 ............................................................56
Table 26. Total instructional assistants by category and grade, 2009–10 .....................................56
Table 27. Assignments of teachers with ESL/bilingual endorsements and the availability of ELL
teachers. .........................................................................................................................................57
Table 28. Total number of ELLs, former-ELLs, and non-ELLs completing Algebra I by ...........75
Grade 8 or 9, 2007-08 through 2009-10 ........................................................................................75
Table 29. Percentages of ELLs and non-ELLs in Grades 6-12 completing Algebra I, 2007–08
through 2009–10 ............................................................................................................................77
Table 30. Total number of ELLs, former ELLs, and non-ELLs enrolled in gifted and talented ...79
Table 31. Enrollment in Gifted and Talented programs by ELL and Non-ELL status, 2007-08 to
2009-10 ..........................................................................................................................................80
Table 32. ELL enrollment and ELLs served with Title III funds in responding districts ..............85
Table 33. Professional development staff ......................................................................................88
Table 34. Content of district professional development ................................................................89
Table 35. Extra instructional assistance for ELLs .........................................................................91
Table 36. Districts’ budgeting priorities for Title III funds ...........................................................92
Draft
5
Exhibits Exhibit 1. Range of ELL enrollments in the Great City Schools...................................................28
Exhibit 2. Number of districts by range of ELLs as a percentage of total student enrollment in
2009–10..........................................................................................................................................31
Exhibit 3. ELL enrollment by grade bands 2007–08 through 2009–10 ........................................34
Exhibit 4. ELLs as a percentage of enrollment by grade bands 2007–08 to 2009–10 ..................34
Exhibit 5. Percentage of total ELL students, ELLs in special education, and Non-ELLs in special
education 2007–08 through 2009–10............................................................................................40
Exhibit 6. Percentage of ELLs in grades K–5 scoring at each proficiency level (Ranked by level
1 from lowest to highest; up to four levels) ...................................................................................59
Exhibit 7. Percentage of ELLs in grades 6–8 scoring at each proficiency level (Ranked by level 1
from lowest to highest; up to four levels) ......................................................................................60
Exhibit 8. Percentage of ELLs in grades 9–12 scoring at each proficiency level (Ranked by level
1 from lowest to highest; up to four levels) ...................................................................................61
Exhibit 9. Percentage of ELLs in grades K–5 scoring at each proficiency level (Ranked by level
1 from lowest to highest; five or six levels) ...................................................................................63
Exhibit 10. Percentage of ELLs in grades 6–8 scoring at each proficiency level (Ranked by level
1 from lowest to highest; five or six levels) ...................................................................................65
Exhibit 11. Percentage of ELLs in grades 9–12 scoring at each proficiency level (Ranked by
level 1 from lowest to highest; five or six levels) ..........................................................................67
Exhibit 12. Percentage of grade 4 ELLs, non-ELLs, and former ELLs (LC) performing at or
above proficient in NAEP reading .................................................................................................71
Exhibit 13. Percentage of grade 4 ELLs, non-ELLs, and former ELLs (NP) performing at or
above proficient in NAEP reading ................................................................................................71
Exhibit 14. Percentage of grade 8 ELLs, non-ELLs and Former ELLs (LC) performing at or
above proficient in NAEP reading .................................................................................................72
Exhibit 15. Percentage of grade 8 ELLs, non-ELLs and former ELLs (NP) performing at or
above proficient in NAEP reading .................................................................................................72
Exhibit 16. Percentage of grade 4 ELLs, Non-ELLs and former ELLs (LC) performing at or
above proficient in NAEP math .....................................................................................................73
Exhibit 17. Percentage of grade 4 ELLs, non-ELLs and former ELLs (NP) performing at or
above proficient in NAEP math .....................................................................................................73
6
Exhibit 18. Percentage of grade 8 ELLs, Non-ELLs and former ELLs (LC) performing at or
above proficient in NAEP math .....................................................................................................74
Exhibit 19. Percentage of Grade 8 ELLs, non-ELLs and former ELLs (NP) performing at or
above proficient in NAEP math .....................................................................................................74
Exhibit 20. Percentage of students completing Algebra I by ELL status, 2009–10 .....................76
Exhibit 21. Percentage of students participating in GT by ELL status, 2007-08 to 2009–10 .......79
Exhibit 22. Basic school funding and other categories of support for ELL programs by number of
districts ...........................................................................................................................................84
Exhibit 23. Stakeholders that provide input on the use of Title III funds ......................................86
Exhibit 24. ELL services and Title III funds, 2009–10 .................................................................87

Draft
7
Acknowledgements
This report is the product of considerable collaboration across the membership of the Council of
the Great City Schools. Many people played a role in deciding what to collect as part of this
study, and many individuals helped gather the data that made this report one of the most
comprehensive data-collection efforts on English Language Learners ever attempted.
We particularly appreciate the time that bilingual education program directors from Council-
member districts devoted to gathering the information contained in this report. We know that the
effort involved numerous district offices and the fresh analysis of data. We were especially
pleased that many of the responding districts were able to provide disaggregated data in a way
that allowed us a glimpse into urban school districts and the ELLs they serve that few have ever
seen before.
This study was also the product of considerable collaboration inside the Council office itself. We
thank Candace Simon and Renata Uzzell, two of our talented research staff members, for their
contributions in analyzing the achievement data and conducting the statistical analyses on those
data. We also thank Moses Palacios for his assistance in displaying the data and with overall data
edits.
Julie Wright Halbert and Sue Gamm reviewed the findings related to ELLs who receive special
education services. Jonathan Lachlan-Haché and Manish Naik were also vital parts of the
project, from the design and release of the survey to the final drafts of the report. Jeff Simering,
the Council’s legislative director, provided important feedback throughout, from the design stage
of the survey to the interim findings and the final draft.
Finally, I thank Gabriela Uro and Alejandra Barrio, who led the project and drafted the report.
Their vision, leadership, and energy made sure the report happened. Thank you so much.
Michael Casserly
Executive Director
Council of the Great City Schools
8
Executive Summary
English Language Learners (ELLs) are among the fastest-growing demographic group in U.S.
public schools. There are numerous recent reports documenting this phenomenon. Some reports
estimate the numbers of ELLs enrolled in U.S. public schools, and other reports approximate the
growth in ELL enrollment over the past five to ten years. Still, there is wide variation in the
reported numbers of ELLs enrolled in U.S. schools—some as wide as 500,000 ELLs. In general,
most estimates place the number of these students at around five million. And all sources agree
that the numbers have increased substantially over the years. For instance--
Students Identified as English Language Learners in U.S. Public Schools
The Migration Policy Institute (MPI) reported that in 2010 a total of 5.3 million students
who enrolled in preK-12 in U.S. public schools were English Language Learners.1 The
MPI estimated that ELL enrollment grew by 53.2 percent in the decade from 1997–98 to
2007–08, compared with an increase of only 8.5 percent in the overall enrollment during
the same period.2
The U.S. Department of Education in its Biennial Report to Congress 2004-2006 reported
on the extraordinary growth in ELL enrollment between 1996 and 2006, compared with
increases in the total general enrollment—a 60 percent growth in ELL enrollment,
compared with three percent in the total enrollment.3 The same Biennial Report further
indicated that the number of K–12 students in the United States who were identified as
limited English proficient (LEP) grew by nearly 650,000 from 2002-03 to 2005-06,
resulting in approximately 4,985,000 LEP students in 2005-2006. (The terms LEP and
ELL are used interchangeably in this report.)
The U.S. Department of Education in its 2006-2008 Biennial Report, however, estimated
a lower total of 4.7 million ELLs, despite the documented growth. The difference in the
two reports was explained, in part, by a change in the methodology for counting students
that did not include about 500,000 Puerto Rican ELLs who migrate back and forth
between the continental United States and Puerto Rico.4 (See table A.)
ELLs in School Districts Served by Title III Funds
Data from the 2008–2009 Consolidated Performance Reports submitted by states to the
U.S. Department of Education also indicated a total K–12 ELL population of 4.7 million
in 2008–2009. In addition, the American Institutes of Research reported in the National
Evaluation of Title III Implementation report that of these 4.7 million ELLs, 4.4 million
(95 percent) were enrolled in districts that received federal Title III funds.5 (See table B.)
1 ELL Information Center Fact Sheet Series. No. 1. 2010. ELL data obtained from the National Clearinghouse for
English Language Acquisition (NCELA), Page 1 2 Ibid, page 2.
3 Biennial Report to Congress on the Implementation of Title III State Formula Grant Program, School Years 2004-
2006. OELA, U.S. Department of Education, Washington, D.C., page 8. 4 Biennial Report to Congress on the Implementation of Title III State Formula Grant Program, School Years 2006-
2008. OELA, U.S. Department of Education, Washington, D.C., Pages 7-7. 5 National Evaluation of Title III Implementation – Report on State and Local Implementation. Submitted to the
U.S. Department of Education by the American Institutes for Research, May 2012, 1.
Draft
9
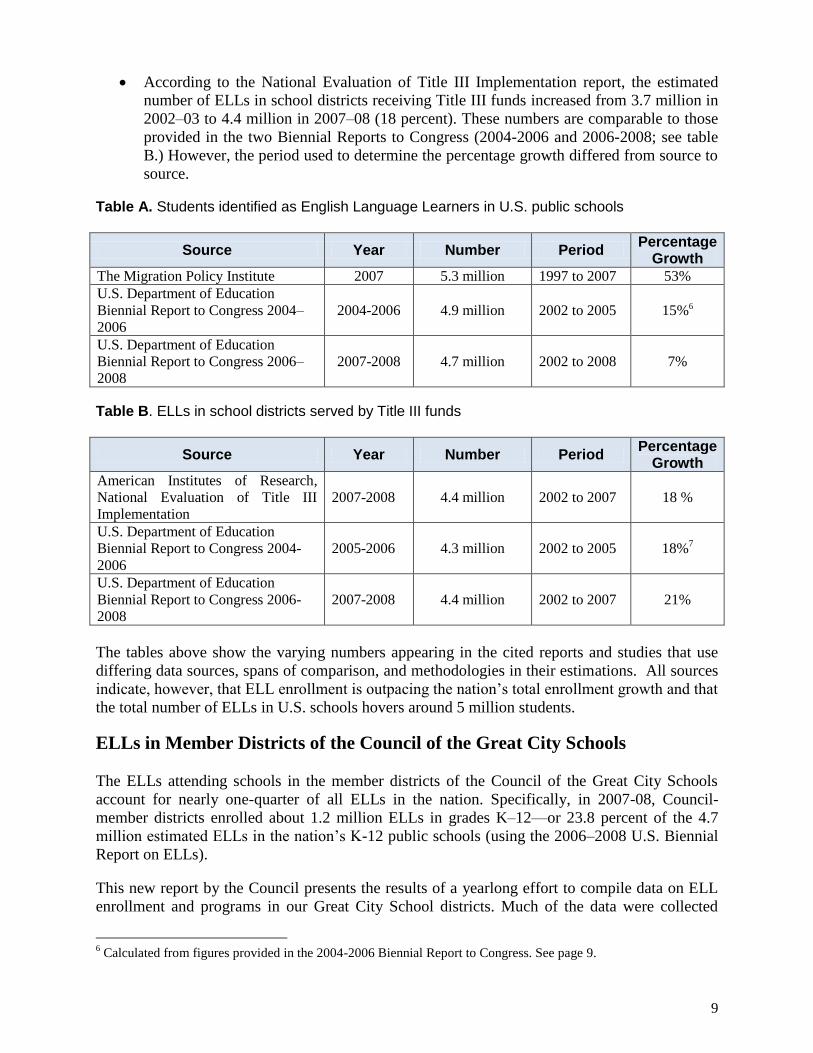
According to the National Evaluation of Title III Implementation report, the estimated
number of ELLs in school districts receiving Title III funds increased from 3.7 million in
2002–03 to 4.4 million in 2007–08 (18 percent). These numbers are comparable to those
provided in the two Biennial Reports to Congress (2004-2006 and 2006-2008; see table
B.) However, the period used to determine the percentage growth differed from source to
source.
Table A. Students identified as English Language Learners in U.S. public schools
Source Year Number Period Percentage
Growth
The Migration Policy Institute 2007 5.3 million 1997 to 2007 53%
U.S. Department of Education
Biennial Report to Congress 2004–
2006
2004-2006 4.9 million 2002 to 2005 15%6
U.S. Department of Education
Biennial Report to Congress 2006–
2008
2007-2008 4.7 million 2002 to 2008 7%
Table B. ELLs in school districts served by Title III funds
Source Year Number Period Percentage
Growth
American Institutes of Research,
National Evaluation of Title III
Implementation
2007-2008 4.4 million 2002 to 2007 18 %
U.S. Department of Education
Biennial Report to Congress 2004-
2006
2005-2006 4.3 million 2002 to 2005 18%7
U.S. Department of Education
Biennial Report to Congress 2006-
2008
2007-2008 4.4 million 2002 to 2007 21%
The tables above show the varying numbers appearing in the cited reports and studies that use
differing data sources, spans of comparison, and methodologies in their estimations. All sources
indicate, however, that ELL enrollment is outpacing the nation’s total enrollment growth and that
the total number of ELLs in U.S. schools hovers around 5 million students.
ELLs in Member Districts of the Council of the Great City Schools
The ELLs attending schools in the member districts of the Council of the Great City Schools
account for nearly one-quarter of all ELLs in the nation. Specifically, in 2007-08, Council-
member districts enrolled about 1.2 million ELLs in grades K–12—or 23.8 percent of the 4.7
million estimated ELLs in the nation’s K-12 public schools (using the 2006–2008 U.S. Biennial
Report on ELLs).
This new report by the Council presents the results of a yearlong effort to compile data on ELL
enrollment and programs in our Great City School districts. Much of the data were collected
6 Calculated from figures provided in the 2004-2006 Biennial Report to Congress. See page 9.
10
from the membership via survey in 2012. Some 70.8 percent of the membership responded (46
of 65 districts who were members at the time the survey was conducted), but not every district
responded to every question. In appendix F of this report, we list the specific districts responding
to each question. The responses provide a picture of ELL enrollment across the 46 responding
districts, including total numbers, percentages, enrollment by school level, languages spoken,
and ELLs receiving special education services.
Report Highlights
The enrollment of ELLs in the 65 districts comprising the Council of the Great City Schools, at
the time this survey was conducted, has remained relatively stable over the last several years
(2007–08 through 2009–10) at about 17 percent of total urban school enrollment. Total ELL
enrollment in these districts was about 1.1 million students in 2007–08 and 1.2 million in 2009–
10. In 2009–10, 22 of the 65 districts had between 1,001 and 5,000 ELLs, and 19 districts had
between 10,001 and 50,000 ELLs. ELLs accounted for more than 20 percent of enrollment in at
least 19 member districts and for 10 percent or less in 29 member districts.
The survey used to gather data for this report also asked districts about the definitions they used
to identify ELLs. Most responding districts indicated that they used the definitions required by
their states while some modified those definitions at the local level. The ELL enrollment figures
reported by districts reflect their differing definitions. Most definitions involved a combination
of a student’s home or native language when it was different from English and some measure of
whether a student meets proficient levels on state assessments or has difficulty in English-only
classrooms.
Among the responding districts, there was considerable variation in district and state policies
related to parental rights to opt out of ELL language-instruction programs and/or to opt in to
specific instructional initiatives like dual language programs. Typically, the variability stemmed
from state laws and regulations that the majority of responding districts indicated they followed.
In addition, the survey asked for information on the top five languages spoken by children in
each district and the number of ELLs speaking each of these languages. Collectively, 38
languages appeared among the top five languages.
Moreover, the survey asked for information about ELLs receiving special education services.
The results showed that the growth in students in this group outpaced the growth in the numbers
of non-ELLs receiving special education, and the increase in ELL enrollments overall.
Survey responses also showed that districts operated under an array of state staffing
requirements, including mandates governing the qualification of teachers of ELLs. The most
common state requirements for bilingual and ESL teachers involved their needing to have an
ESL/ELD license or endorsement. Fewer districts reported having requirements for special
education teachers of ELL students. Districts differed substantially in the ways they were able to
disaggregate data on teachers providing instruction to ELLs. This variation increased when
looking at school or grade levels and types of programs. And the variations were evident for both
teachers and teacher assistants alike. Tables 23 and 24 provide specific numbers of teachers by
type of program and other variables.
Although districts varied in their current and anticipated shortages of ELL teachers, 22 of 43
indicated that they anticipate shortages of such teachers in the next five years. In addition,
Draft
11
nineteen responding districts incorporated instructional components related to ELLs into their
evaluations of instructional staff and administrators other than ESL/ELL teachers themselves.
Only eight districts included components dealing with the instruction of ELLs explicitly in the
evaluation of central office staff.
The report also looks at NAEP achievement data on ELLs, non-ELLs and former ELLs (a
designation used in the National Assessment of Education Progress) in large city (LC) schools.8
We use the term “former ELL” in this report even though NAEP uses the term “formerly ELL”
in its reports. The LC sample closely mirrors Council membership. In fact, schools in Council-
member districts account for about 82 percent of the LC sample. Results showed that
achievement among ELLs failed to keep pace with the growth in achievement by non-ELL
students in both reading and math at both fourth and eighth grades. The gap between these two
groups persists at 19 percentage points or higher on NAEP. Former ELLs, on the other hand,
showed promising progress in achievement, with most reaching parity with their non-ELL
counterparts in math and reading in grade 4.
Still, ELLs and former ELLs in the LC sample performed no worse on NAEP than their language
peers nationally, except in the case of eighth grade math, where former ELLs in large cities
scored lower than the national public (NP) sample. In general, the gap between ELLs and non-
ELLs is smaller in the LC sample than in the NP sample—however, the reason may be because
of the lower achievement of non-ELLs in large cities.
In addition, district responses to the Council’s survey indicated that ELLs have lower levels of
participation in gifted and talented programs than other students, but they sometimes have higher
rates of completing Algebra I by grade 8 or 9.
The Council estimates that the total amount of federal Title III funds received by the 65 districts
in the Council averaged about $150 million annually over the three-year period from 2007–08 to
2009–10. This amount is relatively small compared with the total amounts of state and local
funding devoted to supporting instruction for ELLs. The 32 districts providing specific financial
data on the survey reported receiving about $75 million in Title III funds but had about $703
million in other state and local funds to support instruction for ELLs.
Finally, some 42 of 46 responding districts were able to provide information about how they
spent their Title III funds. Most were using these dollars to provide professional development
and to acquire or develop instructional materials. However, Title III activities with the highest
expenditure levels involved hiring additional staff to support ELL instruction and provide extra
instruction assistance. The report provides additional information on the staff members who
receive professional development and the topics of such training.
8 The NAEP is a sample-based survey assessment that reports on student performance in reading and mathematics in the fourth
and eighth grades. Results are reported by state, for a national sample (NP), and a large city sample (LC)
12
Introduction
The Council of the Great City Schools conducted a comprehensive survey of its 65 district
members about the English Language Learners that were enrolled and the instructional services
provided to them.9 The survey collected information on (1) district demographics and languages
spoken, (2) instructional staff, (3) achievement data, and (4) financial information. The findings
from this survey make up the bulk of this report.
In addition, the report drew on data from the National Center for Education Statistics (NCES)
Common Core of Data (CCD) and from the National Assessment of Educational Progress
(NAEP).
9 Two additional members, Bridgeport Public Schools and Santa Ana Unified District, joined after the survey was
closed
Draft
13
Methodology
The Council administered an extensive survey to its bilingual education directors in 2012. The
survey requested data that required most ELL program directors receiving the survey to access
multiple data sources in their respective districts. In some cases, ELL office staff had limited or
no access to the data requested and had to secure it from other departments or offices within the
district. Completing the survey was an illuminating year-long exercise for district and Council
staff alike, and the difficulties in collecting and reporting data resulted in gaps in survey
responses from one question to another.
Council staff filled these gaps, as best they could, with data obtained from national databases
(NCES, CCD) and/or district websites. In this process, we discovered significant discrepancies
between district-reported data from the survey or the websites and the national databases. In
cases where we had competing numbers, we chose to use the district-reported data after verifying
them with the district itself.
In addition, this report uses the same numerical codes to represent districts as are used for the
Council’s Key Performance Indicator (KPI) project to ensure confidentiality where it is needed.
Some of the data are sensitive, so district names were converted into codes corresponding to the
KPI-report numbers.10
10
Managing for Results in America’s Great City Schools. Washington, DC: Council of the Great City Schools,
October 2012.
14
Response Rate
The findings from this report are based on responses from 46 districts or 70.8 percent of the 65
member districts of the Council of the Great City Schools at the time the survey was
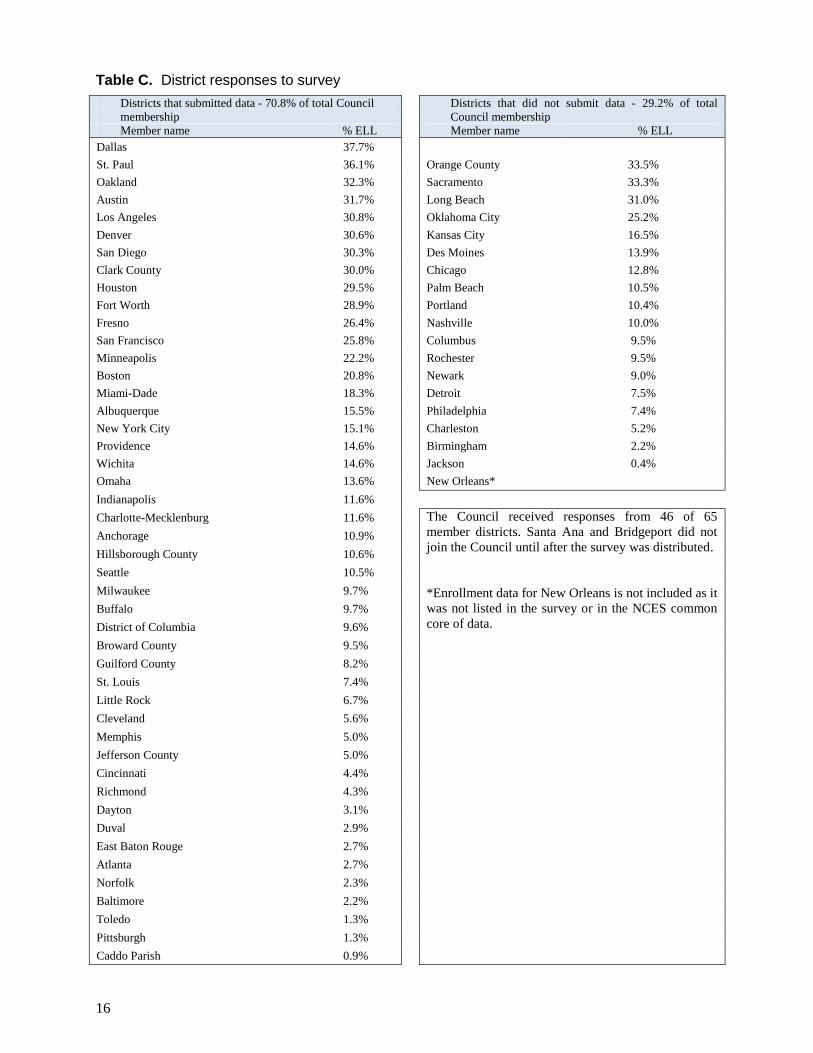
administered. Table C shows which districts responded to the survey and the percentage of ELLs
in each district. For the purposes of this report, the formal title of each member districts is
shortened, but the full titles are listed in appendix A.
In order to present the most comprehensive data on ELLs in Council-member districts, we
aggregated all responses available and provided the number of responses (N-size) by item as we
discuss the report’s findings. Given the differing—and in some cases small—N-sizes per
question, this report limits itself to descriptive statistics in order to give the reader a general
picture of ELL characteristics and programming in Council districts.
Moreover, the Council extracted data from the National Center for Education Statistics (NCES)
and district websites to supplement missing data on ELL enrollment and teachers. We also used
those sources for districts that did not respond to the survey. Appendix F lists the districts that
are included in the tables and graphs.
Draft
15
Purpose of Report
This report has four main purposes--
Provide Updated ELL Enrollment Data on Urban Schools. District-level data, while reported to
the U.S. Department of Education, are not easily accessible and are not included in the regularly
issued reports by various agencies and organizations. Some district data make their way into
national reports or studies prepared by the U.S. Department of Education or other entities. No
such data, however, focuses solely on the nation’s largest urban school districts. This report
allows the Council to accurately portray ELL enrollment data in our membership.
Support Advocacy and Technical Assistance. Compiling timely and accurate information and
data on ELL enrollment, services, performance, and expenditures is critical to our policy
development and advocacy work for our membership, which serves nearly a quarter (24 percent)
of the nation's ELLs.11
Describe How Title III Expenditures Are Used. Council member districts receive a substantial
portion of total federal Title III funding. It is therefore imperative that the Council be able to
describe how these funds are used to support and enhance the instructional programs for ELLs.
Identify Promising Practices and Areas of Need. The survey allows us to identify commonalities
among ELL demographics and ELL programs in the Council-member districts to strengthen the
work of ELL program directors. Data sheds light on promising practices as well as areas where
additional support is required to improve ELL achievement.
11
Enrollment figures reflect a combination of district responses, data drawn from NCES, and in a few cases,
numbers drawn from the districts’ websites.
16
Table C. District responses to survey
Districts that submitted data - 70.8% of total Council
membership
Districts that did not submit data - 29.2% of total
Council membership Member name % ELL Member name % ELL
Dallas 37.7%
St. Paul 36.1% Orange County 33.5%
Oakland 32.3% Sacramento 33.3%
Austin 31.7% Long Beach 31.0%
Los Angeles 30.8% Oklahoma City 25.2%
Denver 30.6% Kansas City 16.5%
San Diego 30.3% Des Moines 13.9%
Clark County 30.0% Chicago 12.8%
Houston 29.5% Palm Beach 10.5%
Fort Worth 28.9% Portland 10.4%
Fresno 26.4% Nashville 10.0%
San Francisco 25.8% Columbus 9.5%
Minneapolis 22.2% Rochester 9.5%
Boston 20.8% Newark 9.0%
Miami-Dade 18.3% Detroit 7.5%
Albuquerque 15.5% Philadelphia 7.4%
New York City 15.1% Charleston 5.2%
Providence 14.6% Birmingham 2.2%
Wichita 14.6% Jackson 0.4%
Omaha 13.6% New Orleans*
Indianapolis 11.6%
Charlotte-Mecklenburg 11.6% The Council received responses from 46 of 65
member districts. Santa Ana and Bridgeport did not
join the Council until after the survey was distributed.
*Enrollment data for New Orleans is not included as it
was not listed in the survey or in the NCES common
core of data.
Anchorage 10.9%
Hillsborough County 10.6%
Seattle 10.5%
Milwaukee 9.7%
Buffalo 9.7%
District of Columbia 9.6%
Broward County 9.5%
Guilford County 8.2%
St. Louis 7.4%
Little Rock 6.7%
Cleveland 5.6%
Memphis 5.0%
Jefferson County 5.0%
Cincinnati 4.4%
Richmond 4.3%
Dayton 3.1%
Duval 2.9%
East Baton Rouge 2.7%
Atlanta 2.7%
Norfolk 2.3%
Baltimore 2.2%
Toledo 1.3%
Pittsburgh 1.3%
Caddo Parish 0.9%
Draft
17
I. ELL Placement and Identification Defining English Language Learners (N = 44 Districts)
Section 9101 of the Elementary and Secondary Education Act (ESEA, as amended by the No
Child Left Behind Act of 2001), defines a Limited English Proficient (LEP) student as having a
number of characteristics (see sidebar). This definition has direct relevance to Title III of the
Elementary and Secondary Education
Act (ESEA), the title that authorizes
federal funding to support instructional
programs for these students. According
to several national studies and reports,
about 94 percent of districts that enroll
LEP students, also referred to as English
Learners, receive Title III funds and
therefore operate their programs under
the federal legal definition of LEP. The
federal definition provided in ESEA,
however, does not result in consistent
operational definitions across the states
and districts. As noted by the National
Academy of Sciences (2011), the
federal definition includes elements that
are relatively objective and elements
that are relatively subjective. The
objective criteria make reference to
demographics, background, and ability
to meet a proficient level of
achievement on state assessments. The
subjective criteria include sufficient
command of the English language to be
successful in classrooms where the
language of instruction is English or to
participate fully in society.12
Not only is the federal definition itself
complex but there is considerable
variability caused by vagueness in how
the definition should be operationalized.
In fact, the U.S. Department of
Education has concluded, “there is no
one, common, approved method to
operationalize the term, either for initial
identification purposes or for ultimate
exit from a Language Instruction
12
National Research Council of the National Academy of Sciences, Allocating Federal Funds for State Programs for
English Language Learners, 2011, 5.
LIMITED ENGLISH PROFICIENT- The term
limited English proficient, when used with respect to an
individual, means an individual —
(A) who is aged 3 through 21;
(B) who is enrolled or preparing to enroll in an
elementary school or secondary school;
(C) (i) who was not born in the United States or whose
native language is a language other than English;
(ii) (I) who is a Native American or Alaska Native, or
a native resident of the outlying areas; AND
(II) who comes from an environment where a
language other than English has had a significant impact
on the individual's level of English language proficiency;
OR
(iii) who is migratory, whose native language is a
language other than English, and who comes from an
environment where a language other than English is
dominant; AND
(D) whose difficulties in speaking, reading, writing, or
understanding the English language may be sufficient to
deny the individual —
(i) the ability to meet the State's proficient level of
achievement on State assessments described in section
1111(b)(3);
(ii) the ability to successfully achieve in classrooms
where the language of instruction is English; OR
(iii) the opportunity to participate fully in society.
Source: No Child Left Behind Act, P.L. 107-20110, Title
IX, Part A, Sec. 9101 (25)
18
Educational Program or the LEP category.”13
Moreover, a 2006 U.S. Government Accountability
Office study documented at least three operational definitions that could be used to identify LEP
populations. These definitions included the following:
ELLs Assessed. The number of K–12 students with limited English proficiency who are
assessed for English proficiency using state-developed assessment instruments and
protocols.
ELLs Identified. The number of K–12 students identified as limited English proficient
using various methods and documents issued by both state educational agencies (SEAs)
and local schools districts or local educational agencies (LEAs)
ELLs Enrolled. The number of K–12 students enrolled in state and local Title III
programs according to data reported to SEAs by LEAs.14
The official definition of ELL used by the U.S. Department of Education in state reports is the
legal definition, but both the complexity of the definition and the discretion given to states in
operationalizing the definition lead to significant variability across Council-member districts.
The National Title III Study indicates that only eight states and the District of Columbia have
established consistent statewide criteria for identifying ELLs, with the remaining 42 states
providing districts with discretion in making identification decisions.15
The survey used for this Council of the Great City Schools report asked districts to provide their
definitions of ELL or LEP. The definitions provided by 44 responding districts included a range
of components. Thirty of those districts referenced state definitions of LEP/ELLs.
Operationalizing the LEP/ELL Definition
Some 44 Great City School districts responded to the question about the operational components
of their definitions of what an ELL was. Twenty-six of those districts indicated that they
included an achievement component along with a determination that the student’s home
language or native language was not English.
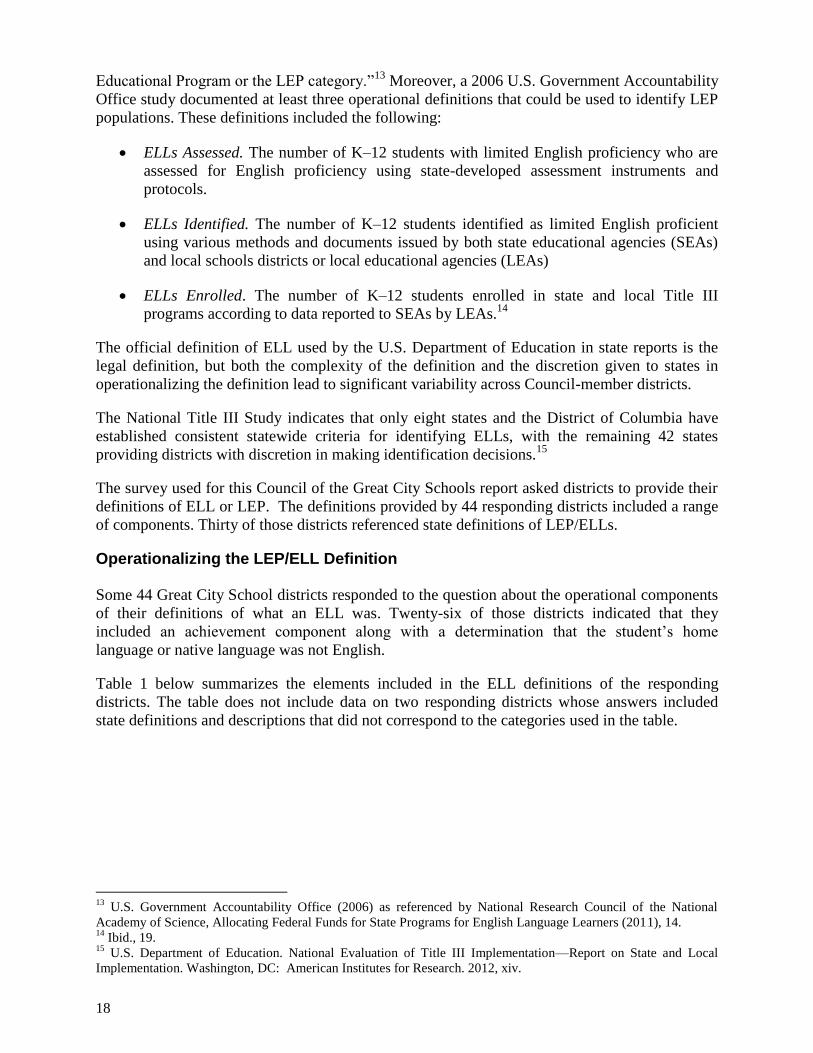
Table 1 below summarizes the elements included in the ELL definitions of the responding
districts. The table does not include data on two responding districts whose answers included
state definitions and descriptions that did not correspond to the categories used in the table.
13
U.S. Government Accountability Office (2006) as referenced by National Research Council of the National
Academy of Science, Allocating Federal Funds for State Programs for English Language Learners (2011), 14. 14
Ibid., 19. 15
U.S. Department of Education. National Evaluation of Title III Implementation—Report on State and Local
Implementation. Washington, DC: American Institutes for Research. 2012, xiv.
Draft
19
Table 1. Criteria used in districts’ definition of ELLs
District
Does not meet
proficient level of
achievement on
assessment
Native language
is not English
Home Language
is not English
Difficulty with English
precludes them from achieving in English-only
classroom
Native American/ Alaskan or native of outlying
areas
Not born
in U.S.
Limited English
proficiency precludes them from
participating fully in society
Norfolk
Omaha
East Baton
Rouge
District of
Columbia
Albuquerque
Denver
Fort Worth
Cincinnati
Cleveland
Oakland
Buffalo
Caddo Parish
San Diego
Seattle
Duval
Indianapolis
Jefferson
St. Paul
Fresno
Austin
Houston
Little Rock
Miami-Dade
San
Francisco
Wichita
New York
City
Broward
County
Toledo
Dayton
Clark County
Richmond
Los Angeles
Providence
Atlanta
Dallas
Anchorage
Boston
Hillsborough
20
District
Does not meet
proficient level of
achievement on
assessment
Native language
is not English
Home Language
is not English
Difficulty with English
precludes them from achieving in English-only
classroom
Native American/ Alaskan or native of outlying
areas
Not born
in U.S.
Limited English
proficiency precludes them from
participating fully in society
Milwaukee
Charlotte-
Mecklenburg
St. Louis
Memphis
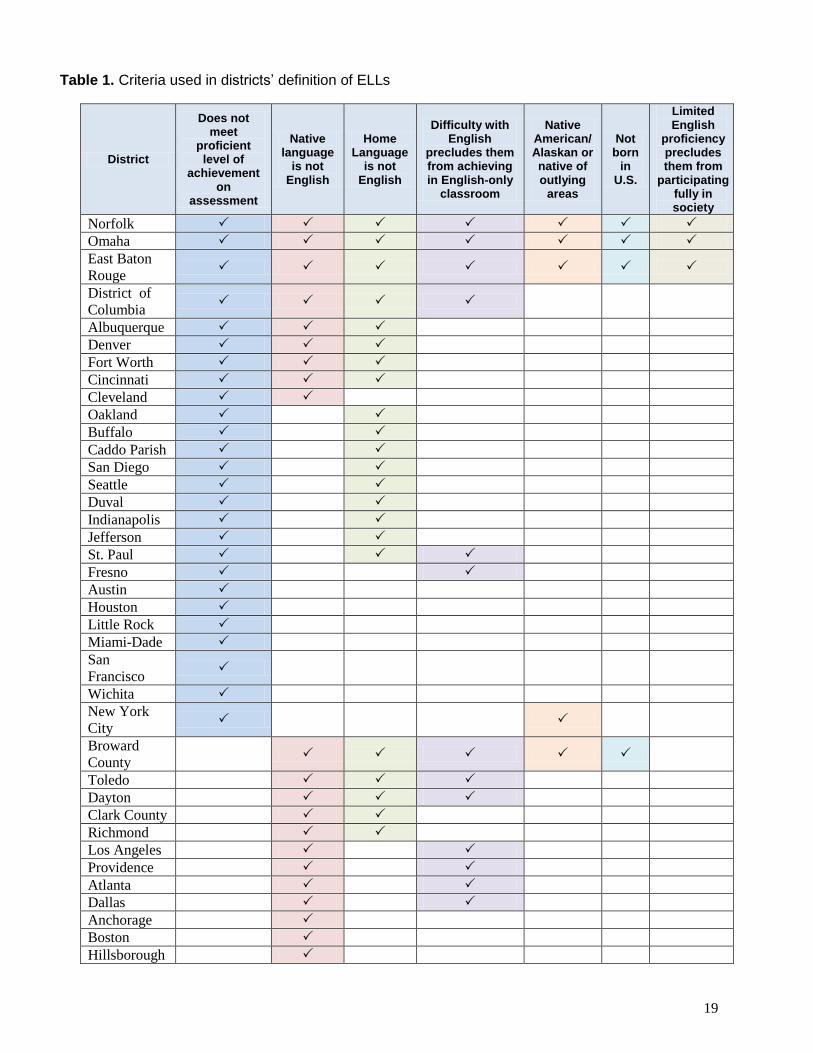
Total 26 22 24 15 5 4 3
Identifying English Language Learners (N = 46 Districts)
The Council survey also asked districts for information on the process they used for identifying
students as ELLs. Districts were asked about whether these processes were defined solely by
their states or whether the districts made modifications to their state’s recommended or required
assessments. All 46 districts responding to this question indicated they used a home language
survey (HLS), which was typically determined by the state, to verify whether a student lived in a
home in which a language other than English was spoken.
The responses were classified using an HLS taxonomy developed by researchers at University of
California, Los Angeles (UCLA) to identify common state-level regulations governing the use of
HLSs in 2010.16
Table 2 shows the numbers of districts that followed particular practices
classified in the UCLA study.
State parameters. The largest number of districts (23 out of 46 responding districts) follow
practice B, in which SEAs mandate the use of an HLS and provide a sample HLS for districts.
Only three of the responding districts—Caddo Parish, East Baton Rouge Parish, and Wichita—
are in states that do not mandate the use of an HLS.17
(See table 2.)
Table 2. Number of responding districts following specified practices for identifying ELLs
State regulation Description of practice Number of
responding districts in category
Practice A The SEA creates a single HLS form and mandates its use in
schools across the state. 11
16
The study did not provide information on the practices used in four states, namely, the District of Columbia,
Indiana, Minnesota, and Washington. Five responding districts are in these states and therefore their practices were
not linked to the study’s classifications. 17
Alison L. Bailey and Kimberly R. Kelly. “The Use and Validity of Home Language Surveys in State English
Language Proficiency Assessment Systems: A Review and Issues Perspective,” The Evaluation of English
Language Proficiency Assessments Project. UCLA, July 2010. The white paper identifies Louisiana, Nebraska, and
South Dakota as three states that do not mandate the use of an HLS but rather only recommend its use.
Draft
21
State regulation Description of practice Number of
responding districts in category
Practice B
The SEA mandates the use of an HLS and creates an HLS
form that it offers as a sample for districts to adopt or to
substitute for their own version of an HLS. 23
Practice C
The SEA mandates the use of an HLS but has not created a
sample HLS. Instead, it allows districts to create their own
set of questions for the local context. 4
Practice D The SEA does not mandate the use of an HLS. 3
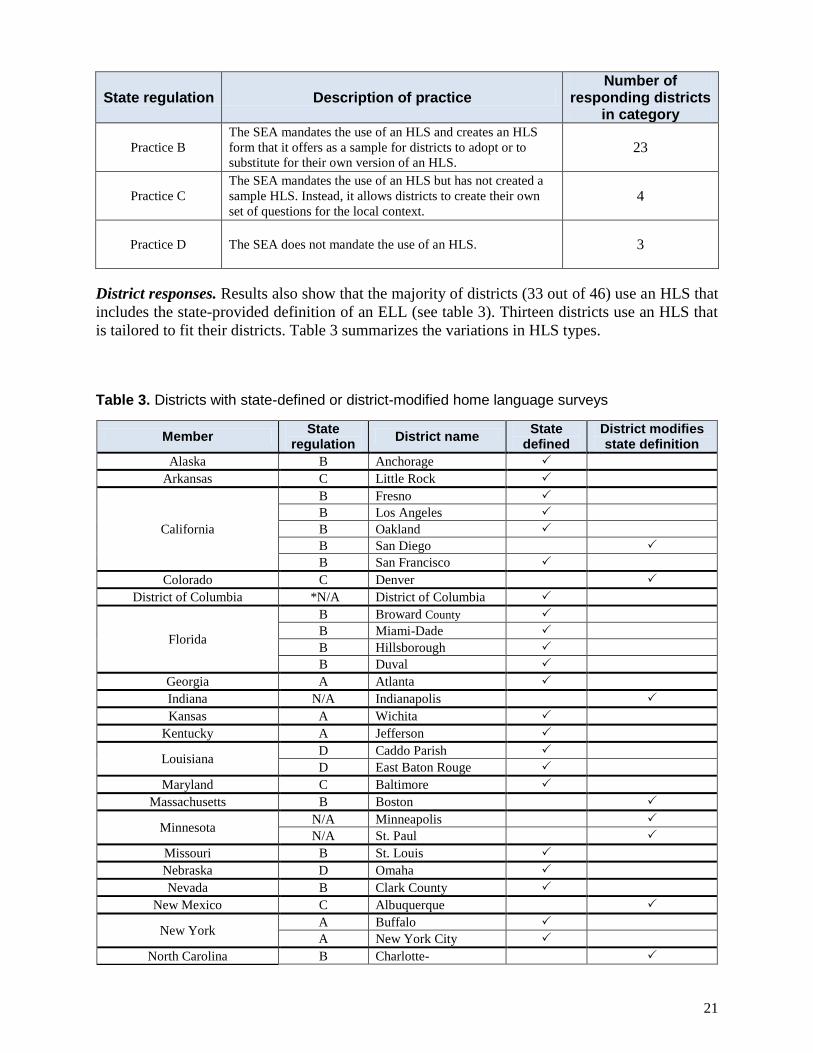
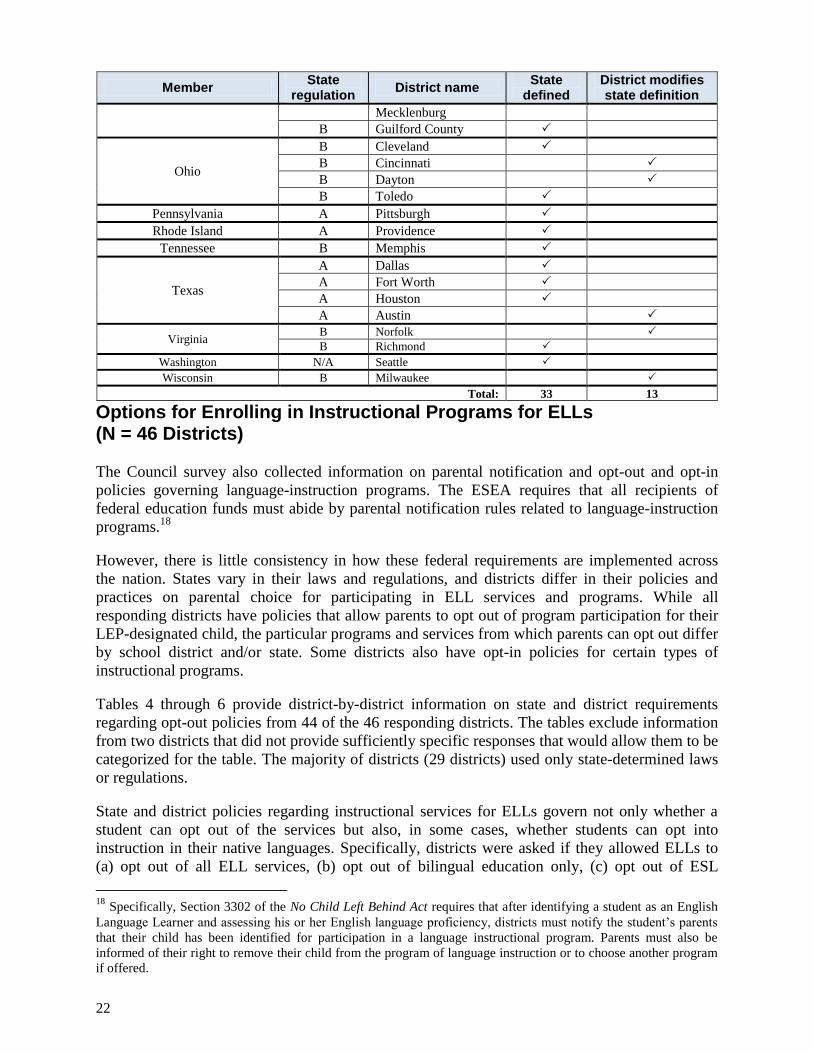
District responses. Results also show that the majority of districts (33 out of 46) use an HLS that
includes the state-provided definition of an ELL (see table 3). Thirteen districts use an HLS that
is tailored to fit their districts. Table 3 summarizes the variations in HLS types.
Table 3. Districts with state-defined or district-modified home language surveys
Member State
regulation District name
State defined
District modifies state definition
Alaska B Anchorage
Arkansas C Little Rock
California
B Fresno
B Los Angeles
B Oakland
B San Diego
B San Francisco
Colorado C Denver
District of Columbia *N/A District of Columbia
Florida
B Broward County
B Miami-Dade
B Hillsborough
B Duval
Georgia A Atlanta
Indiana N/A Indianapolis
Kansas A Wichita
Kentucky A Jefferson
Louisiana D Caddo Parish
D East Baton Rouge
Maryland C Baltimore
Massachusetts B Boston
Minnesota N/A Minneapolis
N/A St. Paul
Missouri B St. Louis
Nebraska D Omaha
Nevada B Clark County
New Mexico C Albuquerque
New York A Buffalo
A New York City
North Carolina B Charlotte-
22
Member State
regulation District name
State defined
District modifies state definition
Mecklenburg
B Guilford County
Ohio
B Cleveland
B Cincinnati
B Dayton
B Toledo
Pennsylvania A Pittsburgh
Rhode Island A Providence
Tennessee B Memphis
Texas
A Dallas
A Fort Worth
A Houston
A Austin
Virginia B Norfolk
B Richmond
Washington N/A Seattle
Wisconsin B Milwaukee
Total: 33 13
Options for Enrolling in Instructional Programs for ELLs (N = 46 Districts)
The Council survey also collected information on parental notification and opt-out and opt-in
policies governing language-instruction programs. The ESEA requires that all recipients of
federal education funds must abide by parental notification rules related to language-instruction
programs.18
However, there is little consistency in how these federal requirements are implemented across
the nation. States vary in their laws and regulations, and districts differ in their policies and
practices on parental choice for participating in ELL services and programs. While all
responding districts have policies that allow parents to opt out of program participation for their
LEP-designated child, the particular programs and services from which parents can opt out differ
by school district and/or state. Some districts also have opt-in policies for certain types of
instructional programs.
Tables 4 through 6 provide district-by-district information on state and district requirements
regarding opt-out policies from 44 of the 46 responding districts. The tables exclude information
from two districts that did not provide sufficiently specific responses that would allow them to be
categorized for the table. The majority of districts (29 districts) used only state-determined laws
or regulations.
State and district policies regarding instructional services for ELLs govern not only whether a
student can opt out of the services but also, in some cases, whether students can opt into
instruction in their native languages. Specifically, districts were asked if they allowed ELLs to
(a) opt out of all ELL services, (b) opt out of bilingual education only, (c) opt out of ESL
18
Specifically, Section 3302 of the No Child Left Behind Act requires that after identifying a student as an English
Language Learner and assessing his or her English language proficiency, districts must notify the student’s parents
that their child has been identified for participation in a language instructional program. Parents must also be
informed of their right to remove their child from the program of language instruction or to choose another program
if offered.
Draft
23
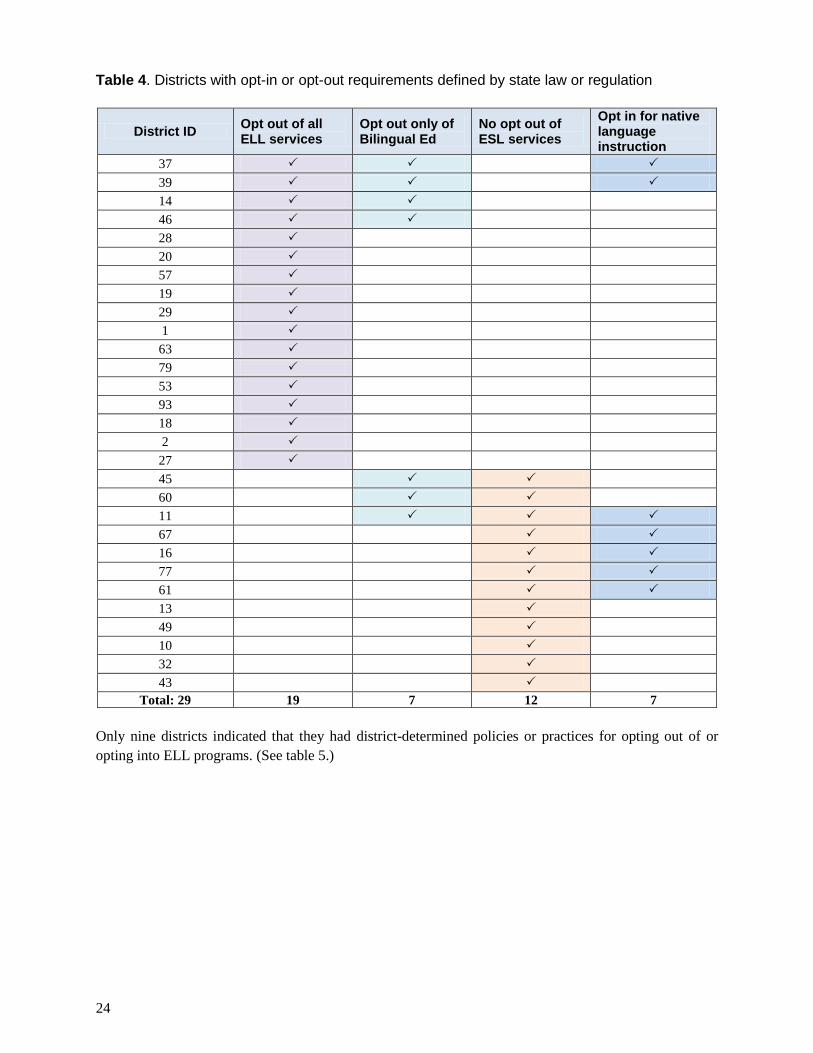
services, or (d) opt into native-language instruction. Table 4 shows the responses provided by
districts describing the opt-in and opt-out options allowable by state law or regulations regarding
ELL programs.
Nineteen districts responded that their state law or regulations allow parents to opt out of
all ELL services for their children.
Conversely, 12 districts indicated that their state laws/regulations do not allow ELLs to
opt-out of ESL services.
Fewer districts indicated that they had state laws or regulations regarding opting in or out
of bilingual education and native language instruction.
24
Table 4. Districts with opt-in or opt-out requirements defined by state law or regulation
District ID Opt out of all ELL services
Opt out only of Bilingual Ed
No opt out of ESL services
Opt in for native language instruction
37
39
14 46 28 20 57 19 29 1 63 79 53 93 18 2 27 45 60 11
67
16
77
61
13 49 10 32 43
Total: 29 19 7 12 7
Only nine districts indicated that they had district-determined policies or practices for opting out of or
opting into ELL programs. (See table 5.)
Draft
25
Table 5. Districts with opt-in or opt-out requirements defined by district policy or practice
District ID Opt out of all ELL
services Opt in for native language
instruction
7
42
9
24
33
4
55
52
66
Total: 9 8 2
A small number of respondents indicated having a combination of options based on both state
law or regulations and district policy. Table 6 summarizes their responses.
Table 6. Districts with opt-in or opt-out requirements defined by district policy and state law or regulation
District ID
Opt out of all ELL services
Opt out only of Bilingual Ed
No opt-out of ESL services
Opt in for native language
instruction
State District State District State District State District
74
71
3
26
30
44
Total: 6 4 3 0 3 1 1 1 4
26
II. ELL Enrollment Enrollment of ELLs in Urban Districts (N = 65 Districts)
This section presents enrollment data on ELLs in 63 of the 65 districts that were Council
members at the time the survey was administered.19
Most responding districts provided ELL
enrollment figures, but in cases where districts did not submit data, the Council drew ELL
enrollment figures from the National Center of Education Statistics’ Common Core Data. In
cases where data were unavailable from NCES, the Council supplemented the figures with data
from the districts’ websites.
The ELL figures include an unduplicated count of all students in public schools between 5 and
18 years of age in some states and up to age 22 years in other states who meet the state or district
definition of an ELL.
However, actual counts are affected by numerous factors, including how the definitions are
operationalized by state educational agencies and school districts. These variables can include
state definitions of Limited English Proficiency (LEP), the district’s inclusion or exclusion of
former ELLs (two years after exiting LEP status), and the criteria that states and districts use to
determine when an ELL is proficient in English and can exit LEP status.20
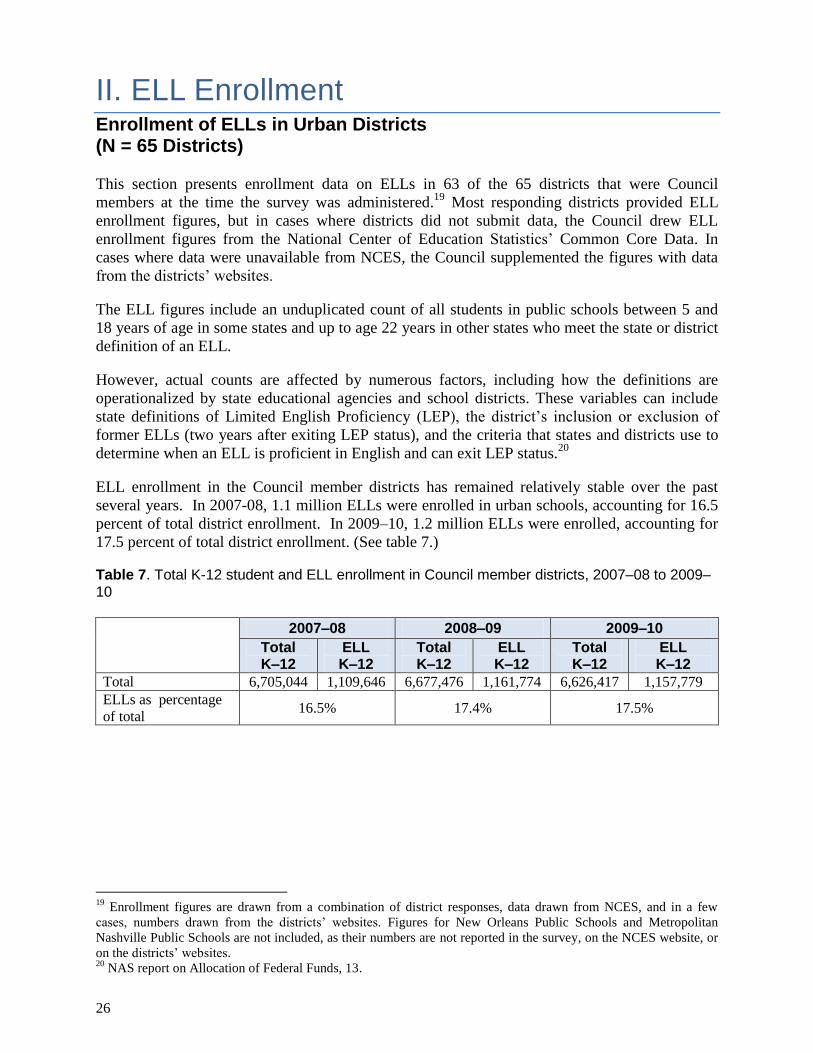
ELL enrollment in the Council member districts has remained relatively stable over the past
several years. In 2007-08, 1.1 million ELLs were enrolled in urban schools, accounting for 16.5
percent of total district enrollment. In 2009–10, 1.2 million ELLs were enrolled, accounting for
17.5 percent of total district enrollment. (See table 7.)
Table 7. Total K-12 student and ELL enrollment in Council member districts, 2007–08 to 2009–10
2007–08 2008–09 2009–10
Total K–12
ELL K–12
Total K–12
ELL K–12
Total K–12
ELL K–12
Total 6,705,044 1,109,646 6,677,476 1,161,774 6,626,417 1,157,779
ELLs as percentage
of total 16.5% 17.4% 17.5%
19
Enrollment figures are drawn from a combination of district responses, data drawn from NCES, and in a few
cases, numbers drawn from the districts’ websites. Figures for New Orleans Public Schools and Metropolitan
Nashville Public Schools are not included, as their numbers are not reported in the survey, on the NCES website, or
on the districts’ websites. 20
NAS report on Allocation of Federal Funds, 13.
Draft
27
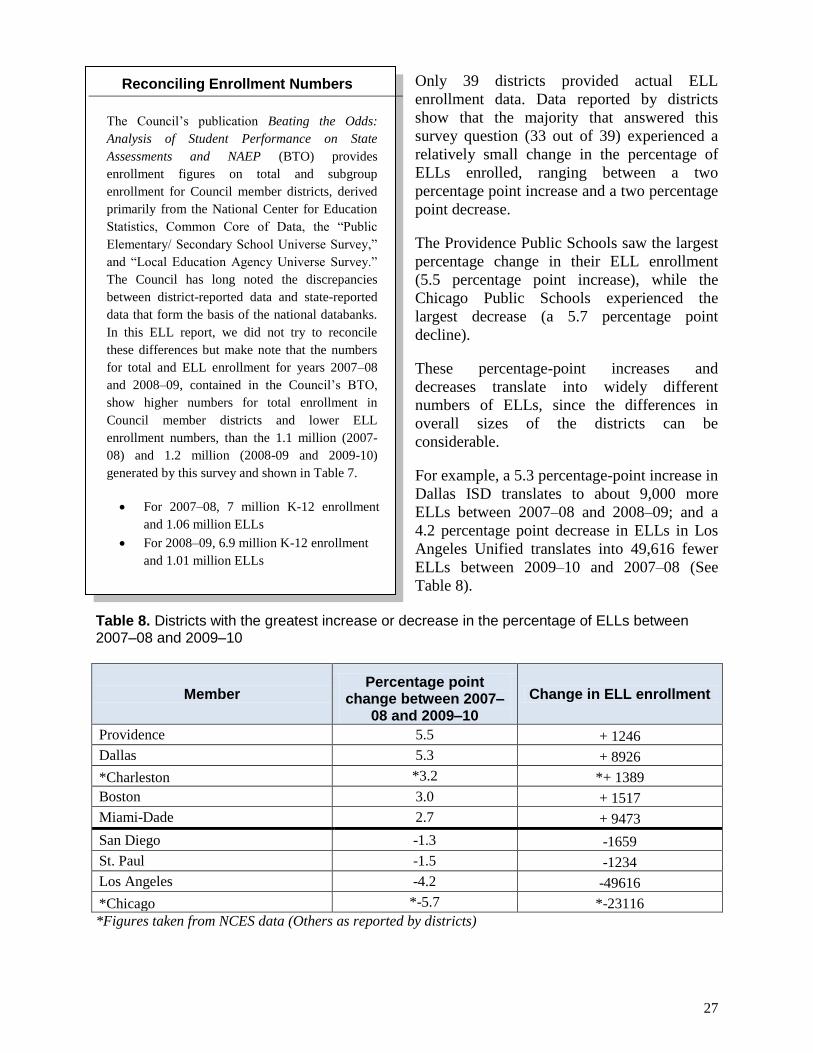
Only 39 districts provided actual ELL
enrollment data. Data reported by districts
show that the majority that answered this
survey question (33 out of 39) experienced a
relatively small change in the percentage of
ELLs enrolled, ranging between a two
percentage point increase and a two percentage
point decrease.
The Providence Public Schools saw the largest
percentage change in their ELL enrollment
(5.5 percentage point increase), while the
Chicago Public Schools experienced the
largest decrease (a 5.7 percentage point
decline).
These percentage-point increases and
decreases translate into widely different
numbers of ELLs, since the differences in
overall sizes of the districts can be
considerable.
For example, a 5.3 percentage-point increase in
Dallas ISD translates to about 9,000 more
ELLs between 2007–08 and 2008–09; and a
4.2 percentage point decrease in ELLs in Los
Angeles Unified translates into 49,616 fewer
ELLs between 2009–10 and 2007–08 (See
Table 8).
Table 8. Districts with the greatest increase or decrease in the percentage of ELLs between 2007–08 and 2009–10
Member Percentage point
change between 2007–08 and 2009–10
Change in ELL enrollment
Providence 5.5 + 1246
Dallas 5.3 + 8926
*Charleston *3.2 *+ 1389
Boston 3.0 + 1517
Miami-Dade 2.7 + 9473
San Diego -1.3 -1659
St. Paul -1.5 -1234
Los Angeles -4.2 -49616
*Chicago *-5.7 *-23116
*Figures taken from NCES data (Others as reported by districts)
Reconciling Enrollment Numbers
The Council’s publication Beating the Odds:
Analysis of Student Performance on State
Assessments and NAEP (BTO) provides
enrollment figures on total and subgroup
enrollment for Council member districts, derived
primarily from the National Center for Education
Statistics, Common Core of Data, the “Public
Elementary/ Secondary School Universe Survey,”
and “Local Education Agency Universe Survey.”
The Council has long noted the discrepancies
between district-reported data and state-reported
data that form the basis of the national databanks.
In this ELL report, we did not try to reconcile
these differences but make note that the numbers
for total and ELL enrollment for years 2007–08
and 2008–09, contained in the Council’s BTO,
show higher numbers for total enrollment in
Council member districts and lower ELL
enrollment numbers, than the 1.1 million (2007-
08) and 1.2 million (2008-09 and 2009-10)
generated by this survey and shown in Table 7.
For 2007–08, 7 million K-12 enrollment
and 1.06 million ELLs
For 2008–09, 6.9 million K-12 enrollment
and 1.01 million ELLs
28
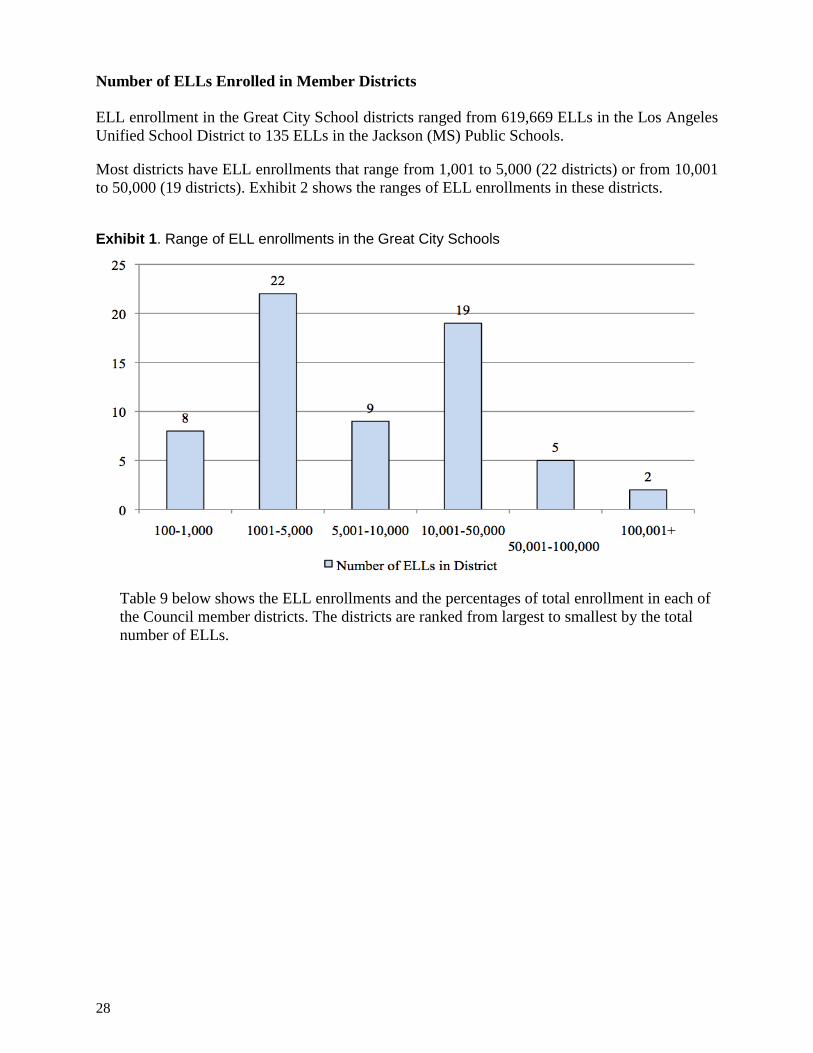
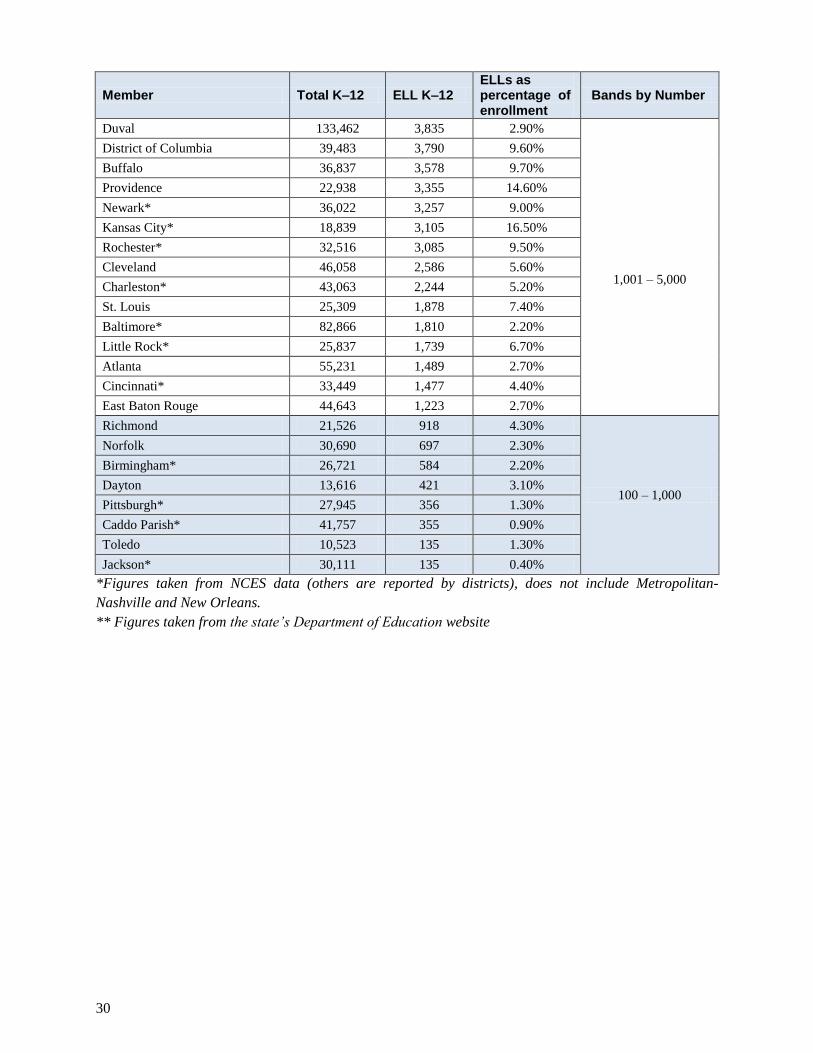
Number of ELLs Enrolled in Member Districts
ELL enrollment in the Great City School districts ranged from 619,669 ELLs in the Los Angeles
Unified School District to 135 ELLs in the Jackson (MS) Public Schools.
Most districts have ELL enrollments that range from 1,001 to 5,000 (22 districts) or from 10,001
to 50,000 (19 districts). Exhibit 2 shows the ranges of ELL enrollments in these districts.
Exhibit 1. Range of ELL enrollments in the Great City Schools
Table 9 below shows the ELL enrollments and the percentages of total enrollment in each of
the Council member districts. The districts are ranked from largest to smallest by the total
number of ELLs.

Draft
29
Table 9. Total K-12 student and ELL enrollment ranked by ELL enrollment in 2009–10
Member Total K–12 ELL K–12 ELLs as percentage of enrollment
Bands by Number
Los Angeles 619,669 190,848 30.80% 100,001 +
New York City 1,013,826 153,338 15.10%
Clark County 299,337 89,912 30.00%
50,001 – 100,000
Miami-Dade 340,004 62,298 18.30%
Dallas 156,492 58,957 37.70%
Houston 84,230 54,429 29.50%
Chicago* 407,157 51,992 12.80%
San Diego 122,737 37,160 30.30%
10,001 – 50,000
Orange County** 170,650 29,541 17.30%
Long Beach* 86,279 26,736 31.00%
Austin 77,683 24,593 31.70%
Broward County 254,500 24,078 9.50%
Fort Worth 79,888 23,059 28.90%
Denver 72,776 22,257 30.60%
Fresno 75,467 19,939 26.40%
Hillsborough 186,618 19,770 10.60%
Palm Beach* 172,897 18,117 10.50%
Sacramento* 47,817 15,924 33.30%
Charlotte-Mecklenburg 131,672 15,245 11.60%
San Francisco 57,719 14,891 25.80%
Albuquerque 92,436 14,367 15.50%
St. Paul 37,588 13,588 36.10%
Oakland 38,516 12,454 32.30%
Philadelphia* 164,945 12,172 7.40%
Boston 55,221 11,491 20.80%
Oklahoma City* 42,380 10,686 25.20%
Milwaukee* 82,096 7,996 9.70%
5,001 – 10,000
Minneapolis 33,555 7,442 22.20%
Wichita 46,249 6,758 14.60%
Detroit* 89,859 6,722 7.50%
Omaha* 48,692 6,607 13.60%
Guilford* 72,758 5,955 8.20%
Memphis City 112,334 5,574 5.00%
Anchorage 49,592 5,400 10.90%
Columbus* 52,810 5,023 9.50%
Jefferson* 98,660 4,895 5.00%
1,001 – 5,000
Seattle 46,172 4,861 10.50%
Portland* 45,748 4,776 10.40%
Des Moines* 32,749 4,541 13.90%
Indianapolis* 33,372 3,880 11.60%
30
Member Total K–12 ELL K–12 ELLs as percentage of enrollment
Bands by Number
Duval 133,462 3,835 2.90%
1,001 – 5,000
District of Columbia 39,483 3,790 9.60%
Buffalo 36,837 3,578 9.70%
Providence 22,938 3,355 14.60%
Newark* 36,022 3,257 9.00%
Kansas City* 18,839 3,105 16.50%
Rochester* 32,516 3,085 9.50%
Cleveland 46,058 2,586 5.60%
Charleston* 43,063 2,244 5.20%
St. Louis 25,309 1,878 7.40%
Baltimore* 82,866 1,810 2.20%
Little Rock* 25,837 1,739 6.70%
Atlanta 55,231 1,489 2.70%
Cincinnati* 33,449 1,477 4.40%
East Baton Rouge 44,643 1,223 2.70%
Richmond 21,526 918 4.30%
100 – 1,000
Norfolk 30,690 697 2.30%
Birmingham* 26,721 584 2.20%
Dayton 13,616 421 3.10%
Pittsburgh* 27,945 356 1.30%
Caddo Parish* 41,757 355 0.90%
Toledo 10,523 135 1.30%
Jackson* 30,111 135 0.40%
*Figures taken from NCES data (others are reported by districts), does not include Metropolitan-
Nashville and New Orleans.
** Figures taken from the state’s Department of Education website
Draft
31
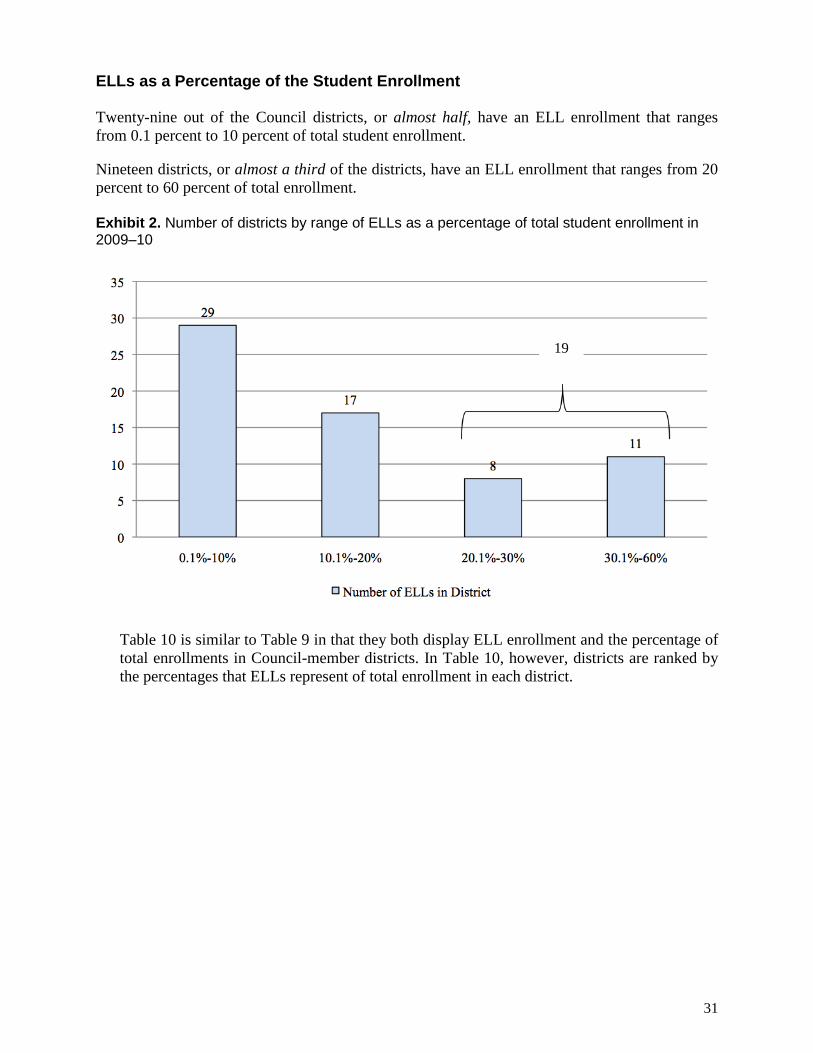
ELLs as a Percentage of the Student Enrollment
Twenty-nine out of the Council districts, or almost half, have an ELL enrollment that ranges
from 0.1 percent to 10 percent of total student enrollment.
Nineteen districts, or almost a third of the districts, have an ELL enrollment that ranges from 20
percent to 60 percent of total enrollment.
Exhibit 2. Number of districts by range of ELLs as a percentage of total student enrollment in 2009–10
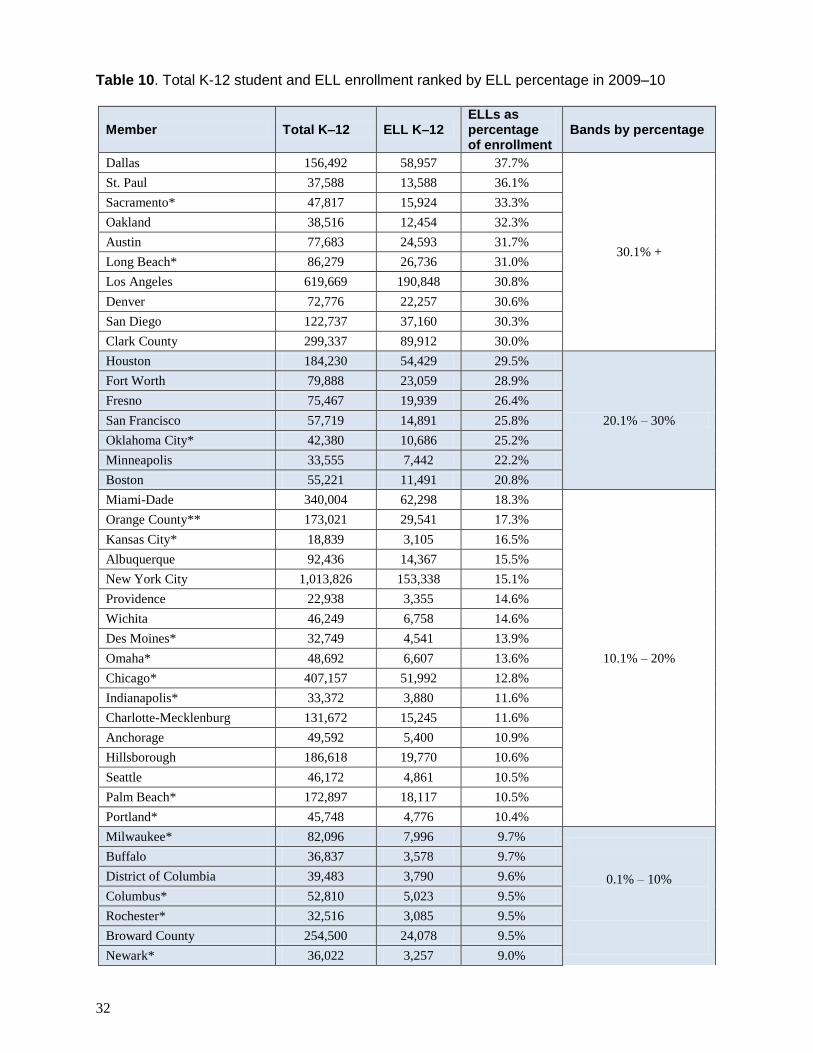
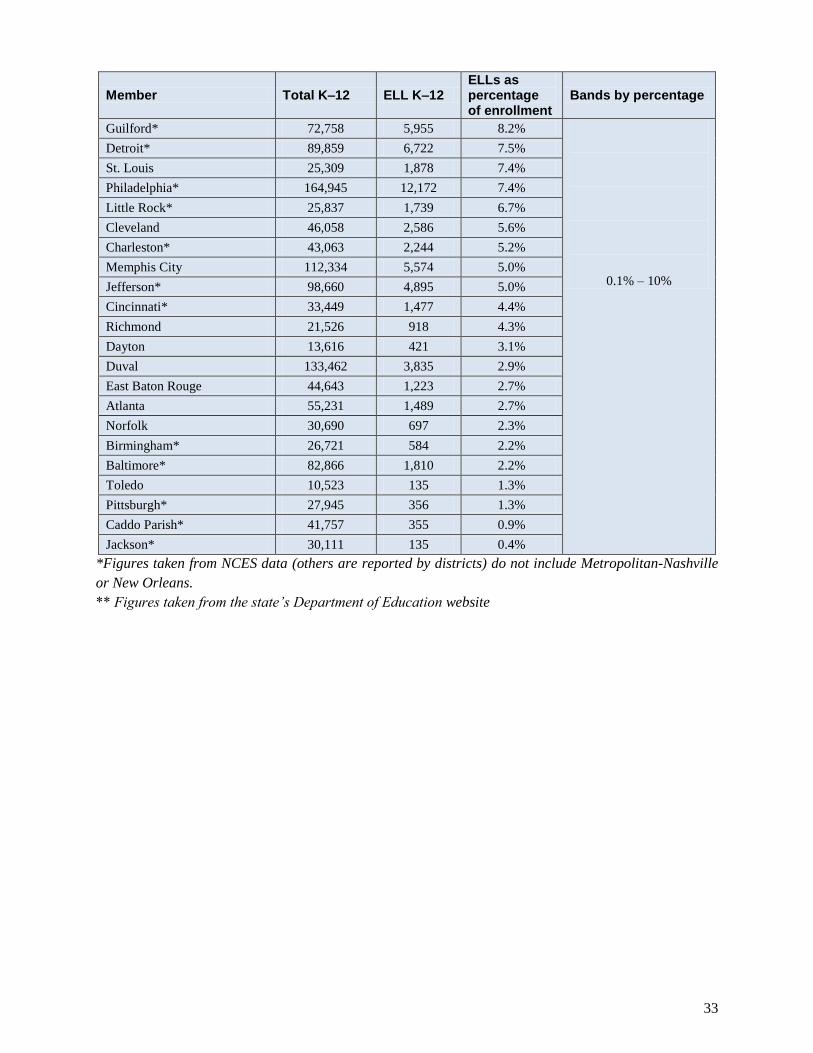
Table 10 is similar to Table 9 in that they both display ELL enrollment and the percentage of
total enrollments in Council-member districts. In Table 10, however, districts are ranked by
the percentages that ELLs represent of total enrollment in each district.
19
32
Table 10. Total K-12 student and ELL enrollment ranked by ELL percentage in 2009–10
Member Total K–12 ELL K–12 ELLs as percentage of enrollment
Bands by percentage
Dallas 156,492 58,957 37.7%
30.1% +
St. Paul 37,588 13,588 36.1%
Sacramento* 47,817 15,924 33.3%
Oakland 38,516 12,454 32.3%
Austin 77,683 24,593 31.7%
Long Beach* 86,279 26,736 31.0%
Los Angeles 619,669 190,848 30.8%
Denver 72,776 22,257 30.6%
San Diego 122,737 37,160 30.3%
Clark County 299,337 89,912 30.0%
Houston 184,230 54,429 29.5%
20.1% – 30%
Fort Worth 79,888 23,059 28.9%
Fresno 75,467 19,939 26.4%
San Francisco 57,719 14,891 25.8%
Oklahoma City* 42,380 10,686 25.2%
Minneapolis 33,555 7,442 22.2%
Boston 55,221 11,491 20.8%
Miami-Dade 340,004 62,298 18.3%
10.1% – 20%
Orange County** 173,021 29,541 17.3%
Kansas City* 18,839 3,105 16.5%
Albuquerque 92,436 14,367 15.5%
New York City 1,013,826 153,338 15.1%
Providence 22,938 3,355 14.6%
Wichita 46,249 6,758 14.6%
Des Moines* 32,749 4,541 13.9%
Omaha* 48,692 6,607 13.6%
Chicago* 407,157 51,992 12.8%
Indianapolis* 33,372 3,880 11.6%
Charlotte-Mecklenburg 131,672 15,245 11.6%
Anchorage 49,592 5,400 10.9%
Hillsborough 186,618 19,770 10.6%
Seattle 46,172 4,861 10.5%
Palm Beach* 172,897 18,117 10.5%
Portland* 45,748 4,776 10.4%
Milwaukee* 82,096 7,996 9.7%
0.1% – 10%
Buffalo 36,837 3,578 9.7%
District of Columbia 39,483 3,790 9.6%
Columbus* 52,810 5,023 9.5%
Rochester* 32,516 3,085 9.5%
Broward County 254,500 24,078 9.5%
Newark* 36,022 3,257 9.0%
Draft
33
Member Total K–12 ELL K–12 ELLs as percentage of enrollment
Bands by percentage
Guilford* 72,758 5,955 8.2%
0.1% – 10%
Detroit* 89,859 6,722 7.5%
St. Louis 25,309 1,878 7.4%
Philadelphia* 164,945 12,172 7.4%
Little Rock* 25,837 1,739 6.7%
Cleveland 46,058 2,586 5.6%
Charleston* 43,063 2,244 5.2%
Memphis City 112,334 5,574 5.0%
Jefferson* 98,660 4,895 5.0%
Cincinnati* 33,449 1,477 4.4%
Richmond 21,526 918 4.3%
Dayton 13,616 421 3.1%
Duval 133,462 3,835 2.9%
East Baton Rouge 44,643 1,223 2.7%
Atlanta 55,231 1,489 2.7%
Norfolk 30,690 697 2.3%
Birmingham* 26,721 584 2.2%
Baltimore* 82,866 1,810 2.2%
Toledo 10,523 135 1.3%
Pittsburgh* 27,945 356 1.3%
Caddo Parish* 41,757 355 0.9%
Jackson* 30,111 135 0.4%
*Figures taken from NCES data (others are reported by districts) do not include Metropolitan-Nashville
or New Orleans.
** Figures taken from the state’s Department of Education website
34
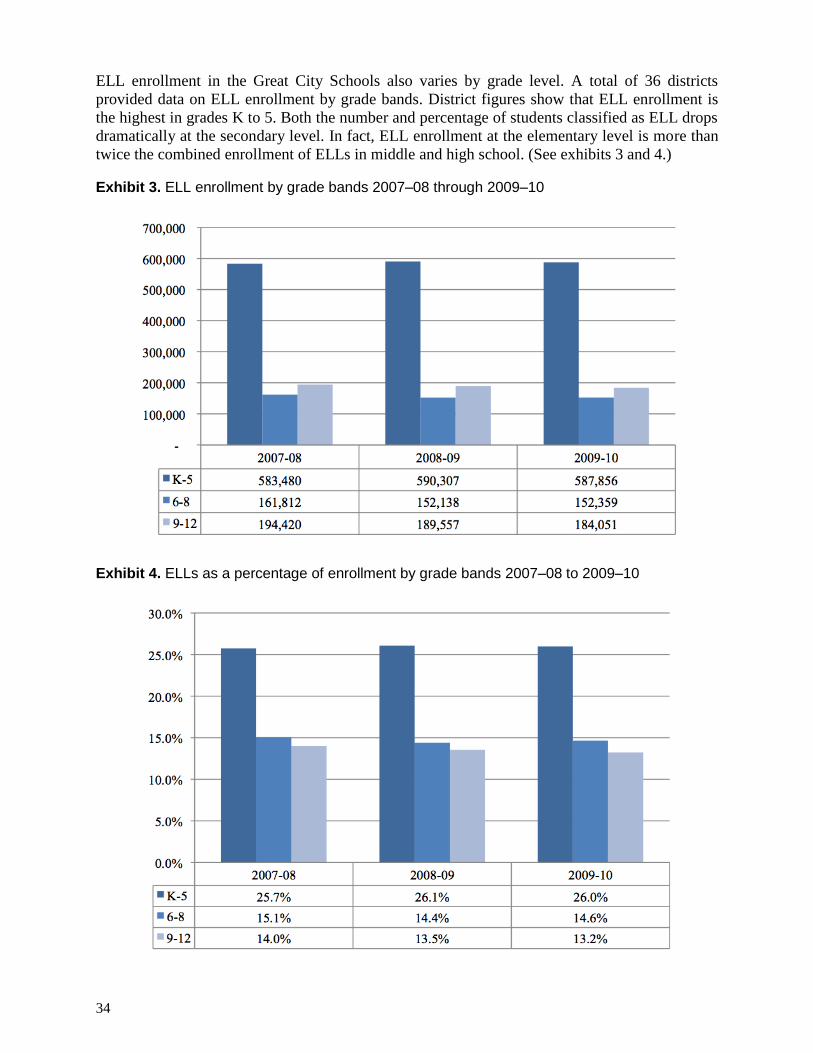
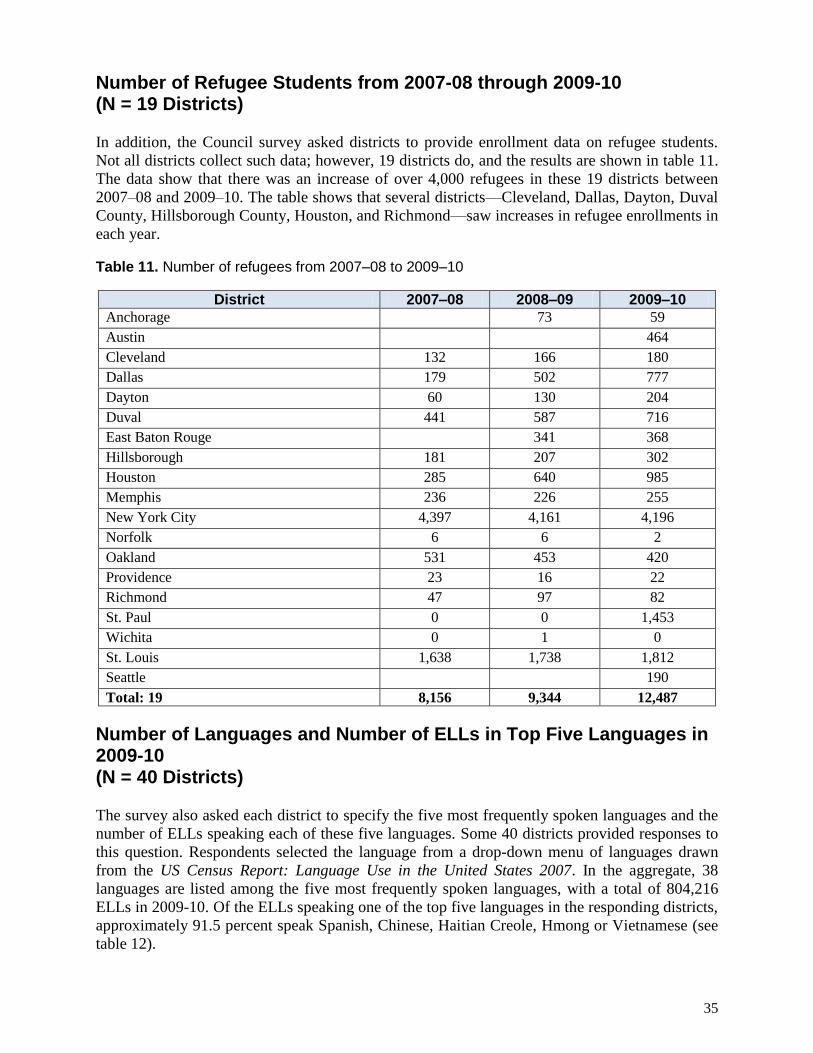
ELL enrollment in the Great City Schools also varies by grade level. A total of 36 districts
provided data on ELL enrollment by grade bands. District figures show that ELL enrollment is
the highest in grades K to 5. Both the number and percentage of students classified as ELL drops
dramatically at the secondary level. In fact, ELL enrollment at the elementary level is more than
twice the combined enrollment of ELLs in middle and high school. (See exhibits 3 and 4.)
Exhibit 3. ELL enrollment by grade bands 2007–08 through 2009–10
Exhibit 4. ELLs as a percentage of enrollment by grade bands 2007–08 to 2009–10
Draft
35
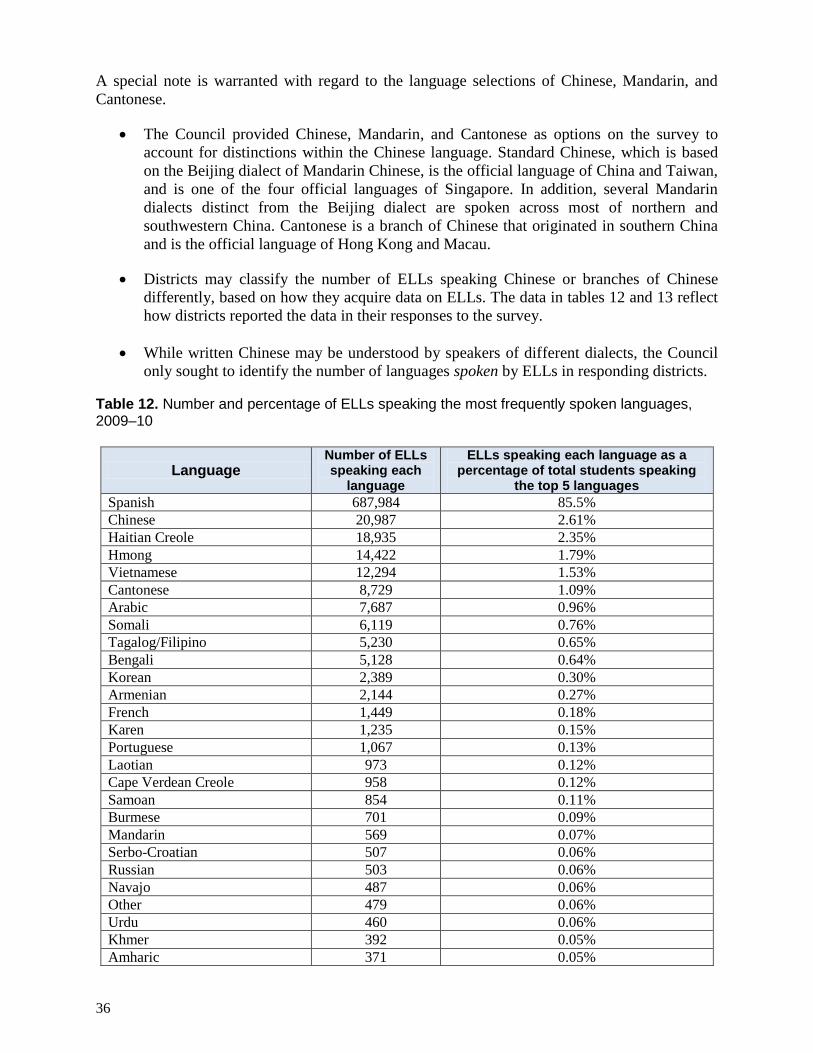
Number of Refugee Students from 2007-08 through 2009-10 (N = 19 Districts)
In addition, the Council survey asked districts to provide enrollment data on refugee students.
Not all districts collect such data; however, 19 districts do, and the results are shown in table 11.
The data show that there was an increase of over 4,000 refugees in these 19 districts between
2007–08 and 2009–10. The table shows that several districts—Cleveland, Dallas, Dayton, Duval
County, Hillsborough County, Houston, and Richmond—saw increases in refugee enrollments in
each year.
Table 11. Number of refugees from 2007–08 to 2009–10
District 2007–08 2008–09 2009–10
Anchorage 73 59
Austin 464
Cleveland 132 166 180
Dallas 179 502 777
Dayton 60 130 204
Duval 441 587 716
East Baton Rouge 341 368
Hillsborough 181 207 302
Houston 285 640 985
Memphis 236 226 255
New York City 4,397 4,161 4,196
Norfolk 6 6 2
Oakland 531 453 420
Providence 23 16 22
Richmond 47 97 82
St. Paul 0 0 1,453
Wichita 0 1 0
St. Louis 1,638 1,738 1,812
Seattle 190
Total: 19 8,156 9,344 12,487
Number of Languages and Number of ELLs in Top Five Languages in 2009-10 (N = 40 Districts)
The survey also asked each district to specify the five most frequently spoken languages and the
number of ELLs speaking each of these five languages. Some 40 districts provided responses to
this question. Respondents selected the language from a drop-down menu of languages drawn
from the US Census Report: Language Use in the United States 2007. In the aggregate, 38
languages are listed among the five most frequently spoken languages, with a total of 804,216
ELLs in 2009-10. Of the ELLs speaking one of the top five languages in the responding districts,
approximately 91.5 percent speak Spanish, Chinese, Haitian Creole, Hmong or Vietnamese (see
table 12).
36
A special note is warranted with regard to the language selections of Chinese, Mandarin, and
Cantonese.
The Council provided Chinese, Mandarin, and Cantonese as options on the survey to
account for distinctions within the Chinese language. Standard Chinese, which is based
on the Beijing dialect of Mandarin Chinese, is the official language of China and Taiwan,
and is one of the four official languages of Singapore. In addition, several Mandarin
dialects distinct from the Beijing dialect are spoken across most of northern and
southwestern China. Cantonese is a branch of Chinese that originated in southern China
and is the official language of Hong Kong and Macau.
Districts may classify the number of ELLs speaking Chinese or branches of Chinese
differently, based on how they acquire data on ELLs. The data in tables 12 and 13 reflect
how districts reported the data in their responses to the survey.
While written Chinese may be understood by speakers of different dialects, the Council
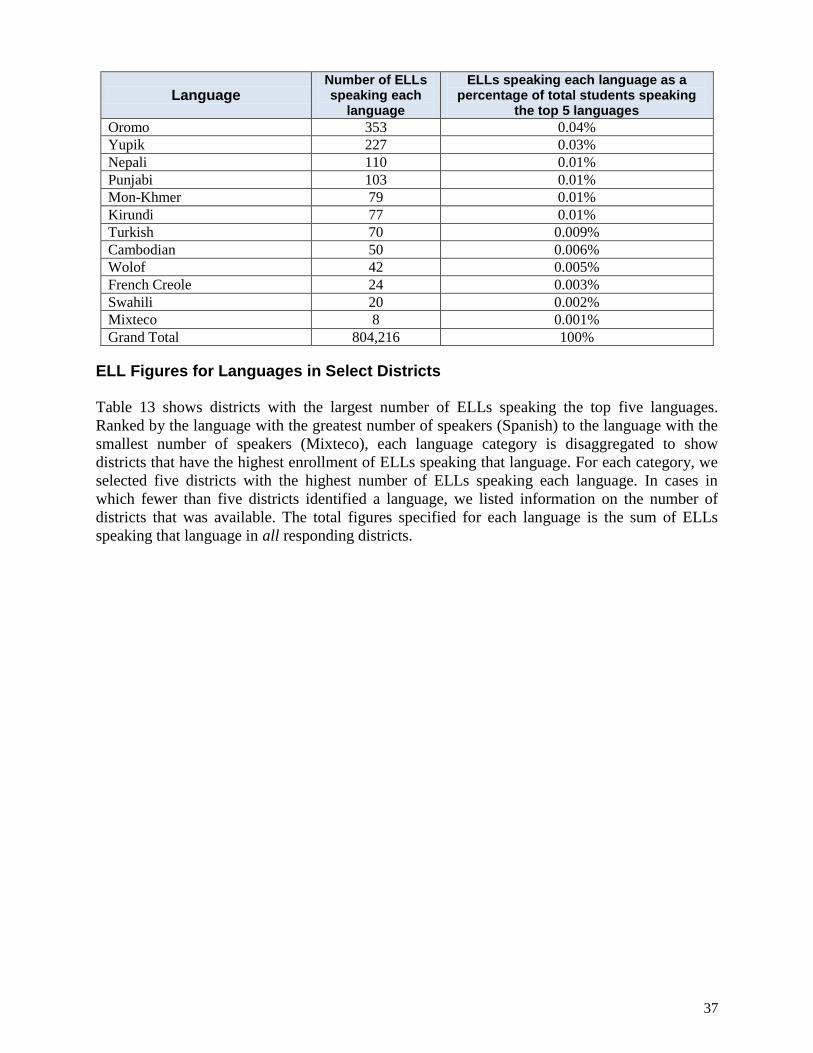
only sought to identify the number of languages spoken by ELLs in responding districts. Table 12. Number and percentage of ELLs speaking the most frequently spoken languages, 2009–10
Language Number of ELLs speaking each
language
ELLs speaking each language as a percentage of total students speaking
the top 5 languages
Spanish 687,984 85.5%
Chinese 20,987 2.61%
Haitian Creole 18,935 2.35%
Hmong 14,422 1.79%
Vietnamese 12,294 1.53%
Cantonese 8,729 1.09%
Arabic 7,687 0.96%
Somali 6,119 0.76%
Tagalog/Filipino 5,230 0.65%
Bengali 5,128 0.64%
Korean 2,389 0.30%
Armenian 2,144 0.27%
French 1,449 0.18%
Karen 1,235 0.15%
Portuguese 1,067 0.13%
Laotian 973 0.12%
Cape Verdean Creole 958 0.12%
Samoan 854 0.11%
Burmese 701 0.09%
Mandarin 569 0.07%
Serbo-Croatian 507 0.06%
Russian 503 0.06%
Navajo 487 0.06%
Other 479 0.06%
Urdu 460 0.06%
Khmer 392 0.05%
Amharic 371 0.05%
Draft
37
Language Number of ELLs speaking each
language
ELLs speaking each language as a percentage of total students speaking
the top 5 languages
Oromo 353 0.04%
Yupik 227 0.03%
Nepali 110 0.01%
Punjabi 103 0.01%
Mon-Khmer 79 0.01%
Kirundi 77 0.01%
Turkish 70 0.009%
Cambodian 50 0.006%
Wolof 42 0.005%
French Creole 24 0.003%
Swahili 20 0.002%
Mixteco 8 0.001%
Grand Total 804,216 100%
ELL Figures for Languages in Select Districts
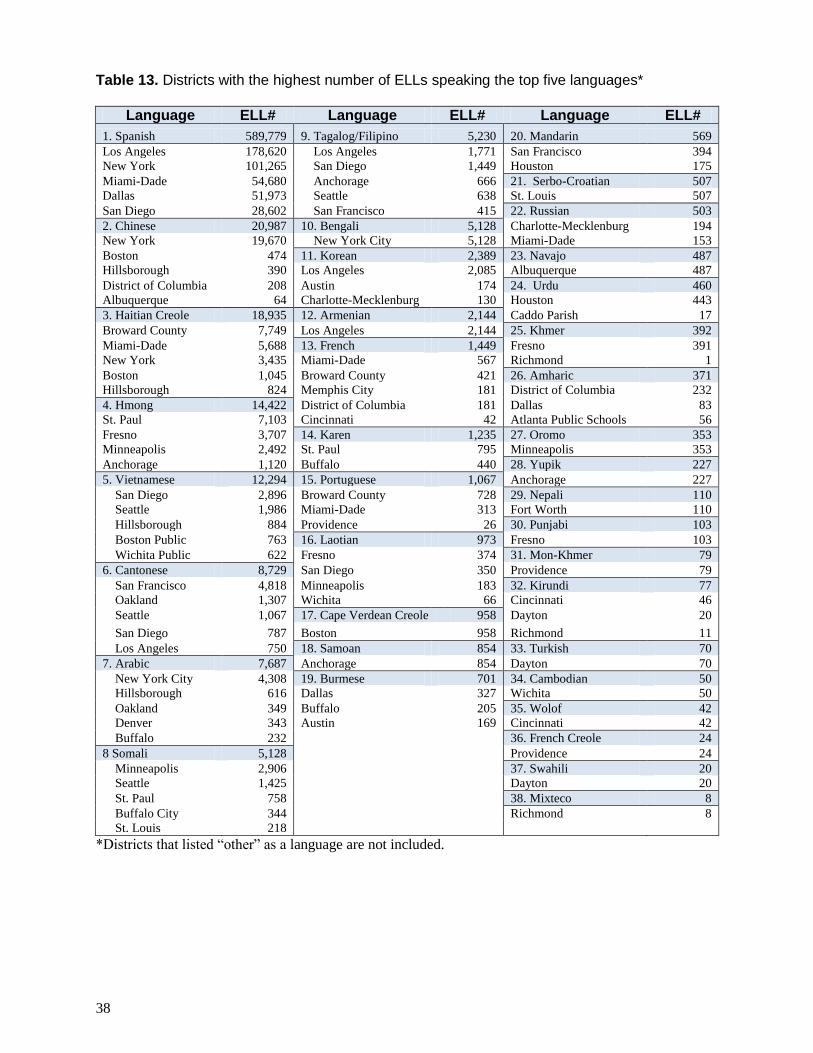
Table 13 shows districts with the largest number of ELLs speaking the top five languages.
Ranked by the language with the greatest number of speakers (Spanish) to the language with the
smallest number of speakers (Mixteco), each language category is disaggregated to show
districts that have the highest enrollment of ELLs speaking that language. For each category, we
selected five districts with the highest number of ELLs speaking each language. In cases in
which fewer than five districts identified a language, we listed information on the number of
districts that was available. The total figures specified for each language is the sum of ELLs
speaking that language in all responding districts.
38
Table 13. Districts with the highest number of ELLs speaking the top five languages*
Language ELL# Language ELL# Language ELL#
1. Spanish 589,779 9. Tagalog/Filipino 5,230 20. Mandarin 569
Los Angeles 178,620 Los Angeles 1,771 San Francisco 394
New York 101,265 San Diego 1,449 Houston 175
Miami-Dade 54,680 Anchorage 666 21. Serbo-Croatian 507
Dallas 51,973 Seattle 638 St. Louis 507
San Diego 28,602 San Francisco 415 22. Russian 503
2. Chinese 20,987 10. Bengali 5,128 Charlotte-Mecklenburg 194
New York 19,670 New York City 5,128 Miami-Dade 153
Boston 474 11. Korean 2,389 23. Navajo 487
Hillsborough 390 Los Angeles 2,085 Albuquerque 487
District of Columbia 208 Austin 174 24. Urdu 460
Albuquerque 64 Charlotte-Mecklenburg 130 Houston 443
3. Haitian Creole 18,935 12. Armenian 2,144 Caddo Parish 17
Broward County 7,749 Los Angeles 2,144 25. Khmer 392
Miami-Dade 5,688 13. French 1,449 Fresno 391
New York 3,435 Miami-Dade 567 Richmond 1
Boston 1,045 Broward County 421 26. Amharic 371
Hillsborough 824 Memphis City 181 District of Columbia 232
4. Hmong 14,422 District of Columbia 181 Dallas 83
St. Paul 7,103 Cincinnati 42 Atlanta Public Schools 56
Fresno 3,707 14. Karen 1,235 27. Oromo 353
Minneapolis 2,492 St. Paul 795 Minneapolis 353
Anchorage 1,120 Buffalo 440 28. Yupik 227
5. Vietnamese 12,294 15. Portuguese 1,067 Anchorage 227
San Diego 2,896 Broward County 728 29. Nepali 110
Seattle 1,986 Miami-Dade 313 Fort Worth 110
Hillsborough 884 Providence 26 30. Punjabi 103
Boston Public 763 16. Laotian 973 Fresno 103
Wichita Public 622 Fresno 374 31. Mon-Khmer 79
6. Cantonese 8,729 San Diego 350 Providence 79
San Francisco 4,818 Minneapolis 183 32. Kirundi 77
Oakland 1,307 Wichita 66 Cincinnati 46
Seattle 1,067 17. Cape Verdean Creole 958 Dayton 20
San Diego 787 Boston 958 Richmond 11
Los Angeles 750 18. Samoan 854 33. Turkish 70
7. Arabic 7,687 Anchorage 854 Dayton 70
New York City 4,308 19. Burmese 701 34. Cambodian 50
Hillsborough 616 Dallas 327 Wichita 50
Oakland 349 Buffalo 205 35. Wolof 42
Denver 343 Austin 169 Cincinnati 42
Buffalo 232 36. French Creole 24
8 Somali 5,128 Providence 24
Minneapolis 2,906 37. Swahili 20
Seattle 1,425 Dayton 20
St. Paul 758 38. Mixteco 8
Buffalo City 344 Richmond 8
St. Louis 218
*Districts that listed “other” as a language are not included.
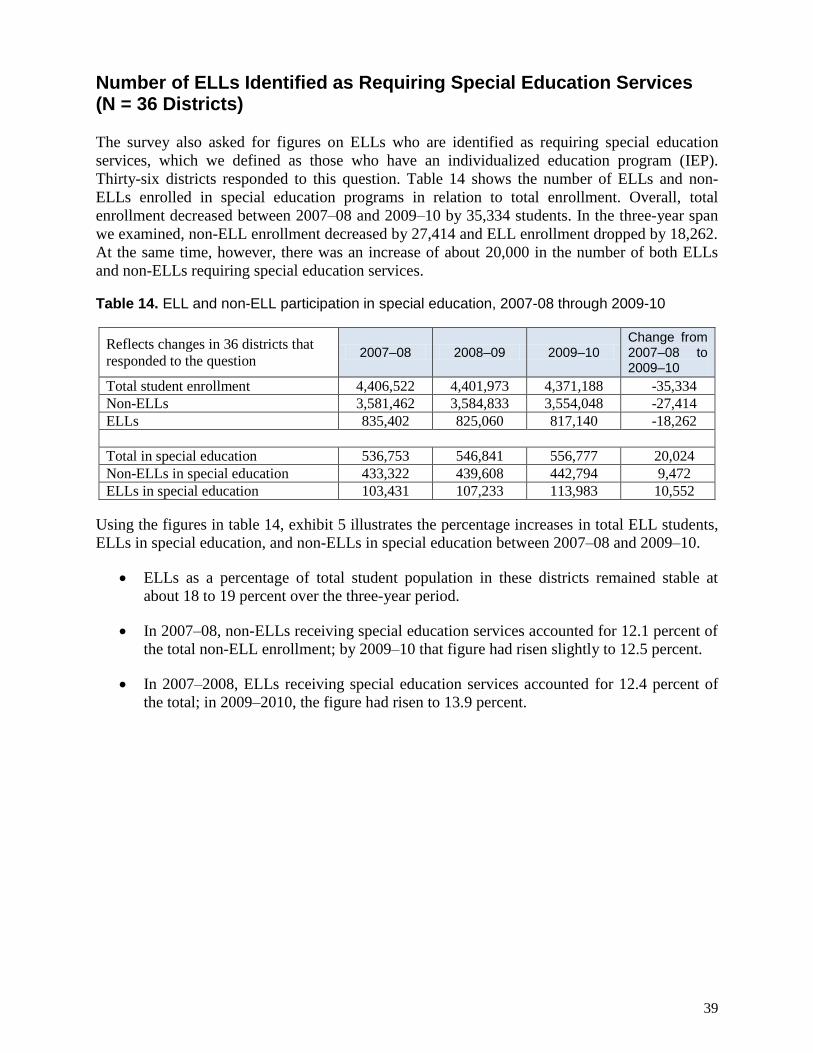
Draft
39
Number of ELLs Identified as Requiring Special Education Services (N = 36 Districts)
The survey also asked for figures on ELLs who are identified as requiring special education
services, which we defined as those who have an individualized education program (IEP).
Thirty-six districts responded to this question. Table 14 shows the number of ELLs and non-
ELLs enrolled in special education programs in relation to total enrollment. Overall, total
enrollment decreased between 2007–08 and 2009–10 by 35,334 students. In the three-year span
we examined, non-ELL enrollment decreased by 27,414 and ELL enrollment dropped by 18,262.
At the same time, however, there was an increase of about 20,000 in the number of both ELLs
and non-ELLs requiring special education services.
Table 14. ELL and non-ELL participation in special education, 2007-08 through 2009-10
Reflects changes in 36 districts that
responded to the question 2007–08 2008–09 2009–10
Change from 2007–08 to 2009–10
Total student enrollment 4,406,522 4,401,973 4,371,188 -35,334
Non-ELLs 3,581,462 3,584,833 3,554,048 -27,414
ELLs 835,402 825,060 817,140 -18,262
Total in special education 536,753 546,841 556,777 20,024
Non-ELLs in special education 433,322 439,608 442,794 9,472
ELLs in special education 103,431 107,233 113,983 10,552
Using the figures in table 14, exhibit 5 illustrates the percentage increases in total ELL students,
ELLs in special education, and non-ELLs in special education between 2007–08 and 2009–10.
ELLs as a percentage of total student population in these districts remained stable at
about 18 to 19 percent over the three-year period.
In 2007–08, non-ELLs receiving special education services accounted for 12.1 percent of
the total non-ELL enrollment; by 2009–10 that figure had risen slightly to 12.5 percent.
In 2007–2008, ELLs receiving special education services accounted for 12.4 percent of
the total; in 2009–2010, the figure had risen to 13.9 percent.
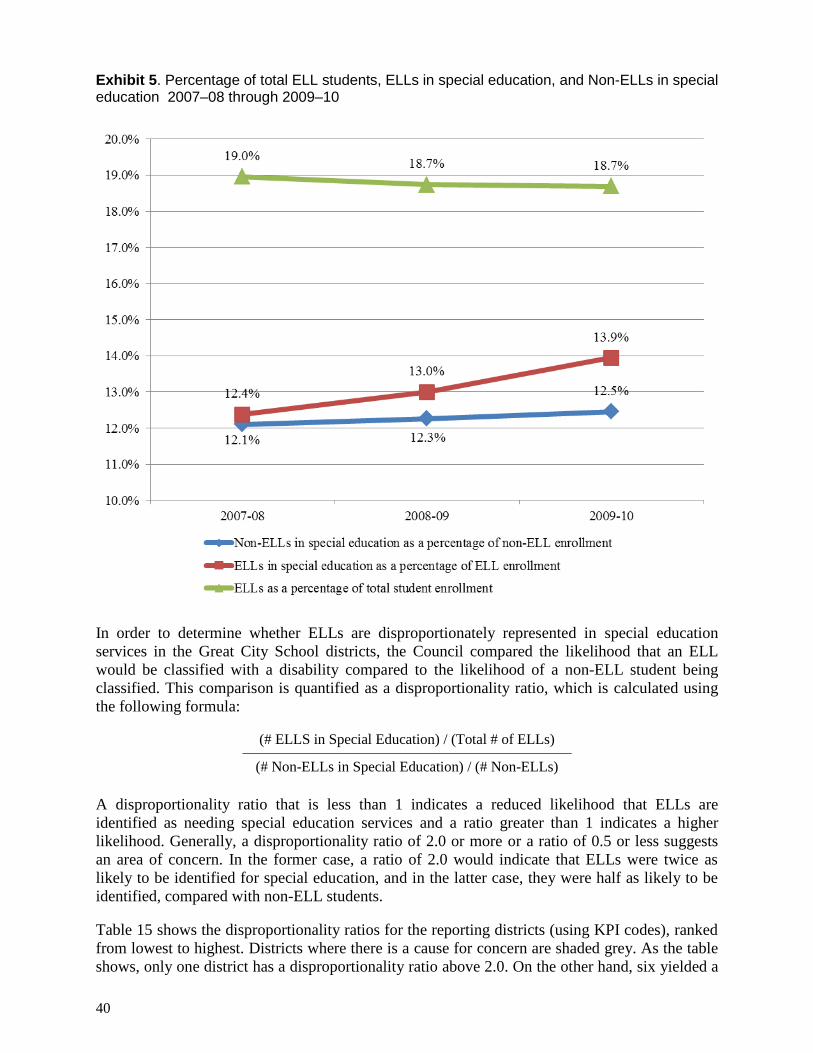
40
Exhibit 5. Percentage of total ELL students, ELLs in special education, and Non-ELLs in special education 2007–08 through 2009–10
In order to determine whether ELLs are disproportionately represented in special education
services in the Great City School districts, the Council compared the likelihood that an ELL
would be classified with a disability compared to the likelihood of a non-ELL student being
classified. This comparison is quantified as a disproportionality ratio, which is calculated using
the following formula:
(# ELLS in Special Education) / (Total # of ELLs)
(# Non-ELLs in Special Education) / (# Non-ELLs)
A disproportionality ratio that is less than 1 indicates a reduced likelihood that ELLs are
identified as needing special education services and a ratio greater than 1 indicates a higher
likelihood. Generally, a disproportionality ratio of 2.0 or more or a ratio of 0.5 or less suggests
an area of concern. In the former case, a ratio of 2.0 would indicate that ELLs were twice as
likely to be identified for special education, and in the latter case, they were half as likely to be
identified, compared with non-ELL students.
Table 15 shows the disproportionality ratios for the reporting districts (using KPI codes), ranked
from lowest to highest. Districts where there is a cause for concern are shaded grey. As the table
shows, only one district has a disproportionality ratio above 2.0. On the other hand, six yielded a
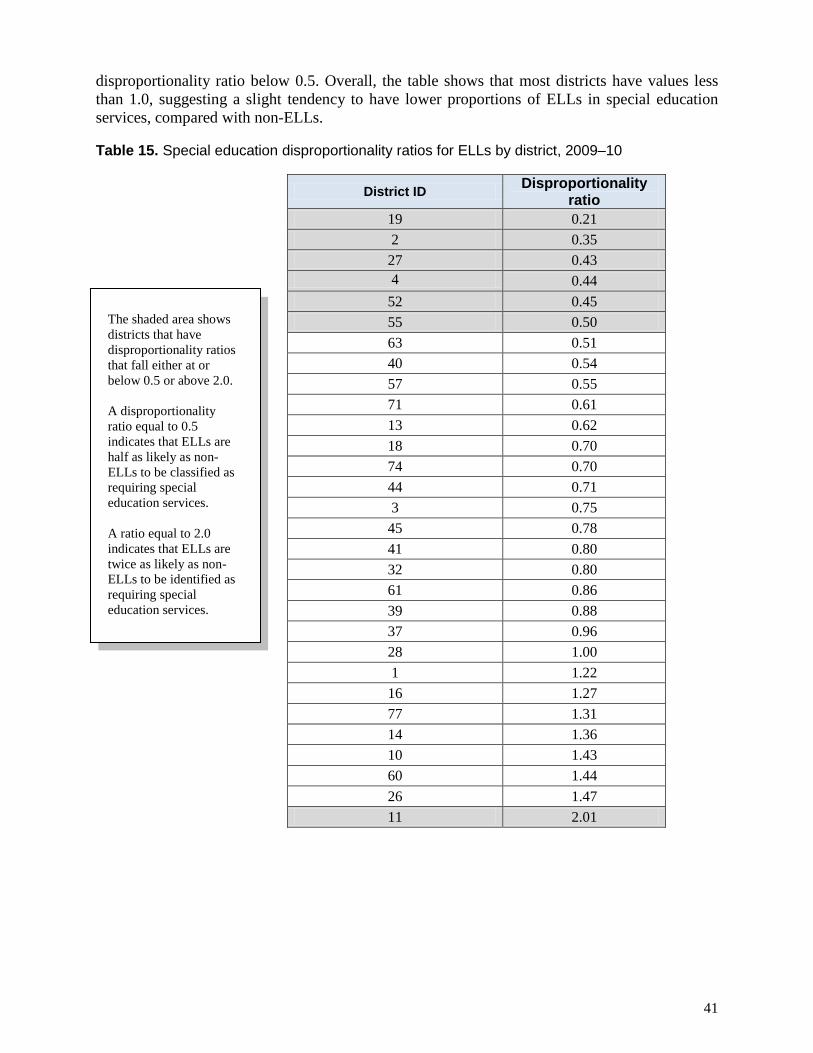
Draft
41
disproportionality ratio below 0.5. Overall, the table shows that most districts have values less
than 1.0, suggesting a slight tendency to have lower proportions of ELLs in special education
services, compared with non-ELLs.
Table 15. Special education disproportionality ratios for ELLs by district, 2009–10
District ID Disproportionality
ratio
19 0.21
2 0.35
27 0.43
4 0.44
52 0.45
55 0.50
63 0.51
40 0.54
57 0.55
71 0.61
13 0.62
18 0.70
74 0.70
44 0.71
3 0.75
45 0.78
41 0.80
32 0.80
61 0.86
39 0.88
37 0.96
28 1.00
1 1.22
16 1.27
77 1.31
14 1.36
10 1.43
60 1.44
26 1.47
11 2.01
The shaded area shows
districts that have
disproportionality ratios
that fall either at or
below 0.5 or above 2.0.
A disproportionality
ratio equal to 0.5
indicates that ELLs are
half as likely as non-
ELLs to be classified as
requiring special
education services.
A ratio equal to 2.0
indicates that ELLs are
twice as likely as non-
ELLs to be identified as
requiring special
education services.
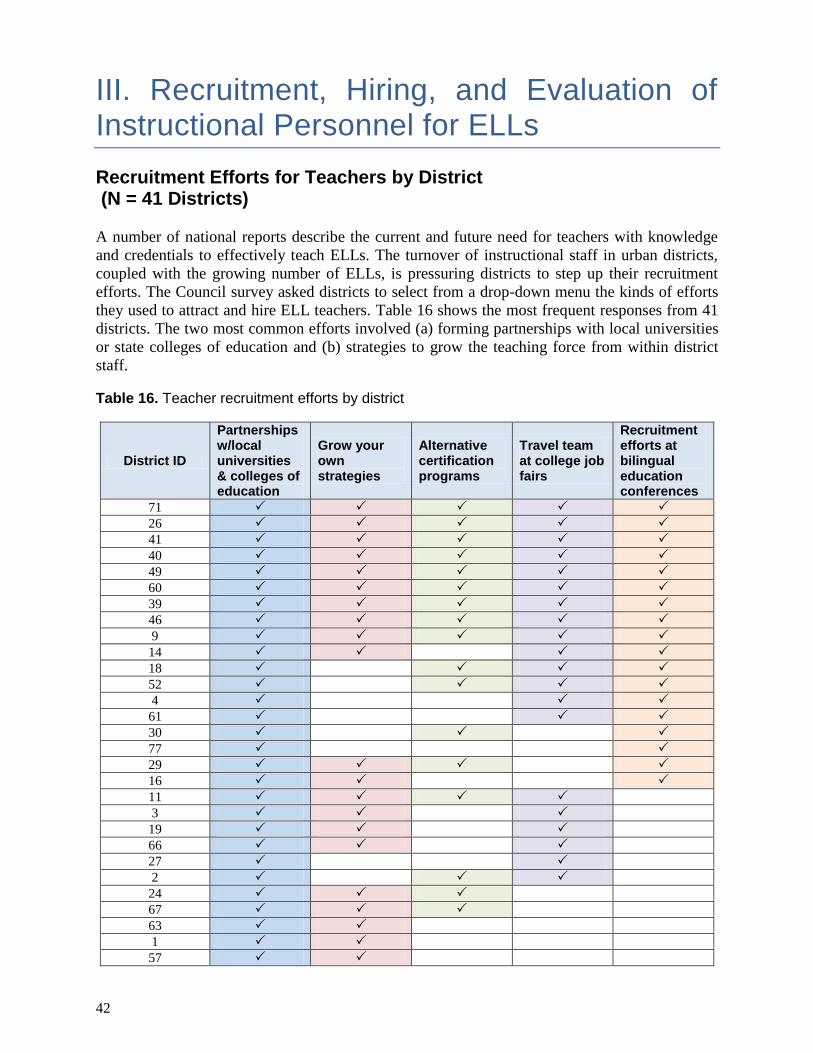
42
III. Recruitment, Hiring, and Evaluation of Instructional Personnel for ELLs
Recruitment Efforts for Teachers by District (N = 41 Districts) A number of national reports describe the current and future need for teachers with knowledge
and credentials to effectively teach ELLs. The turnover of instructional staff in urban districts,
coupled with the growing number of ELLs, is pressuring districts to step up their recruitment
efforts. The Council survey asked districts to select from a drop-down menu the kinds of efforts
they used to attract and hire ELL teachers. Table 16 shows the most frequent responses from 41
districts. The two most common efforts involved (a) forming partnerships with local universities
or state colleges of education and (b) strategies to grow the teaching force from within district
staff.
Table 16. Teacher recruitment efforts by district
District ID
Partnerships w/local universities & colleges of education
Grow your own strategies
Alternative certification programs
Travel team at college job fairs
Recruitment efforts at bilingual education conferences
71
26
41
40
49
60
39
46
9
14
18
52
4
61
30
77
29
16
11
3
19
66
27
2
24
67
63
1
57
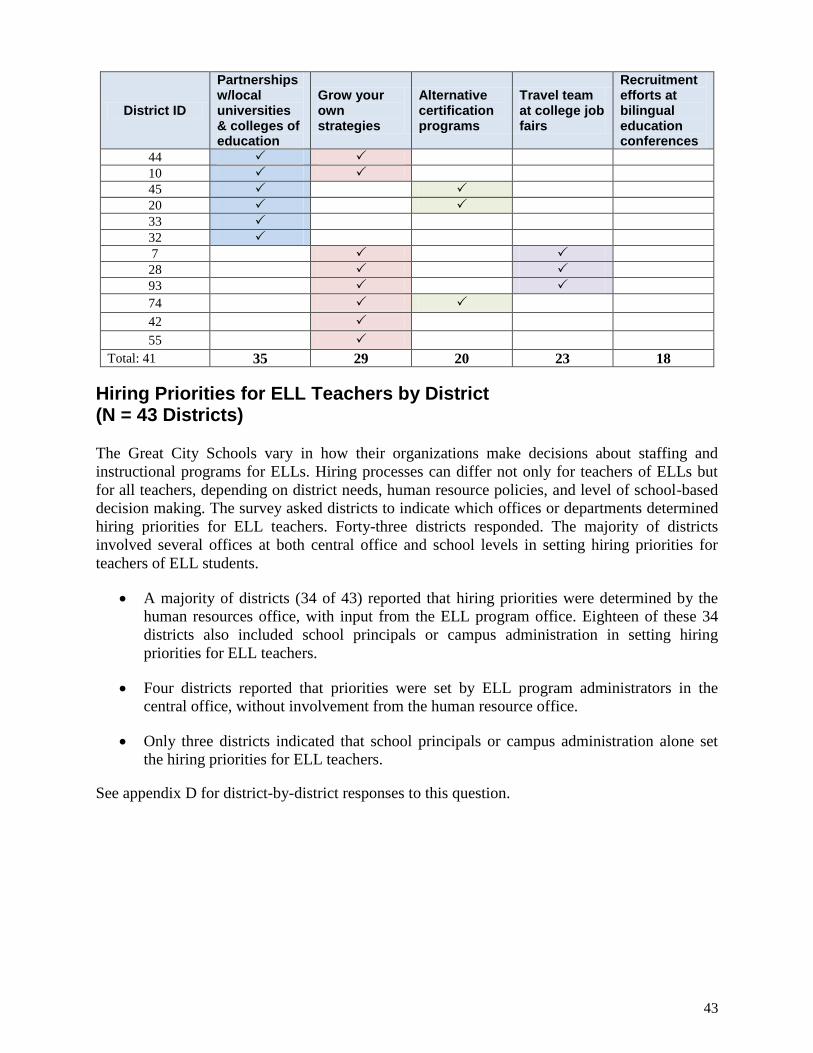
Draft
43
District ID
Partnerships w/local universities & colleges of education
Grow your own strategies
Alternative certification programs
Travel team at college job fairs
Recruitment efforts at bilingual education conferences
44
10
45
20
33
32
7
28
93
74
42
55
Total: 41 35 29 20 23 18
Hiring Priorities for ELL Teachers by District (N = 43 Districts)
The Great City Schools vary in how their organizations make decisions about staffing and
instructional programs for ELLs. Hiring processes can differ not only for teachers of ELLs but
for all teachers, depending on district needs, human resource policies, and level of school-based
decision making. The survey asked districts to indicate which offices or departments determined
hiring priorities for ELL teachers. Forty-three districts responded. The majority of districts
involved several offices at both central office and school levels in setting hiring priorities for
teachers of ELL students.
A majority of districts (34 of 43) reported that hiring priorities were determined by the
human resources office, with input from the ELL program office. Eighteen of these 34
districts also included school principals or campus administration in setting hiring
priorities for ELL teachers.
Four districts reported that priorities were set by ELL program administrators in the
central office, without involvement from the human resource office.
Only three districts indicated that school principals or campus administration alone set
the hiring priorities for ELL teachers.
See appendix D for district-by-district responses to this question.
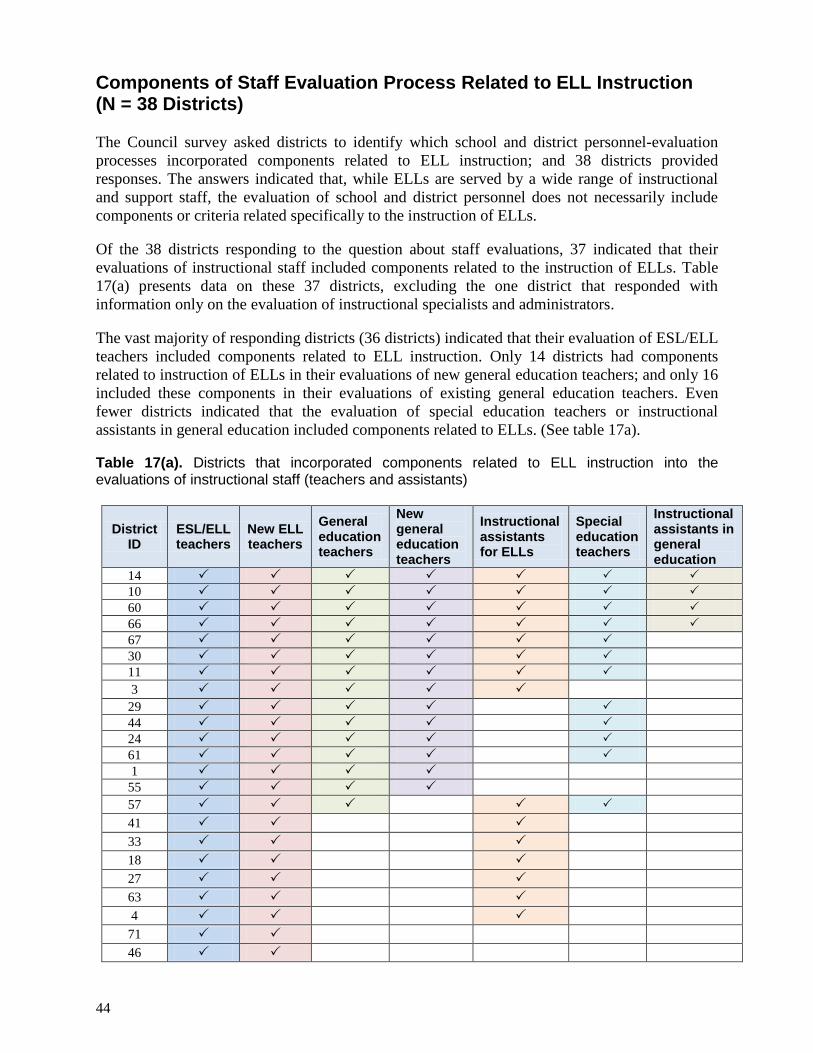
44
Components of Staff Evaluation Process Related to ELL Instruction (N = 38 Districts)
The Council survey asked districts to identify which school and district personnel-evaluation
processes incorporated components related to ELL instruction; and 38 districts provided
responses. The answers indicated that, while ELLs are served by a wide range of instructional
and support staff, the evaluation of school and district personnel does not necessarily include
components or criteria related specifically to the instruction of ELLs.
Of the 38 districts responding to the question about staff evaluations, 37 indicated that their
evaluations of instructional staff included components related to the instruction of ELLs. Table
17(a) presents data on these 37 districts, excluding the one district that responded with
information only on the evaluation of instructional specialists and administrators.
The vast majority of responding districts (36 districts) indicated that their evaluation of ESL/ELL
teachers included components related to ELL instruction. Only 14 districts had components
related to instruction of ELLs in their evaluations of new general education teachers; and only 16
included these components in their evaluations of existing general education teachers. Even
fewer districts indicated that the evaluation of special education teachers or instructional
assistants in general education included components related to ELLs. (See table 17a).
Table 17(a). Districts that incorporated components related to ELL instruction into the evaluations of instructional staff (teachers and assistants)
District ID
ESL/ELL teachers
New ELL teachers
General education teachers
New general education teachers
Instructional assistants for ELLs
Special education teachers
Instructional assistants in general education
14
10
60
66
67
30
11
3
29
44
24
61
1
55
57
41
33
18
27
63
4
71
46
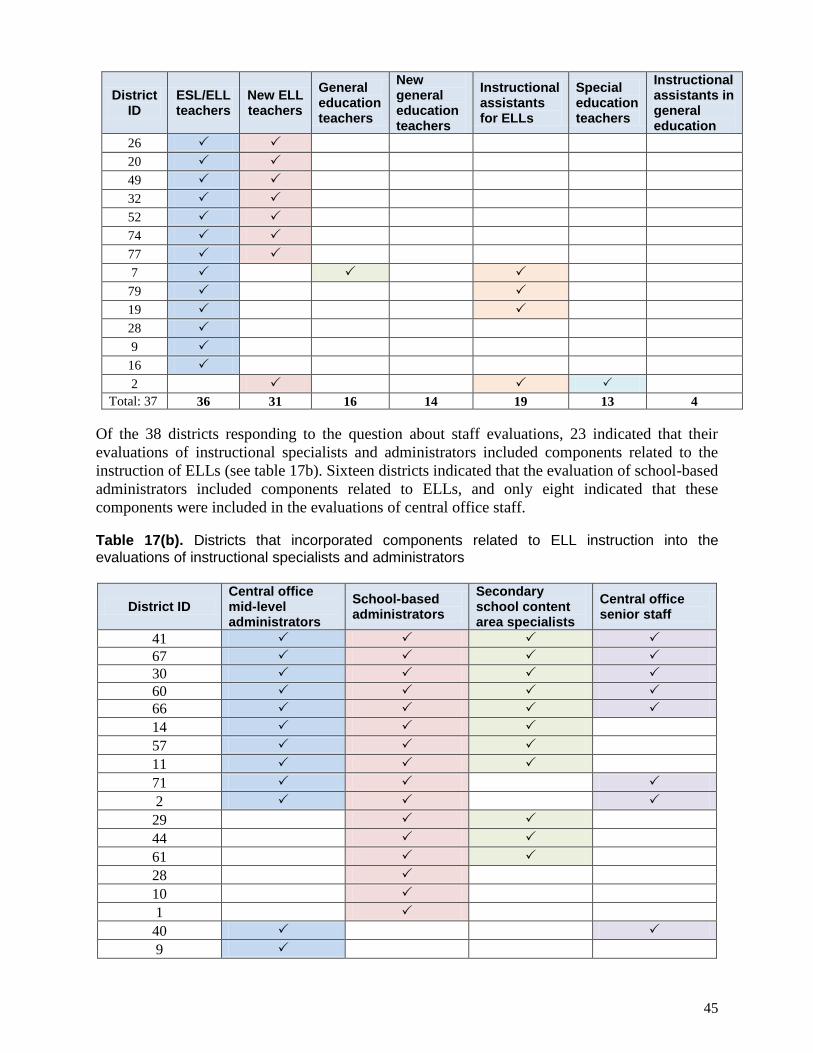
Draft
45
District ID
ESL/ELL teachers
New ELL teachers
General education teachers
New general education teachers
Instructional assistants for ELLs
Special education teachers
Instructional assistants in general education
26
20
49
32
52
74
77
7
79
19
28
9
16
2
Total: 37 36 31 16 14 19 13 4
Of the 38 districts responding to the question about staff evaluations, 23 indicated that their
evaluations of instructional specialists and administrators included components related to the
instruction of ELLs (see table 17b). Sixteen districts indicated that the evaluation of school-based
administrators included components related to ELLs, and only eight indicated that these
components were included in the evaluations of central office staff.
Table 17(b). Districts that incorporated components related to ELL instruction into the evaluations of instructional specialists and administrators
District ID Central office mid-level administrators
School-based administrators
Secondary school content area specialists
Central office senior staff
41
67
30
60
66
14
57
11
71
2
29
44
61
28
10
1
40
9
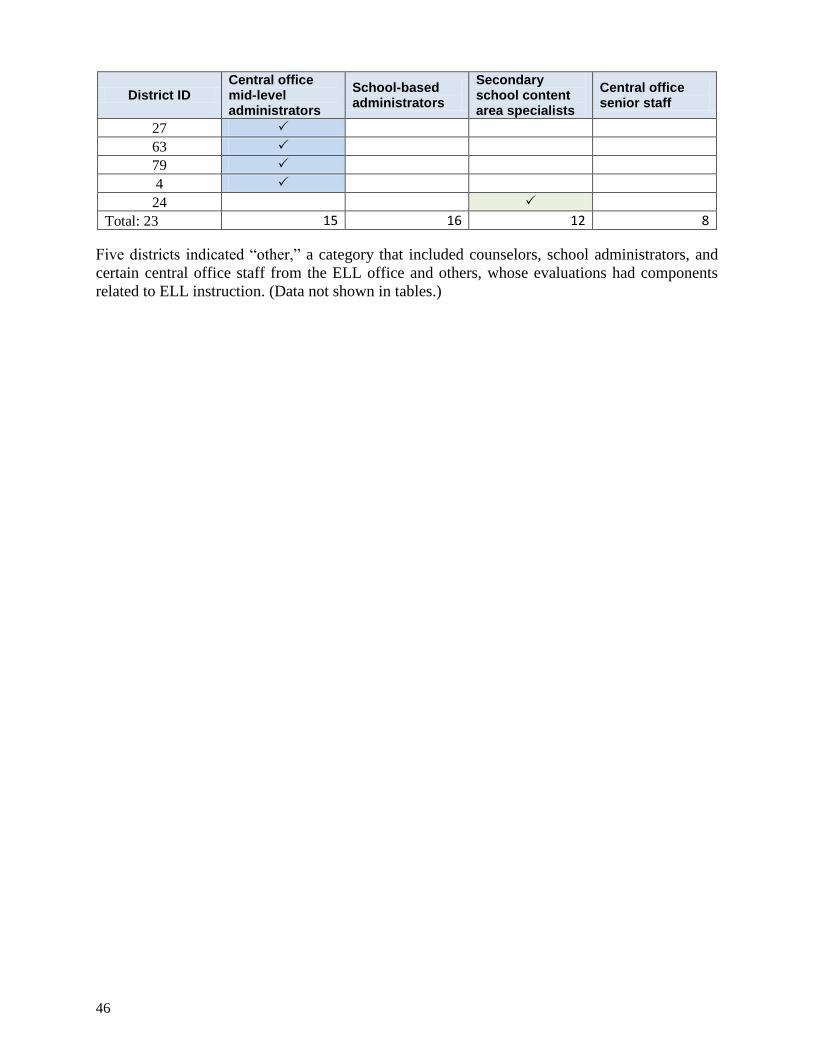
46
District ID Central office mid-level administrators
School-based administrators
Secondary school content area specialists
Central office senior staff
27
63
79
4
24
Total: 23 15 16 12 8
Five districts indicated “other,” a category that included counselors, school administrators, and
certain central office staff from the ELL office and others, whose evaluations had components
related to ELL instruction. (Data not shown in tables.)
Draft
47
IV. Teachers of ELLs: State Requirements and Number of Teachers with Relevant Endorsements or Certification
State Requirements of Teachers Providing Instruction to English Language Learners (N = 44 Districts)
ELLs across the nation and in Council-member districts are taught by general education teachers
as well as by ESL/ESOL or bilingual education teachers. Depending on the district and state,
ELLs may spend more time in a general education classroom with a general education teacher
than with an ESL/bilingual education teacher. The survey asked districts to report what they
understood to be state requirements for general education teachers and for ESL/bilingual
education teachers. Some 44 districts responded; however, at times, responses were inconsistent
among districts in the same state. Moreover, it is important to note that the inconsistencies go
beyond what was reported, because the actual meaning of “endorsement, license, and
certification” varies from state to state, and the number of hours or courses required to obtain
such qualifications differ from one locale to another.
We separated data on the 44 responding districts into three tables that detail state requirements
for specific types of teachers, namely, bilingual teachers, ESL teachers, general education
teachers of ELLs, and special education teachers of ELLs. Not all of the 44 responding districts
provided information for each category of teacher, thus, the tables display information on
differing subsets of responding districts.
Table 18 shows the responses regarding credentialing requirements for bilingual teachers. Of the
36 districts responding on state requirements for bilingual teachers, 29 were in states that require
either an ESL/ELD license/endorsement or an ESL/bilingual certification in order to provide
instruction to ELLs. Eight districts marked “other requirements,” that included an elementary or
secondary license with bilingual endorsement; highly qualified credentials (per ESEA) in the
content area being taught, grade level and subject license, or general education/early childhood
licensure.
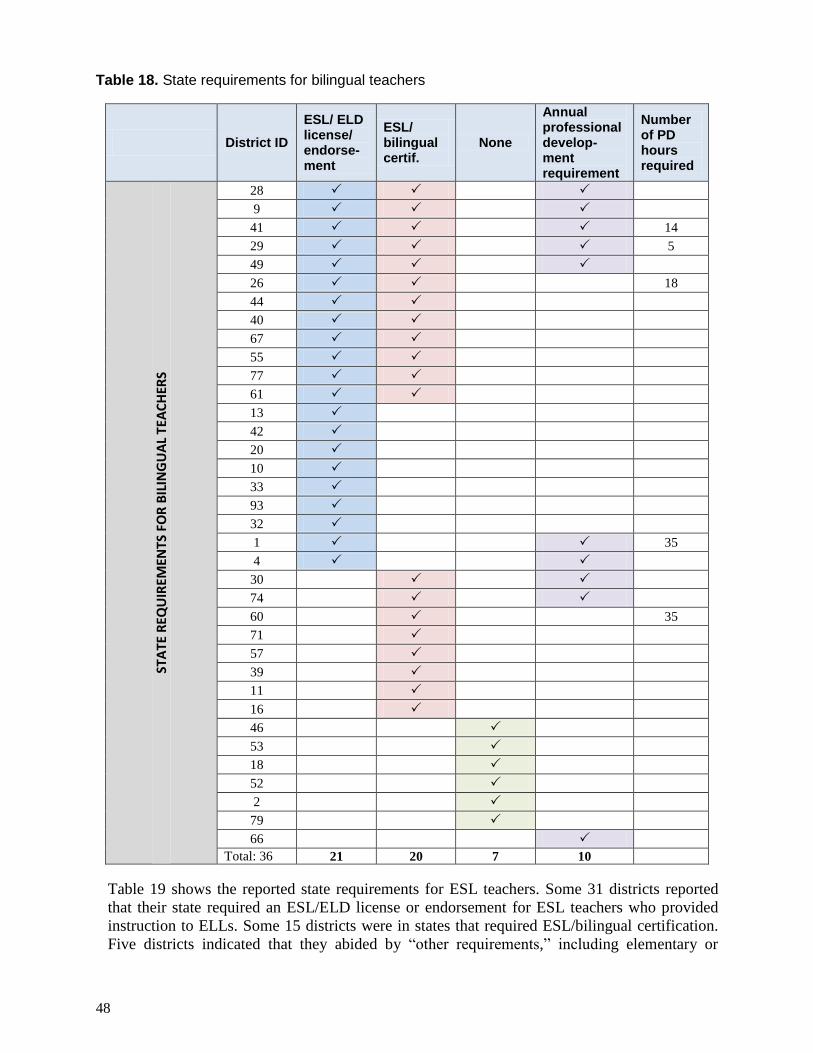
48
Table 18. State requirements for bilingual teachers
District ID
ESL/ ELD license/ endorse-ment
ESL/ bilingual certif.
None
Annual professional develop-ment requirement
Number of PD hours required
STA
TE R
EQU
IREM
ENTS
FO
R B
ILIN
GU
AL
TEA
CH
ERS
28
9
41 14
29 5
49
26 18
44
40
67
55
77
61
13
42
20
10
33
93
32
1 35
4
30
74
60 35
71
57
39
11
16
46
53
18
52
2
79
66
Total: 36 21 20 7 10
Table 19 shows the reported state requirements for ESL teachers. Some 31 districts reported
that their state required an ESL/ELD license or endorsement for ESL teachers who provided
instruction to ELLs. Some 15 districts were in states that required ESL/bilingual certification.
Five districts indicated that they abided by “other requirements,” including elementary or
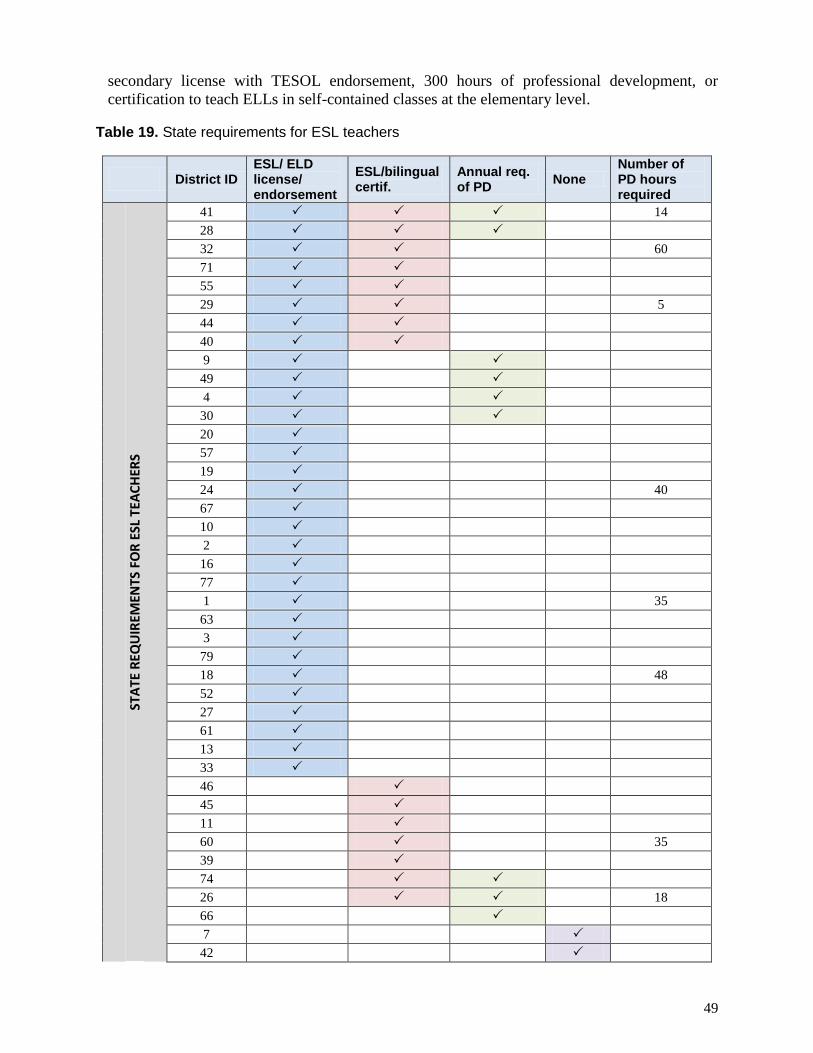
Draft
49
secondary license with TESOL endorsement, 300 hours of professional development, or
certification to teach ELLs in self-contained classes at the elementary level.
Table 19. State requirements for ESL teachers
District ID ESL/ ELD license/ endorsement
ESL/bilingual certif.
Annual req. of PD
None Number of PD hours required
STA
TE R
EQU
IREM
ENTS
FO
R E
SL T
EAC
HER
S
41 14
28 32 60
71 55
29 5
44
40
9
49
4
30
20
57
19
24 40
67
10
2
16
77
1 35
63
3
79
18 48
52
27
61
13
33
46 45
11
60 35
39
74
26 18
66
7 42
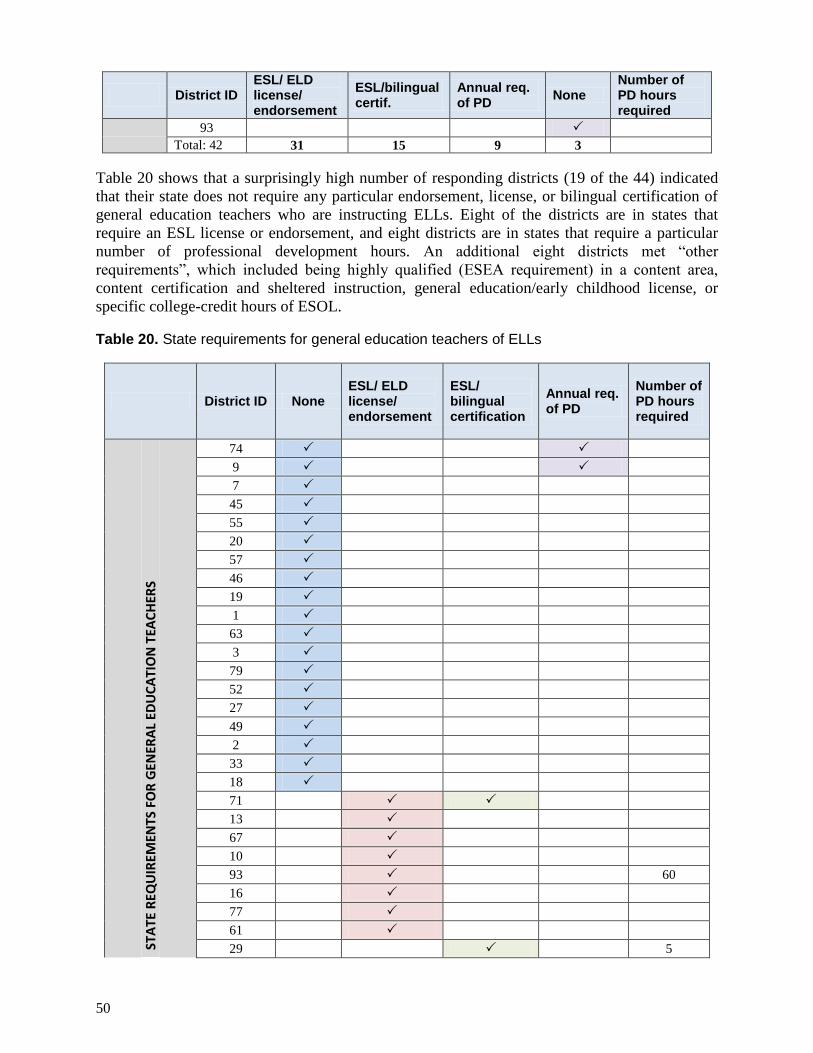
50
District ID ESL/ ELD license/ endorsement
ESL/bilingual certif.
Annual req. of PD
None Number of PD hours required
93
Total: 42 31 15 9 3
Table 20 shows that a surprisingly high number of responding districts (19 of the 44) indicated
that their state does not require any particular endorsement, license, or bilingual certification of
general education teachers who are instructing ELLs. Eight of the districts are in states that
require an ESL license or endorsement, and eight districts are in states that require a particular
number of professional development hours. An additional eight districts met “other
requirements”, which included being highly qualified (ESEA requirement) in a content area,
content certification and sheltered instruction, general education/early childhood license, or
specific college-credit hours of ESOL.
Table 20. State requirements for general education teachers of ELLs
District ID None ESL/ ELD license/ endorsement
ESL/ bilingual certification
Annual req. of PD
Number of PD hours required
STA
TE R
EQU
IREM
ENTS
FO
R G
ENER
AL
EDU
CA
TIO
N T
EAC
HER
S
74
9
7
45
55
20
57
46
19
1
63
3
79
52
27
49
2
33
18
71
13
67
10
93 60
16
77
61
29 5
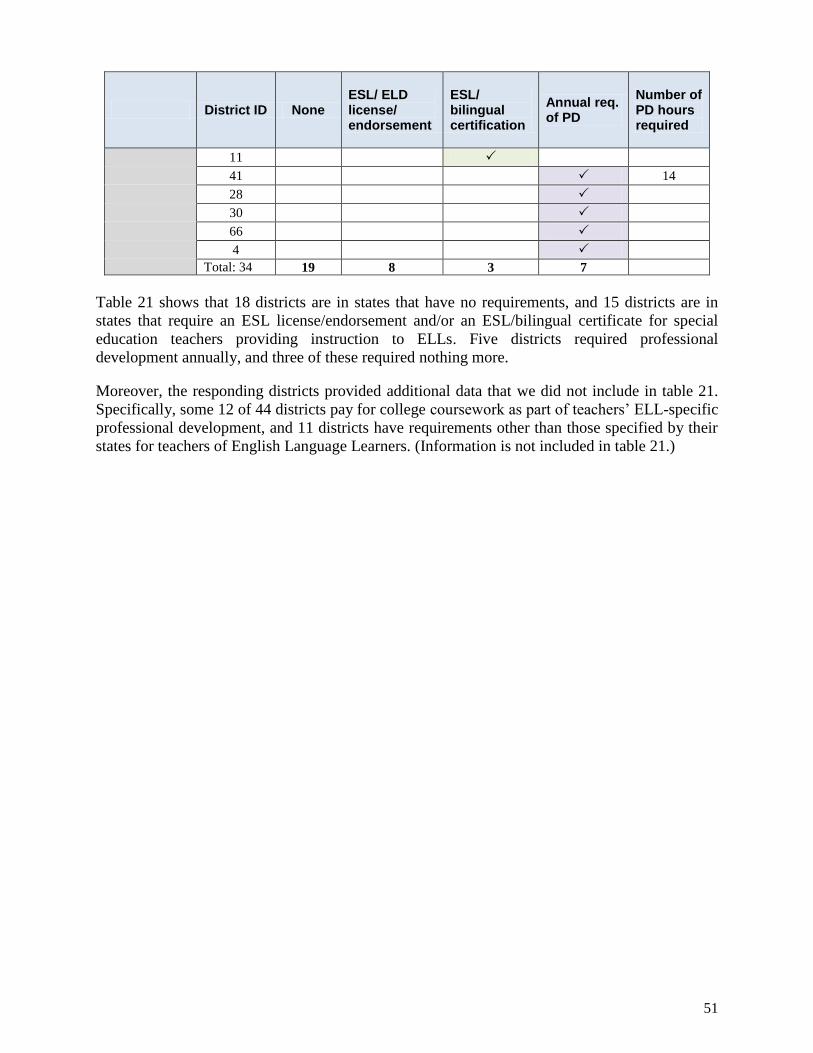
Draft
51
District ID None ESL/ ELD license/ endorsement
ESL/ bilingual certification
Annual req. of PD
Number of PD hours required
11
41 14
28
30
66
4
Total: 34 19 8 3 7
Table 21 shows that 18 districts are in states that have no requirements, and 15 districts are in
states that require an ESL license/endorsement and/or an ESL/bilingual certificate for special
education teachers providing instruction to ELLs. Five districts required professional
development annually, and three of these required nothing more.
Moreover, the responding districts provided additional data that we did not include in table 21.
Specifically, some 12 of 44 districts pay for college coursework as part of teachers’ ELL-specific
professional development, and 11 districts have requirements other than those specified by their
states for teachers of English Language Learners. (Information is not included in table 21.)
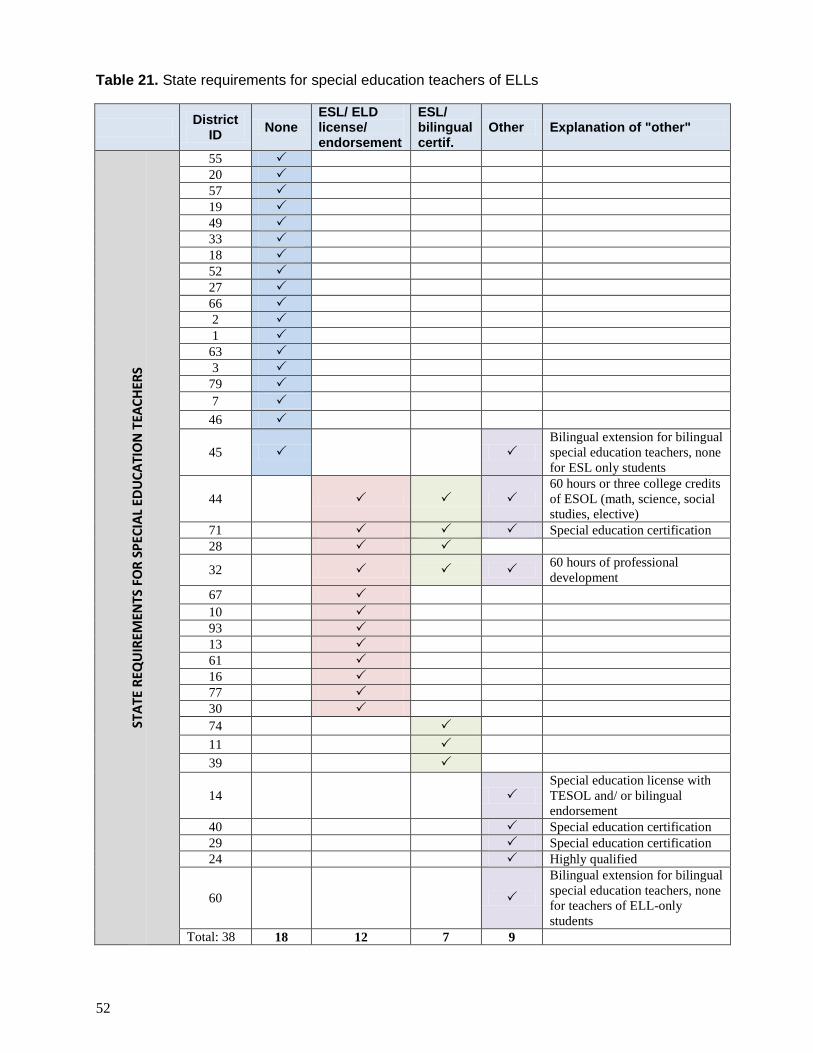
52
Table 21. State requirements for special education teachers of ELLs
District
ID None
ESL/ ELD license/ endorsement
ESL/ bilingual certif.
Other Explanation of "other" ST
ATE
REQ
UIR
EMEN
TS F
OR
SP
ECIA
L ED
UC
ATI
ON
TEA
CH
ERS
55
20
57
19
49
33
18
52
27
66
2
1
63
3
79
7
46
45
Bilingual extension for bilingual
special education teachers, none
for ESL only students
44
60 hours or three college credits
of ESOL (math, science, social
studies, elective)
71 Special education certification
28
32 60 hours of professional
development
67
10
93
13
61
16
77
30
74
11
39
14
Special education license with
TESOL and/ or bilingual
endorsement
40 Special education certification
29 Special education certification
24 Highly qualified
60
Bilingual extension for bilingual
special education teachers, none
for teachers of ELL-only
students
Total: 38 18 12 7 9
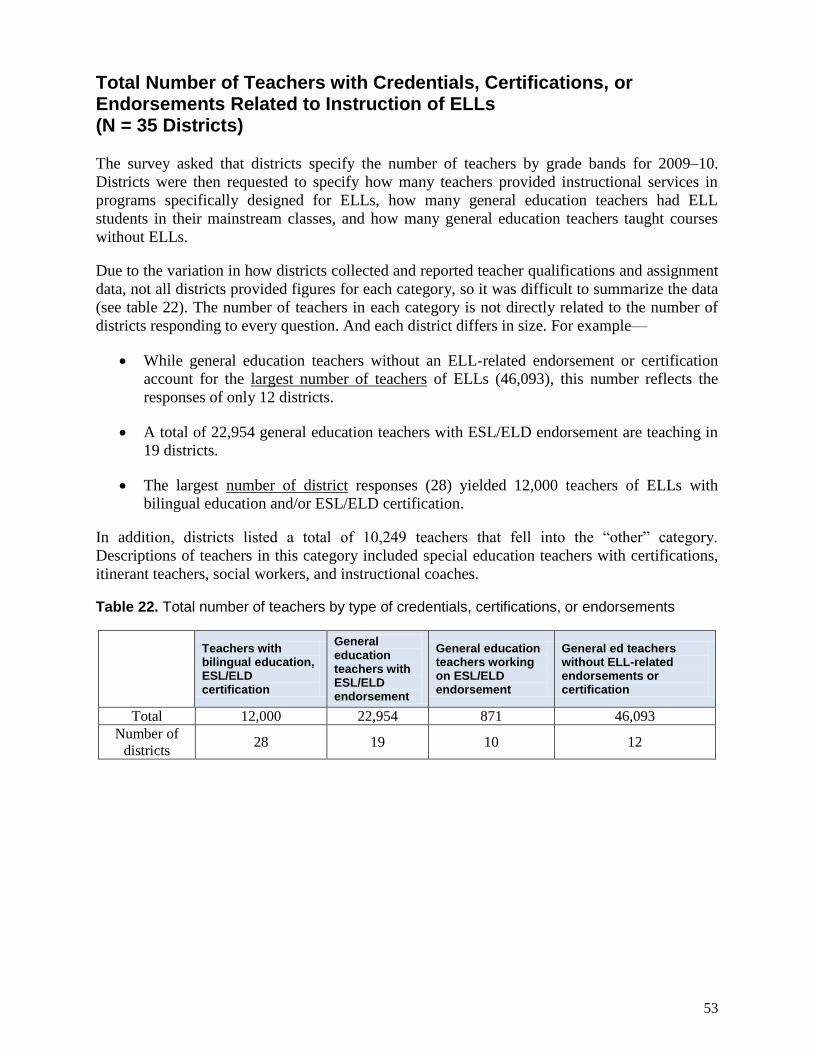
Draft
53
Total Number of Teachers with Credentials, Certifications, or Endorsements Related to Instruction of ELLs (N = 35 Districts)
The survey asked that districts specify the number of teachers by grade bands for 2009–10.
Districts were then requested to specify how many teachers provided instructional services in
programs specifically designed for ELLs, how many general education teachers had ELL
students in their mainstream classes, and how many general education teachers taught courses
without ELLs.
Due to the variation in how districts collected and reported teacher qualifications and assignment
data, not all districts provided figures for each category, so it was difficult to summarize the data
(see table 22). The number of teachers in each category is not directly related to the number of
districts responding to every question. And each district differs in size. For example—
While general education teachers without an ELL-related endorsement or certification
account for the largest number of teachers of ELLs (46,093), this number reflects the
responses of only 12 districts.
A total of 22,954 general education teachers with ESL/ELD endorsement are teaching in
19 districts.
The largest number of district responses (28) yielded 12,000 teachers of ELLs with
bilingual education and/or ESL/ELD certification.
In addition, districts listed a total of 10,249 teachers that fell into the “other” category.
Descriptions of teachers in this category included special education teachers with certifications,
itinerant teachers, social workers, and instructional coaches.
Table 22. Total number of teachers by type of credentials, certifications, or endorsements
Teachers with bilingual education, ESL/ELD certification
General education teachers with ESL/ELD endorsement
General education teachers working on ESL/ELD endorsement
General ed teachers without ELL-related endorsements or certification
Total 12,000 22,954 871 46,093
Number of
districts 28 19 10 12

54
V. Assignments of Instructional Staff and Estimated Shortage of ELL Teachers Number of Teachers in 2009–10 (N = 35 Districts)
Not all districts provided data on the number of ELL teachers or the shortage of such teachers.
To provide a more comprehensive picture, we, therefore, retrieved data from the NCES database,
Common Core of Data (CCD), or district websites for as many member districts as possible. All
together, the Council retrieved data on teachers from 63 member districts. The grand total of
teachers working in these school districts was 447,836.21
The survey collected teacher-related information on districts that employed about 195,000
teachers or some 40 percent of the total teachers in the Council membership (i.e., 447,836).
These data were provided by some 35 districts, or about half of the Council’s members. For this
subset, responses indicate that—
Some 195,472 teachers were employed in the 35 responding districts in the 2009–2010
school year.
The total number of teachers ranged from 1,370 in Dayton to 75,000 in New York City.
Data collection and reporting differs significantly across the Great City School districts, so not
all districts could provide teacher-related information on the categories we requested. We were
interested in learning about the number of teachers providing instruction to ELLs relative to the
total number of teachers in the districts. We also hoped to learn how teachers were assigned to
differing educational settings across grades.
Districts provided the most complete responses concerning “Teachers providing instructional
services in programs specifically for ELLs.” Twenty-seven districts were able to disaggregate the
numbers by grade span. In contrast, fewer districts were able to provide grade-level data on their
general education teachers. Table 23 displays the number of teachers by type and grade spans for
the 27 districts that were able to provide these numbers.22
Table 23. ELL and non-ELL teachers by grade span, 2009–10
Type of Teacher Grades
K–5
Grades
6–8
Grades
9–12 Total
Teachers providing instructional services
in programs specifically for ELLs (ESL,
Dual Language, Sheltered English,
Newcomer, etc.)
27 Districts
8,430 7,239 7,402 23,071
General education teachers with ELLs in 10 Districts
21
Refer to appendix D for a list of districts included in this count. 22
A couple of districts clarified that they do not collect these data or do not disaggregate the data as requested.
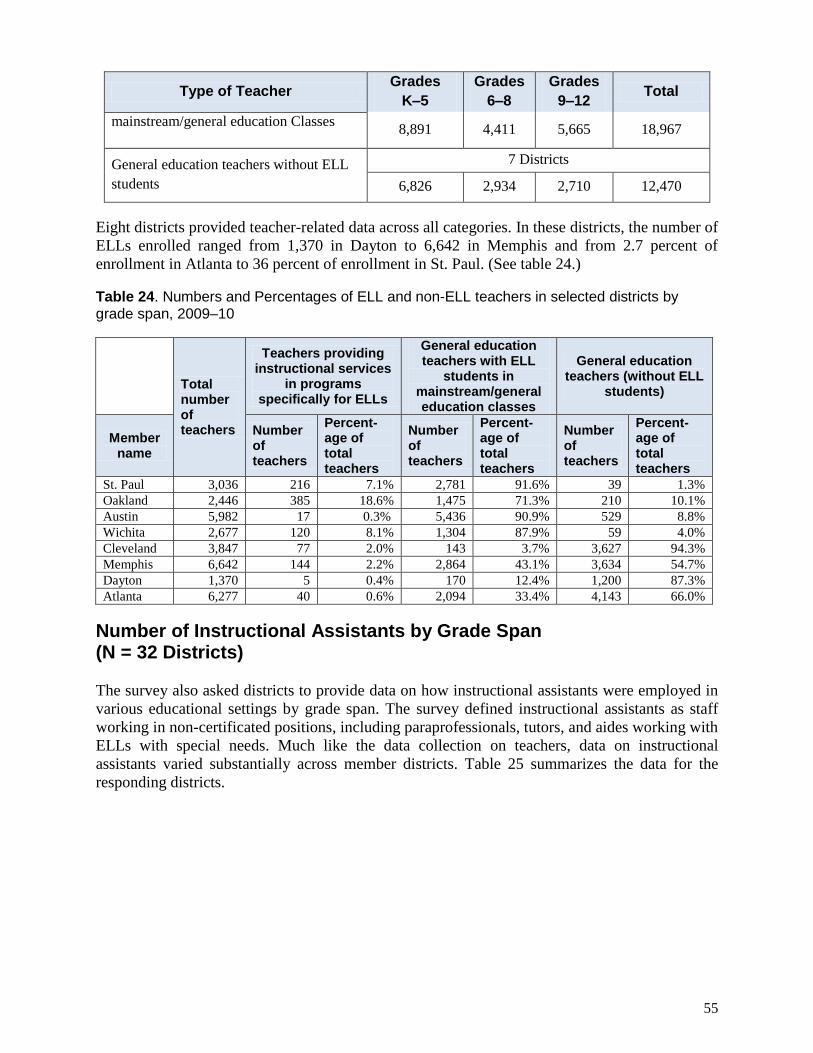
Draft
55
Type of Teacher Grades
K–5
Grades
6–8
Grades
9–12 Total
mainstream/general education Classes 8,891 4,411 5,665 18,967
General education teachers without ELL
students
7 Districts
6,826 2,934 2,710 12,470
Eight districts provided teacher-related data across all categories. In these districts, the number of
ELLs enrolled ranged from 1,370 in Dayton to 6,642 in Memphis and from 2.7 percent of
enrollment in Atlanta to 36 percent of enrollment in St. Paul. (See table 24.)
Table 24. Numbers and Percentages of ELL and non-ELL teachers in selected districts by grade span, 2009–10
Total number of teachers
Teachers providing instructional services
in programs specifically for ELLs
General education teachers with ELL
students in mainstream/general education classes
General education teachers (without ELL
students)
Member name
Number of teachers
Percent- age of total teachers
Number of teachers
Percent-age of total teachers
Number of teachers
Percent- age of total teachers
St. Paul 3,036 216 7.1% 2,781 91.6% 39 1.3%
Oakland 2,446 385 18.6% 1,475 71.3% 210 10.1%
Austin 5,982 17 0.3% 5,436 90.9% 529 8.8%
Wichita 2,677 120 8.1% 1,304 87.9% 59 4.0%
Cleveland 3,847 77 2.0% 143 3.7% 3,627 94.3%
Memphis 6,642 144 2.2% 2,864 43.1% 3,634 54.7%
Dayton 1,370 5 0.4% 170 12.4% 1,200 87.3%
Atlanta 6,277 40 0.6% 2,094 33.4% 4,143 66.0%
Number of Instructional Assistants by Grade Span (N = 32 Districts)
The survey also asked districts to provide data on how instructional assistants were employed in
various educational settings by grade span. The survey defined instructional assistants as staff
working in non-certificated positions, including paraprofessionals, tutors, and aides working with
ELLs with special needs. Much like the data collection on teachers, data on instructional
assistants varied substantially across member districts. Table 25 summarizes the data for the
responding districts.
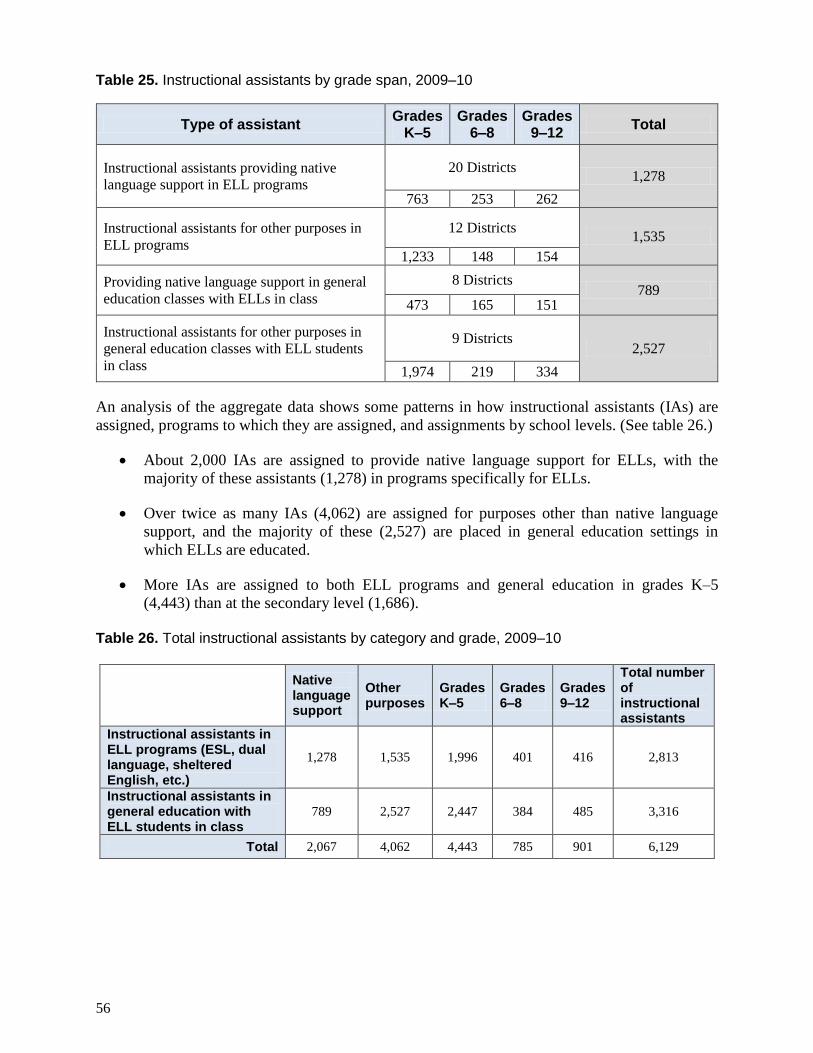
56
Table 25. Instructional assistants by grade span, 2009–10
Type of assistant Grades
K–5 Grades
6–8 Grades
9–12 Total
Instructional assistants providing native
language support in ELL programs
20 Districts 1,278
763 253 262
Instructional assistants for other purposes in
ELL programs
12 Districts 1,535
1,233 148 154
Providing native language support in general
education classes with ELLs in class
8 Districts 789
473 165 151
Instructional assistants for other purposes in
general education classes with ELL students
in class
9 Districts 2,527
1,974 219 334
An analysis of the aggregate data shows some patterns in how instructional assistants (IAs) are
assigned, programs to which they are assigned, and assignments by school levels. (See table 26.)
About 2,000 IAs are assigned to provide native language support for ELLs, with the
majority of these assistants (1,278) in programs specifically for ELLs.
Over twice as many IAs (4,062) are assigned for purposes other than native language
support, and the majority of these (2,527) are placed in general education settings in
which ELLs are educated.
More IAs are assigned to both ELL programs and general education in grades K–5
(4,443) than at the secondary level (1,686).
Table 26. Total instructional assistants by category and grade, 2009–10
Native language support
Other purposes
Grades K–5
Grades 6–8
Grades 9–12
Total number of instructional assistants
Instructional assistants in ELL programs (ESL, dual language, sheltered English, etc.)
1,278 1,535 1,996 401 416 2,813
Instructional assistants in general education with ELL students in class
789 2,527 2,447 384 485 3,316
Total 2,067 4,062 4,443 785 901 6,129
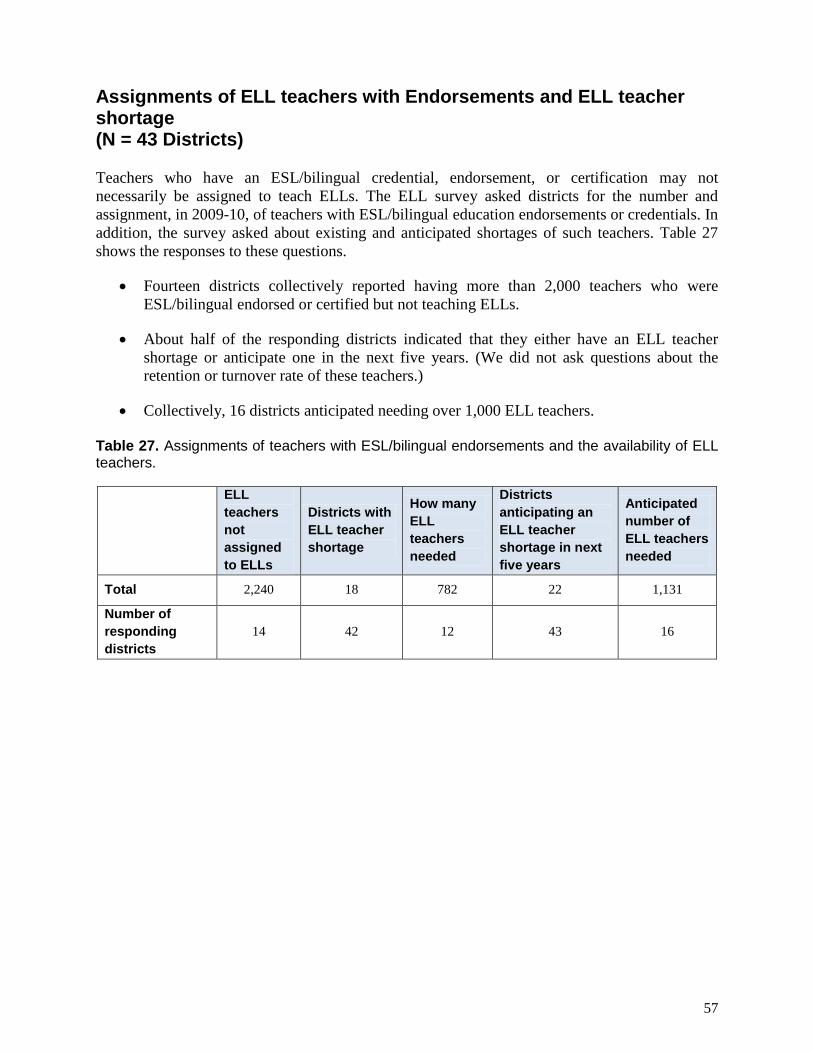
Draft
57
Assignments of ELL teachers with Endorsements and ELL teacher shortage
(N = 43 Districts)
Teachers who have an ESL/bilingual credential, endorsement, or certification may not
necessarily be assigned to teach ELLs. The ELL survey asked districts for the number and
assignment, in 2009-10, of teachers with ESL/bilingual education endorsements or credentials. In
addition, the survey asked about existing and anticipated shortages of such teachers. Table 27
shows the responses to these questions.
Fourteen districts collectively reported having more than 2,000 teachers who were
ESL/bilingual endorsed or certified but not teaching ELLs.
About half of the responding districts indicated that they either have an ELL teacher
shortage or anticipate one in the next five years. (We did not ask questions about the
retention or turnover rate of these teachers.)
Collectively, 16 districts anticipated needing over 1,000 ELL teachers.
Table 27. Assignments of teachers with ESL/bilingual endorsements and the availability of ELL teachers.
ELL
teachers
not
assigned
to ELLs
Districts with
ELL teacher
shortage
How many
ELL
teachers
needed
Districts
anticipating an
ELL teacher
shortage in next
five years
Anticipated
number of
ELL teachers
needed
Total 2,240 18 782 22 1,131
Number of
responding
districts
14 42 12 43 16
58
VI. Achievement Data
English Language Proficiency Data for 2009–10 by Level of Proficiency (N = 37 Districts)
Using their respective state proficiency assessments, 37 districts provided data for the 2009–10
school year on the number of ELLs at each English Language Proficiency (ELP) level. However,
the number of proficiency levels is not the same across states. In fact, states use differing
proficiency scales: 1 to 4, 1 to 5, and 1 to 6.
Given the variation in proficiency levels used by the districts, the Council could not analyze ELP
trends in the aggregate. Instead, we divided the districts into two groups: one for districts using
up to four proficiency levels, and one for districts with five or six proficiency levels. The first
group was composed of 11 districts and the second group was composed of 26 districts—a total
of 37 districts.
Districts with up to Four Levels of English Language Proficiency
Exhibits 6 through 8 display English Language Proficiency data for ELLs in grades K–5, 6-8,
and 9-12 attending one of 11 districts that reported measuring up to four levels of ELP. Two of
the districts reported only three levels of proficiency. The data show the percentage of ELLs at
each proficiency level in the 2009–10 school year. The results did not show a discernible
pattern.
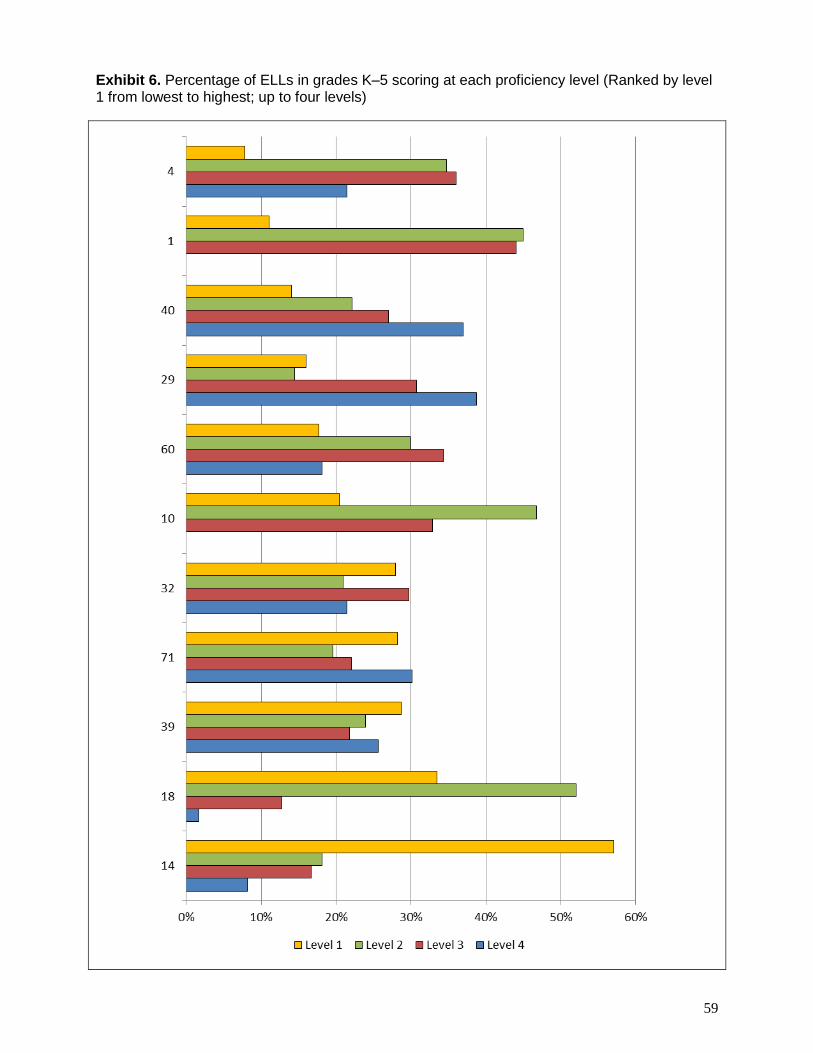
Draft
59
Exhibit 6. Percentage of ELLs in grades K–5 scoring at each proficiency level (Ranked by level 1 from lowest to highest; up to four levels)
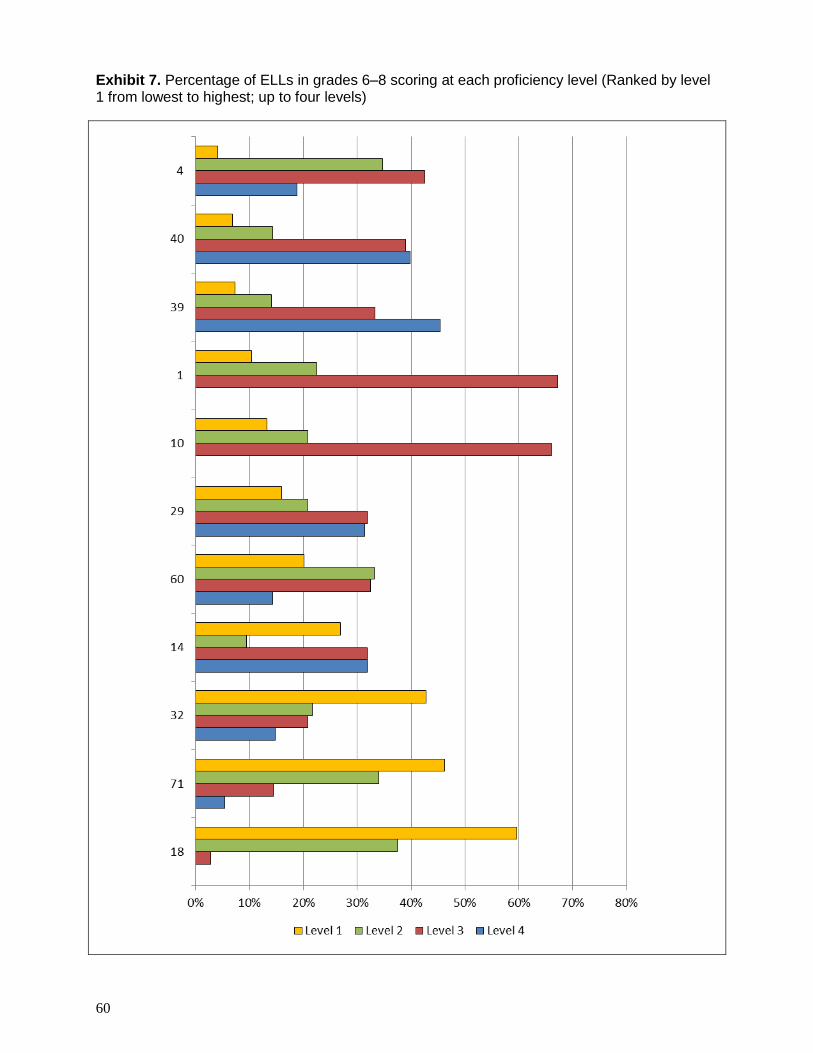
60
Exhibit 7. Percentage of ELLs in grades 6–8 scoring at each proficiency level (Ranked by level 1 from lowest to highest; up to four levels)
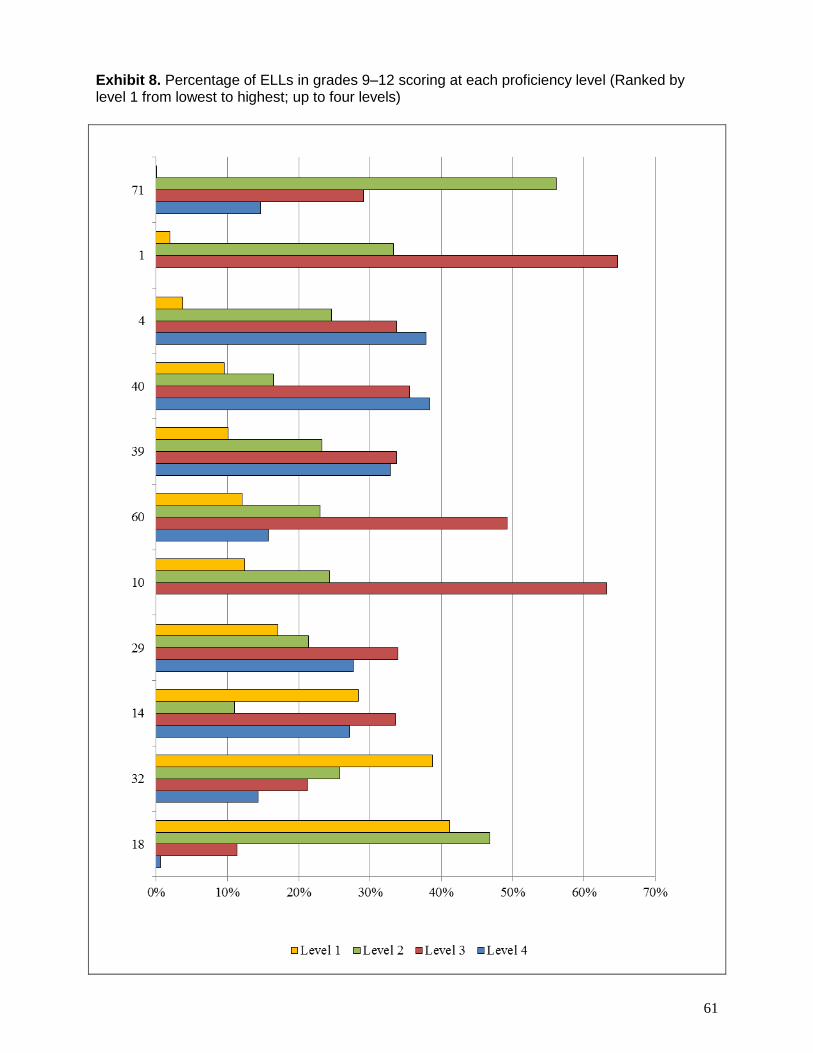
Draft
61
Exhibit 8. Percentage of ELLs in grades 9–12 scoring at each proficiency level (Ranked by level 1 from lowest to highest; up to four levels)

62
Districts with up to Six Levels of English Language Proficiency
Exhibits 9 through 11 show English language proficiency (ELP) data for ELLs in grades K–5, 6-
8, and 9-12 attending one of 26 districts that reported using five or six levels of English
proficiency. Since very few districts reported using a sixth level, for purposes of displaying the
data, we consolidated levels five and six.

Draft
63
Exhibit 9. Percentage of ELLs in grades K–5 scoring at each proficiency level (Ranked by level 1 from lowest to highest; five or six levels)
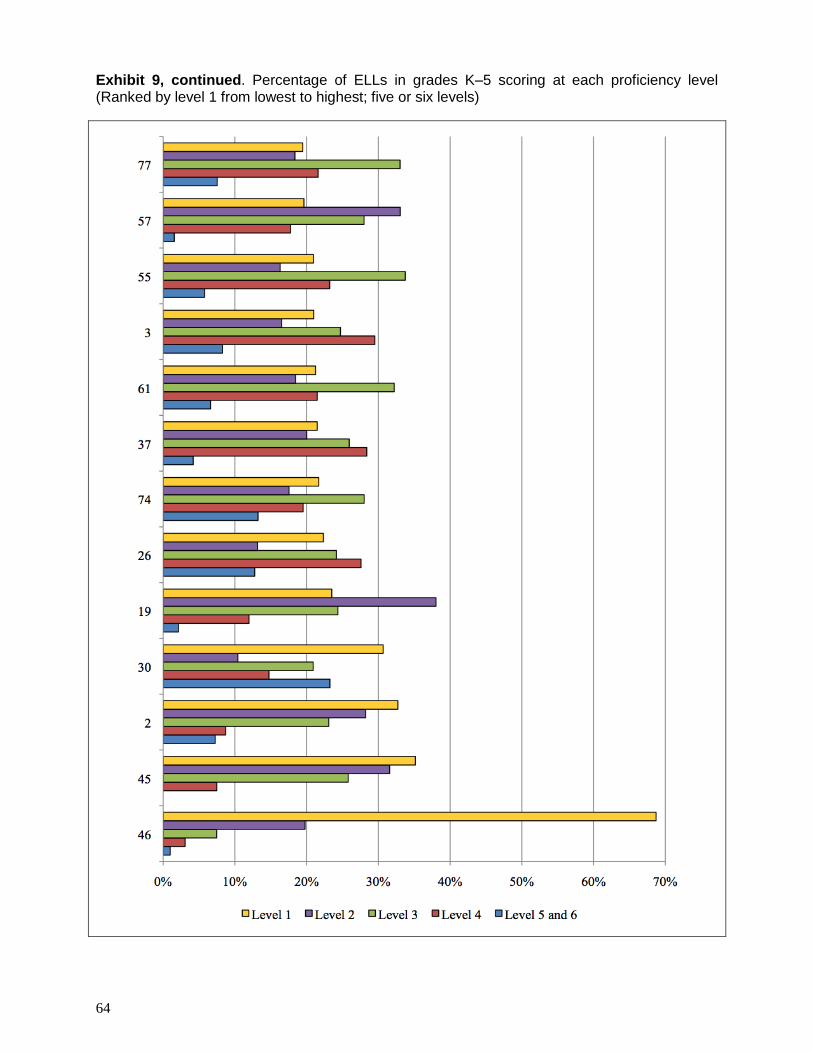
64
Exhibit 9, continued. Percentage of ELLs in grades K–5 scoring at each proficiency level (Ranked by level 1 from lowest to highest; five or six levels)
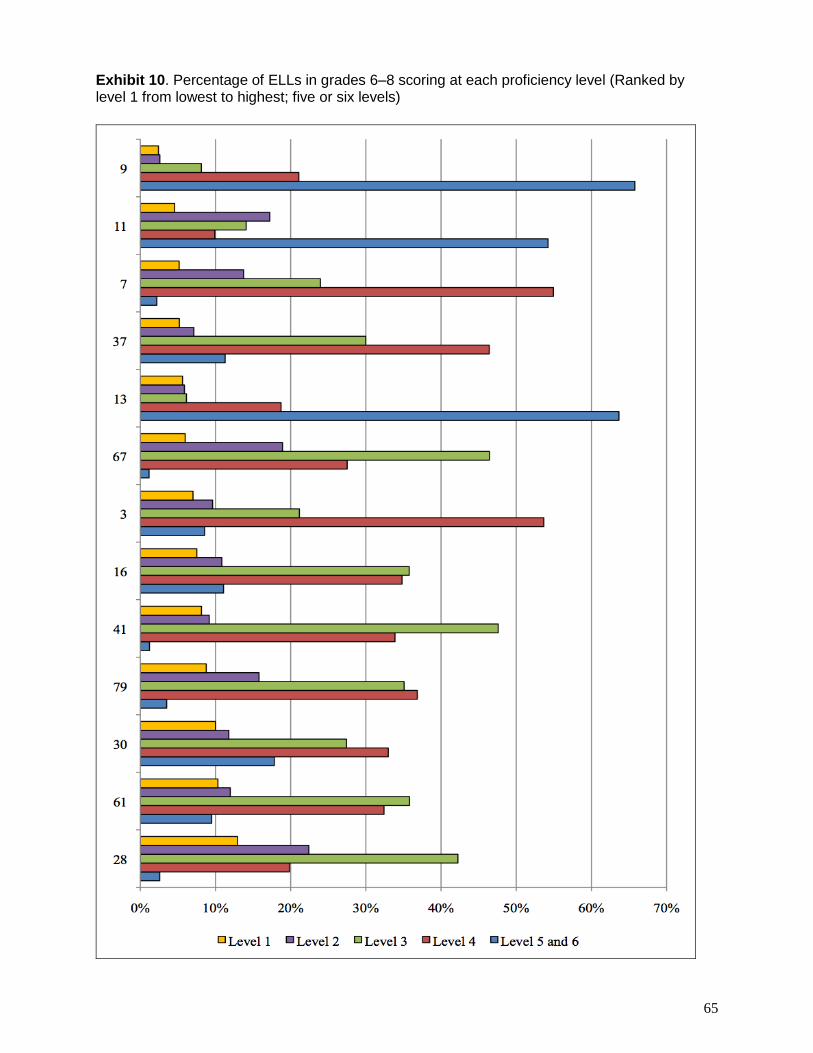
Draft
65
Exhibit 10. Percentage of ELLs in grades 6–8 scoring at each proficiency level (Ranked by level 1 from lowest to highest; five or six levels)
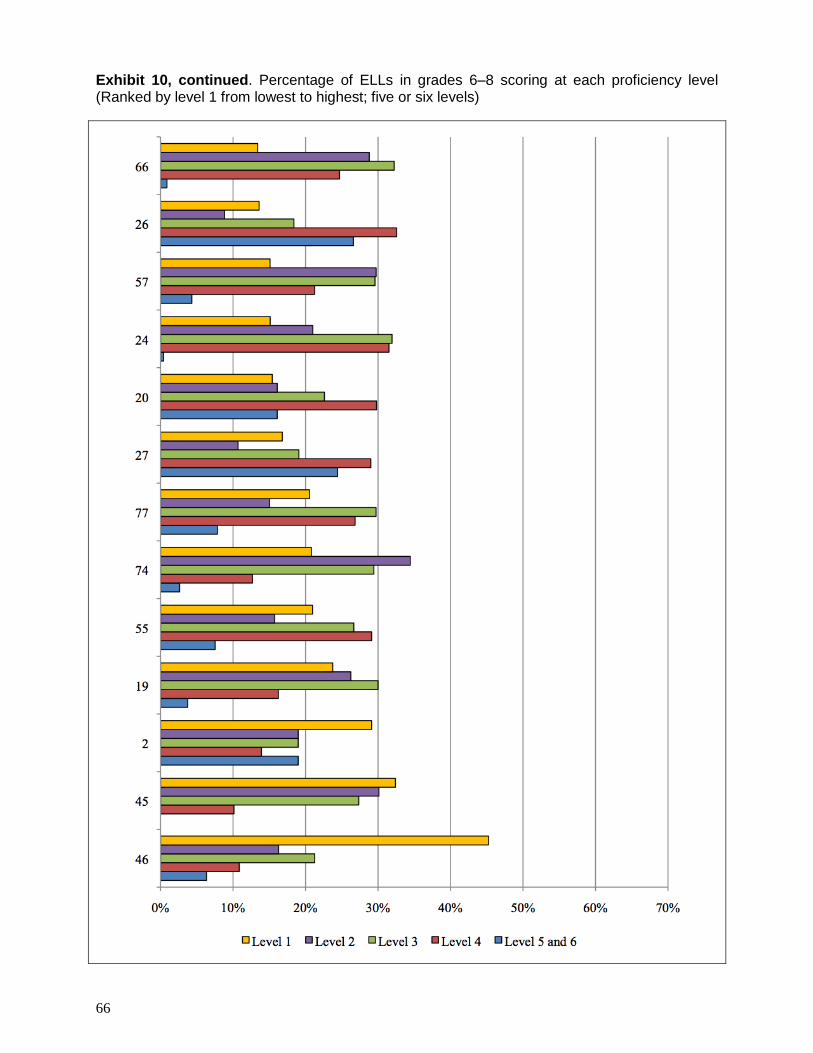
66
Exhibit 10, continued. Percentage of ELLs in grades 6–8 scoring at each proficiency level (Ranked by level 1 from lowest to highest; five or six levels)
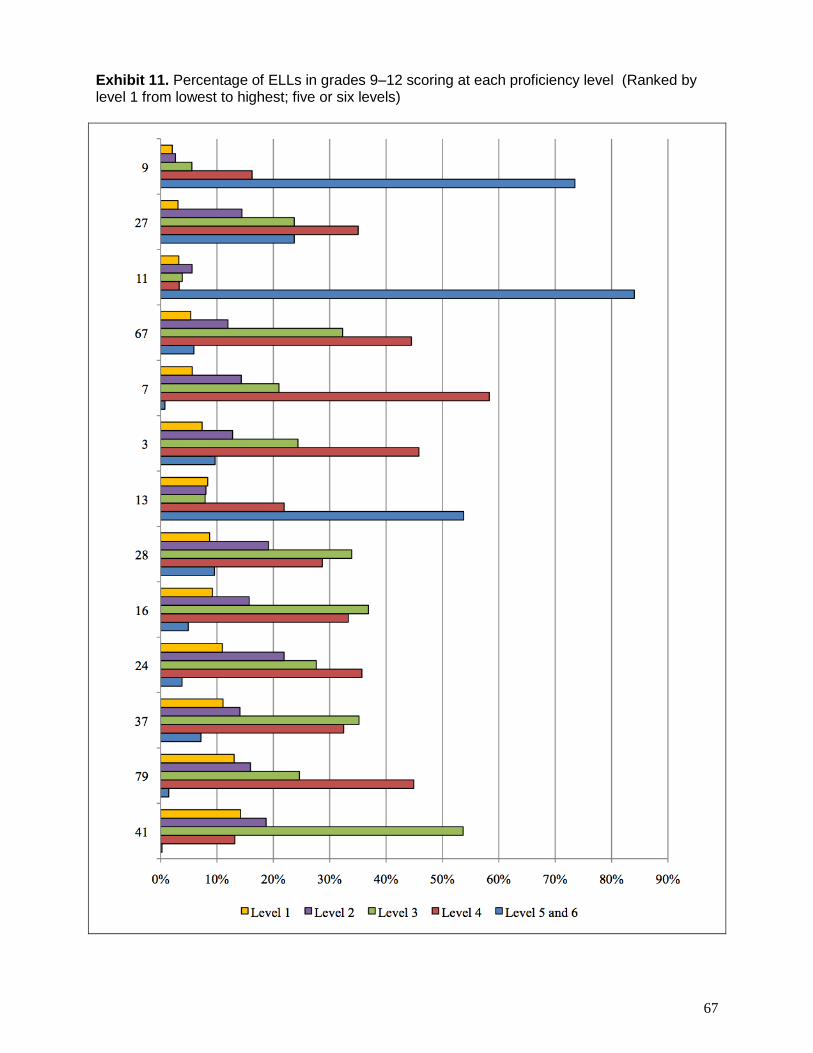
Draft
67
Exhibit 11. Percentage of ELLs in grades 9–12 scoring at each proficiency level (Ranked by level 1 from lowest to highest; five or six levels)
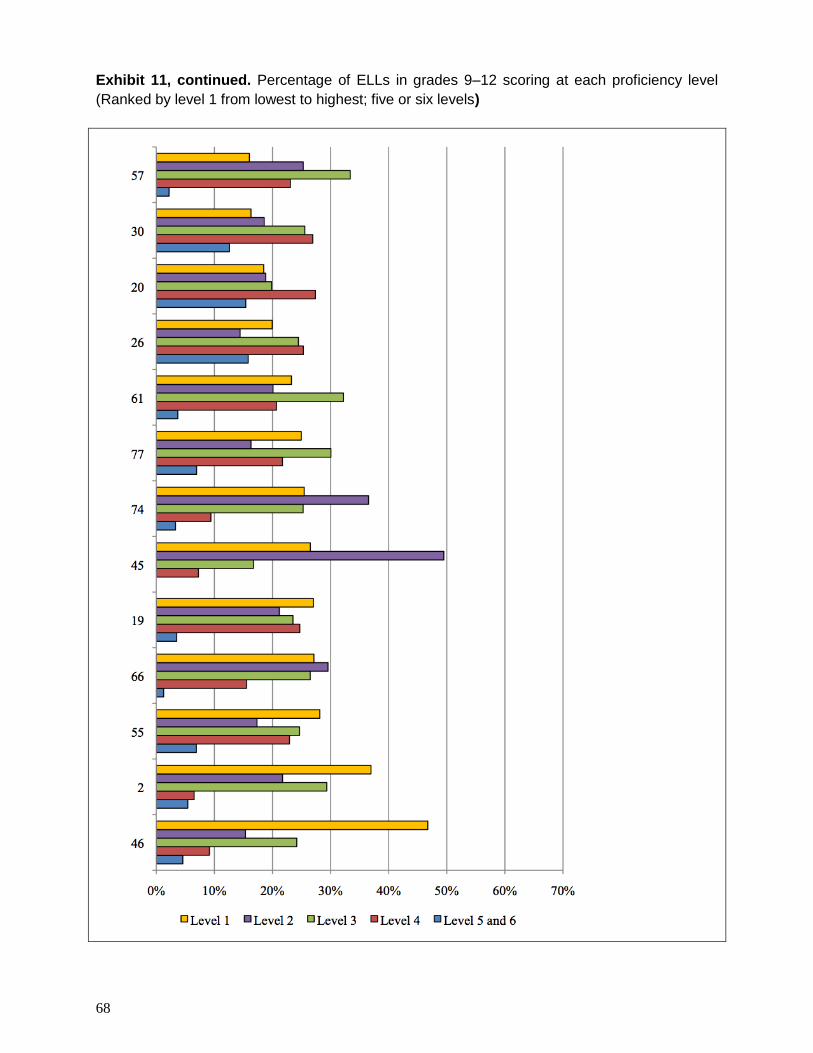
68
Exhibit 11, continued. Percentage of ELLs in grades 9–12 scoring at each proficiency level
(Ranked by level 1 from lowest to highest; five or six levels)
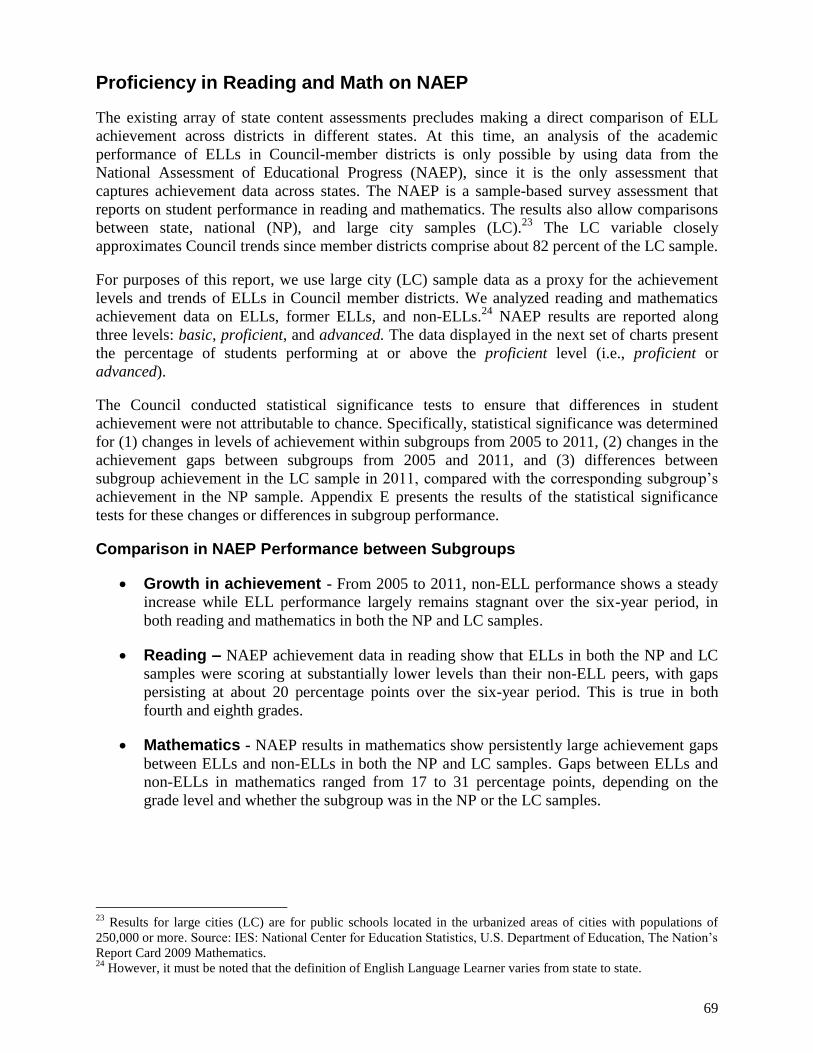
Draft
69
Proficiency in Reading and Math on NAEP
The existing array of state content assessments precludes making a direct comparison of ELL
achievement across districts in different states. At this time, an analysis of the academic
performance of ELLs in Council-member districts is only possible by using data from the
National Assessment of Educational Progress (NAEP), since it is the only assessment that
captures achievement data across states. The NAEP is a sample-based survey assessment that
reports on student performance in reading and mathematics. The results also allow comparisons
between state, national (NP), and large city samples (LC).23
The LC variable closely
approximates Council trends since member districts comprise about 82 percent of the LC sample.
For purposes of this report, we use large city (LC) sample data as a proxy for the achievement
levels and trends of ELLs in Council member districts. We analyzed reading and mathematics
achievement data on ELLs, former ELLs, and non-ELLs.24
NAEP results are reported along
three levels: basic, proficient, and advanced. The data displayed in the next set of charts present
the percentage of students performing at or above the proficient level (i.e., proficient or
advanced).
The Council conducted statistical significance tests to ensure that differences in student
achievement were not attributable to chance. Specifically, statistical significance was determined
for (1) changes in levels of achievement within subgroups from 2005 to 2011, (2) changes in the
achievement gaps between subgroups from 2005 and 2011, and (3) differences between
subgroup achievement in the LC sample in 2011, compared with the corresponding subgroup’s
achievement in the NP sample. Appendix E presents the results of the statistical significance
tests for these changes or differences in subgroup performance.
Comparison in NAEP Performance between Subgroups
Growth in achievement - From 2005 to 2011, non-ELL performance shows a steady
increase while ELL performance largely remains stagnant over the six-year period, in
both reading and mathematics in both the NP and LC samples.
Reading – NAEP achievement data in reading show that ELLs in both the NP and LC
samples were scoring at substantially lower levels than their non-ELL peers, with gaps
persisting at about 20 percentage points over the six-year period. This is true in both
fourth and eighth grades.
Mathematics - NAEP results in mathematics show persistently large achievement gaps
between ELLs and non-ELLs in both the NP and LC samples. Gaps between ELLs and
non-ELLs in mathematics ranged from 17 to 31 percentage points, depending on the
grade level and whether the subgroup was in the NP or the LC samples.
23
Results for large cities (LC) are for public schools located in the urbanized areas of cities with populations of
250,000 or more. Source: IES: National Center for Education Statistics, U.S. Department of Education, The Nation’s
Report Card 2009 Mathematics. 24
However, it must be noted that the definition of English Language Learner varies from state to state.

70
Achievement gap between ELLs and non-ELLs – The gap between ELLs and
non-ELLS in the LC and NP samples significantly widened between 2005 and 2011 in
both grades and subjects.
Achievement gap between former ELLs and non-ELLs – Achievement data on
former ELLs in grade 4 reading and mathematics in both the NP and LC samples paint a
more hopeful picture. Between 2005 and 2011, the percentage of former ELLs who
scored at or above the proficient level was almost at parity with non-ELLs in fourth grade
in both subjects.
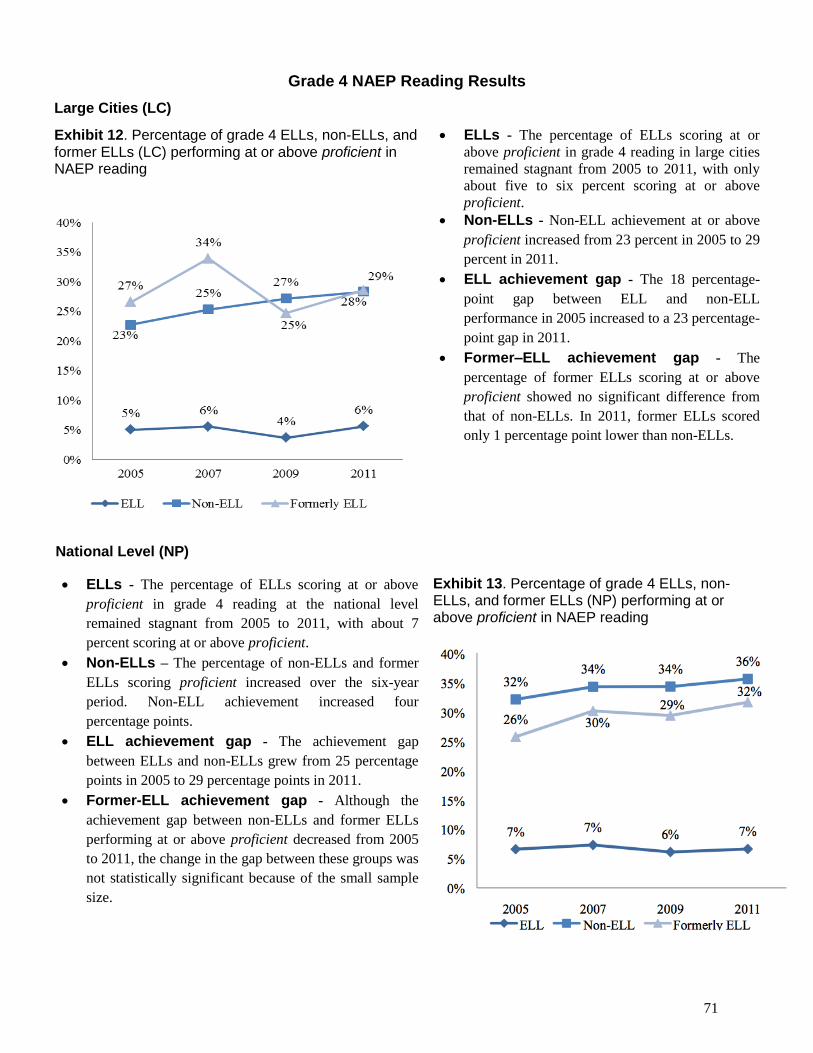
Draft
71
Grade 4 NAEP Reading Results
Large Cities (LC)
Exhibit 12. Percentage of grade 4 ELLs, non-ELLs, and former ELLs (LC) performing at or above proficient in NAEP reading
ELLs - The percentage of ELLs scoring at or
above proficient in grade 4 reading in large cities
remained stagnant from 2005 to 2011, with only
about five to six percent scoring at or above
proficient.
Non-ELLs - Non-ELL achievement at or above
proficient increased from 23 percent in 2005 to 29
percent in 2011.
ELL achievement gap - The 18 percentage-
point gap between ELL and non-ELL
performance in 2005 increased to a 23 percentage-
point gap in 2011.
Former–ELL achievement gap - The
percentage of former ELLs scoring at or above
proficient showed no significant difference from
that of non-ELLs. In 2011, former ELLs scored
only 1 percentage point lower than non-ELLs.
National Level (NP)
ELLs - The percentage of ELLs scoring at or above
proficient in grade 4 reading at the national level
remained stagnant from 2005 to 2011, with about 7
percent scoring at or above proficient.
Non-ELLs – The percentage of non-ELLs and former
ELLs scoring proficient increased over the six-year
period. Non-ELL achievement increased four
percentage points.
ELL achievement gap - The achievement gap
between ELLs and non-ELLs grew from 25 percentage
points in 2005 to 29 percentage points in 2011.
Former-ELL achievement gap - Although the
achievement gap between non-ELLs and former ELLs
performing at or above proficient decreased from 2005
to 2011, the change in the gap between these groups was
not statistically significant because of the small sample
size.
Exhibit 13. Percentage of grade 4 ELLs, non-ELLs, and former ELLs (NP) performing at or above proficient in NAEP reading
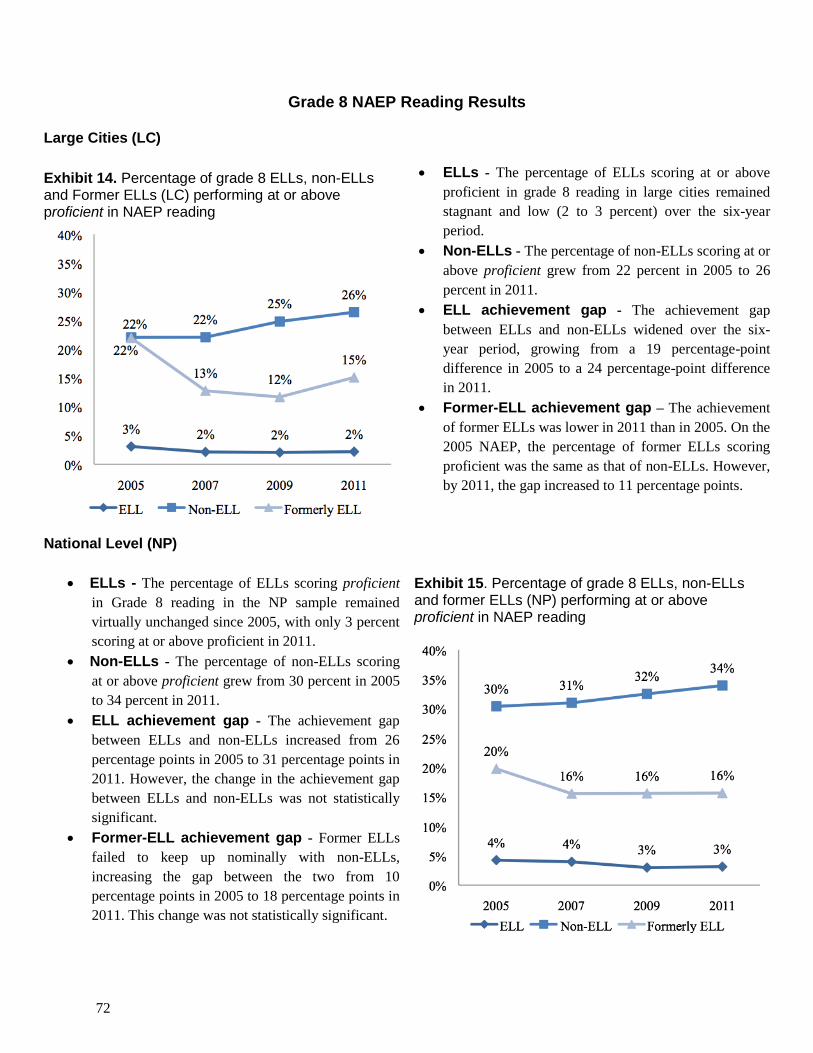
72
Grade 8 NAEP Reading Results
Large Cities (LC)
Exhibit 14. Percentage of grade 8 ELLs, non-ELLs and Former ELLs (LC) performing at or above proficient in NAEP reading
ELLs - The percentage of ELLs scoring at or above
proficient in grade 8 reading in large cities remained
stagnant and low (2 to 3 percent) over the six-year
period.
Non-ELLs - The percentage of non-ELLs scoring at or
above proficient grew from 22 percent in 2005 to 26
percent in 2011.
ELL achievement gap - The achievement gap
between ELLs and non-ELLs widened over the six-
year period, growing from a 19 percentage-point
difference in 2005 to a 24 percentage-point difference
in 2011.
Former-ELL achievement gap – The achievement
of former ELLs was lower in 2011 than in 2005. On the
2005 NAEP, the percentage of former ELLs scoring
proficient was the same as that of non-ELLs. However,
by 2011, the gap increased to 11 percentage points.
National Level (NP)
ELLs - The percentage of ELLs scoring proficient
in Grade 8 reading in the NP sample remained
virtually unchanged since 2005, with only 3 percent
scoring at or above proficient in 2011.
Non-ELLs - The percentage of non-ELLs scoring
at or above proficient grew from 30 percent in 2005
to 34 percent in 2011.
ELL achievement gap - The achievement gap
between ELLs and non-ELLs increased from 26
percentage points in 2005 to 31 percentage points in
2011. However, the change in the achievement gap
between ELLs and non-ELLs was not statistically
significant.
Former-ELL achievement gap - Former ELLs
failed to keep up nominally with non-ELLs,
increasing the gap between the two from 10
percentage points in 2005 to 18 percentage points in
2011. This change was not statistically significant.
Exhibit 15. Percentage of grade 8 ELLs, non-ELLs and former ELLs (NP) performing at or above proficient in NAEP reading
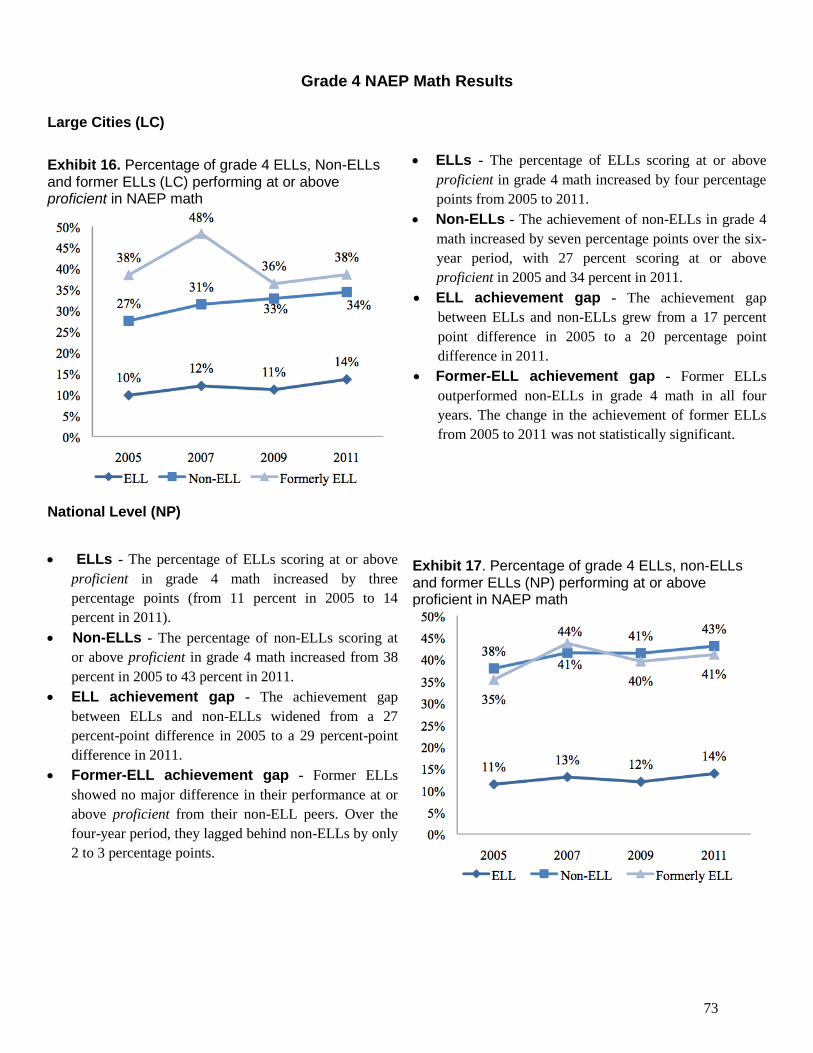
Draft
73
Grade 4 NAEP Math Results
Large Cities (LC)
Exhibit 16. Percentage of grade 4 ELLs, Non-ELLs and former ELLs (LC) performing at or above proficient in NAEP math
ELLs - The percentage of ELLs scoring at or above
proficient in grade 4 math increased by four percentage
points from 2005 to 2011.
Non-ELLs - The achievement of non-ELLs in grade 4
math increased by seven percentage points over the six-
year period, with 27 percent scoring at or above
proficient in 2005 and 34 percent in 2011.
ELL achievement gap - The achievement gap
between ELLs and non-ELLs grew from a 17 percent
point difference in 2005 to a 20 percentage point
difference in 2011.
Former-ELL achievement gap - Former ELLs
outperformed non-ELLs in grade 4 math in all four
years. The change in the achievement of former ELLs
from 2005 to 2011 was not statistically significant.
National Level (NP)
ELLs - The percentage of ELLs scoring at or above
proficient in grade 4 math increased by three
percentage points (from 11 percent in 2005 to 14
percent in 2011).
Non-ELLs - The percentage of non-ELLs scoring at
or above proficient in grade 4 math increased from 38
percent in 2005 to 43 percent in 2011.
ELL achievement gap - The achievement gap
between ELLs and non-ELLs widened from a 27
percent-point difference in 2005 to a 29 percent-point
difference in 2011.
Former-ELL achievement gap - Former ELLs
showed no major difference in their performance at or
above proficient from their non-ELL peers. Over the
four-year period, they lagged behind non-ELLs by only
2 to 3 percentage points.
Exhibit 17. Percentage of grade 4 ELLs, non-ELLs and former ELLs (NP) performing at or above proficient in NAEP math
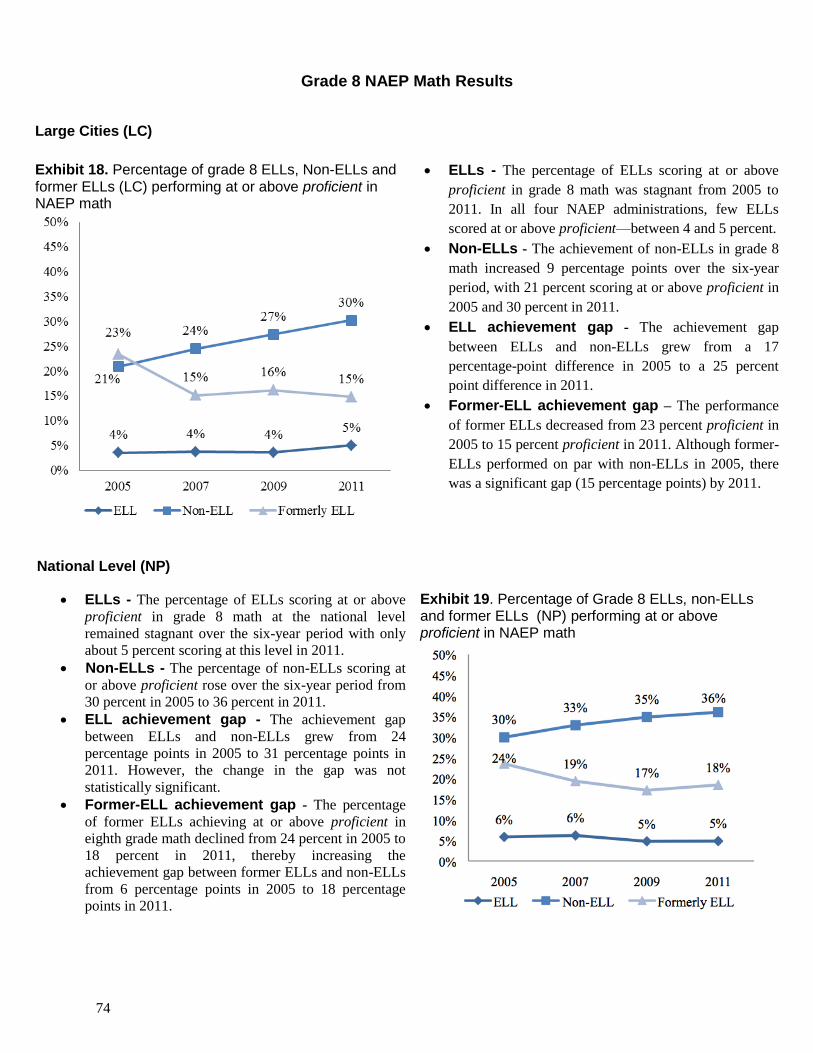
74
Grade 8 NAEP Math Results
Large Cities (LC)
Exhibit 18. Percentage of grade 8 ELLs, Non-ELLs and former ELLs (LC) performing at or above proficient in NAEP math
ELLs - The percentage of ELLs scoring at or above
proficient in grade 8 math was stagnant from 2005 to
2011. In all four NAEP administrations, few ELLs
scored at or above proficient—between 4 and 5 percent.
Non-ELLs - The achievement of non-ELLs in grade 8
math increased 9 percentage points over the six-year
period, with 21 percent scoring at or above proficient in
2005 and 30 percent in 2011.
ELL achievement gap - The achievement gap
between ELLs and non-ELLs grew from a 17
percentage-point difference in 2005 to a 25 percent
point difference in 2011.
Former-ELL achievement gap – The performance
of former ELLs decreased from 23 percent proficient in
2005 to 15 percent proficient in 2011. Although former-
ELLs performed on par with non-ELLs in 2005, there
was a significant gap (15 percentage points) by 2011.
National Level (NP)
ELLs - The percentage of ELLs scoring at or above
proficient in grade 8 math at the national level
remained stagnant over the six-year period with only
about 5 percent scoring at this level in 2011.
Non-ELLs - The percentage of non-ELLs scoring at
or above proficient rose over the six-year period from
30 percent in 2005 to 36 percent in 2011.
ELL achievement gap - The achievement gap
between ELLs and non-ELLs grew from 24
percentage points in 2005 to 31 percentage points in
2011. However, the change in the gap was not
statistically significant.
Former-ELL achievement gap - The percentage
of former ELLs achieving at or above proficient in
eighth grade math declined from 24 percent in 2005 to
18 percent in 2011, thereby increasing the
achievement gap between former ELLs and non-ELLs
from 6 percentage points in 2005 to 18 percentage
points in 2011.
Exhibit 19. Percentage of Grade 8 ELLs, non-ELLs and former ELLs (NP) performing at or above proficient in NAEP math
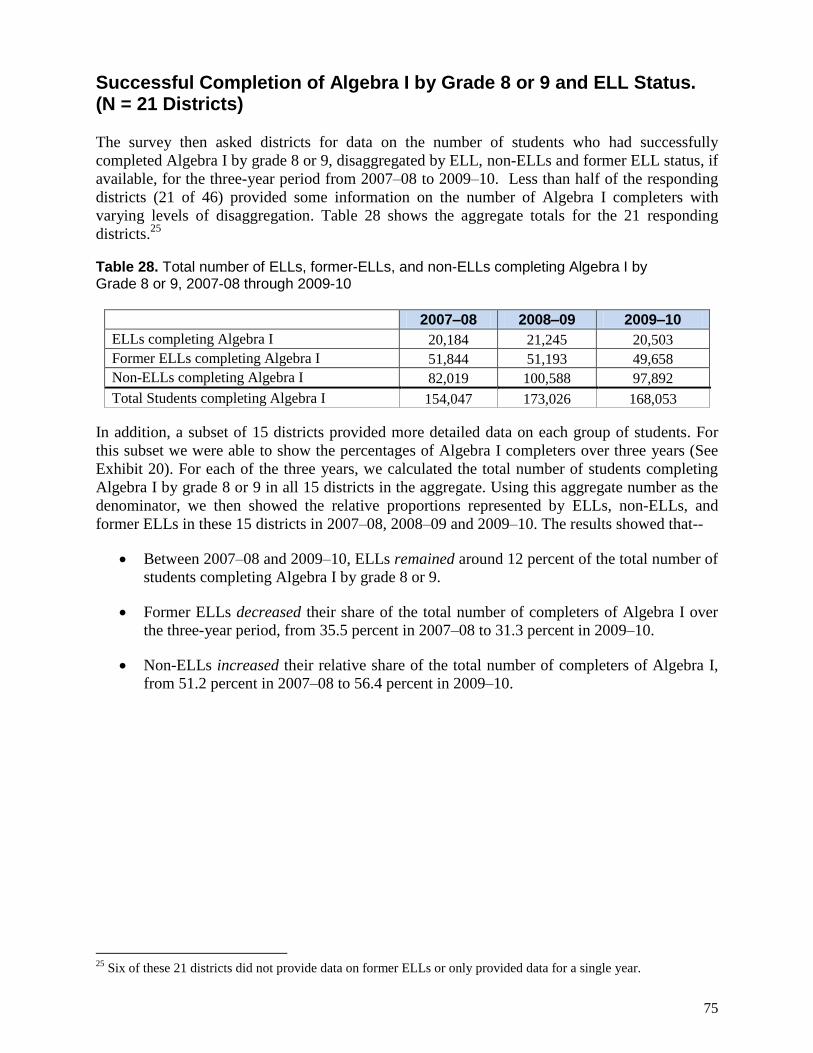
Draft
75
Successful Completion of Algebra I by Grade 8 or 9 and ELL Status. (N = 21 Districts)
The survey then asked districts for data on the number of students who had successfully
completed Algebra I by grade 8 or 9, disaggregated by ELL, non-ELLs and former ELL status, if
available, for the three-year period from 2007–08 to 2009–10. Less than half of the responding
districts (21 of 46) provided some information on the number of Algebra I completers with
varying levels of disaggregation. Table 28 shows the aggregate totals for the 21 responding
districts.25
Table 28. Total number of ELLs, former-ELLs, and non-ELLs completing Algebra I by Grade 8 or 9, 2007-08 through 2009-10
2007–08 2008–09 2009–10
ELLs completing Algebra I 20,184 21,245 20,503
Former ELLs completing Algebra I 51,844 51,193 49,658
Non-ELLs completing Algebra I 82,019 100,588 97,892
Total Students completing Algebra I 154,047 173,026 168,053
In addition, a subset of 15 districts provided more detailed data on each group of students. For
this subset we were able to show the percentages of Algebra I completers over three years (See
Exhibit 20). For each of the three years, we calculated the total number of students completing
Algebra I by grade 8 or 9 in all 15 districts in the aggregate. Using this aggregate number as the
denominator, we then showed the relative proportions represented by ELLs, non-ELLs, and
former ELLs in these 15 districts in 2007–08, 2008–09 and 2009–10. The results showed that--
Between 2007–08 and 2009–10, ELLs remained around 12 percent of the total number of
students completing Algebra I by grade 8 or 9.
Former ELLs decreased their share of the total number of completers of Algebra I over
the three-year period, from 35.5 percent in 2007–08 to 31.3 percent in 2009–10.
Non-ELLs increased their relative share of the total number of completers of Algebra I,
from 51.2 percent in 2007–08 to 56.4 percent in 2009–10.
25
Six of these 21 districts did not provide data on former ELLs or only provided data for a single year.
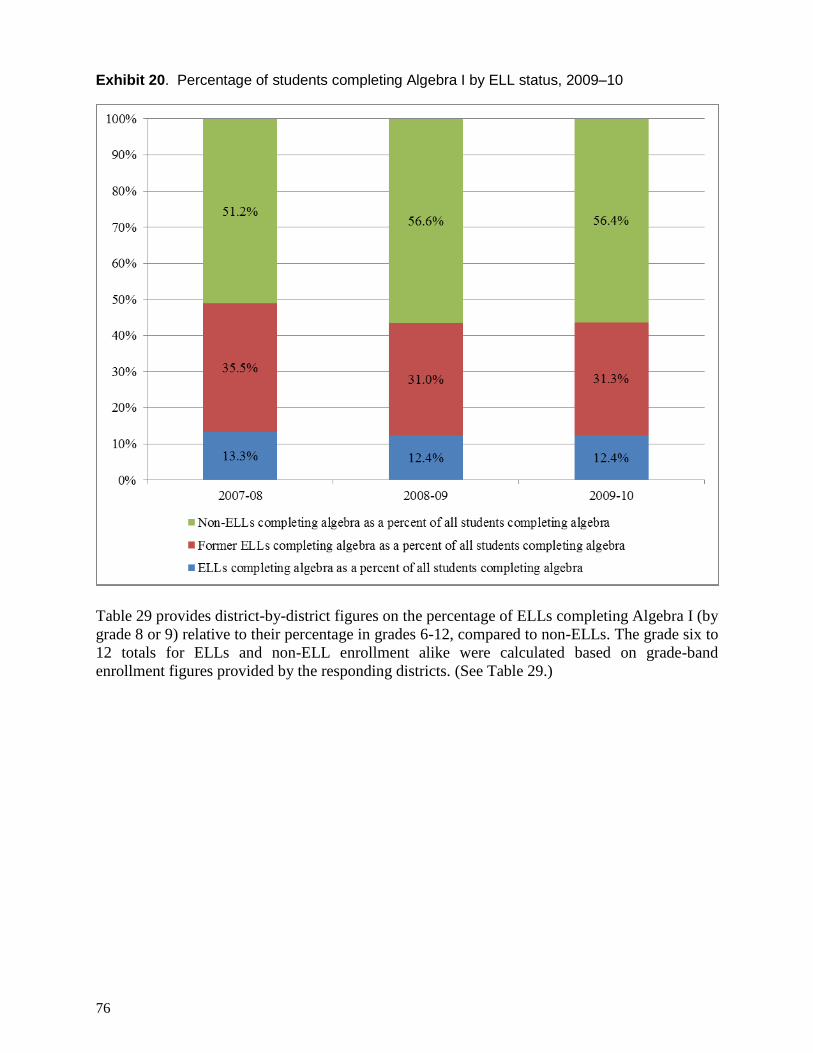
76
Exhibit 20. Percentage of students completing Algebra I by ELL status, 2009–10
Table 29 provides district-by-district figures on the percentage of ELLs completing Algebra I (by
grade 8 or 9) relative to their percentage in grades 6-12, compared to non-ELLs. The grade six to
12 totals for ELLs and non-ELL enrollment alike were calculated based on grade-band
enrollment figures provided by the responding districts. (See Table 29.)
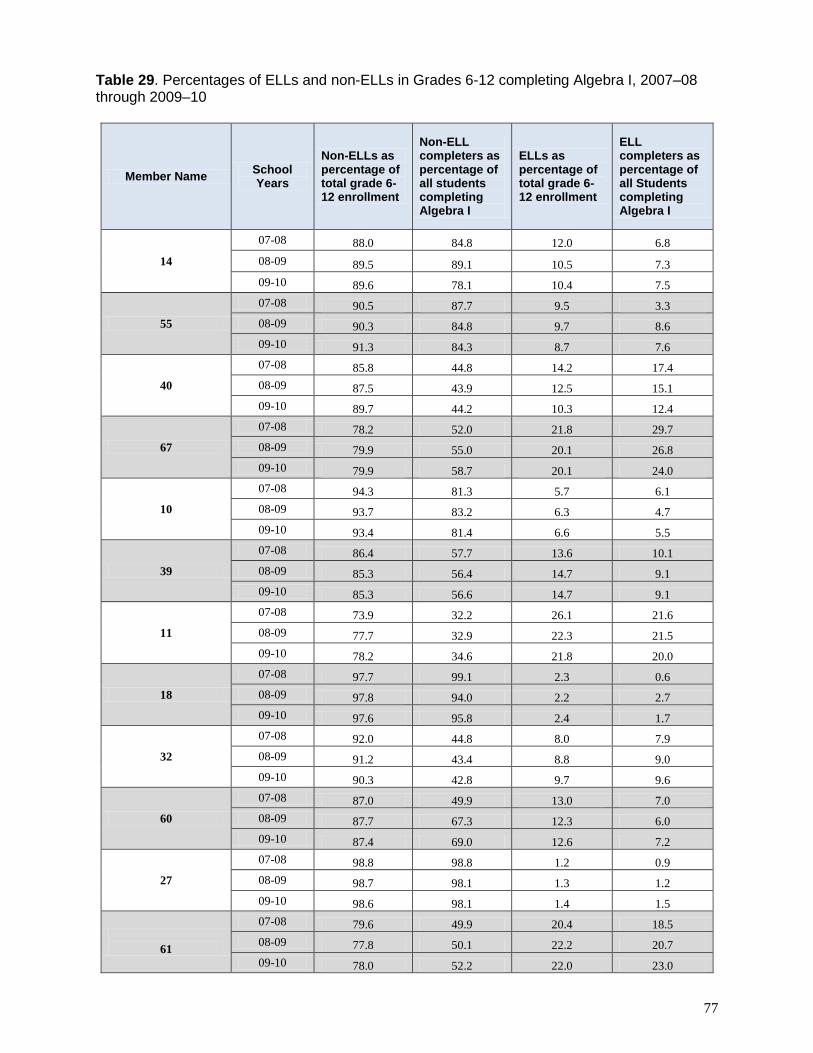
Draft
77
Table 29. Percentages of ELLs and non-ELLs in Grades 6-12 completing Algebra I, 2007–08 through 2009–10
Member Name School Years
Non-ELLs as percentage of total grade 6-12 enrollment
Non-ELL completers as percentage of all students completing Algebra I
ELLs as percentage of total grade 6-12 enrollment
ELL completers as percentage of all Students completing Algebra I
14
07-08 88.0 84.8 12.0 6.8
08-09 89.5 89.1 10.5 7.3
09-10 89.6 78.1 10.4 7.5
55
07-08 90.5 87.7 9.5 3.3
08-09 90.3 84.8 9.7 8.6
09-10 91.3 84.3 8.7 7.6
40
07-08 85.8 44.8 14.2 17.4
08-09 87.5 43.9 12.5 15.1
09-10 89.7 44.2 10.3 12.4
67
07-08 78.2 52.0 21.8 29.7
08-09 79.9 55.0 20.1 26.8
09-10 79.9 58.7 20.1 24.0
10
07-08 94.3 81.3 5.7 6.1
08-09 93.7 83.2 6.3 4.7
09-10 93.4 81.4 6.6 5.5
39
07-08 86.4 57.7 13.6 10.1
08-09 85.3 56.4 14.7 9.1
09-10 85.3 56.6 14.7 9.1
11
07-08 73.9 32.2 26.1 21.6
08-09 77.7 32.9 22.3 21.5
09-10 78.2 34.6 21.8 20.0
18
07-08 97.7 99.1 2.3 0.6
08-09 97.8 94.0 2.2 2.7
09-10 97.6 95.8 2.4 1.7
32
07-08 92.0 44.8 8.0 7.9
08-09 91.2 43.4 8.8 9.0
09-10 90.3 42.8 9.7 9.6
60
07-08 87.0 49.9 13.0 7.0
08-09 87.7 67.3 12.3 6.0
09-10 87.4 69.0 12.6 7.2
27
07-08 98.8 98.8 1.2 0.9
08-09 98.7 98.1 1.3 1.2
09-10 98.6 98.1 1.4 1.5
61
07-08 79.6 49.9 20.4 18.5
08-09 77.8 50.1 22.2 20.7
09-10 78.0 52.2 22.0 23.0
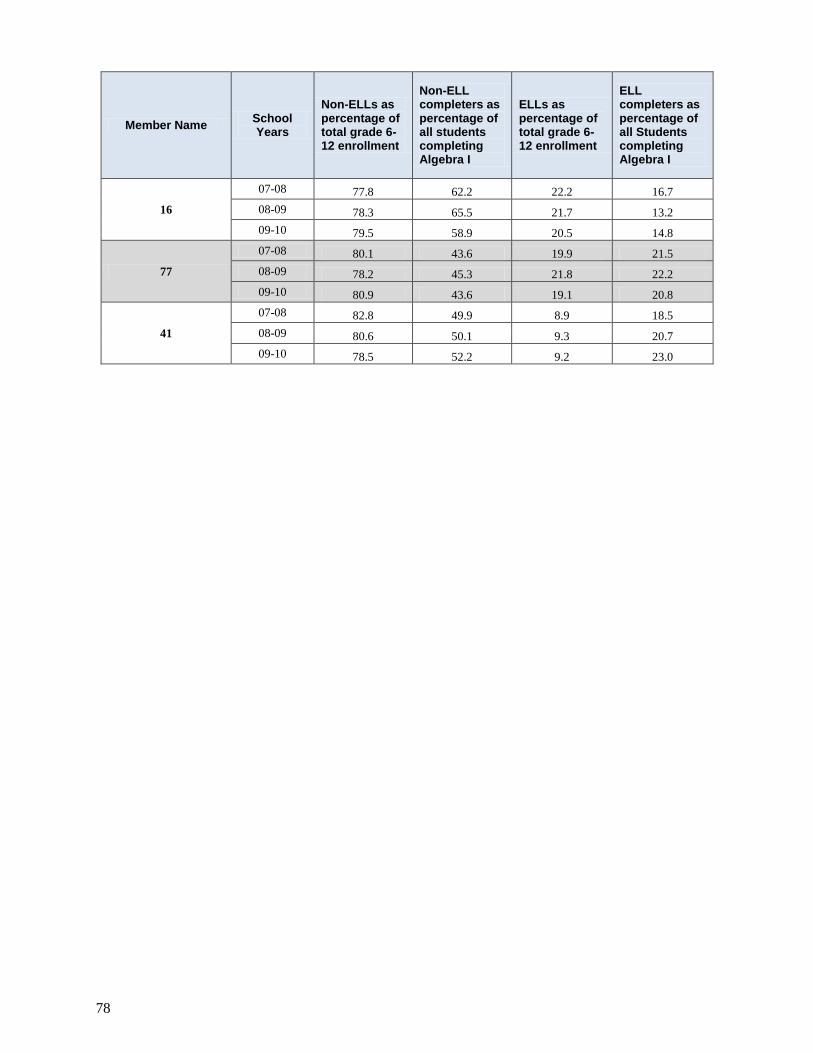
78
Member Name School Years
Non-ELLs as percentage of total grade 6-12 enrollment
Non-ELL completers as percentage of all students completing Algebra I
ELLs as percentage of total grade 6-12 enrollment
ELL completers as percentage of all Students completing Algebra I
16
07-08 77.8 62.2 22.2 16.7
08-09 78.3 65.5 21.7 13.2
09-10 79.5 58.9 20.5 14.8
77
07-08 80.1 43.6 19.9 21.5
08-09 78.2 45.3 21.8 22.2
09-10 80.9 43.6 19.1 20.8
41
07-08 82.8 49.9 8.9 18.5
08-09 80.6 50.1 9.3 20.7
09-10 78.5 52.2 9.2 23.0
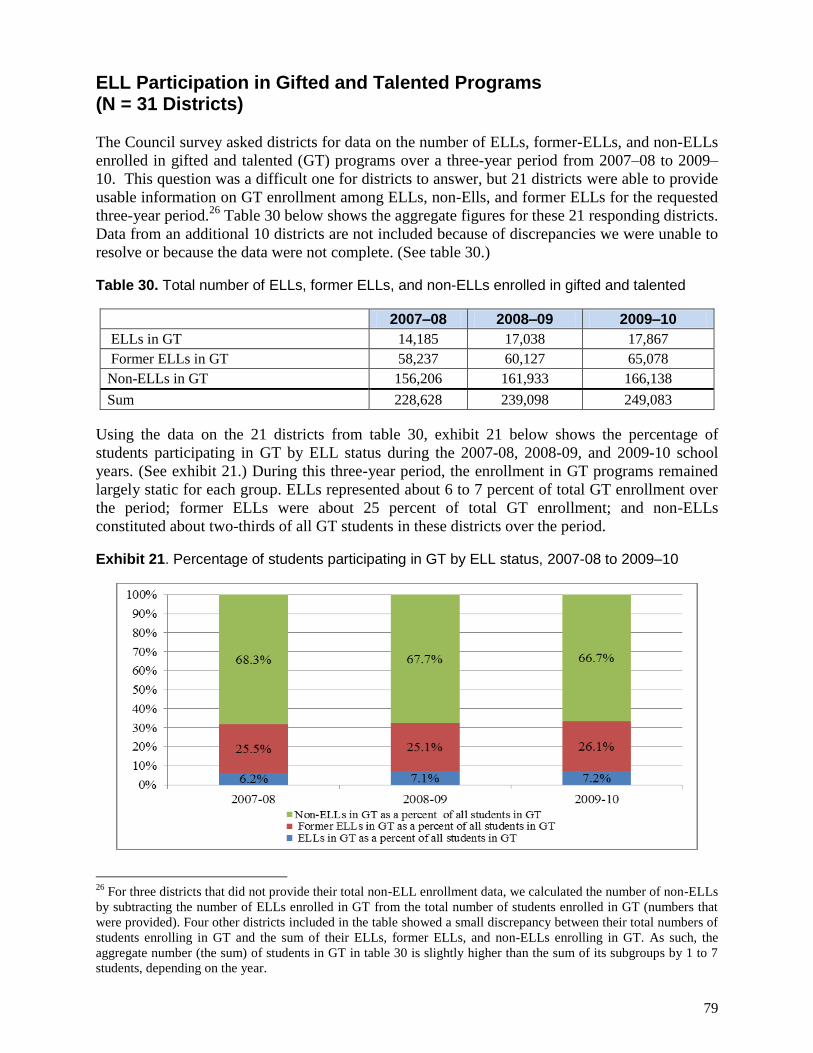
Draft
79
ELL Participation in Gifted and Talented Programs (N = 31 Districts)
The Council survey asked districts for data on the number of ELLs, former-ELLs, and non-ELLs
enrolled in gifted and talented (GT) programs over a three-year period from 2007–08 to 2009–
10. This question was a difficult one for districts to answer, but 21 districts were able to provide
usable information on GT enrollment among ELLs, non-Ells, and former ELLs for the requested
three-year period.26
Table 30 below shows the aggregate figures for these 21 responding districts.
Data from an additional 10 districts are not included because of discrepancies we were unable to
resolve or because the data were not complete. (See table 30.)
Table 30. Total number of ELLs, former ELLs, and non-ELLs enrolled in gifted and talented
2007–08 2008–09 2009–10
ELLs in GT 14,185 17,038 17,867
Former ELLs in GT 58,237 60,127 65,078
Non-ELLs in GT 156,206 161,933 166,138
Sum 228,628 239,098 249,083
Using the data on the 21 districts from table 30, exhibit 21 below shows the percentage of
students participating in GT by ELL status during the 2007-08, 2008-09, and 2009-10 school
years. (See exhibit 21.) During this three-year period, the enrollment in GT programs remained
largely static for each group. ELLs represented about 6 to 7 percent of total GT enrollment over
the period; former ELLs were about 25 percent of total GT enrollment; and non-ELLs
constituted about two-thirds of all GT students in these districts over the period.
Exhibit 21. Percentage of students participating in GT by ELL status, 2007-08 to 2009–10
26
For three districts that did not provide their total non-ELL enrollment data, we calculated the number of non-ELLs
by subtracting the number of ELLs enrolled in GT from the total number of students enrolled in GT (numbers that
were provided). Four other districts included in the table showed a small discrepancy between their total numbers of
students enrolling in GT and the sum of their ELLs, former ELLs, and non-ELLs enrolling in GT. As such, the
aggregate number (the sum) of students in GT in table 30 is slightly higher than the sum of its subgroups by 1 to 7
students, depending on the year.
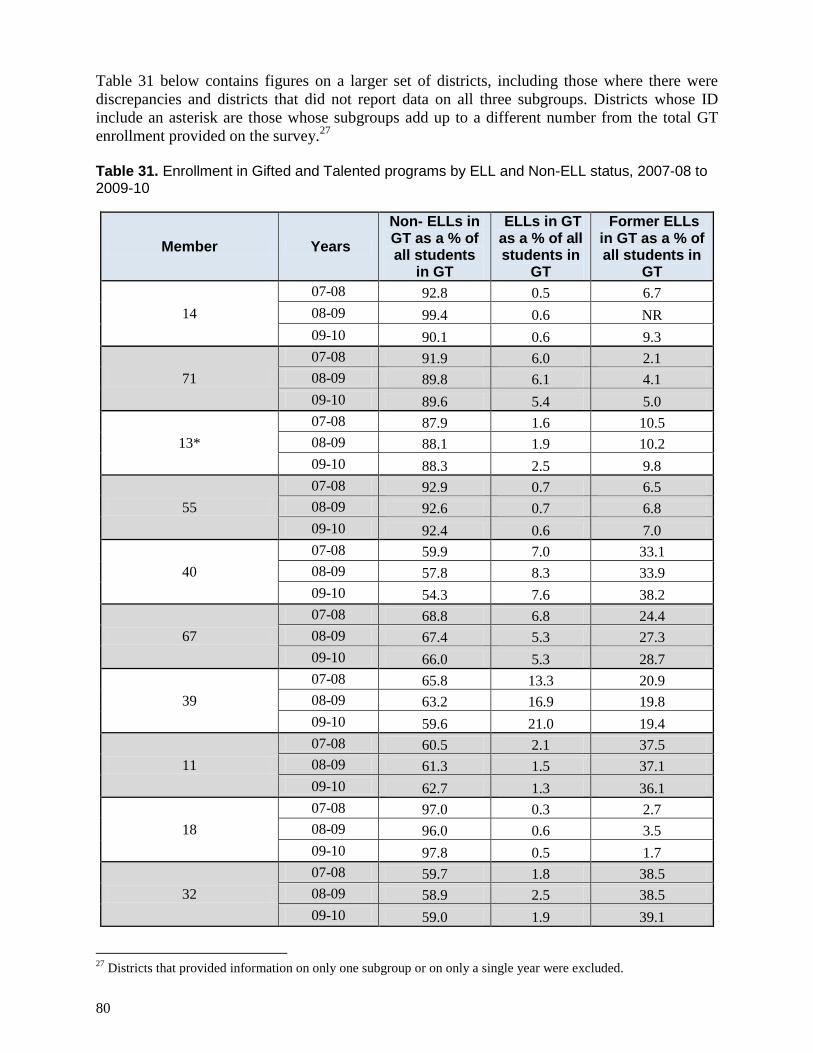
80
Table 31 below contains figures on a larger set of districts, including those where there were
discrepancies and districts that did not report data on all three subgroups. Districts whose ID
include an asterisk are those whose subgroups add up to a different number from the total GT
enrollment provided on the survey.27
Table 31. Enrollment in Gifted and Talented programs by ELL and Non-ELL status, 2007-08 to 2009-10
Member Years
Non- ELLs in GT as a % of all students
in GT
ELLs in GT as a % of all students in
GT
Former ELLs in GT as a % of all students in
GT
14
07-08 92.8 0.5 6.7
08-09 99.4 0.6 NR
09-10 90.1 0.6 9.3
71
07-08 91.9 6.0 2.1
08-09 89.8 6.1 4.1
09-10 89.6 5.4 5.0
13*
07-08 87.9 1.6 10.5
08-09 88.1 1.9 10.2
09-10 88.3 2.5 9.8
55
07-08 92.9 0.7 6.5
08-09 92.6 0.7 6.8
09-10 92.4 0.6 7.0
40
07-08 59.9 7.0 33.1
08-09 57.8 8.3 33.9
09-10 54.3 7.6 38.2
67
07-08 68.8 6.8 24.4
08-09 67.4 5.3 27.3
09-10 66.0 5.3 28.7
39
07-08 65.8 13.3 20.9
08-09 63.2 16.9 19.8
09-10 59.6 21.0 19.4
11
07-08 60.5 2.1 37.5
08-09 61.3 1.5 37.1
09-10 62.7 1.3 36.1
18
07-08 97.0 0.3 2.7
08-09 96.0 0.6 3.5
09-10 97.8 0.5 1.7
32
07-08 59.7 1.8 38.5
08-09 58.9 2.5 38.5
09-10 59.0 1.9 39.1
27
Districts that provided information on only one subgroup or on only a single year were excluded.
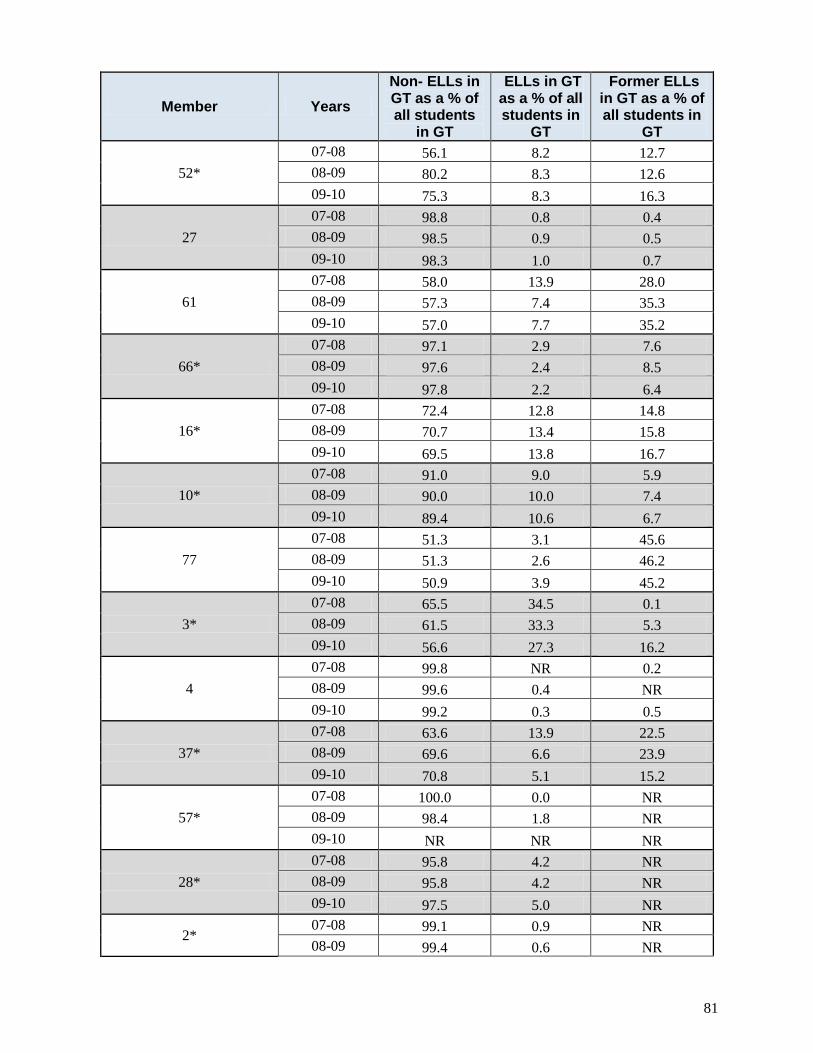
Draft
81
Member Years
Non- ELLs in GT as a % of all students
in GT
ELLs in GT as a % of all students in
GT
Former ELLs in GT as a % of all students in
GT
52*
07-08 56.1 8.2 12.7
08-09 80.2 8.3 12.6
09-10 75.3 8.3 16.3
27
07-08 98.8 0.8 0.4
08-09 98.5 0.9 0.5
09-10 98.3 1.0 0.7
61
07-08 58.0 13.9 28.0
08-09 57.3 7.4 35.3
09-10 57.0 7.7 35.2
66*
07-08 97.1 2.9 7.6
08-09 97.6 2.4 8.5
09-10 97.8 2.2 6.4
16*
07-08 72.4 12.8 14.8
08-09 70.7 13.4 15.8
09-10 69.5 13.8 16.7
10*
07-08 91.0 9.0 5.9
08-09 90.0 10.0 7.4
09-10 89.4 10.6 6.7
77
07-08 51.3 3.1 45.6
08-09 51.3 2.6 46.2
09-10 50.9 3.9 45.2
3*
07-08 65.5 34.5 0.1
08-09 61.5 33.3 5.3
09-10 56.6 27.3 16.2
4
07-08 99.8 NR 0.2
08-09 99.6 0.4 NR
09-10 99.2 0.3 0.5
37*
07-08 63.6 13.9 22.5
08-09 69.6 6.6 23.9
09-10 70.8 5.1 15.2
57*
07-08 100.0 0.0 NR
08-09 98.4 1.8 NR
09-10 NR NR NR
28*
07-08 95.8 4.2 NR
08-09 95.8 4.2 NR
09-10 97.5 5.0 NR
2* 07-08 99.1 0.9 NR
08-09 99.4 0.6 NR
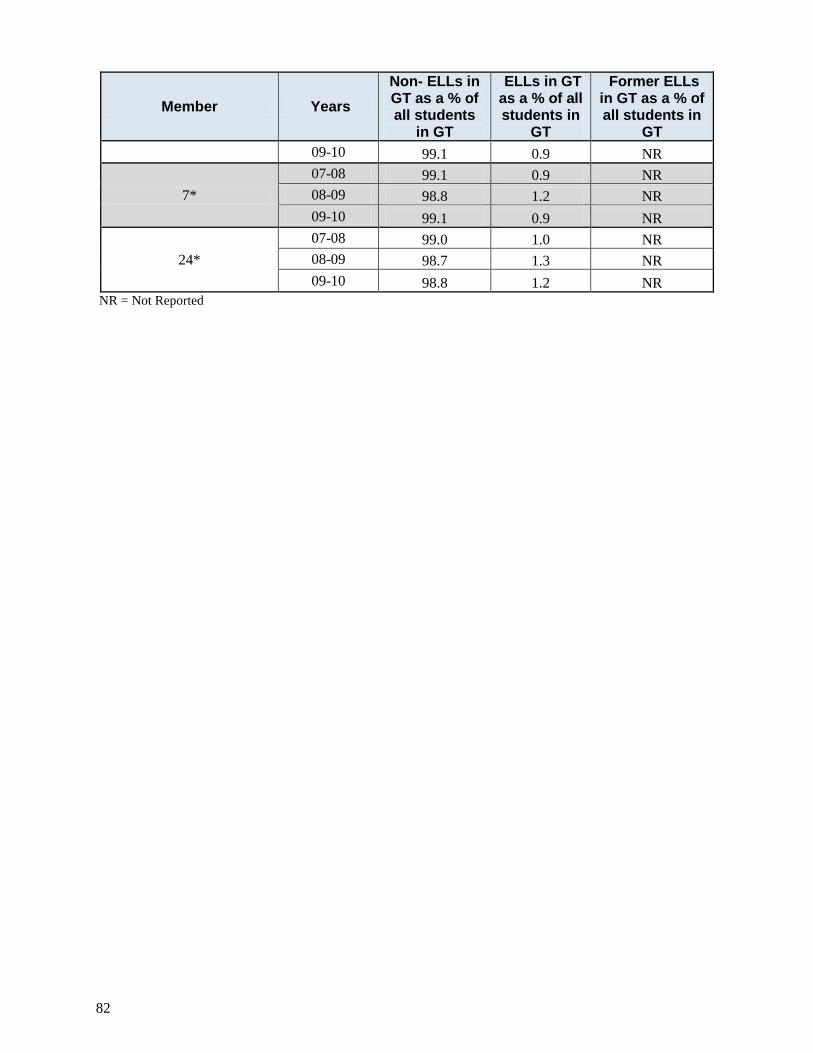
82
Member Years
Non- ELLs in GT as a % of all students
in GT
ELLs in GT as a % of all students in
GT
Former ELLs in GT as a % of all students in
GT
09-10 99.1 0.9 NR
7*
07-08 99.1 0.9 NR
08-09 98.8 1.2 NR
09-10 99.1 0.9 NR
24*
07-08 99.0 1.0 NR
08-09 98.7 1.3 NR
09-10 98.8 1.2 NR
NR = Not Reported
Draft
83
VII. Financial Information Sources of Funding for ELL Programs (N = 33 Districts)
Support for ELL instructional programs is provided through a variety of funding streams that
include state and local funds, and federal Title III funds. Under Title III of the ESEA, funds are
awarded via two grants: Bilingual education and immigrant education grants. Districts were
asked to report these funds as well as funding from state and local sources. According to the
Council estimates, the 65 member districts in the Council received an average of $150 million
annually in Title III funds over the three-year period between 2007–08 and 2009-10. About half
the member districts (33) provided financial information on their ELL programs.
Some 29 of the 33 responding districts reported their Title III allocations, which averaged
$75 million annually between 2007–08 and 2009–10.
Over the three-year period, the number of districts receiving Title III immigrant
education grants, which are awarded by SEAs to LEAs with large increases in immigrant
students, grew from 12 in 2007-08 to 17 in 2009-10. In 2007–08, 12 districts received
immigrant education funds totaling $4.5 million. By 2009-2010, the number of districts
had risen to 17, and the grants totaled $9 million.
A total of 17 districts reported receiving state funds to support their ELL programs. In the
aggregate, this state funding rose from $263 million in 2007–08 to $355 million in 2009–
10.
Only six districts reported providing local funds for ELL programs on top of their federal
and state funding. Local funding totaled $305 million in 2007–08 and $348 million in
2009–10.
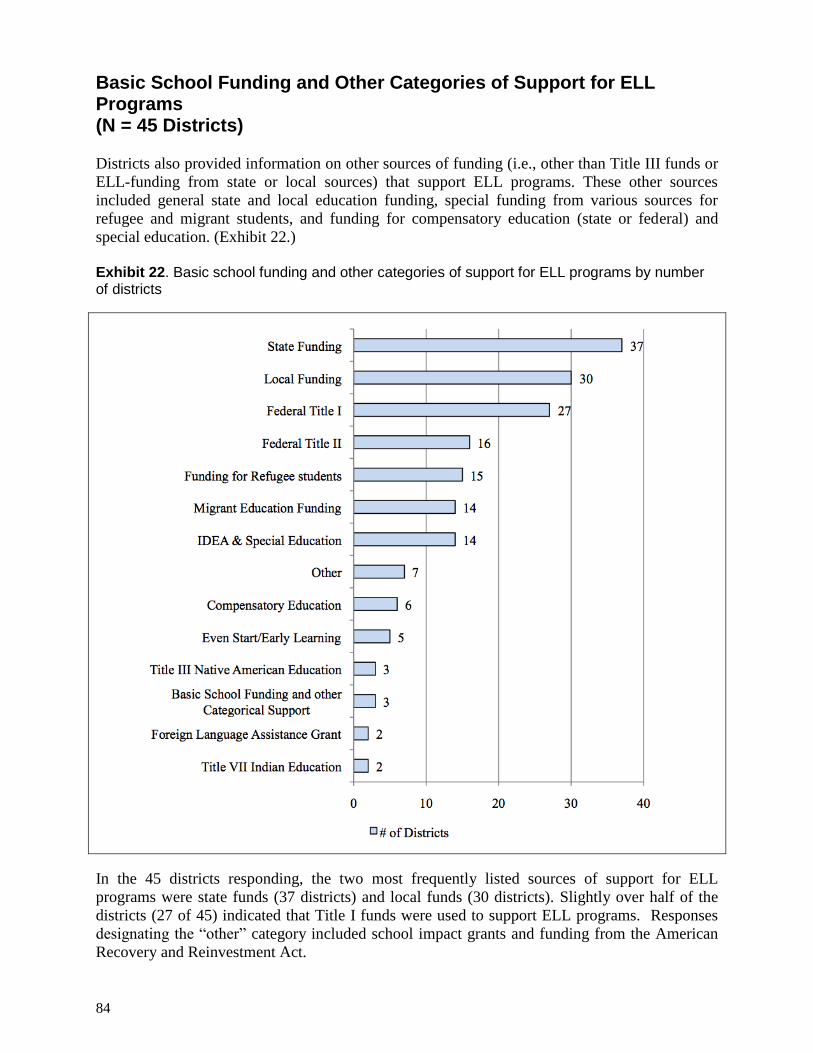
84
Basic School Funding and Other Categories of Support for ELL Programs (N = 45 Districts)
Districts also provided information on other sources of funding (i.e., other than Title III funds or
ELL-funding from state or local sources) that support ELL programs. These other sources
included general state and local education funding, special funding from various sources for
refugee and migrant students, and funding for compensatory education (state or federal) and
special education. (Exhibit 22.)
Exhibit 22. Basic school funding and other categories of support for ELL programs by number of districts
In the 45 districts responding, the two most frequently listed sources of support for ELL
programs were state funds (37 districts) and local funds (30 districts). Slightly over half of the
districts (27 of 45) indicated that Title I funds were used to support ELL programs. Responses
designating the “other” category included school impact grants and funding from the American
Recovery and Reinvestment Act.
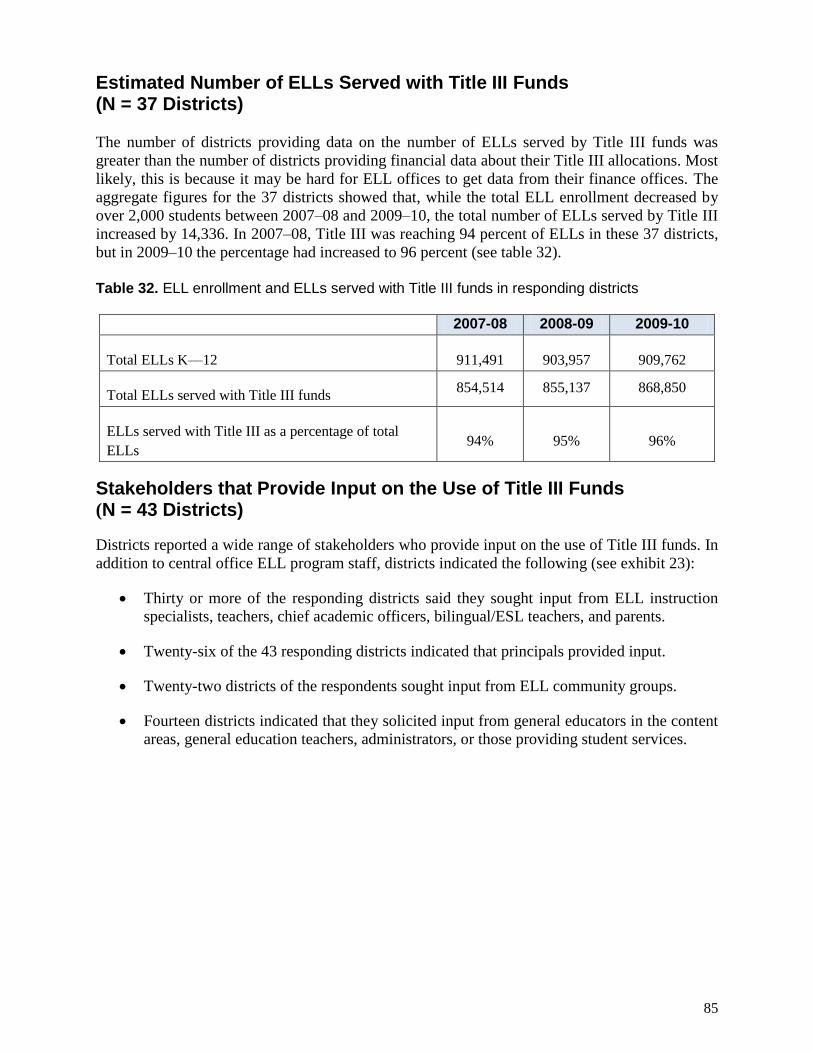
Draft
85
Estimated Number of ELLs Served with Title III Funds (N = 37 Districts)
The number of districts providing data on the number of ELLs served by Title III funds was
greater than the number of districts providing financial data about their Title III allocations. Most
likely, this is because it may be hard for ELL offices to get data from their finance offices. The
aggregate figures for the 37 districts showed that, while the total ELL enrollment decreased by
over 2,000 students between 2007–08 and 2009–10, the total number of ELLs served by Title III
increased by 14,336. In 2007–08, Title III was reaching 94 percent of ELLs in these 37 districts,
but in 2009–10 the percentage had increased to 96 percent (see table 32).
Table 32. ELL enrollment and ELLs served with Title III funds in responding districts
2007-08 2008-09 2009-10
Total ELLs K––12 911,491 903,957 909,762
Total ELLs served with Title III funds 854,514 855,137 868,850
ELLs served with Title III as a percentage of total
ELLs 94% 95% 96%
Stakeholders that Provide Input on the Use of Title III Funds (N = 43 Districts)
Districts reported a wide range of stakeholders who provide input on the use of Title III funds. In
addition to central office ELL program staff, districts indicated the following (see exhibit 23):
Thirty or more of the responding districts said they sought input from ELL instruction
specialists, teachers, chief academic officers, bilingual/ESL teachers, and parents.
Twenty-six of the 43 responding districts indicated that principals provided input.
Twenty-two districts of the respondents sought input from ELL community groups.
Fourteen districts indicated that they solicited input from general educators in the content
areas, general education teachers, administrators, or those providing student services.
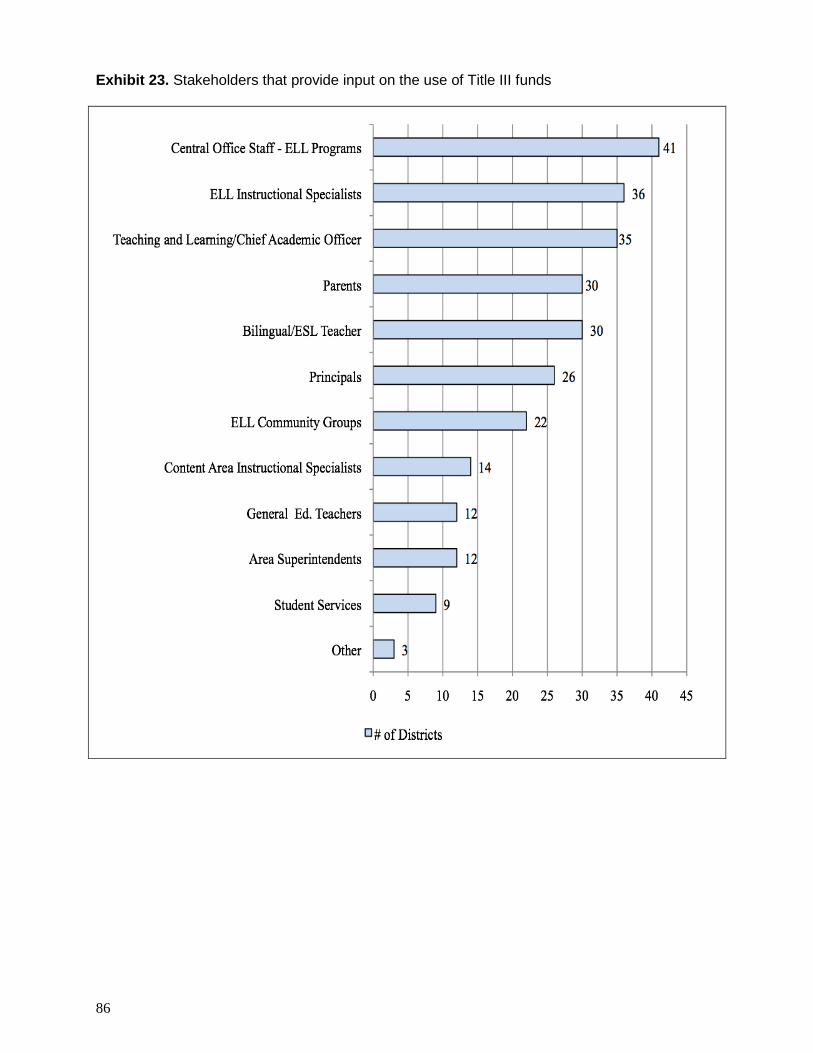
86
Exhibit 23. Stakeholders that provide input on the use of Title III funds
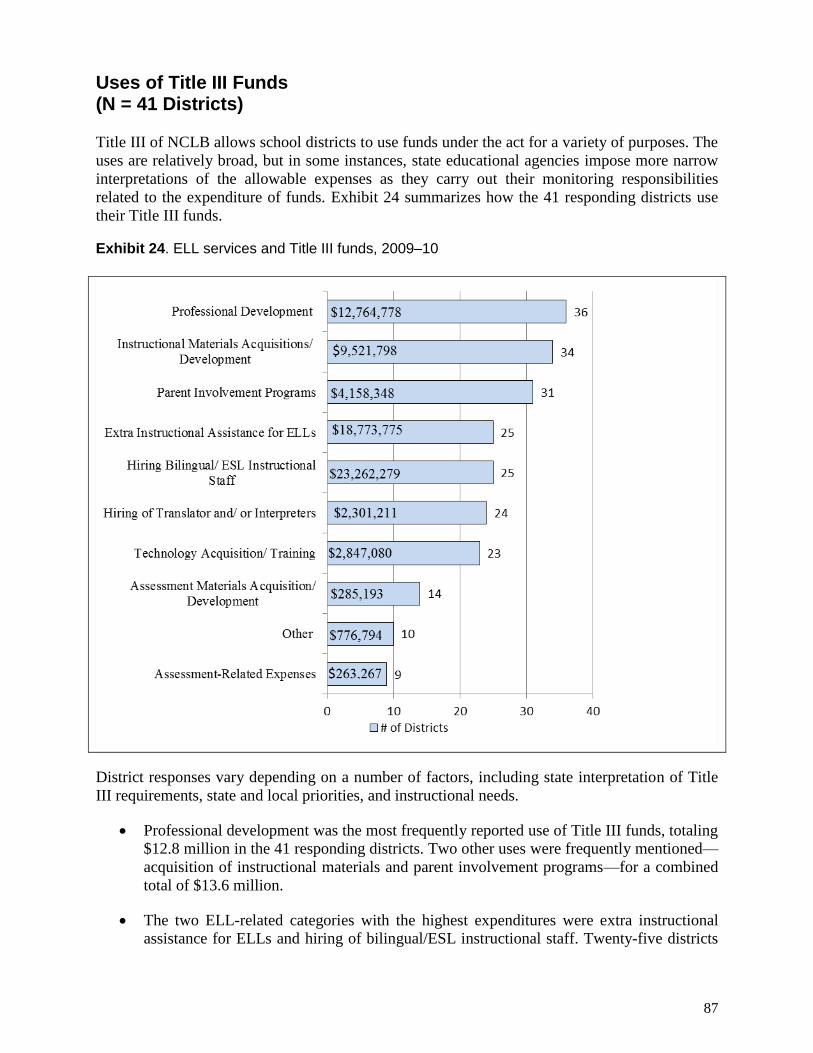
Draft
87
Uses of Title III Funds (N = 41 Districts)
Title III of NCLB allows school districts to use funds under the act for a variety of purposes. The
uses are relatively broad, but in some instances, state educational agencies impose more narrow
interpretations of the allowable expenses as they carry out their monitoring responsibilities
related to the expenditure of funds. Exhibit 24 summarizes how the 41 responding districts use
their Title III funds.
Exhibit 24. ELL services and Title III funds, 2009–10
District responses vary depending on a number of factors, including state interpretation of Title
III requirements, state and local priorities, and instructional needs.
Professional development was the most frequently reported use of Title III funds, totaling
$12.8 million in the 41 responding districts. Two other uses were frequently mentioned—
acquisition of instructional materials and parent involvement programs—for a combined
total of $13.6 million.
The two ELL-related categories with the highest expenditures were extra instructional
assistance for ELLs and hiring of bilingual/ESL instructional staff. Twenty-five districts
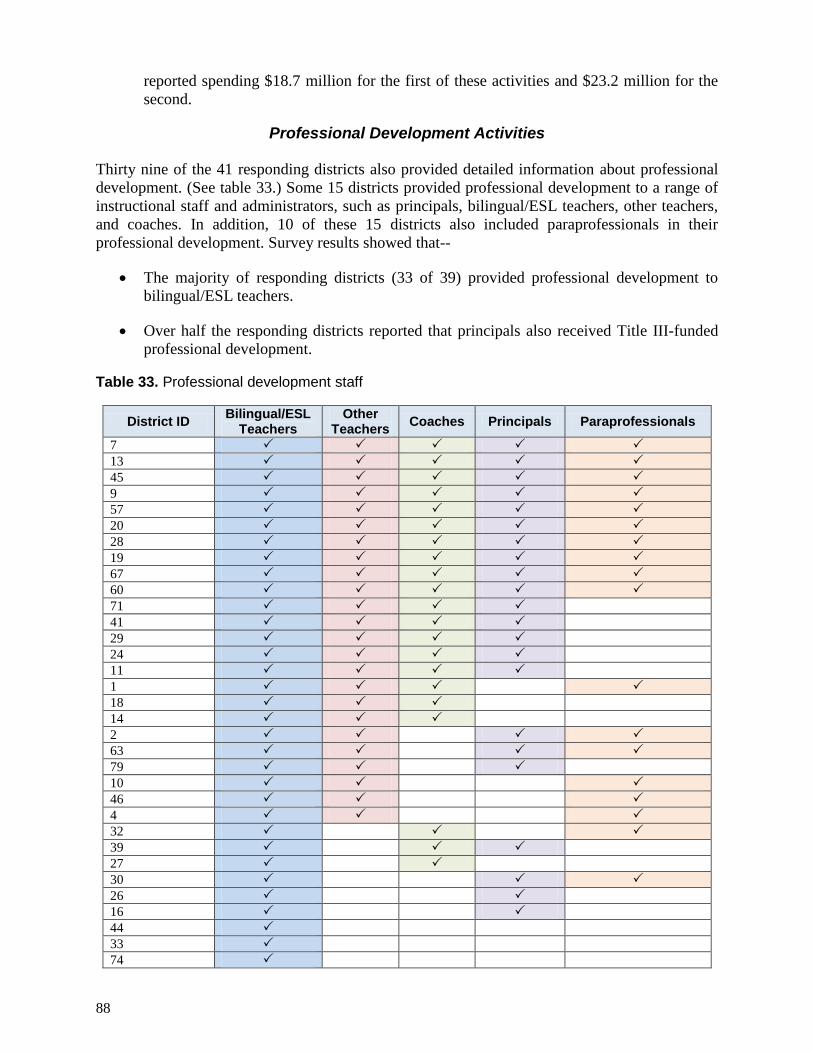
88
reported spending $18.7 million for the first of these activities and $23.2 million for the
second.
Professional Development Activities
Thirty nine of the 41 responding districts also provided detailed information about professional
development. (See table 33.) Some 15 districts provided professional development to a range of
instructional staff and administrators, such as principals, bilingual/ESL teachers, other teachers,
and coaches. In addition, 10 of these 15 districts also included paraprofessionals in their
professional development. Survey results showed that--
The majority of responding districts (33 of 39) provided professional development to
bilingual/ESL teachers.
Over half the responding districts reported that principals also received Title III-funded
professional development.
Table 33. Professional development staff
District ID Bilingual/ESL
Teachers Other
Teachers Coaches Principals Paraprofessionals
7
13
45
9
57
20
28
19
67
60
71
41
29
24
11
1
18
14
2
63
79
10
46
4
32
39
27
30
26
16
44
33
74
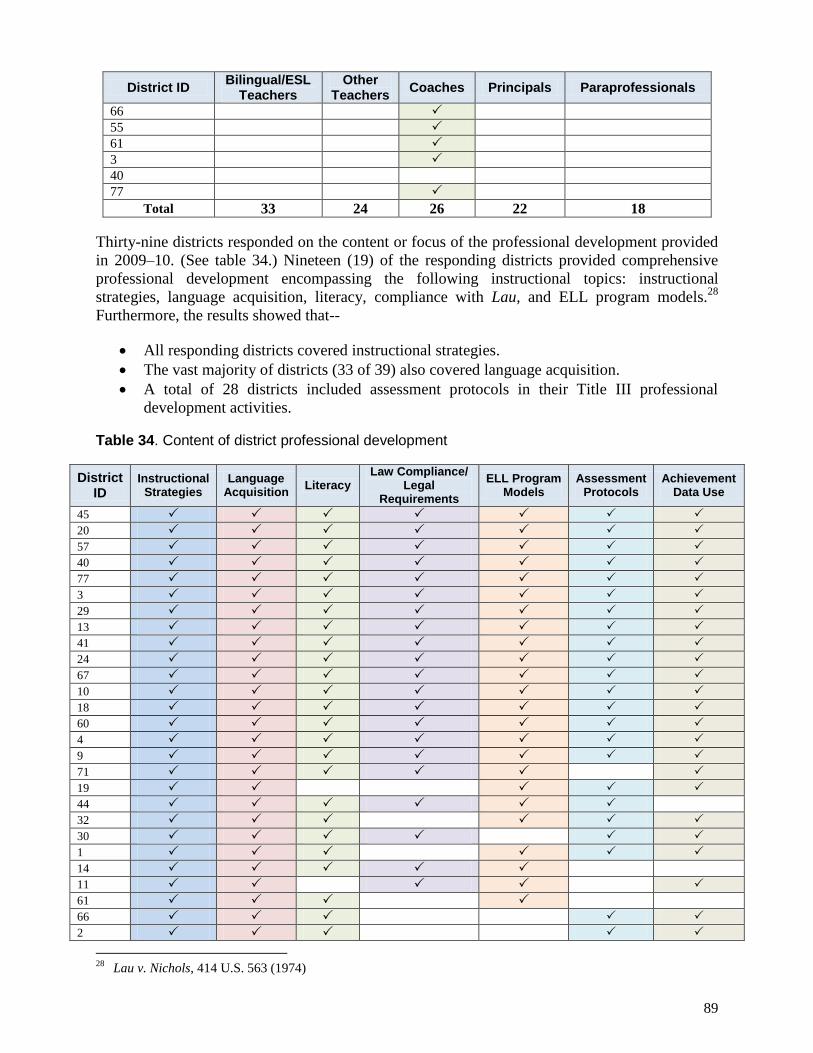
Draft
89
District ID Bilingual/ESL
Teachers Other
Teachers Coaches Principals Paraprofessionals
66
55
61
3
40
77
Total 33 24 26 22 18
Thirty-nine districts responded on the content or focus of the professional development provided
in 2009–10. (See table 34.) Nineteen (19) of the responding districts provided comprehensive
professional development encompassing the following instructional topics: instructional
strategies, language acquisition, literacy, compliance with Lau, and ELL program models.28
Furthermore, the results showed that--
All responding districts covered instructional strategies.
The vast majority of districts (33 of 39) also covered language acquisition.
A total of 28 districts included assessment protocols in their Title III professional
development activities.
Table 34. Content of district professional development
District ID
Instructional Strategies
Language Acquisition
Literacy Law Compliance/
Legal Requirements
ELL Program Models
Assessment Protocols
Achievement Data Use
45
20
57
40
77
3
29
13
41
24
67
10
18
60
4
9
71
19
44
32
30
1
14
11
61
66
2
28
Lau v. Nichols, 414 U.S. 563 (1974)
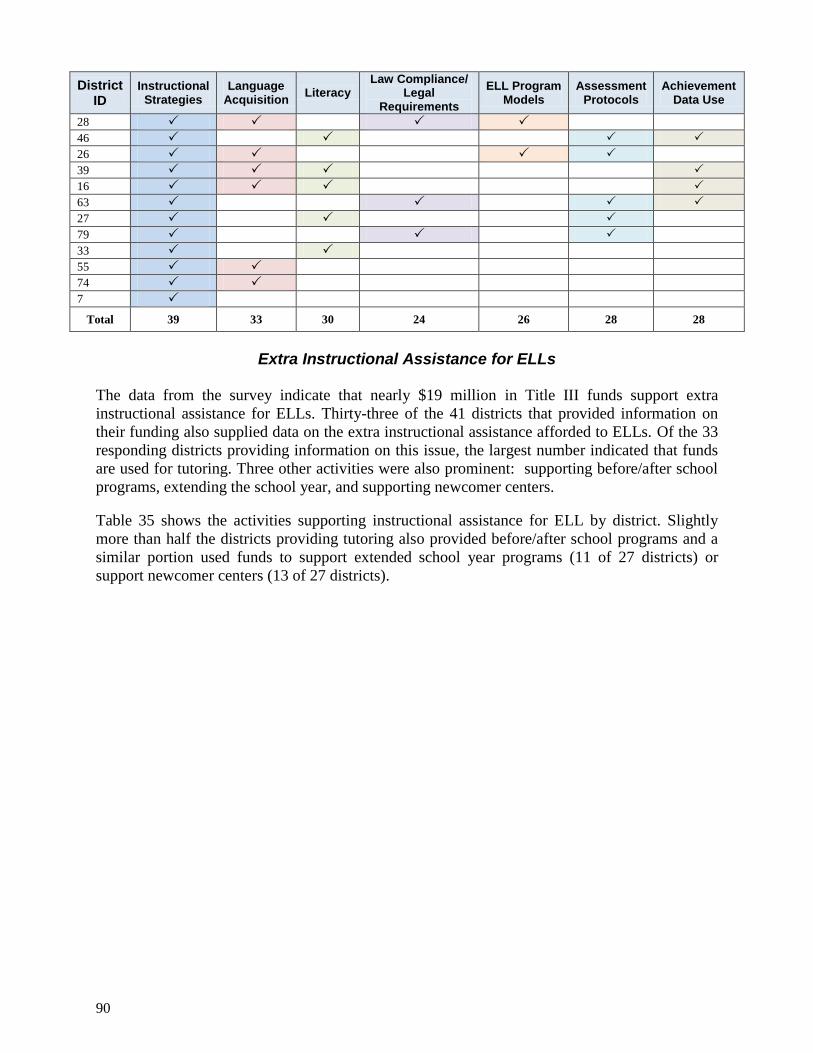
90
District ID
Instructional Strategies
Language Acquisition
Literacy Law Compliance/
Legal Requirements
ELL Program Models
Assessment Protocols
Achievement Data Use
28
46
26
39
16
63
27
79
33
55
74
7
Total 39 33 30 24 26 28 28
Extra Instructional Assistance for ELLs
The data from the survey indicate that nearly $19 million in Title III funds support extra
instructional assistance for ELLs. Thirty-three of the 41 districts that provided information on
their funding also supplied data on the extra instructional assistance afforded to ELLs. Of the 33
responding districts providing information on this issue, the largest number indicated that funds
are used for tutoring. Three other activities were also prominent: supporting before/after school
programs, extending the school year, and supporting newcomer centers.
Table 35 shows the activities supporting instructional assistance for ELL by district. Slightly
more than half the districts providing tutoring also provided before/after school programs and a
similar portion used funds to support extended school year programs (11 of 27 districts) or
support newcomer centers (13 of 27 districts).
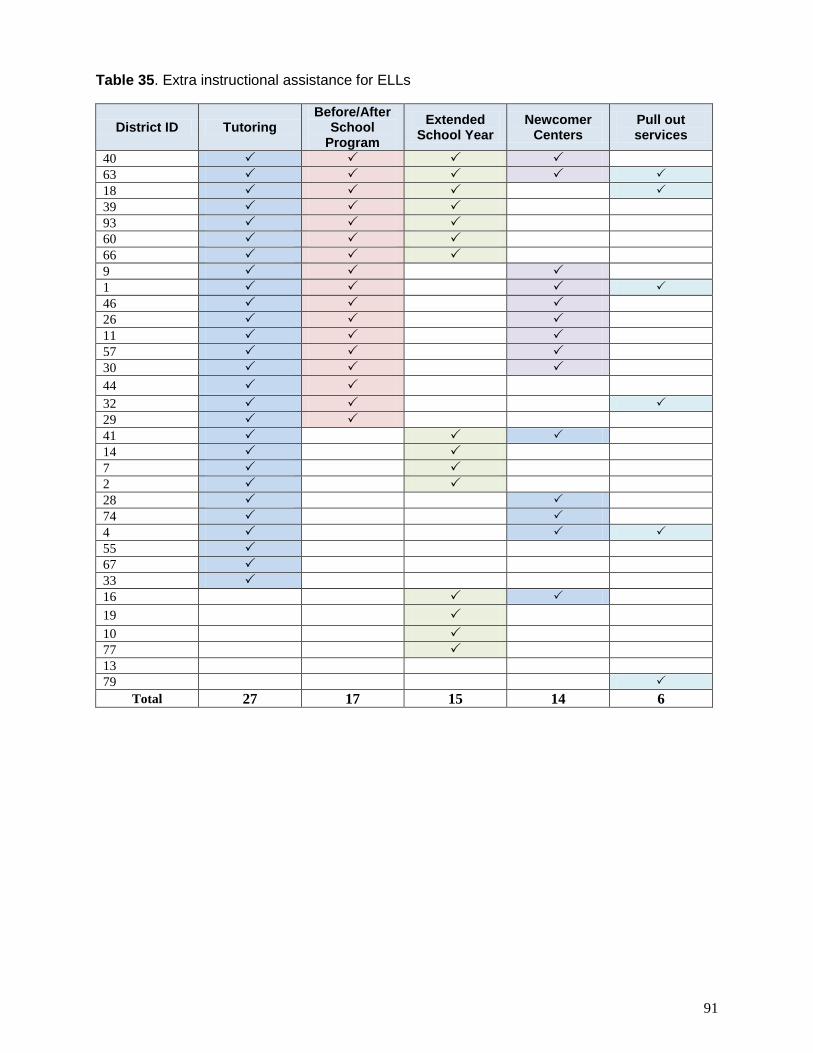
Draft
91
Table 35. Extra instructional assistance for ELLs
District ID Tutoring Before/After
School Program
Extended School Year
Newcomer Centers
Pull out services
40
63
18
39
93
60
66
9
1
46
26
11
57
30
44
32
29
41
14
7
2
28
74
4
55
67
33
16
19
10
77
13
79
Total 27 17 15 14 6
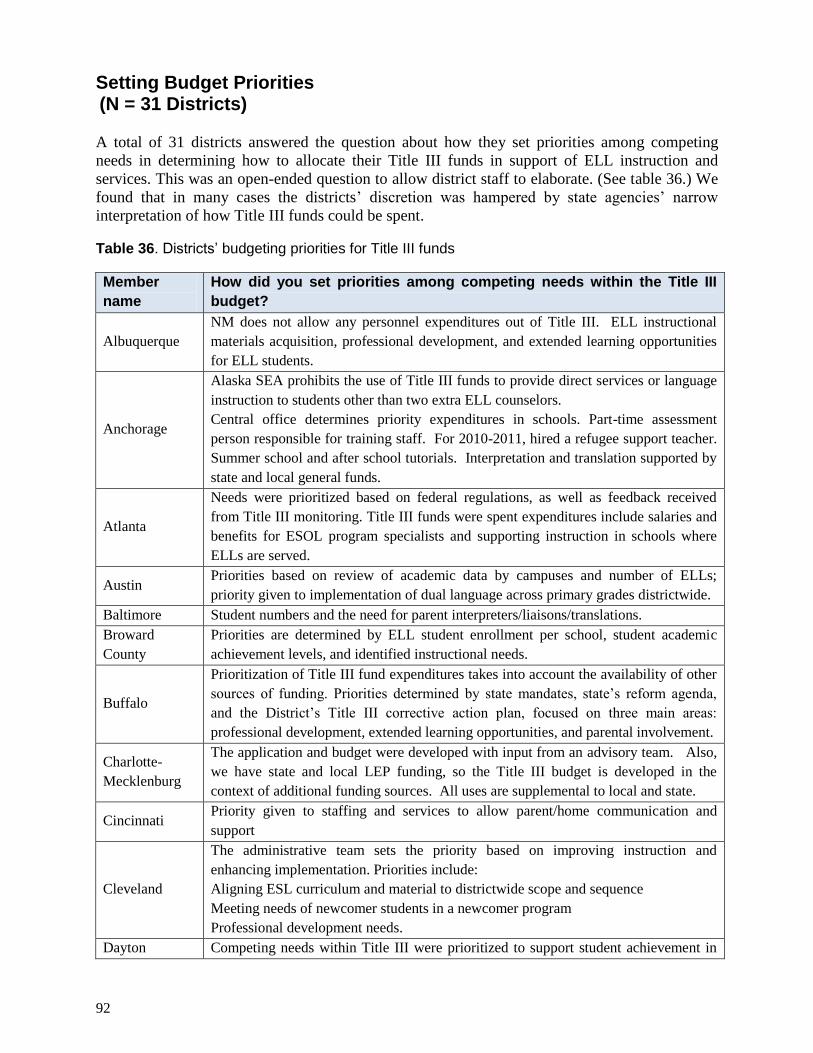
92
Setting Budget Priorities (N = 31 Districts)
A total of 31 districts answered the question about how they set priorities among competing
needs in determining how to allocate their Title III funds in support of ELL instruction and
services. This was an open-ended question to allow district staff to elaborate. (See table 36.) We
found that in many cases the districts’ discretion was hampered by state agencies’ narrow
interpretation of how Title III funds could be spent.
Table 36. Districts’ budgeting priorities for Title III funds
Member
name
How did you set priorities among competing needs within the Title III
budget?
Albuquerque
NM does not allow any personnel expenditures out of Title III. ELL instructional
materials acquisition, professional development, and extended learning opportunities
for ELL students.
Anchorage
Alaska SEA prohibits the use of Title III funds to provide direct services or language
instruction to students other than two extra ELL counselors.
Central office determines priority expenditures in schools. Part-time assessment
person responsible for training staff. For 2010-2011, hired a refugee support teacher.
Summer school and after school tutorials. Interpretation and translation supported by
state and local general funds.
Atlanta
Needs were prioritized based on federal regulations, as well as feedback received
from Title III monitoring. Title III funds were spent expenditures include salaries and
benefits for ESOL program specialists and supporting instruction in schools where
ELLs are served.
Austin Priorities based on review of academic data by campuses and number of ELLs;
priority given to implementation of dual language across primary grades districtwide.
Baltimore Student numbers and the need for parent interpreters/liaisons/translations.
Broward
County
Priorities are determined by ELL student enrollment per school, student academic
achievement levels, and identified instructional needs.
Buffalo
Prioritization of Title III fund expenditures takes into account the availability of other
sources of funding. Priorities determined by state mandates, state’s reform agenda,
and the District’s Title III corrective action plan, focused on three main areas:
professional development, extended learning opportunities, and parental involvement.
Charlotte-
Mecklenburg
The application and budget were developed with input from an advisory team. Also,
we have state and local LEP funding, so the Title III budget is developed in the
context of additional funding sources. All uses are supplemental to local and state.
Cincinnati Priority given to staffing and services to allow parent/home communication and
support
Cleveland
The administrative team sets the priority based on improving instruction and
enhancing implementation. Priorities include:
Aligning ESL curriculum and material to districtwide scope and sequence
Meeting needs of newcomer students in a newcomer program
Professional development needs.
Dayton Competing needs within Title III were prioritized to support student achievement in
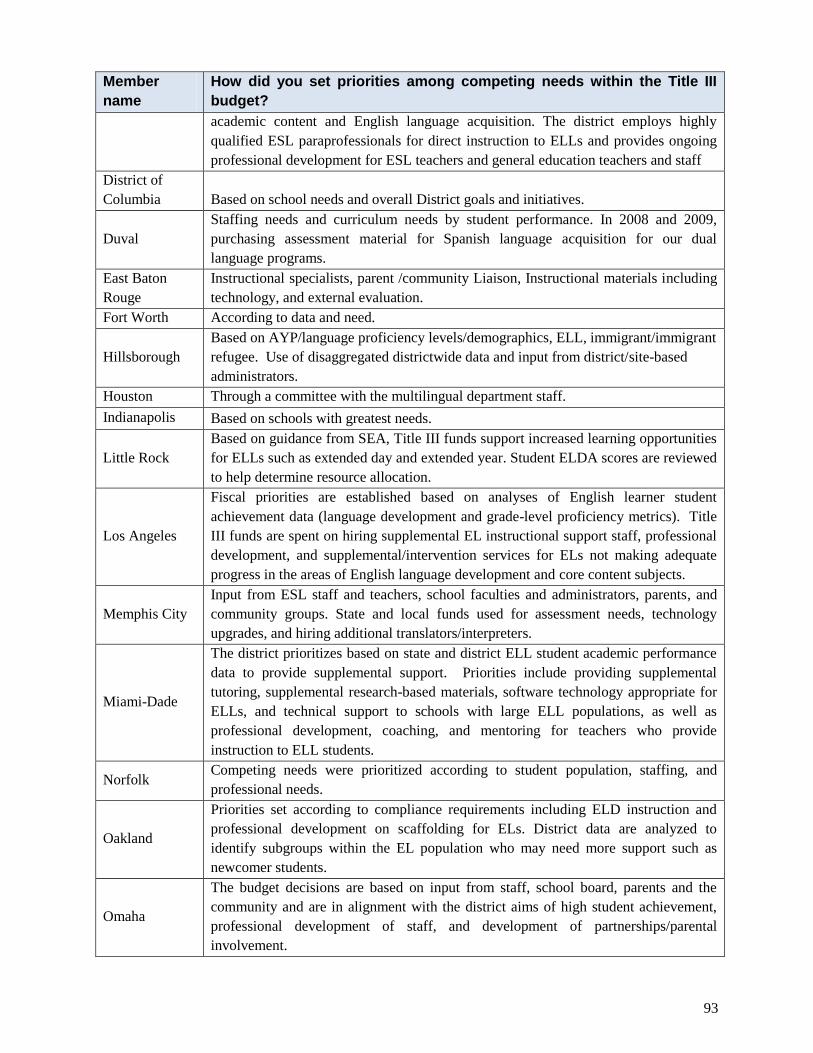
Draft
93
Member
name
How did you set priorities among competing needs within the Title III
budget?
academic content and English language acquisition. The district employs highly
qualified ESL paraprofessionals for direct instruction to ELLs and provides ongoing
professional development for ESL teachers and general education teachers and staff
District of
Columbia Based on school needs and overall District goals and initiatives.
Duval
Staffing needs and curriculum needs by student performance. In 2008 and 2009,
purchasing assessment material for Spanish language acquisition for our dual
language programs.
East Baton
Rouge
Instructional specialists, parent /community Liaison, Instructional materials including
technology, and external evaluation.
Fort Worth According to data and need.
Hillsborough
Based on AYP/language proficiency levels/demographics, ELL, immigrant/immigrant
refugee. Use of disaggregated districtwide data and input from district/site-based
administrators.
Houston Through a committee with the multilingual department staff.
Indianapolis Based on schools with greatest needs.
Little Rock
Based on guidance from SEA, Title III funds support increased learning opportunities
for ELLs such as extended day and extended year. Student ELDA scores are reviewed
to help determine resource allocation.
Los Angeles
Fiscal priorities are established based on analyses of English learner student
achievement data (language development and grade-level proficiency metrics). Title
III funds are spent on hiring supplemental EL instructional support staff, professional
development, and supplemental/intervention services for ELs not making adequate
progress in the areas of English language development and core content subjects.
Memphis City
Input from ESL staff and teachers, school faculties and administrators, parents, and
community groups. State and local funds used for assessment needs, technology
upgrades, and hiring additional translators/interpreters.
Miami-Dade
The district prioritizes based on state and district ELL student academic performance
data to provide supplemental support. Priorities include providing supplemental
tutoring, supplemental research-based materials, software technology appropriate for
ELLs, and technical support to schools with large ELL populations, as well as
professional development, coaching, and mentoring for teachers who provide
instruction to ELL students.
Norfolk Competing needs were prioritized according to student population, staffing, and
professional needs.
Oakland
Priorities set according to compliance requirements including ELD instruction and
professional development on scaffolding for ELs. District data are analyzed to
identify subgroups within the EL population who may need more support such as
newcomer students.
Omaha
The budget decisions are based on input from staff, school board, parents and the
community and are in alignment with the district aims of high student achievement,
professional development of staff, and development of partnerships/parental
involvement.
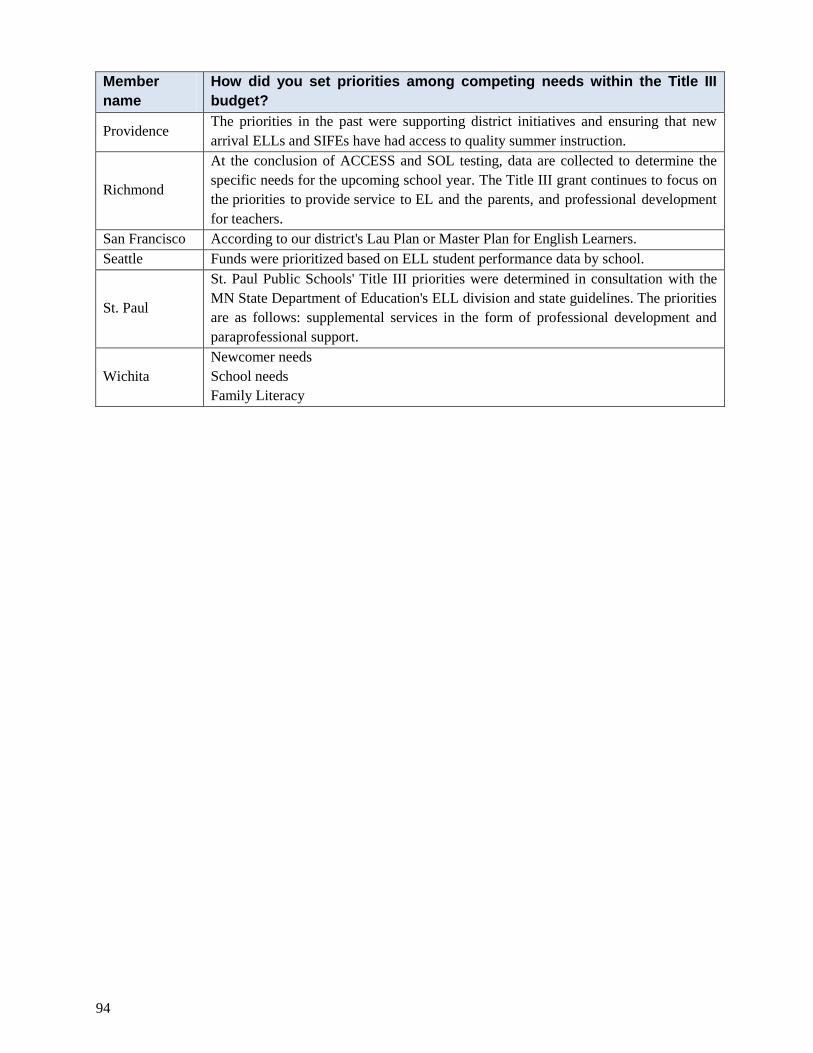
94
Member
name
How did you set priorities among competing needs within the Title III
budget?
Providence The priorities in the past were supporting district initiatives and ensuring that new
arrival ELLs and SIFEs have had access to quality summer instruction.
Richmond
At the conclusion of ACCESS and SOL testing, data are collected to determine the
specific needs for the upcoming school year. The Title III grant continues to focus on
the priorities to provide service to EL and the parents, and professional development
for teachers.
San Francisco According to our district's Lau Plan or Master Plan for English Learners.
Seattle Funds were prioritized based on ELL student performance data by school.
St. Paul
St. Paul Public Schools' Title III priorities were determined in consultation with the
MN State Department of Education's ELL division and state guidelines. The priorities
are as follows: supplemental services in the form of professional development and
paraprofessional support.
Wichita
Newcomer needs
School needs
Family Literacy
Draft
95
VIII. Conclusion
This report was based on an extensive survey of members of the Council of the Great City
Schools in 2012. The survey asked for detailed information on the numbers of English language
learners (ELLs) enrolled in each of our Great City School districts, the languages that the
students spoke, and the numbers of these students who also need special education services. The
report also contains new data on how ELLs are defined and identified and what their options are
for enrolling in instructional programs. Moreover, the survey asked for information on the
recruitment, hiring, and evaluation of teachers working with ELLs, as well as data on state
requirements for the credentialing and certification of teachers of ELL students.
This report also presents additional survey data on ELL teacher shortages and the distribution of
ELL staff. New information is presented on the sources of funding for ELL programs, the uses of
federal Title III funding, and the way budget priorities are set. Finally, the report presents new
analyses of NAEP performance data on ELLs, and offers a new look at Algebra I completion
rates and gifted and talented program participation rates among ELLs. In sum, the data in this
report are among the most comprehensive gathered on ELL students in the nation’s largest urban
school systems.
The results show that the overall counts of ELLs vary, depending on the sources used. In general,
the figures estimate that about five million English language learners attend school in grades
preK–12 in the United States and that the numbers are growing rapidly. Nationally,
approximately 24 percent of these students attend school in one of the Great City School
districts. In these districts, ELLs now account for about 17 percent of the total enrollment. In
addition, between 12 and 14 percent of ELLs are receiving special education services, about the
same participation rate of students generally. The numbers vary somewhat, depending on the
source of the data.
The data also show that five languages account for approximately 91.5 percent of all languages
spoken by ELLs enrolled in the Great City Schools: Spanish, Chinese, Haitian Creole, Hmong,
and Vietnamese. Los Angeles, New York City, Miami-Dade County, Dallas, and San Diego
enroll the largest numbers of Spanish-speaking ELLs. Ten responding cities have numbers of
ELLs that comprise 30 percent or more of their total enrollments.
In addition to the variation in defining what an ELL is, there is considerable difference from city
to city in the options that parents have for enrolling their children in language programs. This
variation is typically defined by state law or policy. Some policies allow parents to opt out of all
ELL services; other opt-out options apply solely to bilingual education or English as a second
language (ESL) services. In addition, some city school systems with opt-out requirements may
also have opt-in instruction. Other districts have options that are defined over and above the state
policies and guidelines.
Survey results also demonstrate that most responding urban school districts have a variety of
methods for identifying and recruiting teachers to work with ELLs. Methods include partnerships
with local colleges and universities, grow-your-own strategies, alternative certification efforts,
job fairs and international recruitment, and bilingual education conferences. Most districts used
multiple methods, and not quite half of the districts indicated that they were experiencing or
anticipated experiencing shortages of qualified teachers.
96
It was also interesting to note that most districts evaluate their ELL and ESL teachers on their
instruction of ELL students, but do not evaluate their general education teachers on ELL
instruction. Very few districts require professional development for the general education
teachers on ELL strategies. However, most of the responding districts are located in states that
require an ESL or ELD license, certification, or endorsement. Nonetheless, the data show that
teachers with such endorsements are not necessarily assigned to work with ELLs.
The district-reported data also showed that Council-members receive about $75 million in
federal Title III funds each year, in addition to state funding, to meet the language and academic
needs of these students. In addition, the responding districts are able to devote some local funds,
refugee aid, migrant education funding, IDEA, Title I, and Title VII Indian Education funding to
these students. Most Title III funds were devoted to professional development, the acquisition of
instructional materials, parent involvement efforts, instructional assistance, and hiring of
instructional staff and/or translators. Most professional development is given to bilingual or ESL
teachers, but some districts also provide training to general education teachers. Training typically
focuses on instructional strategies, language acquisition, literacy, legal requirements, ELL
program models, assessment protocols, and use of data. Extra instructional assistance typically
comes in the form of tutoring, before/after school programming, an extended school year,
newcomer centers, and pull-out services.
Finally, the report shows limited amounts of data on English language proficiency (ELP) results.
Most districts report English proficiency on five to six levels; others use four. English
proficiency varied considerably from one district to another, but the data were not comparable
because of differing tests, definitions, and cut-off scores. We also used National Assessment of
Educational Progress (NAEP) data on ELLs since there is a large city sample and data on
individual participating cities. The results showed wide gaps in reading and mathematics
between ELLs and non-ELLs. In addition, trend lines suggest that ELLs have not made
meaningful progress academically between 2005 and 2011, the most recent NAEP data points.
However, the data demonstrate that former ELLs do almost as well in reading and math as do
non-ELLs, suggesting that, once students emerge from programs, they can do well. Moreover,
disproportionately low numbers of ELLs participated in gifted and talented programs or
successfully completed Algebra I in the eighth or ninth grades.
The overall picture painted in the report suggests that there are numerous programs and activities
in place to improve the academic attainment of ELLs but that considerable work remains to bring
these students to parity with their non-ELL peers. The process of collecting data for this report
alone indicated that ELL staffing and programming was largely not well integrated with other
instructional initiatives, professional development activities, staffing, or funding. This lack of
integration is likely to exact a higher toll on students as the new, more rigorous common core
standards are put into place and expectations for performance rise. The Council of the Great City
Schools hopes that these data will serve as an important spur in ensuring that all our urban
students receive the instruction they need to be career and college ready.

Draft
97
IX. Appendices

98
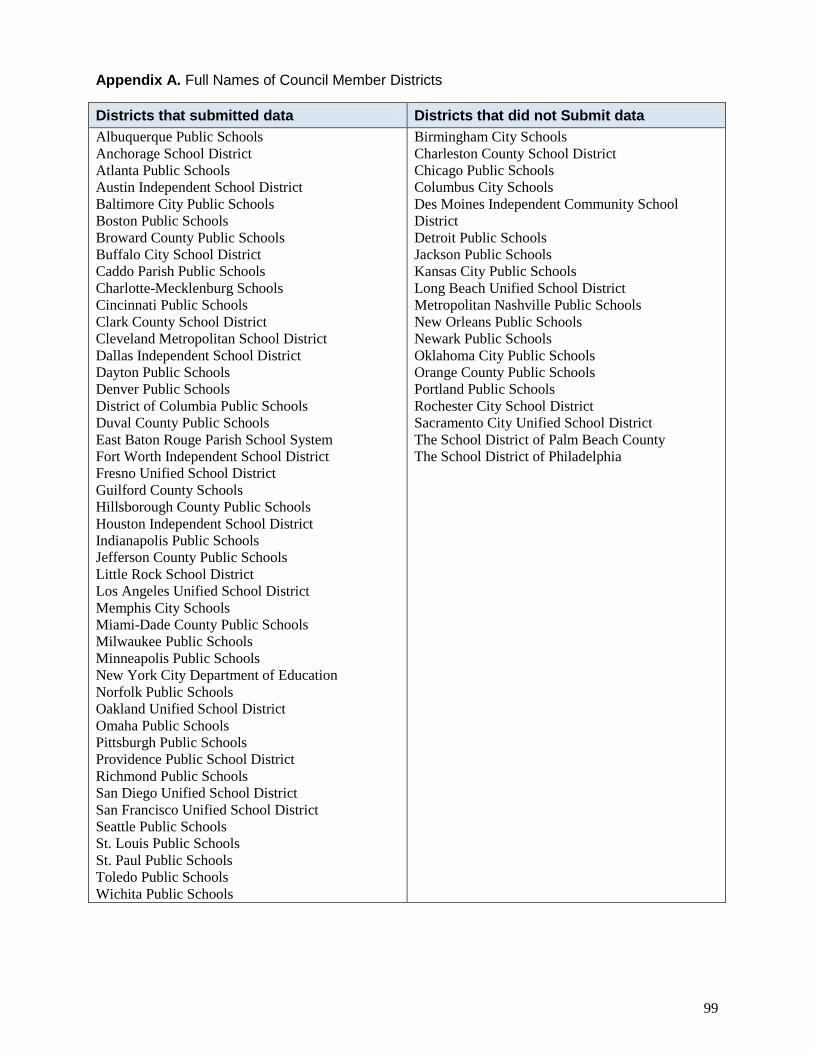
Draft
99
Appendix A. Full Names of Council Member Districts
Districts that submitted data Districts that did not Submit data
Albuquerque Public Schools
Anchorage School District
Atlanta Public Schools
Austin Independent School District
Baltimore City Public Schools
Boston Public Schools
Broward County Public Schools
Buffalo City School District
Caddo Parish Public Schools
Charlotte-Mecklenburg Schools
Cincinnati Public Schools
Clark County School District
Cleveland Metropolitan School District
Dallas Independent School District
Dayton Public Schools
Denver Public Schools
District of Columbia Public Schools
Duval County Public Schools
East Baton Rouge Parish School System
Fort Worth Independent School District
Fresno Unified School District
Guilford County Schools
Hillsborough County Public Schools
Houston Independent School District
Indianapolis Public Schools
Jefferson County Public Schools
Little Rock School District
Los Angeles Unified School District
Memphis City Schools
Miami-Dade County Public Schools
Milwaukee Public Schools
Minneapolis Public Schools
New York City Department of Education
Norfolk Public Schools
Oakland Unified School District
Omaha Public Schools
Pittsburgh Public Schools
Providence Public School District
Richmond Public Schools
San Diego Unified School District
San Francisco Unified School District
Seattle Public Schools
St. Louis Public Schools
St. Paul Public Schools
Toledo Public Schools
Wichita Public Schools
Birmingham City Schools
Charleston County School District
Chicago Public Schools
Columbus City Schools
Des Moines Independent Community School
District
Detroit Public Schools
Jackson Public Schools
Kansas City Public Schools
Long Beach Unified School District
Metropolitan Nashville Public Schools
New Orleans Public Schools
Newark Public Schools
Oklahoma City Public Schools
Orange County Public Schools
Portland Public Schools
Rochester City School District
Sacramento City Unified School District
The School District of Palm Beach County
The School District of Philadelphia
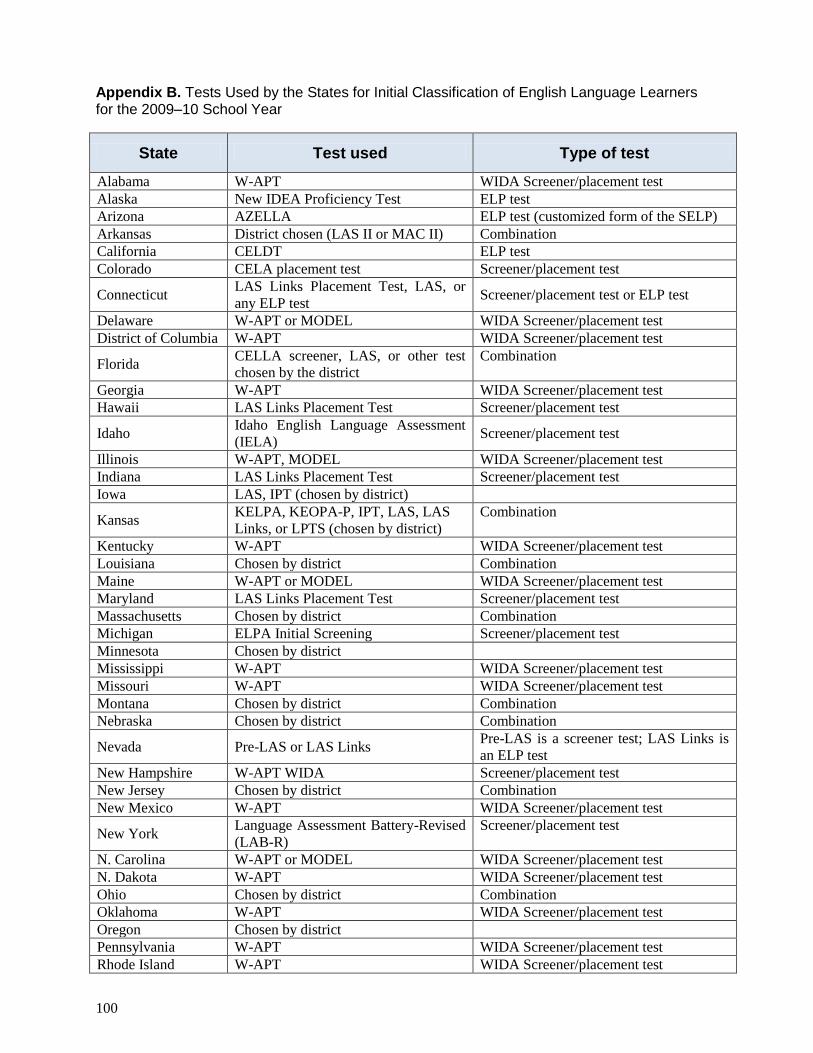
100
Appendix B. Tests Used by the States for Initial Classification of English Language Learners for the 2009–10 School Year
State Test used Type of test
Alabama W-APT WIDA Screener/placement test
Alaska New IDEA Proficiency Test ELP test
Arizona AZELLA ELP test (customized form of the SELP)
Arkansas District chosen (LAS II or MAC II) Combination
California CELDT ELP test
Colorado CELA placement test Screener/placement test
Connecticut LAS Links Placement Test, LAS, or
any ELP test Screener/placement test or ELP test
Delaware W-APT or MODEL WIDA Screener/placement test
District of Columbia W-APT WIDA Screener/placement test
Florida CELLA screener, LAS, or other test
chosen by the district
Combination
Georgia W-APT WIDA Screener/placement test
Hawaii LAS Links Placement Test Screener/placement test
Idaho Idaho English Language Assessment
(IELA) Screener/placement test
Illinois W-APT, MODEL WIDA Screener/placement test
Indiana LAS Links Placement Test Screener/placement test
Iowa LAS, IPT (chosen by district)
Kansas KELPA, KEOPA-P, IPT, LAS, LAS
Links, or LPTS (chosen by district)
Combination
Kentucky W-APT WIDA Screener/placement test
Louisiana Chosen by district Combination
Maine W-APT or MODEL WIDA Screener/placement test
Maryland LAS Links Placement Test Screener/placement test
Massachusetts Chosen by district Combination
Michigan ELPA Initial Screening Screener/placement test
Minnesota Chosen by district
Mississippi W-APT WIDA Screener/placement test
Missouri W-APT WIDA Screener/placement test
Montana Chosen by district Combination
Nebraska Chosen by district Combination
Nevada Pre-LAS or LAS Links Pre-LAS is a screener test; LAS Links is
an ELP test
New Hampshire W-APT WIDA Screener/placement test
New Jersey Chosen by district Combination
New Mexico W-APT WIDA Screener/placement test
New York Language Assessment Battery-Revised
(LAB-R)
Screener/placement test
N. Carolina W-APT or MODEL WIDA Screener/placement test
N. Dakota W-APT WIDA Screener/placement test
Ohio Chosen by district Combination
Oklahoma W-APT WIDA Screener/placement test
Oregon Chosen by district
Pennsylvania W-APT WIDA Screener/placement test
Rhode Island W-APT WIDA Screener/placement test
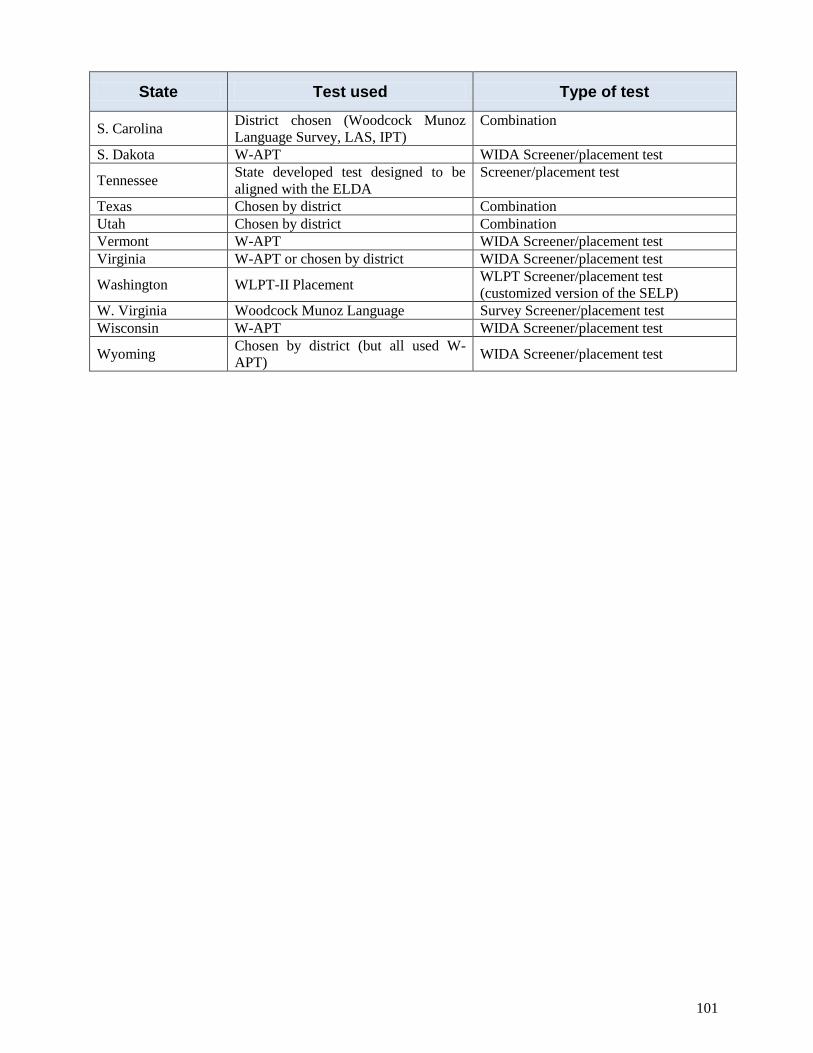
Draft
101
State Test used Type of test
S. Carolina District chosen (Woodcock Munoz
Language Survey, LAS, IPT)
Combination
S. Dakota W-APT WIDA Screener/placement test
Tennessee State developed test designed to be
aligned with the ELDA
Screener/placement test
Texas Chosen by district Combination
Utah Chosen by district Combination
Vermont W-APT WIDA Screener/placement test
Virginia W-APT or chosen by district WIDA Screener/placement test
Washington WLPT-II Placement WLPT Screener/placement test
(customized version of the SELP)
W. Virginia Woodcock Munoz Language Survey Screener/placement test
Wisconsin W-APT WIDA Screener/placement test
Wyoming Chosen by district (but all used W-
APT) WIDA Screener/placement test

102
Appendix C. English Language Proficiency Assessments by State, SY2009–10
State English language proficiency assessment
Alabama Accessing Comprehension and Communication in English State to State
(ACCESS)
Alaska IDEA Proficiency Test (IPT)
Arizona Arizona English Language Learner Assessment (AZELLA) (customized
version of the SELP)
Arkansas English Language Development Assessment (ELDA)
California California English Language Development Test (CELDT)
Colorado Colorado English Language Assessment (CELA) (customized version of LAS
Links)
Connecticut Language Assessment Scales Links (LAS Links)
Delaware ACCESS
District of
Columbia ACCESS
Florida Comprehensive English Language Learning Assessment (CELLA)
Georgia ACCESS
Hawaii ACCESS
Idaho Idaho English Language Assessment (IELA) (items drawn from MWAC item
bank)
Illinois ACCESS
Indiana LAS Links
Iowa ELDA
Kansas Kansas English Language Proficiency Assessment (KELPA)
Kentucky ACCESS
Louisiana ELDA
Maine ACCESS
Maryland LAS Links
Massachusetts Massachusetts English Proficiency Assessment-Reading and Writing (MEPA-
R/W) and Massachusetts English Language Assessment-Oral (MELA-O)
Michigan Michigan English Language Proficiency Assessment (MI-ELPA) (items
initially drawn from MWAC and SELP item banks)
Minnesota
K-2 Reading and Writing Checklist
Test of Emerging Academic English (TEAE) (grades 3-12)
Minnesota Modified Student Oral Language Observation Matrix (MN-
SOLOM) (grades K-12)
Mississippi ACCESS
Missouri ACCESS
Montana MontCAS English Language Proficiency Assessment (MontCAS ELP)
(adapted items from MWAC)
Nebraska ELDA
Nevada Nevada State English Language Proficiency Assessment (NV-ELPA)
New Hampshire ACCESS
New Jersey ACCESS
New Mexico ACCESS
New York New York State English as a Second Language Achievement Test
(NYSESLAT) (items initially drawn from SELP item bank)
N. Carolina ACCESS
N. Dakota ACCESS
Ohio Ohio Test of Language Acquisition (OTELA) (modified version of ELDA)
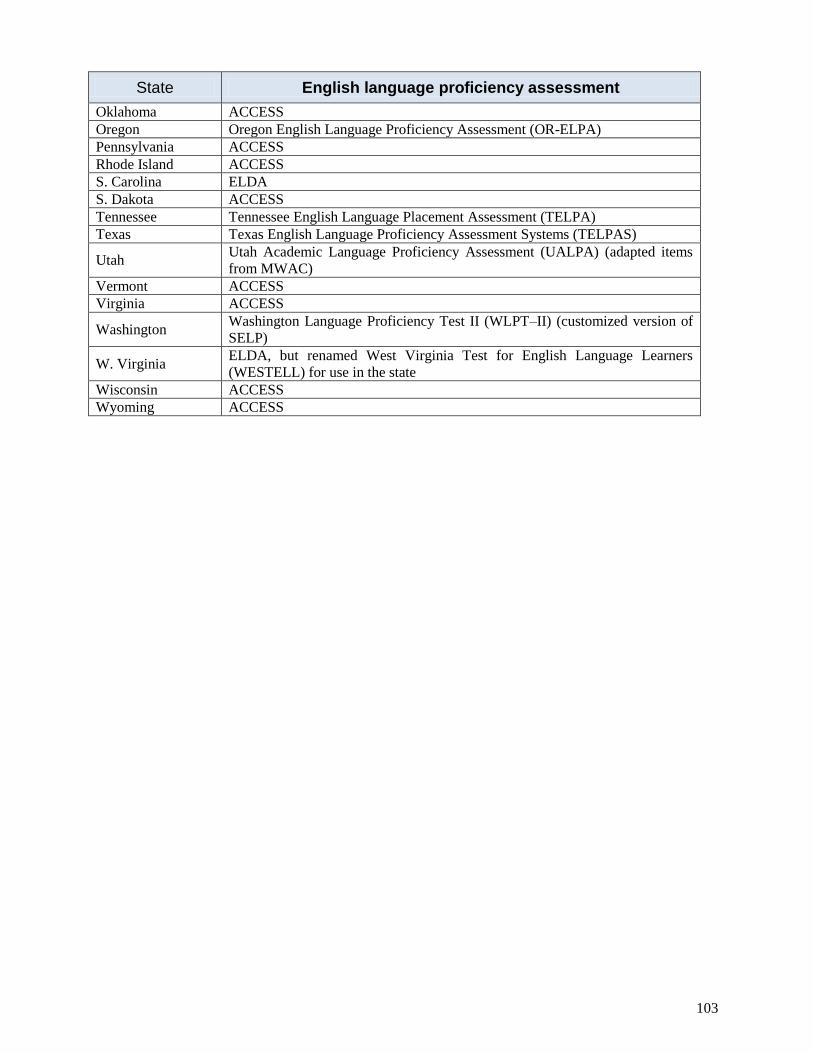
Draft
103
State English language proficiency assessment
Oklahoma ACCESS
Oregon Oregon English Language Proficiency Assessment (OR-ELPA)
Pennsylvania ACCESS
Rhode Island ACCESS
S. Carolina ELDA
S. Dakota ACCESS
Tennessee Tennessee English Language Placement Assessment (TELPA)
Texas Texas English Language Proficiency Assessment Systems (TELPAS)
Utah Utah Academic Language Proficiency Assessment (UALPA) (adapted items
from MWAC)
Vermont ACCESS
Virginia ACCESS
Washington Washington Language Proficiency Test II (WLPT–II) (customized version of
SELP)
W. Virginia ELDA, but renamed West Virginia Test for English Language Learners
(WESTELL) for use in the state
Wisconsin ACCESS
Wyoming ACCESS
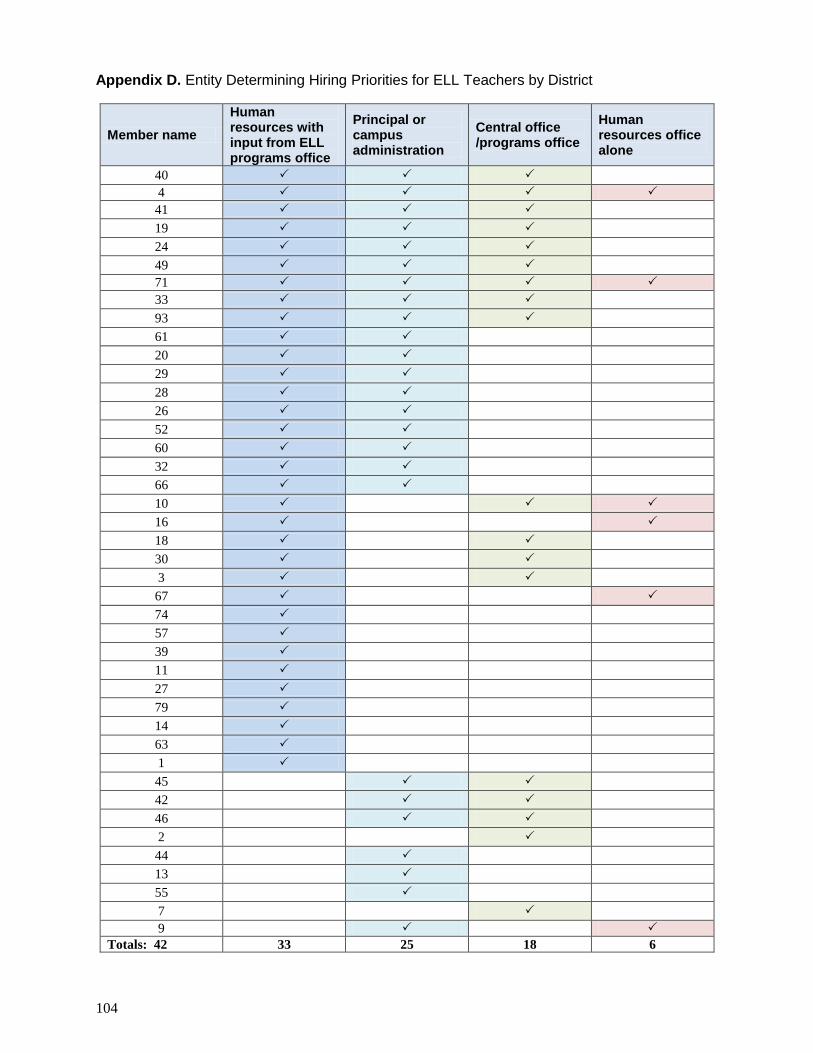
104
Appendix D. Entity Determining Hiring Priorities for ELL Teachers by District
Member name
Human resources with input from ELL programs office
Principal or campus administration
Central office /programs office
Human resources office alone
40 4
41 19 24 49 71
33 93 61 20 29 28 26 52 60 32 66 10
16
18 30 3 67
74 57 39 11 27 79 14 63 1 45 42 46 2 44 13 55 7 9
Totals: 42 33 25 18 6

Draft
105
Finally, some 12 districts provided responses in the “other” category (not shown), with responses that
included the central office – leadership division, the deputy superintendent of leadership, instruction and
equity in action, executive directors of elementary, middle, and high school, and shared decisions among
several administrative entities/functions.

106
Appendix E. Tests of Statistical Significance on Changes and Gaps in NAEP Scores Between ELLs, Non-ELLs, and Former ELLs (Large City and National Public Samples)
NAEP Reading Results
Large Cities
Grade and subgroup 2005 2007 2009 2011
Statistical
significance
in change
from 2005 to
2011?
Statistical
significance
in gap change
with Non-
ELL?
Grade 4
ELL 5% 6% 4% 6% No Change Yes
Former ELL 27% 34% 25% 28% No Change No
Non-ELL 23% 25% 27% 29% Yes n/a
Grade 8
ELL 3% 2% 2% 2% No Change Yes
Former ELL 22% 13% 12% 15% Yes Yes
Non-ELL 22% 22% 25% 26% Yes n/a
National Public
Grade and subgroup 2005 2007 2009 2011
Statistical
significance
in change
from 2005 to
2011?
Statistical
significance
in gap change
with Non-
ELL?
Grade 4
ELL 7% 7% 6% 7% No Change Yes
Former ELL 26% 30% 29% 32% Yes No
Non-ELL 32% 34% 34% 36% Yes n/a
Grade 8
ELL 4% 4% 3% 3% No Change No
Former ELL 20% 16% 16% 16% Yes No
Non-ELL 30% 31% 32% 34% Yes n/a
Key
No There is no statistical significance in the difference between the two variables
Yes There is a statistical significance in the difference between the two variables
N/A The test of statistical significance is not applicable because the two variables cannot be compared
No
Change There was no change in achievement of the subgroup(s) from 2005 to 2011
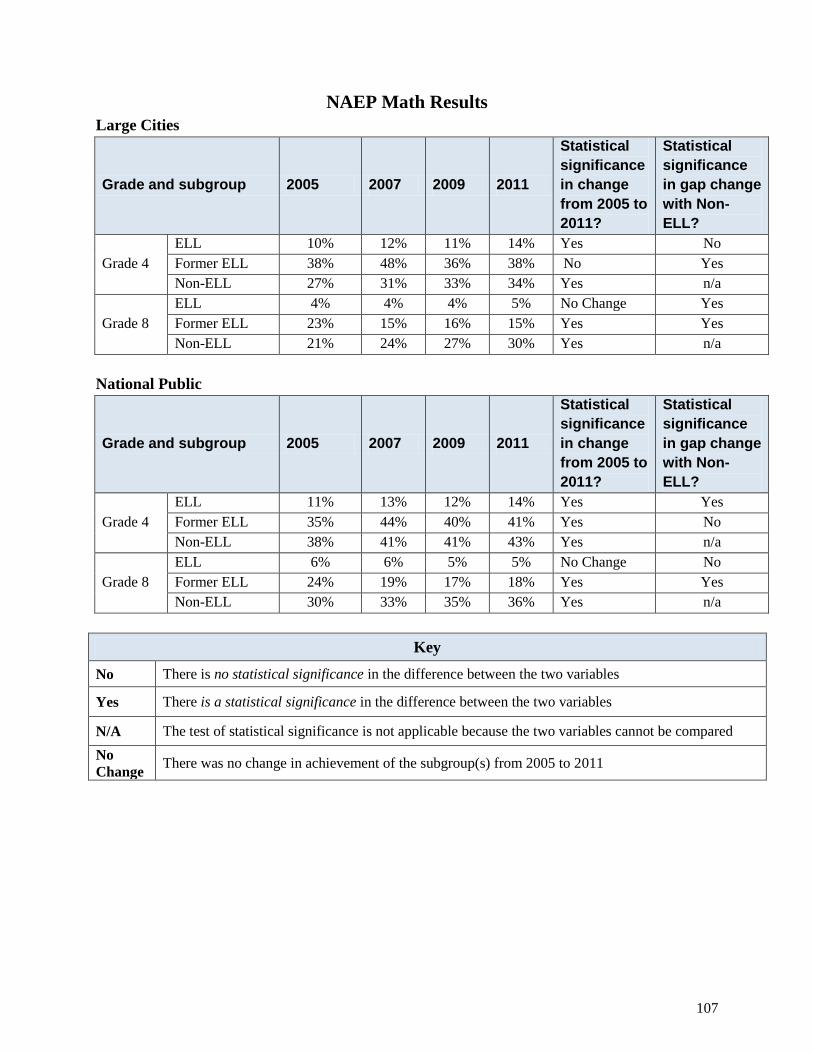
Draft
107
NAEP Math Results
Large Cities
Grade and subgroup 2005 2007 2009 2011
Statistical
significance
in change
from 2005 to
2011?
Statistical
significance
in gap change
with Non-
ELL?
Grade 4
ELL 10% 12% 11% 14% Yes No
Former ELL 38% 48% 36% 38% No Yes
Non-ELL 27% 31% 33% 34% Yes n/a
Grade 8
ELL 4% 4% 4% 5% No Change Yes
Former ELL 23% 15% 16% 15% Yes Yes
Non-ELL 21% 24% 27% 30% Yes n/a
National Public
Grade and subgroup 2005 2007 2009 2011
Statistical
significance
in change
from 2005 to
2011?
Statistical
significance
in gap change
with Non-
ELL?
Grade 4
ELL 11% 13% 12% 14% Yes Yes
Former ELL 35% 44% 40% 41% Yes No
Non-ELL 38% 41% 41% 43% Yes n/a
Grade 8
ELL 6% 6% 5% 5% No Change No
Former ELL 24% 19% 17% 18% Yes Yes
Non-ELL 30% 33% 35% 36% Yes n/a
Key
No There is no statistical significance in the difference between the two variables
Yes There is a statistical significance in the difference between the two variables
N/A The test of statistical significance is not applicable because the two variables cannot be compared
No
Change There was no change in achievement of the subgroup(s) from 2005 to 2011
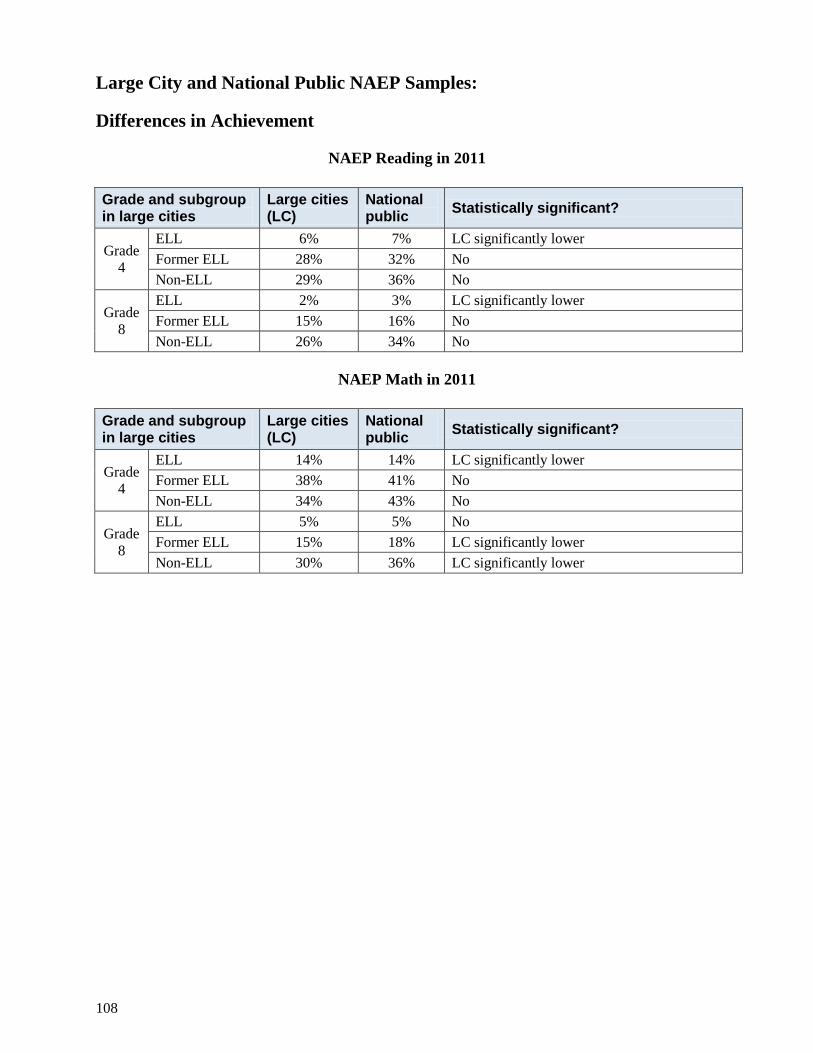
108
Large City and National Public NAEP Samples:
Differences in Achievement
NAEP Reading in 2011
Grade and subgroup in large cities
Large cities (LC)
National public
Statistically significant?
Grade
4
ELL 6% 7% LC significantly lower
Former ELL 28% 32% No
Non-ELL 29% 36% No
Grade
8
ELL 2% 3% LC significantly lower
Former ELL 15% 16% No
Non-ELL 26% 34% No
NAEP Math in 2011
Grade and subgroup in large cities
Large cities (LC)
National public
Statistically significant?
Grade
4
ELL 14% 14% LC significantly lower
Former ELL 38% 41% No
Non-ELL 34% 43% No
Grade
8
ELL 5% 5% No
Former ELL 15% 18% LC significantly lower
Non-ELL 30% 36% LC significantly lower
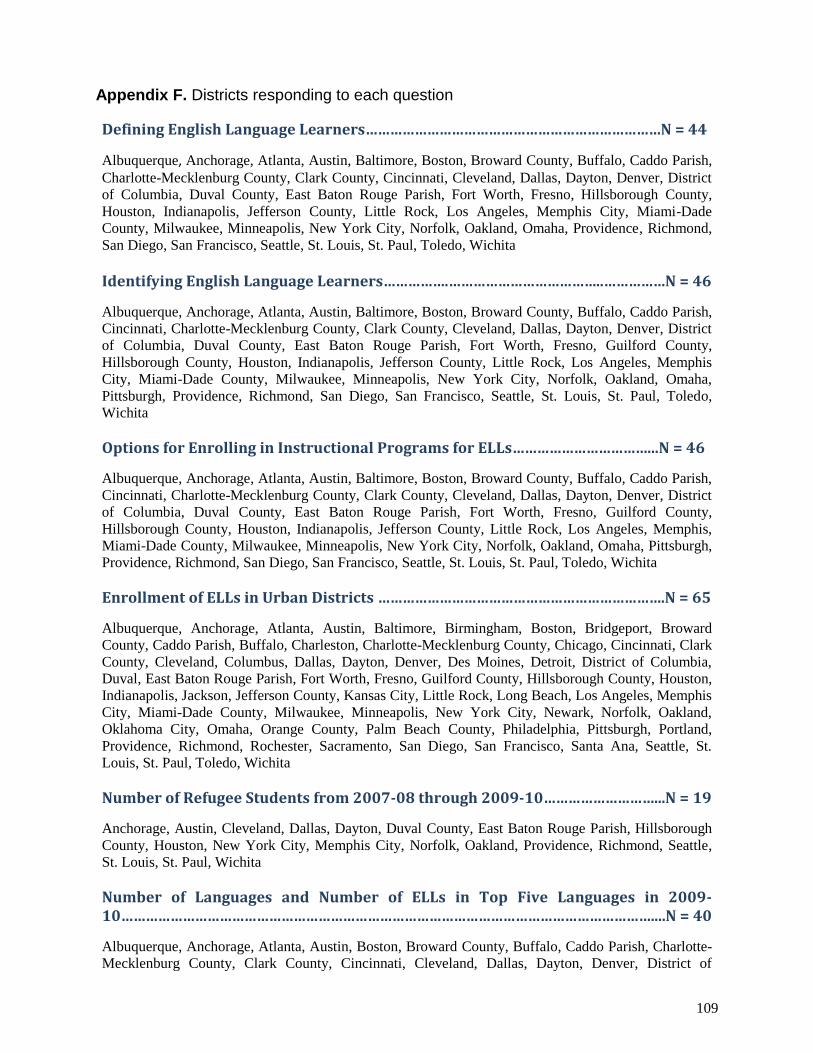
Draft
109
Appendix F. Districts responding to each question
Defining English Language Learners………………………………………………………………N = 44
Albuquerque, Anchorage, Atlanta, Austin, Baltimore, Boston, Broward County, Buffalo, Caddo Parish,
Charlotte-Mecklenburg County, Clark County, Cincinnati, Cleveland, Dallas, Dayton, Denver, District
of Columbia, Duval County, East Baton Rouge Parish, Fort Worth, Fresno, Hillsborough County,
Houston, Indianapolis, Jefferson County, Little Rock, Los Angeles, Memphis City, Miami-Dade
County, Milwaukee, Minneapolis, New York City, Norfolk, Oakland, Omaha, Providence, Richmond,
San Diego, San Francisco, Seattle, St. Louis, St. Paul, Toledo, Wichita
Identifying English Language Learners…………….………………………………..……………N = 46
Albuquerque, Anchorage, Atlanta, Austin, Baltimore, Boston, Broward County, Buffalo, Caddo Parish,
Cincinnati, Charlotte-Mecklenburg County, Clark County, Cleveland, Dallas, Dayton, Denver, District
of Columbia, Duval County, East Baton Rouge Parish, Fort Worth, Fresno, Guilford County,
Hillsborough County, Houston, Indianapolis, Jefferson County, Little Rock, Los Angeles, Memphis
City, Miami-Dade County, Milwaukee, Minneapolis, New York City, Norfolk, Oakland, Omaha,
Pittsburgh, Providence, Richmond, San Diego, San Francisco, Seattle, St. Louis, St. Paul, Toledo,
Wichita
Options for Enrolling in Instructional Programs for ELLs……………………………...N = 46
Albuquerque, Anchorage, Atlanta, Austin, Baltimore, Boston, Broward County, Buffalo, Caddo Parish,
Cincinnati, Charlotte-Mecklenburg County, Clark County, Cleveland, Dallas, Dayton, Denver, District
of Columbia, Duval County, East Baton Rouge Parish, Fort Worth, Fresno, Guilford County,
Hillsborough County, Houston, Indianapolis, Jefferson County, Little Rock, Los Angeles, Memphis,
Miami-Dade County, Milwaukee, Minneapolis, New York City, Norfolk, Oakland, Omaha, Pittsburgh,
Providence, Richmond, San Diego, San Francisco, Seattle, St. Louis, St. Paul, Toledo, Wichita
Enrollment of ELLs in Urban Districts …………………………………………………………….N = 65
Albuquerque, Anchorage, Atlanta, Austin, Baltimore, Birmingham, Boston, Bridgeport, Broward
County, Caddo Parish, Buffalo, Charleston, Charlotte-Mecklenburg County, Chicago, Cincinnati, Clark
County, Cleveland, Columbus, Dallas, Dayton, Denver, Des Moines, Detroit, District of Columbia,
Duval, East Baton Rouge Parish, Fort Worth, Fresno, Guilford County, Hillsborough County, Houston,
Indianapolis, Jackson, Jefferson County, Kansas City, Little Rock, Long Beach, Los Angeles, Memphis
City, Miami-Dade County, Milwaukee, Minneapolis, New York City, Newark, Norfolk, Oakland,
Oklahoma City, Omaha, Orange County, Palm Beach County, Philadelphia, Pittsburgh, Portland,
Providence, Richmond, Rochester, Sacramento, San Diego, San Francisco, Santa Ana, Seattle, St.
Louis, St. Paul, Toledo, Wichita
Number of Refugee Students from 2007-08 through 2009-10………………………...N = 19
Anchorage, Austin, Cleveland, Dallas, Dayton, Duval County, East Baton Rouge Parish, Hillsborough
County, Houston, New York City, Memphis City, Norfolk, Oakland, Providence, Richmond, Seattle,
St. Louis, St. Paul, Wichita
Number of Languages and Number of ELLs in Top Five Languages in 2009-10…………………………………………………………………………………………………………………....N = 40
Albuquerque, Anchorage, Atlanta, Austin, Boston, Broward County, Buffalo, Caddo Parish, Charlotte-
Mecklenburg County, Clark County, Cincinnati, Cleveland, Dallas, Dayton, Denver, District of
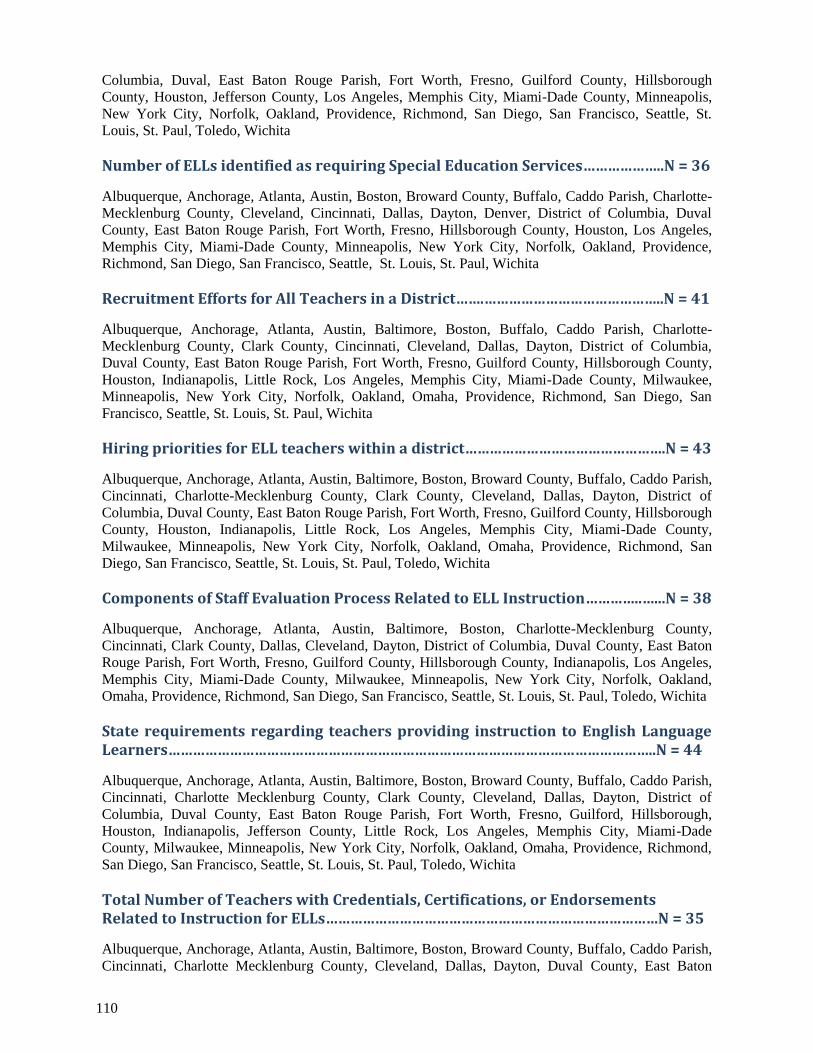
110
Columbia, Duval, East Baton Rouge Parish, Fort Worth, Fresno, Guilford County, Hillsborough
County, Houston, Jefferson County, Los Angeles, Memphis City, Miami-Dade County, Minneapolis,
New York City, Norfolk, Oakland, Providence, Richmond, San Diego, San Francisco, Seattle, St.
Louis, St. Paul, Toledo, Wichita
Number of ELLs identified as requiring Special Education Services………………..N = 36
Albuquerque, Anchorage, Atlanta, Austin, Boston, Broward County, Buffalo, Caddo Parish, Charlotte-
Mecklenburg County, Cleveland, Cincinnati, Dallas, Dayton, Denver, District of Columbia, Duval
County, East Baton Rouge Parish, Fort Worth, Fresno, Hillsborough County, Houston, Los Angeles,
Memphis City, Miami-Dade County, Minneapolis, New York City, Norfolk, Oakland, Providence,
Richmond, San Diego, San Francisco, Seattle, St. Louis, St. Paul, Wichita
Recruitment Efforts for All Teachers in a District…….……………………………………..N = 41
Albuquerque, Anchorage, Atlanta, Austin, Baltimore, Boston, Buffalo, Caddo Parish, Charlotte-
Mecklenburg County, Clark County, Cincinnati, Cleveland, Dallas, Dayton, District of Columbia,
Duval County, East Baton Rouge Parish, Fort Worth, Fresno, Guilford County, Hillsborough County,
Houston, Indianapolis, Little Rock, Los Angeles, Memphis City, Miami-Dade County, Milwaukee,
Minneapolis, New York City, Norfolk, Oakland, Omaha, Providence, Richmond, San Diego, San
Francisco, Seattle, St. Louis, St. Paul, Wichita
Hiring priorities for ELL teachers within a district………………………………………….N = 43
Albuquerque, Anchorage, Atlanta, Austin, Baltimore, Boston, Broward County, Buffalo, Caddo Parish,
Cincinnati, Charlotte-Mecklenburg County, Clark County, Cleveland, Dallas, Dayton, District of
Columbia, Duval County, East Baton Rouge Parish, Fort Worth, Fresno, Guilford County, Hillsborough
County, Houston, Indianapolis, Little Rock, Los Angeles, Memphis City, Miami-Dade County,
Milwaukee, Minneapolis, New York City, Norfolk, Oakland, Omaha, Providence, Richmond, San
Diego, San Francisco, Seattle, St. Louis, St. Paul, Toledo, Wichita
Components of Staff Evaluation Process Related to ELL Instruction…………..…...N = 38
Albuquerque, Anchorage, Atlanta, Austin, Baltimore, Boston, Charlotte-Mecklenburg County,
Cincinnati, Clark County, Dallas, Cleveland, Dayton, District of Columbia, Duval County, East Baton
Rouge Parish, Fort Worth, Fresno, Guilford County, Hillsborough County, Indianapolis, Los Angeles,
Memphis City, Miami-Dade County, Milwaukee, Minneapolis, New York City, Norfolk, Oakland,
Omaha, Providence, Richmond, San Diego, San Francisco, Seattle, St. Louis, St. Paul, Toledo, Wichita
State requirements regarding teachers providing instruction to English Language Learners………………………………………………………………………………………………………..N = 44
Albuquerque, Anchorage, Atlanta, Austin, Baltimore, Boston, Broward County, Buffalo, Caddo Parish,
Cincinnati, Charlotte Mecklenburg County, Clark County, Cleveland, Dallas, Dayton, District of
Columbia, Duval County, East Baton Rouge Parish, Fort Worth, Fresno, Guilford, Hillsborough,
Houston, Indianapolis, Jefferson County, Little Rock, Los Angeles, Memphis City, Miami-Dade
County, Milwaukee, Minneapolis, New York City, Norfolk, Oakland, Omaha, Providence, Richmond,
San Diego, San Francisco, Seattle, St. Louis, St. Paul, Toledo, Wichita
Total Number of Teachers with Credentials, Certifications, or Endorsements Related to Instruction for ELLs………………………………………………………………………N = 35
Albuquerque, Anchorage, Atlanta, Austin, Baltimore, Boston, Broward County, Buffalo, Caddo Parish,
Cincinnati, Charlotte Mecklenburg County, Cleveland, Dallas, Dayton, Duval County, East Baton
Draft
111
Rouge Parish, Fort Worth, Hillsborough County, Houston, Indianapolis, Los Angeles, Memphis City,
Miami-Dade County, Milwaukee, Norfolk, Oakland, Omaha, Providence, Richmond, San Diego, San
Francisco, Seattle, St. Paul, Toledo, Wichita
Number of Teachers in 2009-2010………………………………………………………………….N = 35
Albuquerque, Anchorage, Atlanta, Austin, Baltimore, Boston, Buffalo, Caddo Parish, Charlotte-
Mecklenburg County, Cleveland, Cincinnati, Dallas, Dayton, Duval County, East Baton Rouge Parish,
Fort Worth, Fresno, Guilford County, Hillsborough County, Houston, Indianapolis, Memphis City,
Miami-Dade County, Milwaukee, Minneapolis, Norfolk, Oakland, Omaha, Providence, Richmond, San
Diego, San Francisco, St. Paul, Toledo, Wichita
Number of Instructional Assistants by Grade Spans………………………………………..N = 32
Albuquerque, Anchorage, Atlanta, Baltimore, Boston, Buffalo, Caddo Parish, Charlotte-Mecklenburg
County, Cincinnati, Dayton, Cleveland, Duval County, Fort Worth, Fresno, Hillsborough County,
Houston, Indianapolis, Little Rock, Los Angeles, Memphis City, Miami-Dade County, Norfolk,
Oakland, Omaha, Providence, Richmond, San Diego, San Francisco, Seattle, St. Paul, Toledo, Wichita
Assignments of ELL teachers with Endorsements or Certification Who Are not Assigned to ELLs: Shortages of Teachers for ELLs and ELL teacher shortage …………………………………………………………………………………………………………………….….N = 43
Albuquerque, Anchorage, Atlanta, Austin, Baltimore, Boston, Broward County, Buffalo, Caddo Parish,
Cincinnati, Charlotte Mecklenburg County, Clark County, Cleveland, Dallas, Dayton, District of
Columbia, Duval County, East Baton Rouge Parish, Fort Worth, Fresno, Guilford County, Hillsborough
County, Houston, Indianapolis, Little Rock, Los Angeles, Memphis City, Miami-Dade County,
Milwaukee, Minneapolis, New York City, Norfolk, Oakland, Omaha, Providence, Richmond, San
Diego, San Francisco, Seattle, St. Louis, St. Paul, Toledo, Wichita
English Language Proficiency Data for 2009–10 by Level of Proficiency ……………………………………………………………………………………………….………………………N = 37
Albuquerque, Anchorage, Atlanta, Austin, Baltimore, Boston, Broward County, Buffalo, Charlotte-
Mecklenburg County, Clark County, Cleveland, Cincinnati, Dallas, Dayton, District of Columbia,
Denver, East Baton Rouge Parish, Fort Worth, Fresno, Hillsborough County, Houston, Los Angeles,
Memphis City, Miami-Dade County, Milwaukee, New York City, Norfolk, Oakland, Omaha,
Providence, Richmond, San Diego, San Francisco, Seattle, St. Paul, Toledo, Wichita
Successful Completion of Algebra I by Grade 8 or 9, by ELL Status.……………………………………………………………………………………………………………..N = 21
Albuquerque, Atlanta, Austin, Charlotte-Mecklenburg County, Cleveland, Dayton, Fort Worth, Fresno,
Houston, Hillsborough County, Los Angeles, Memphis City, Miami-Dade County, New York City,
Norfolk, Oakland, Omaha, Providence, Richmond, San Diego, San Francisco
ELL Participation in gifted and talented programs………………………………………….N = 31
Albuquerque, Anchorage, Atlanta, Austin, Boston, Broward County, Charlotte-Mecklenburg County,
Cincinnati, Clark County, Dayton, Cleveland, Denver, East Baton Rouge Parish, Fort Worth, Fresno,
Hillsborough County, Houston, Los Angeles, Memphis City, Miami-Dade County, Minneapolis,
Norfolk, Oakland, Omaha, Providence, Richmond, San Diego, San Francisco, Seattle, St. Paul, Wichita
112
Sources of funding for ELL Programs………………………………………………………….…N = 33
Albuquerque, Anchorage, Atlanta, Austin, Baltimore, Boston, Broward County, Buffalo, Charlotte-
Mecklenburg County, Clark County, Cincinnati, Cleveland, Dayton, District of Columbia, Duval
County, East Baton Rouge Parish, Fort Worth, Fresno, Indianapolis, Memphis City, Miami-Dade
County, New York City, Norfolk, Oakland, Omaha, Providence, Richmond, San Diego, San Francisco,
Seattle, St. Paul, Toledo, Wichita
Basic school funding and other categorical support for ELL programs…………...N = 45
Albuquerque, Anchorage, Atlanta, Austin, Baltimore, Boston, Broward County, Buffalo, Charlotte
Mecklenburg County, Clark County, Cincinnati, Cleveland, Dallas, Dayton, Denver, District of
Columbia, Duval County, East Baton Rouge Parish, Fort Worth, Fresno, Guilford County, Hillsborough
County, Houston, Indianapolis, Jefferson County, Little Rock, Los Angeles, Memphis City, Miami-
Dade County, Milwaukee, Minneapolis, New York City, Norfolk, Oakland, Omaha, Pittsburgh,
Providence, Richmond, San Diego, San Francisco, Seattle, St. Louis, St. Paul, Toledo, Wichita
Estimated number of ELLs served with Title III funds…………………………...............N = 37
Albuquerque, Anchorage, Atlanta, Austin, Baltimore, Boston, Broward County, Buffalo, Charlotte-
Mecklenburg County, Clark County, Cincinnati, Cleveland, Dallas, Dayton, District of Columbia, East
Baton Rouge Parish, Fort Worth, Fresno, Guilford County, Hillsborough County, Houston,
Indianapolis, Los Angeles, Memphis City, Miami-Dade County, Milwaukee, Minneapolis, New York
City, Norfolk, Oakland, Providence, Richmond, San Diego, San Francisco, St. Paul, Toledo, Wichita
Stakeholders that provide input on the use of Title III funds…………………………..N = 43
Albuquerque, Anchorage, Atlanta, Austin, Baltimore, Boston, Broward County, Buffalo, Charlotte-
Mecklenburg County, Clark County, Cincinnati, Cleveland, Dallas, Dayton, Denver, District of
Columbia, Duval County, East Baton Rouge Parish, Fort Worth, Fresno, Guilford County, Hillsborough
County, Houston, Indianapolis, Little Rock, Los Angeles, Memphis City, Miami-Dade County,
Milwaukee, Minneapolis, New York City, Norfolk, Oakland, Omaha, Providence, Richmond, San
Diego, San Francisco, Seattle, St. Louis, St. Paul, Toledo, Wichita
Uses of Title III Expenditures………….………………………………………………….……..……N = 41
Albuquerque, Anchorage, Atlanta, Austin, Baltimore, Boston, Broward County, Buffalo, Charlotte-
Mecklenburg County, Clark County, Cincinnati, Cleveland, Dallas, Dayton, District of Columbia,
Duval County, East Baton Rouge Parish, Fort Worth, Fresno, Guilford County, Hillsborough County,
Houston, Indianapolis, Little Rock, Los Angeles, Memphis City, Miami-Dade County, Milwaukee,
New York City, Norfolk, Oakland, Omaha, Providence, Richmond, San Diego, San Francisco, Seattle,
St. Louis St. Paul, Toledo, Wichita
Setting budget priorities………………………………………………………………………………...N = 31
Albuquerque, Anchorage, Atlanta, Austin, Baltimore, Broward County, Buffalo, Charlotte-
Mecklenburg County, Cincinnati, Dayton, Cleveland, District of Columbia, Duval County, East Baton
Rouge Parish, Fort Worth, Hillsborough County, Houston, Indianapolis, Little Rock, Los Angeles,
Memphis City, Miami-Dade County, Norfolk, Oakland, Omaha, Providence, Richmond, San Francisco,
Seattle, St. Paul, Wichita