enhanced gene expression plasticity as a mechanism of ... · 2 local adaptation is ubiquitous1, but...
TRANSCRIPT
Enhanced gene expression plasticity as a mechanism of adaptation to a variable
environment in a reef-building coral
C.D. Kenkel1,2* and M.V. Matz2
1Australian Institute of Marine Science, PMB No 3, Townsville MC, Queensland, 4810 Australia
2Department of Integrative Biology, The University of Texas at Austin, 1 University Station
C0990, Austin TX 78712
*corresponding author: [email protected]; (+61) 429 683 148
Keywords: TagSeq, environmental stress response, Porites astreoides, Florida Keys
.CC-BY-NC-ND 4.0 International licensepeer-reviewed) is the author/funder. It is made available under aThe copyright holder for this preprint (which was not. http://dx.doi.org/10.1101/059667doi: bioRxiv preprint first posted online Jun. 18, 2016;

2
Local adaptation is ubiquitous1, but the molecular mechanisms giving rise to this
ecological phenomenon remain largely unknown2. A year-long reciprocal transplant of mustard
hill coral (Porites astreoides) between a highly environmentally variable inshore habitat and
more stable offshore habitat3 demonstrated that both inshore and offshore populations exhibit
elevated growth, protein and lipid content in their home reef environment, indicative of local
adaptation 4. Here, we characterized the genomic basis of this adaptation in both coral hosts and
their intracellular algal symbionts (Symbiodinium sp.) using genome-wide gene expression
profiling5,6 and gene coexpression network analysis7. Inshore and offshore coral populations
differ primarily in their capacity for gene expression plasticity: upon transplantation to a novel
environment inshore corals were able to match expression profiles of the local population
significantly better than offshore corals. Furthermore, elevated plasticity in expression of
environmental stress response (ESR) genes was adaptive in the inshore environment: it
correlated with the least susceptibility to a natural summer bleaching event, whereas higher
constitutive ESR gene expression (“frontloading” sensu 8) did not. Our results reveal a novel
genomic mechanism of resilience to a variable environment, demonstrating that corals are
capable of a more diverse molecular response to environmental stress than previously thought.
To explore expression patterns with respect to origin and transplant, we conducted a
discriminant analysis of principal components for all genes represented by at least 10 unique
transcript counts in more than 90% of samples. Corals from inshore populations exhibited greater
plasticity in their genome-wide gene expression profiles than corals from offshore populations
(Fig. 1). Inshore coral hosts transplanted to offshore reefs matched native offshore expression
patterns more closely than offshore hosts transplanted to inshore reefs (t-test: t=2.94, df=11.7,
.CC-BY-NC-ND 4.0 International licensepeer-reviewed) is the author/funder. It is made available under aThe copyright holder for this preprint (which was not. http://dx.doi.org/10.1101/059667doi: bioRxiv preprint first posted online Jun. 18, 2016;
3
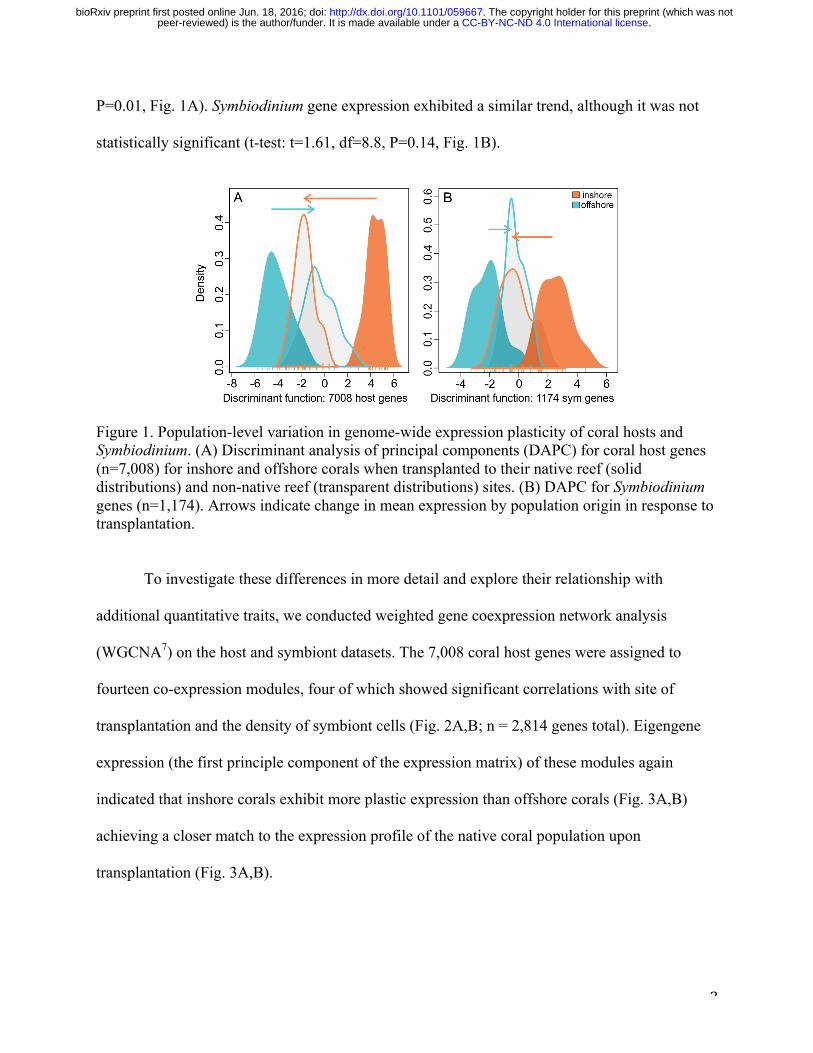
P=0.01, Fig. 1A). Symbiodinium gene expression exhibited a similar trend, although it was not
statistically significant (t-test: t=1.61, df=8.8, P=0.14, Fig. 1B).
Figure 1. Population-level variation in genome-wide expression plasticity of coral hosts and Symbiodinium. (A) Discriminant analysis of principal components (DAPC) for coral host genes (n=7,008) for inshore and offshore corals when transplanted to their native reef (solid distributions) and non-native reef (transparent distributions) sites. (B) DAPC for Symbiodinium genes (n=1,174). Arrows indicate change in mean expression by population origin in response to transplantation.
To investigate these differences in more detail and explore their relationship with
additional quantitative traits, we conducted weighted gene coexpression network analysis
(WGCNA7) on the host and symbiont datasets. The 7,008 coral host genes were assigned to
fourteen co-expression modules, four of which showed significant correlations with site of
transplantation and the density of symbiont cells (Fig. 2A,B; n = 2,814 genes total). Eigengene
expression (the first principle component of the expression matrix) of these modules again
indicated that inshore corals exhibit more plastic expression than offshore corals (Fig. 3A,B)
achieving a closer match to the expression profile of the native coral population upon
transplantation (Fig. 3A,B).
.CC-BY-NC-ND 4.0 International licensepeer-reviewed) is the author/funder. It is made available under aThe copyright holder for this preprint (which was not. http://dx.doi.org/10.1101/059667doi: bioRxiv preprint first posted online Jun. 18, 2016;
4
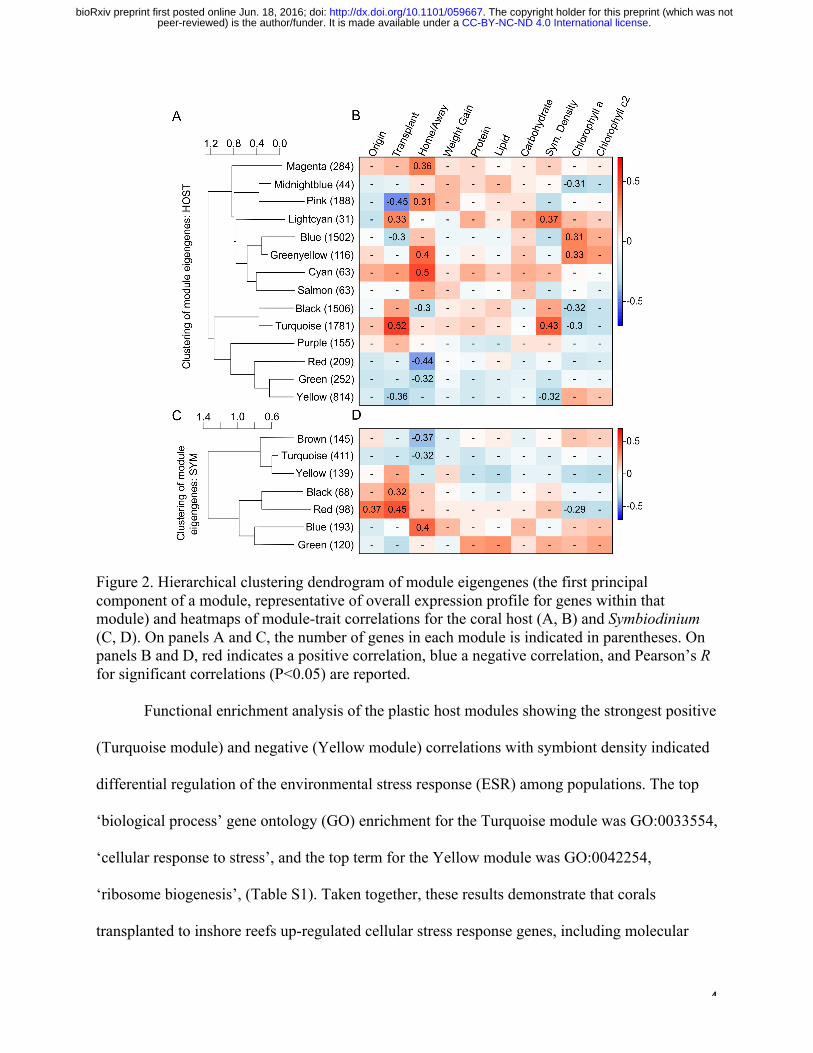
Figure 2. Hierarchical clustering dendrogram of module eigengenes (the first principal component of a module, representative of overall expression profile for genes within that module) and heatmaps of module-trait correlations for the coral host (A, B) and Symbiodinium (C, D). On panels A and C, the number of genes in each module is indicated in parentheses. On panels B and D, red indicates a positive correlation, blue a negative correlation, and Pearson’s R for significant correlations (P<0.05) are reported.
Functional enrichment analysis of the plastic host modules showing the strongest positive
(Turquoise module) and negative (Yellow module) correlations with symbiont density indicated
differential regulation of the environmental stress response (ESR) among populations. The top
‘biological process’ gene ontology (GO) enrichment for the Turquoise module was GO:0033554,
‘cellular response to stress’, and the top term for the Yellow module was GO:0042254,
‘ribosome biogenesis’, (Table S1). Taken together, these results demonstrate that corals
transplanted to inshore reefs up-regulated cellular stress response genes, including molecular
.CC-BY-NC-ND 4.0 International licensepeer-reviewed) is the author/funder. It is made available under aThe copyright holder for this preprint (which was not. http://dx.doi.org/10.1101/059667doi: bioRxiv preprint first posted online Jun. 18, 2016;

5
chaperones such as heat shock proteins, while down-regulating ribosome biogenesis, a hallmark
of the ESR9.
Figure 3. (A,B) Inshore coral hosts show greater gene expression plasticity of major symbiont-correlated modules than offshore corals. Boxplots show the median and interquartile range of module eigengenes (the first principle component of the expression matrix) with respect to site of origin and transplant environment for (A) host turquoise and (B) yellow modules. Colored dashed lines indicate origin-specific medians. (C, D) Corals with the strongest environmental stress response (ESR) also maintained the highest symbiont densities. Regression of symbiont densities on eigengenes for significantly enriched (P<0.001) gene ontology terms (C) ‘cellular response to stress’ (n=40 genes, host turquoise module, R: 0.39, 95%CI [0.10, 0.61], P<0.01) and (D) ‘small ribosomal subunit’ (n=17 genes, host yellow module, R: -0.26, 95%CI [-0.51, 0.04],
.CC-BY-NC-ND 4.0 International licensepeer-reviewed) is the author/funder. It is made available under aThe copyright holder for this preprint (which was not. http://dx.doi.org/10.1101/059667doi: bioRxiv preprint first posted online Jun. 18, 2016;
6
P=0.09). (E) Coral genotypes with greater ESR expression plasticity maintained higher symbiont densities when transplanted to inshore reefs (R: 0.49, 95%CI [-0.03, 0.80], P=0.06). (F) Constitutive ESR expression level among genotypes was unrelated to maintenance of symbiont densities (R: -0.25, 95%CI [-0.64, 0.23], P=0.29).
Maintenance of homeostasis in the face of environmental variability is a physiological
challenge faced by all organisms, but sessile animals, such as reef-building corals, are
particularly susceptible since they cannot change habitats to escape stressors9. Inshore reefs in
the Florida Keys are more variable than offshore reefs in multiple environmental parameters10,
including temperature, and inshore corals exhibit elevated thermal tolerance3,11. In the present
study, thermal stress was likely responsible for up-regulation of the ESR at inshore reefs, as
samples were collected at the end of the 2012 summer4. In addition, coral bleaching, the stress-
induced functional loss of the endosymbionts which commonly results from elevated
temperature12, was observed at the time of sample collection, but only in offshore origin corals
transplanted to inshore reefs (Fig. S2). Further supporting the conjecture that ESR regulation in
the coral host is a direct response to elevated summer temperatures is the strong correlation
between ESR expression and symbiont density: corals with the strongest ESR maintained the
highest symbiont densities (Fig. 3C,D). Notably, corals with the greatest change in ESR
expression across environments maintained the highest symbiont densities (Fig. 3E), while corals
with higher constitutive expression of ESR genes did not (Fig. 3F). This indicates that
differential thermal tolerance among populations was due to varying capacity for gene
expression plasticity rather than elevated pre-emptive expression (“frontloading”) of stress-
response genes, sensu 8. Furthermore, these results show that variation in bleaching susceptibility
of the holobiont (the combination of host and symbiont) is explained by the ability of the coral
host to mitigate intracellular damage resulting from environmental stress, which is in contrast to
.CC-BY-NC-ND 4.0 International licensepeer-reviewed) is the author/funder. It is made available under aThe copyright holder for this preprint (which was not. http://dx.doi.org/10.1101/059667doi: bioRxiv preprint first posted online Jun. 18, 2016;
7
many other coral species where variation in bleaching susceptibility is largely attributable to
differences in symbiont genotype (e.g.13,14).
In the Symbiodinium, 1,174 genes were assigned to seven co-expression modules, none of
which showed correlations with symbiont density, though the red module was correlated with
chlorophyll a content (Fig. 2C,D). Expression in two modules was correlated with site of
transplantation, and expression plasticity in the red module tended to differ among populations,
with inshore symbionts showing greater change than offshore symbionts. This module comprised
few genes (n=98) with the most significantly enriched GO term being GO:0009521,
‘photosystem’ (Table S1). The genes in the module annotated with this GO term included
components of the peripheral light-harvesting complex (LHC), such as fucoxanthin-chlorophyll
a/c binding proteins. A decrease in peripheral LHCs limits the risk of photodamage to D1
reaction center proteins and has been proposed as a photoprotection mechanism of in hospite
Symbiodinium in response to stress15. If Symbiodinium self-protection was the reason for
elevated thermal tolerance of inshore-origin corals, inshore origin symbionts should exhibit
down-regulation of these photosystem genes at inshore reefs where bleaching was observed (Fig.
S2). However, the opposite pattern was evident: native inshore-origin Symbiodinium exhibited
elevated expression in comparison to offshore-origin transplants (Fig. S3). This suggests that
symbiont performance under thermal stress in inshore corals is maintained not due to the
symbionts’ own stress protection mechanisms but through plasticity of host ESR genes.
Increased plasticity is predicted to evolve in a population if reaction norms vary across
genotypes and the slope of the reaction norm is positively correlated with fitness16,17. Given that
expression of stress response genes is energetically costly18, a tradeoff is expected where
enhanced plasticity would be beneficial in the variable environment but detrimental in the stable
.CC-BY-NC-ND 4.0 International licensepeer-reviewed) is the author/funder. It is made available under aThe copyright holder for this preprint (which was not. http://dx.doi.org/10.1101/059667doi: bioRxiv preprint first posted online Jun. 18, 2016;
8
environment. We estimated the costs of stress response expression plasticity using the selection
gradient method19,20, by regressing relative fitness (weight gain) in the home environment against
mean expression at home and the magnitude of expression change upon transplantation
(plasticity). The partial regression coefficient for the plasticity term provides an estimate of cost
while controlling for trait’s mean. A positive value indicates selection for plasticity, while a
negative value indicates selection against plasticity21. The estimated plasticity coefficient for
expression of cellular stress response genes (n=40 genes) was positive for inshore corals (0.11)
and negative for offshore corals (-0.02), suggesting divergent selection acting among populations
consistent with environmental variation among reef sites. However, since neither coefficient was
significantly different from zero, additional work is needed to confirm this hypothesis.
Given the difference in thermal regimes between inshore and offshore reefs in the Lower
Florida Keys it is expectable that inshore corals have adapted and/or acclimated to their native
reef environment4 and exhibit elevated thermotolerance3,11. The surprising result of the present
study is that these higher-order phenotypic responses may be explained by a differential capacity
for gene expression plasticity. The population-level difference in gene expression plasticity
described here is also in contrast to another recently reported mechanism by which corals may be
adapting to temperature variation. Barshis et al. (2013) found that corals from more thermally
variable pools exhibited constitutive up-regulation of ESR transcripts, which the authors termed
“frontloading”. However, while ESR plasticity is associated with higher bleaching resistance
(maintenance of Symbiodinium densities, Fig. 3E), we find no relationship between bleaching
resistance and baseline ESR expression levels as observed in the same genotypes at the stable
offshore reef environment; the trend is in fact negative (Fig. 3F). The difference between
bleaching-resistance strategies (plasticity versus “frontloading”) may be due to the frequency at
.CC-BY-NC-ND 4.0 International licensepeer-reviewed) is the author/funder. It is made available under aThe copyright holder for this preprint (which was not. http://dx.doi.org/10.1101/059667doi: bioRxiv preprint first posted online Jun. 18, 2016;

9
which coral populations are exposed to thermal stress events. The dominant cycle of temperature
fluctuations in the Florida Keys occurs on an annual scale4, while the corals studied by Barshis et
al. (2013) experience dominant fluctuations on a daily basis, during tidal cycles. Theory predicts
that constitutive expression of an adaptive phenotype will be favored over plasticity if the
environment fluctuates more rapidly than the typical response time16. The constitutive up-
regulation of ESR genes by corals in tidal pools8 suggests that these populations integrate over
the periodicity of stress events, analogous to a constant stress environment. In contrast, the
variable expression of ESR genes in inshore coral populations observed here suggests that these
corals have adopted an alternate solution, employing adaptive plasticity to cope with annual
cycles of temperature variation in the Florida Keys.
Taken together, our results show that inshore corals from a more variable thermal
environment developed an ability to more dynamically regulate expression of environmental
stress response genes, which is associated with maintenance of Symbiodinium densities following
thermal stress. Understanding the capacity of coral populations to adapt or acclimatize to local
thermal stress is paramount for predicting coral responses to future climate change. Plasticity
may accelerate evolution by facilitating mutational and genetic variance22 as well as by allowing
coral populations to exploit novel emerging conditions23. Future work should aim to investigate
how different strategies of constitutive “frontloading” and expression plasticity affect the
capacity of coral populations to adapt to changing climates in the long term.
.CC-BY-NC-ND 4.0 International licensepeer-reviewed) is the author/funder. It is made available under aThe copyright holder for this preprint (which was not. http://dx.doi.org/10.1101/059667doi: bioRxiv preprint first posted online Jun. 18, 2016;
10
METHODS
Sample collection and processing
The transplantation experiment as been fully described in 4. Briefly, fifteen genotypes
(individual colonies) of Porites astreoides from an inshore and an offshore reef in the Lower
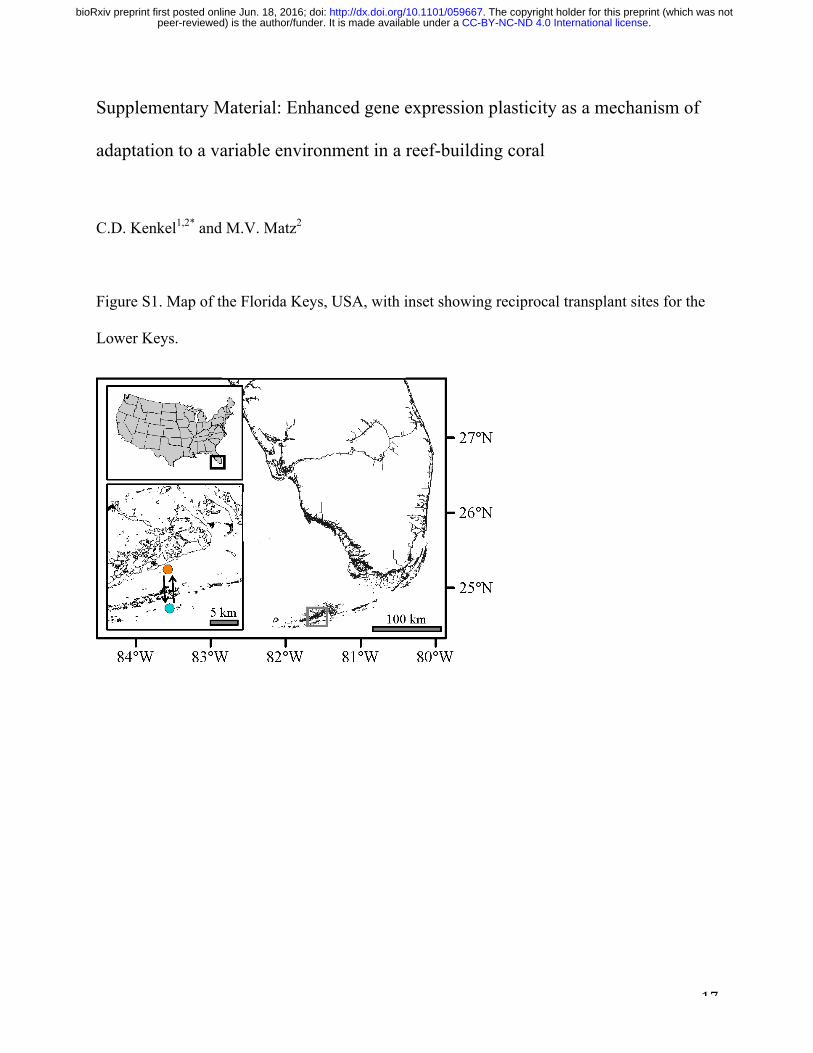
Florida Keys, USA, were fragmented and outplanted at native and foreign sites (Fig. S1) under
Florida Keys National Marine Sanctuary permit #2011-115. Following one year of
transplantation coral growth rates, energetic stores (total protein, lipid and carbohydrate content),
symbiont densities and chlorophyll content were measured for each genotype. Immediately upon
field collection, 1-cm2 tissue samples were taken from each coral fragment and preserved in
RNALater (Ambion, Life Technologies) on ice. Samples were stored at -80ºC until processing.
Total RNA was extracted using RNAqueous kit (Ambion, Life Technologies), with minor
modifcations. Briefly, samples homogenized in lysis buffer were kept on ice for one hour with
occasional vortexing to increase RNA yields, which was followed by centrifugation for 2
minutes at 16100 rcf to precipitate skeleton fragments and other insoluble debris; 700 µl of the
supernatant was used for RNA purification. At the final elution step, the same 25 µl of elution
buffer was passed twice through the spin column to maximize the concentration of eluted RNA.
Samples were DNAse treated as in 24. One µg of total RNA per sample was used for tag-based
RNA-seq, or TagSeq 5, with modifications for sequencing on the Illumina platform. TagSeq was
recently demonstrated to generate more accurate estimates of protein-coding transcript
abundances than standard RNA-seq, at a fraction of the cost 6.
Bioinformatic analysis
A total of 45 libraries prepared from each biological sample were sequenced on the
Illumina HiSeq 2500 at UT Austin’s Genome Sequencing and Analysis Facility. Though 60
.CC-BY-NC-ND 4.0 International licensepeer-reviewed) is the author/funder. It is made available under aThe copyright holder for this preprint (which was not. http://dx.doi.org/10.1101/059667doi: bioRxiv preprint first posted online Jun. 18, 2016;
11
samples were originally outplanted, nine were lost due to hurricane damage 4 and six more were
discarded during sample preparation for poor RNA or cDNA quality. Resulting sample sizes per
origin to transplant group were inshore to inshore (n=11), inshore to offshore (n=9), offshore to
inshore (n=13) and offshore to offshore (n=12). Overall, 527.9 million raw reads were generated,
with individual counts ranging from 3.2 to 26.3 million per sample (median = 11.1 million reads,
NCBI SRA:NNNN). A custom perl script was used to discard reads sharing the same sequence
of the read and degenerate adaptor (PCR duplicates) and trim the leader sequence from
remaining reads. The fastx_toolkit (http://hannonlab.cshl.edu/fastx_toolkit) was then used to trim
reads after a homopolymer run of ‘A’ ≥ 8 bases was encountered, retain reads with minimum
sequence length of 20 bases, and quality filter, requiring PHRED of at least 20 over 90% of the
read. 0.3 to 2.1 million reads per sample (median = 0.9 million reads) remained after quality
filtering. The Porites astreoides transcriptome 25 was concatenated to a Symbiodinium Clade A
reference 26, as P. astreoides host A4/A4a-type symbionts in the Florida Keys 3,27. Filtered reads
were mapped to this combined reference transcriptome with Bowtie2 28, using the –sensitive-
local flag. Read counts were assembled by isogroup (i.e. groups of sequences putatively
originating from the same gene, or with sufficiently high sequence similarity to justify the
assumption that they serve the same function) using a custom perl script. Reads mapping to
multiple isogroups were discarded. This count file was split into host-specific and symbiont-
specific isogroup files for subsequent analyses. In total, 137,542 to 769,503 unique reads per
sample (median=354,184 reads) mapped to 26,000 host isogroups and 7,393 to 66,623 unique
reads per sample (median=26,760 reads) mapped to 21,257 symbiont isogroups.
.CC-BY-NC-ND 4.0 International licensepeer-reviewed) is the author/funder. It is made available under aThe copyright holder for this preprint (which was not. http://dx.doi.org/10.1101/059667doi: bioRxiv preprint first posted online Jun. 18, 2016;

12
Differential expression, co-expression network and functional enrichment analyses
Analyses were carried out in the R statistical environment 29. Low expression genes
(those with less than 10 counts in more than 90% of samples) were removed from the dataset,
leaving 7,008 and 1,174 highly expressed genes in the host and symbiont datasets, respectively.
Gene counts in both the host and symbiont datasets were normalized and log-transformed using a
regularized log transform with the command rlog() in DESeq2 30 for subsequent analyses.
A discriminant analysis of principal components (DAPC) was used to compare
expression of all 7,008 highly expressed genes for host corals, and 1,174 genes for symbionts
using the adegenet package 31,32. A discriminant function was built by defining native
transplants as groups (inshore corals transplanted to inshore reefs, and offshore corals
transplanted to offshore reefs). Group memberships were then predicted for the transplant
samples based on the DAPC scores for the native populations. The difference between native and
non-native expression was calculated within individual genotypes as a metric of expression
plasticity and an unequal variances t-test was used to compare population means for hosts and
symbionts.
WGCNA analysis was carried out following tutorials for undirected WGCNA 7,33,34. The
analysis is blind to experimental design and involves four steps: (1) Pearson correlations for all
gene pairs across all samples are computed to construct a similarity matrix of gene expression,
retaining the sign of the expression change (“signed networks”); (2) Expression correlations are
transformed into connection strengths (connectivities) through a power adjacency function, using
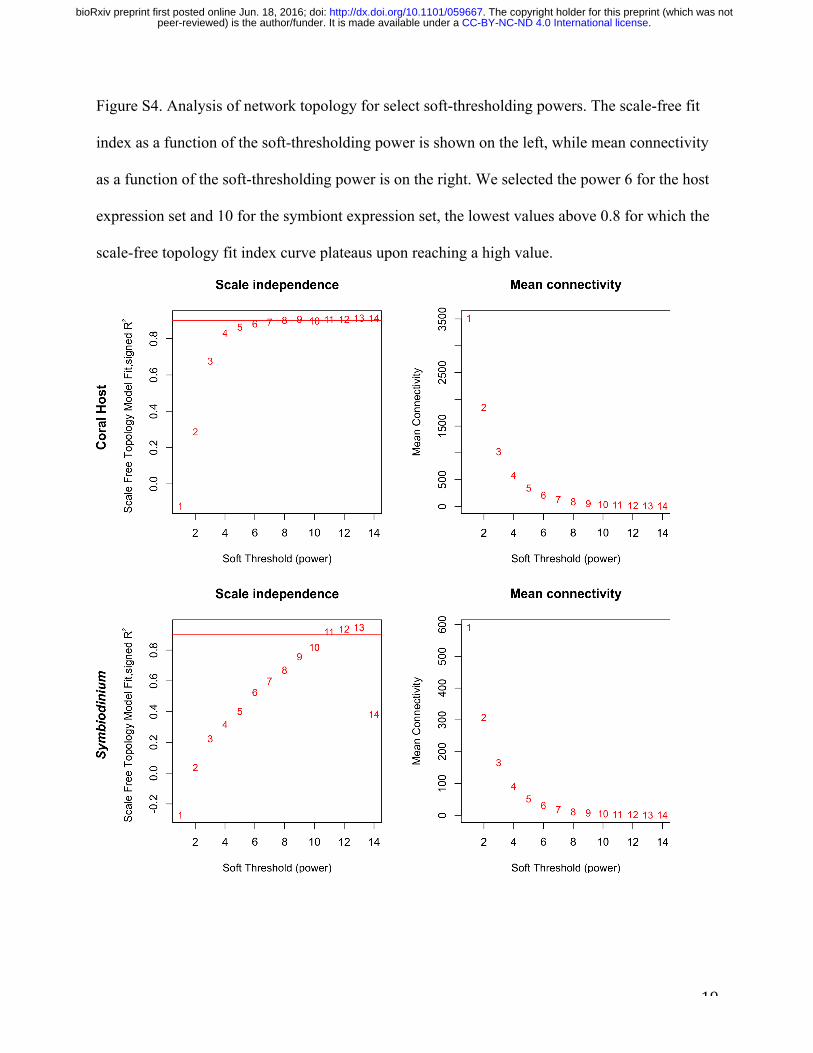
a soft thresholding power of 6 for the host and 10 for the symbiont, based on the scale-free
topology fit index (Fig. S4); (3) Hierarchical clustering of genes based on topological overlap
(sharing of network neighborhood) is performed to identify groups of genes whose expression
.CC-BY-NC-ND 4.0 International licensepeer-reviewed) is the author/funder. It is made available under aThe copyright holder for this preprint (which was not. http://dx.doi.org/10.1101/059667doi: bioRxiv preprint first posted online Jun. 18, 2016;
13
covaries across samples (network modules), retaining modules with at least 30 genes and
merging highly similar modules (with module eigengenes correlated at R>0.85) (Fig. S5,6) ; and
(4) External trait data is related to the expression of inferred modules (Fig. 2).
Functional enrichment analyses were conducted using the GO_MWU package in R
(https://github.com/z0on/GO_MWU) to identify over-representation of particular functional
groups within modules of the host and symbiont datasets, based on Gene Ontology (GO)
classification 35. For each GO term, the number of annotations assigned to genes within a module
was compared to the number of annotations assigned to the rest of the dataset, to evaluate
whether any ontologies were more highly represented within the module than expected by
chance (Fisher’s exact test).
Selection gradient estimation
We quantified the costs of stress response expression plasticity for inshore and offshore
populations by relating fitness to mean expression of the 40 genes comprising the ‘cellular
response to stress’ functional enrichment (Table S1) at native reefs and the difference in
expression between environments following 19,20. Relative fitness was defined as the growth of
an individual genotype at its native reef relative to the maximum possible weight gained by a
coral within each environment 4. Mean expression level and the difference in expression in
response to transplantation (i.e. expression plasticity) were calculated for individual genotypes
using standardized DAPC scores for this gene subset.
Code availability
The current protocol and bioinformatics scripts for TagSeq are maintained at
https://github.com/z0on/tag-based_RNAseq. R scripts and input files for conducting the gene
expression and statistical analyses described here can be found on Dryad: NNNNN. R scripts and
.CC-BY-NC-ND 4.0 International licensepeer-reviewed) is the author/funder. It is made available under aThe copyright holder for this preprint (which was not. http://dx.doi.org/10.1101/059667doi: bioRxiv preprint first posted online Jun. 18, 2016;

14
example input files for the GO_MWU package are actively maintained at
https://github.com/z0on/GO_MWU.
AUTHOR CONTRIBUTIONS
CDK and MVM conceived and designed experiments. CDK performed experiments, analyzed
data and wrote the first draft of the manuscript. Both authors contributed to revisions.
ACKNOWLEDGEMENTS G Aglyamova completed library preparation of samples for Illumina sequencing. M Strader
created the GIS map of the Florida Keys. Funding for this study was provided by NSF DDIG
award DEB-1311220 to CDK and MVM.
.CC-BY-NC-ND 4.0 International licensepeer-reviewed) is the author/funder. It is made available under aThe copyright holder for this preprint (which was not. http://dx.doi.org/10.1101/059667doi: bioRxiv preprint first posted online Jun. 18, 2016;
15
REFERENCES 1 Hereford, J. A quantitative survey of local adaptation and fitness trade-offs. The
American Naturalist 173, 579-588 (2009). 2 Savolainen, O., Lascoux, M. & Merila, J. Ecological genomics of local adaptation.
Nature Reviews Genetics 14, 807-820 (2013). 3 Kenkel, C. et al. Evidence for a host role in thermotolerance divergence between
populations of the mustard hill coral (Porites astreoides) from different reef environments. Molecular Ecology 22, 4335-4348 (2013).
4 Kenkel, C. D., Almanza, A. T. & Matz, M. V. Fine-scale environmental specialization of reef-building corals might be limiting reef recovery in the Florida Keys. Ecology 96, 3197-3212 (2015).
5 Meyer, E., Aglyamova, G. V. & Matz, M. V. Profiling gene expression responses of coral larvae (Acropora millepora) to elevated temperature and settlement inducers using a novel RNA-Seq procedure. Molecular Ecology, doi:10.1111/j.1365-294X.2011.05205.x (2011).
6 Lohman, B. K., Weber, J. N. & Bolnick, D. I. Evaluation of TagSeq, a reliable low-cost alternative for RNAseq. Molecular Ecology Resources, doi:DOI: 10.1111/1755-0998.12529 (2016).
7 Langfelder, P. & Horvath, S. WGCNA: an R package for weighted correlation network analysis. BMC Bioinformatics 9, 559 (2008).
8 Barshis, D. et al. Genomic basis for coral resilience to climate change. Proceedings of the National Academy of Sciences of the United States of America 110, 1387-1392 (2013).
9 Lopez-Maury, L., Marguerat, S. & Bahler, J. Tuning gene expression to changing environments: from rapid responses to evolutionary adaptation Nature Reviews Genetics 9, 583-593, doi:10.1038/nrg2500 (2008).
10 Boyer, J., Briceño, H., Absten, J., Gilliam, D. & Dodge, D. 2011 Annual Report of the Water Quality Monitoring Project for the Southeast Florida Coral Reef Initiative (SEFCRI). (Available from: http://digitalcommons.fiu.edu/sercrp/72, 2011).
11 Kenkel, C. D., Setta, S. P. & Matz, M. V. Heritable differences in fitness-related traits among populations of the mustard hill coral, Porites astreoides. Heredity 115, 509-516, doi:doi: 10.1038/hdy.2015.52 (2015).
12 Yonge, C. M. & Nicholls, A. G. Studies on the physiology of corals. IV. The structure, distribution and physiology of the zooxanthellae. Sci Rep Gr Barrier Reef Exped 1928-29 1, 135-176 (1931).
13 Berkelmans, R. & van Oppen, M. J. H. The role of zooxanthellae in the thermal tolerance of corals: a 'nugget of hope' for coral reefs in an era of climate change. Proceedings of the Royal Society B-Biological Sciences 273, 2305-2312, doi:10.1098/rspb.2006.3567 (2006).
14 Oliver, T. A. & Palumbi, S. R. Many corals host thermally resistant symbionts in high-temperature habitat. Coral Reefs 30, 241-250 (2011).
15 Hill, R. & Ralph, P. J. Photosystem II heterogeneity of in hospite zooxanthellae in scleractinian corals exposed to bleaching conditions. Photochemistry and Photobiology 82, 1577-1585, doi:10.1111/j.1751-1097.2006.tb09814.x (2006).
16 Schlichting, C. D. & Pigliucci, M. Phenotypic Evolution: A Reaction Norm Perspective. (Sinauer Associates Inc, 1998).
.CC-BY-NC-ND 4.0 International licensepeer-reviewed) is the author/funder. It is made available under aThe copyright holder for this preprint (which was not. http://dx.doi.org/10.1101/059667doi: bioRxiv preprint first posted online Jun. 18, 2016;

16
17 Aubin-Horth, N. & Renn, S. C. Genomic reaction norms: using integrative biology to understand molecular mechanisms of phenotypic plasticity. Molecular Ecology 18, 3763-3780 (2009).
18 Sørensen, J. G., Kristensen, T. N. & Loeschcke, V. The evolutionary and ecological role of heat shock proteins. Ecology Letters 6, 1025-1037 (2003).
19 Van Tienderen, P. H. Evolution of generalists and specialists in spatially heterogenous environments. Evolution 45, 1317-1331 (1991).
20 DeWitt, T. J., Sih, A. & Wilson, D. S. Costs and limits of phenotypic plasticity. Trends in Ecology and Evolution 13, 77-81 (1998).
21 Hendry, A. P. Key questions on the role of phenotypic plasticity in eco-evolutionary dynamics. Journal of Heredity, 1-17, doi:doi:10.1093/jhered/exv060 (2015).
22 Draghi, J. A. & Whitlock, M. C. Phenotypic plasticity facilitates mutational variance, genetic variance, and evolvability along the major axis of environmental variation. Evolution 66, 2891-2902 (2012).
23 Yeh, P. J. & Price, T. D. Adaptive phenotypic plasticity and the successful colonization of a novel environment. American Naturalist 164, 531-542 (2004).
24 Kenkel, C. et al. Development of gene expression markers of acute heat-light stress in reef-building corals of the genus Porites. . PLoS ONE 6, e26914, doi:10.1371/journal.pone.0026914 (2011).
25 Kenkel, C., Meyer, E. & Matz, M. Gene expression under chronic heat stress in populations of the mustard hill coral (Porites astreoides) from different thermal environments. Molecular Ecology 22, 4322-4334, doi:MEC12390 (2013).
26 Bayer, T. et al. Symbiodinium Transcriptomes: Genome Insights into the Dinoflagellate Symbionts of Reef-Building Corals. Plos One 7 (2012).
27 Thornhill, D. J., Fitt, W. K. & Schmidt, G. W. Highly stable symbioses among western Atlantic brooding corals. Coral Reefs 25, 515-519, doi:10.1007/s00338-006-0157-y (2006).
28 Langmead, B. & Salzbert, S. Fast gapped-read alignment with Bowtie 2. Nature Methods 9, 357-359 (2012).
29 R: A language and environment for statistical computing (R Foundation for Statistical Computing, Vienna, 2013).
30 Love, M. I., Huber, W. & Anders, S. Moderated estimation of fold change and dispersion for RNA-Seq data with DESeq2. Genome Biology 15, 550 (2014).
31 Jombart, T. adegenet: an R package for the multivariate analysis of genetic markers. Bioinformatics 24, 1403-1405 (2008).
32 Jombart, T., Devillard, S. & Balloux, F. Discriminant analysis of principal components: a new method for the analysis of genetically structured populations. BMC Genetics 11, 94, doi:doi:10.1186/1471-2156-11-94 (2010).
33 Langfelder, P. & Horvath, S. Fast R functions for robust correlations and hierarchical clustering. Journal of Statistical Software 46, 1-17 (2012).
34 Langfelder, P. & Horvath, S. Tutorials for the WGCNA package, <http://labs.genetics.ucla.edu/horvath/CoexpressionNetwork/Rpackages/WGCNA/Tutorials/> (2014).
35 Consortium, T. G. O. Gene Ontology: tool for the unification of biology. Nature Genetics 25, 25-29 (2000).
.CC-BY-NC-ND 4.0 International licensepeer-reviewed) is the author/funder. It is made available under aThe copyright holder for this preprint (which was not. http://dx.doi.org/10.1101/059667doi: bioRxiv preprint first posted online Jun. 18, 2016;
17
Supplementary Material: Enhanced gene expression plasticity as a mechanism of
adaptation to a variable environment in a reef-building coral
C.D. Kenkel1,2* and M.V. Matz2
Figure S1. Map of the Florida Keys, USA, with inset showing reciprocal transplant sites for the
Lower Keys.
.CC-BY-NC-ND 4.0 International licensepeer-reviewed) is the author/funder. It is made available under aThe copyright holder for this preprint (which was not. http://dx.doi.org/10.1101/059667doi: bioRxiv preprint first posted online Jun. 18, 2016;
18
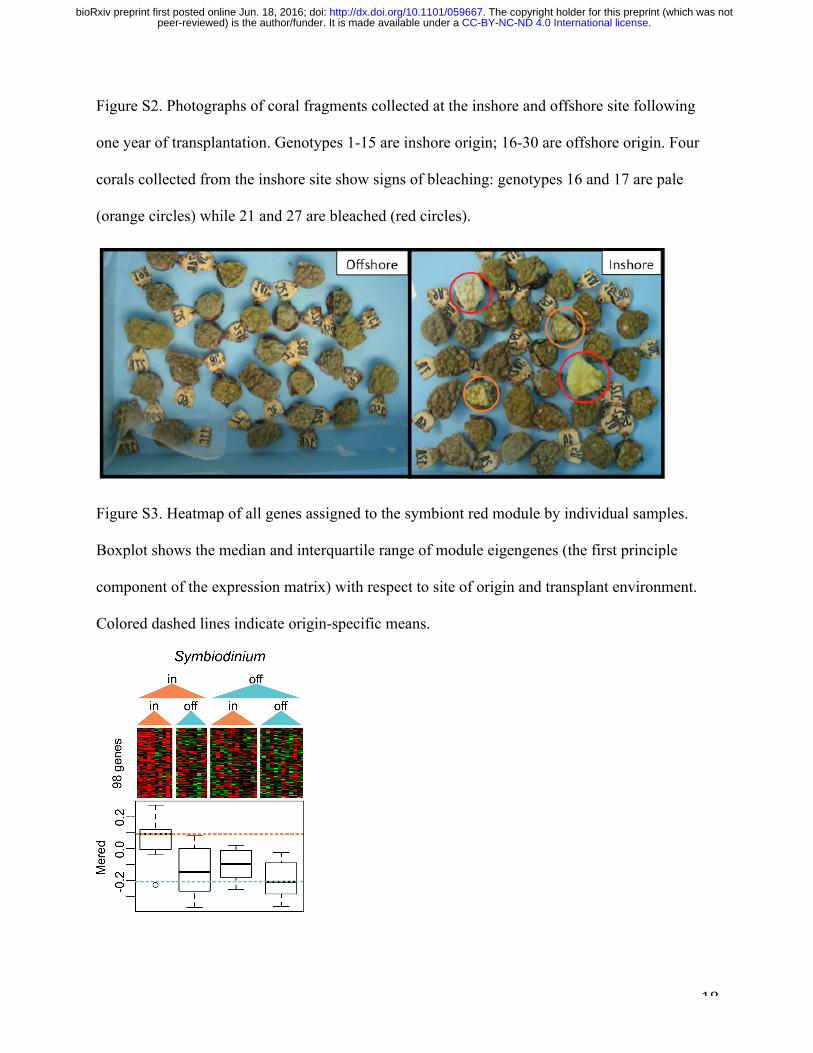
Figure S2. Photographs of coral fragments collected at the inshore and offshore site following
one year of transplantation. Genotypes 1-15 are inshore origin; 16-30 are offshore origin. Four
corals collected from the inshore site show signs of bleaching: genotypes 16 and 17 are pale
(orange circles) while 21 and 27 are bleached (red circles).
Figure S3. Heatmap of all genes assigned to the symbiont red module by individual samples.
Boxplot shows the median and interquartile range of module eigengenes (the first principle
component of the expression matrix) with respect to site of origin and transplant environment.
Colored dashed lines indicate origin-specific means.
.CC-BY-NC-ND 4.0 International licensepeer-reviewed) is the author/funder. It is made available under aThe copyright holder for this preprint (which was not. http://dx.doi.org/10.1101/059667doi: bioRxiv preprint first posted online Jun. 18, 2016;
19
Figure S4. Analysis of network topology for select soft-thresholding powers. The scale-free fit
index as a function of the soft-thresholding power is shown on the left, while mean connectivity
as a function of the soft-thresholding power is on the right. We selected the power 6 for the host
expression set and 10 for the symbiont expression set, the lowest values above 0.8 for which the
scale-free topology fit index curve plateaus upon reaching a high value.
.CC-BY-NC-ND 4.0 International licensepeer-reviewed) is the author/funder. It is made available under aThe copyright holder for this preprint (which was not. http://dx.doi.org/10.1101/059667doi: bioRxiv preprint first posted online Jun. 18, 2016;
20
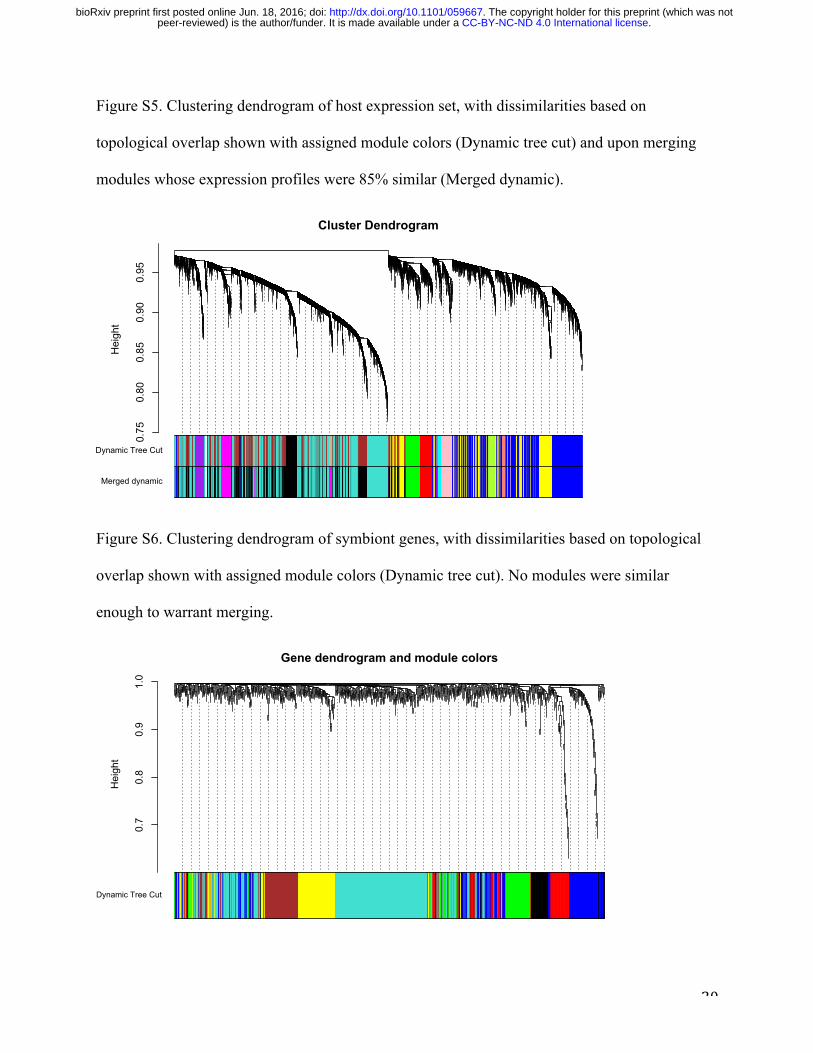
Figure S5. Clustering dendrogram of host expression set, with dissimilarities based on
topological overlap shown with assigned module colors (Dynamic tree cut) and upon merging
modules whose expression profiles were 85% similar (Merged dynamic).
Figure S6. Clustering dendrogram of symbiont genes, with dissimilarities based on topological
overlap shown with assigned module colors (Dynamic tree cut). No modules were similar
enough to warrant merging.
0.75
0.80
0.85
0.90
0.95
Cluster Dendrogram
hclust (*, "average")d
Height
Dynamic Tree Cut
Merged dynamic
0.7
0.8
0.9
1.0
Gene dendrogram and module colors
hclust (*, "average")d
Height
Dynamic Tree Cut
.CC-BY-NC-ND 4.0 International licensepeer-reviewed) is the author/funder. It is made available under aThe copyright holder for this preprint (which was not. http://dx.doi.org/10.1101/059667doi: bioRxiv preprint first posted online Jun. 18, 2016;

21
Table S1. Top gene ontology (GO) terms resulting from functional enrichment analysis of
significant co-expression modules for host and symbiont.
Top GO enrichment (P-value*)
Partner Module #genes Biological Process Cellular Component Molecular Function
Host Turquoise 1781 Cellular response to stress (0.0003)
Endoplasmic reticulum (0.01)
O-methyltransferase activity/growth factor binding
(0.002)
Host Black 1506 Cell-cell adhesion‡ (0.0004)
Signal recognition particle∫ (0.008)
Kinase activity (0.0003)
Host Blue 1502 Small molecule metabolic process (8.0 x 10⁻⁷) Mitochondrial part (0.002) Threonine-type endopeptidase
activity (4.3 x 10⁻⁵)
Host Yellow 814 Ribosome biogenesis (1.0 x 10⁻¹⁵)
Ribosomal subunit (1.0 x 10⁻¹⁵)
Structural constituent of ribosome (1.0 x 10⁻¹⁵)
Host Magenta 284 Cellular catabolic process (0.03) Bounding membrane of organelle (0.02) Nuclease activity (0.01)
Host Green 252 Organic hydroxy compound transport (0.13) Transferase complex (0.05) Lipase activity (0.008)
Host Red 209 Cellular modified amino acid metabolic process (0.01)
Membrane protein complex (0.03) Lyase activity (0.005)
Host Pink 188 Inorganic anion transport (0.0002) Collagen trimer (4.7 x 10⁻⁷) Extracellular matrix structural constituent (6.5 x 10⁻⁷)
Host Purple 155 Regulation of cellular metabolic process (2.6 x 10⁻⁶)
Extracellular matrix (0.0003)
Transcription factor activity^ (3.5 x 10⁻⁷)
Host Greenyellow 116 Cellular carbohydrate metabolic process (0.008) Nucleoplasm part (0.08) Lipid binding (0.004)
Host Cyan 63 Positive regulation of biological process (0.005)
Plasma membrane protein complex (0.0004) Glucosidase activity (0.005)
Host Salmon 63 DNA metabolic process (0.0006) Chromosomal part (0.01) DNA binding (0.004)
Host Midnightblue 44 Protein modification# (0.03) Muscle thin filament tropomyosin (0.002)
Oxidoreductase activity$ (1.8 x 10⁻⁵)
Host Lightcyan 31 Proteolysis (0.0002) None Serine hydrolase activity (1.2 x 10-09)
Sym Turquoise 411 RNA processing (0.003) Nucleoplasm part (0.002) Isomerase activity (0.006)
Sym Blue 193 Electron transport chain (0.0003) Mitochondrial inner membrane (0.0002)
H+ ion transmembrane transporter activity (0.008)
Sym Brown 145 Macromolecule biosynthetic process (0.02) Vacuole (0.08) Nuclease activity (0.1)
Sym Yellow 139 Regulation of protein metabolic process (0.01)
Endoplasmic reticulum membrane (0.006)
2 iron, 2 sulfur cluster binding (0.01)
Sym Green 120 Protein-chromophore linkage (5.8 x 10⁻⁵) Plastid (0.004) Chlorophyll binding (0.0008)
Sym Red 98 Microtubule-based process (0.02) Photosystem (0.01) Protein dimerization activity (0.05)
Sym Black 68 Intracellular signal transduction (0.01)
Golgi apparatus (0.02) Symporter activity (0.003)
* Fisher’s exact test uncorrected p-value ^ sequence-specific DNA binding ‡ via plasma-membrane adhesion molecules # by small protein conjugation ∫ endoplasmic reticulum targeting $ acting on NAD(P)H, oxygen as acceptor
.CC-BY-NC-ND 4.0 International licensepeer-reviewed) is the author/funder. It is made available under aThe copyright holder for this preprint (which was not. http://dx.doi.org/10.1101/059667doi: bioRxiv preprint first posted online Jun. 18, 2016;