enhanced pool-boiling heat transfer and critical heat flux...
TRANSCRIPT

1
Enhanced Pool-Boiling Heat Transfer and Critical Heat Flux on Femtosecond Laser Processed
Stainless Steel Surfaces
Corey M. Kruse
1, Troy Anderson
2, Chris Wilson
2, Craig Zuhlke
2, Dennis Alexander
2, George Gogos
1, Sidy Ndao*
1
University of Nebraska - Lincoln, 1Mechanical and Materials Engineering
2Electrical Engineering
Lincoln, Nebraska, U.S., 68588
*Email: [email protected]
ABSTRACT
In this paper, we present an experimental investigation of pool boiling heat transfer on multiscale
(micro/nano) functionalized metallic surfaces. Heat transfer enhancement in metallic surfaces is very
important for large scale high heat flux applications like in the nuclear power industry. The multiscale
structures were fabricated via a femtosecond laser surface process (FLSP) technique, which forms self-
organized mound-like microstructures covered by layers of nanoparticles. Using a pool boiling
experimental setup with deionized water as the working fluid, both the heat transfer coefficients and
critical heat flux were investigated. A polished reference sample was found to have a critical heat flux of
91 W/cm2 at 40 °C of superheat and a maximum heat transfer coefficient of 23,000 W/m
2-K. The
processed samples were found to have a maximum critical heat flux of 142 W/cm2 at 29 °C and a
maximum heat transfer coefficient of 67,400 W/m2-K. It was found that the enhancement of the critical
heat flux was directly related to the wetting and wicking ability of the surface which acts to replenish the
evaporating liquid and delay critical heat flux. The heat transfer coefficients were also found to increase
when the surface area ratio was increased as well as the microstructure peak-to-valley height. Enhanced
nucleate boiling is the main heat transfer mechanism, and is attributed to an increase in surface area and
nucleation site density.
KEY WORDS: Pool Boiling, Critical Heat Flux, Femtosecond Laser Surface Processing, Heat Transfer
Coefficients, Metallic Enhanced Heat Transfer Surfaces

2
INTRODUCTION
Two-phase heat transfer on micro and nanostructured surfaces has attracted much research interest in
recent time [1]. This is due to the observed high heat transfer coefficients and critical heat flux. Most pool
boiling experiments for enhanced heat transfer have been conducted on micro and nanostructured surfaces
fabricated using complex fabrication techniques such as etching and thin film depositions carried out in
highly controlled environments (i.e., cleanroom). These techniques have been very effective at increasing
the critical heat flux (CHF) as well as heat transfer coefficients (HTC) through a combination of increased
surface roughness, wettability, and porosity. These microfabrication techniques have been used to create
very organized arrays of microstructures ranging from pillars to microchannels and have demonstrated
CHF values of 100 – 200 W/cm2 [2]–[4] for pillars and 100 W/cm
2 [5] for microchannels. When nanoscale
features are added to these microstructures, the critical heat flux can be further increased. Values as high as
230 W/cm2 [2] have been reported, showing that hierarchical structures can significantly increase the
performance of heat transfer surfaces. In addition to surface microstructuring, it has also been shown that
varying surface chemistry, such as provided by a combination or network of hydrophilic and hydrophobic
areas on a surface can significantly enhance the heat transfer performance as well. Hydrophobic surfaces
lead to easily activated nucleation sites, a decrease in the onset of nucleate boiling, and possible increase in
heat transfer coefficients, but result in a much lower critical heat flux [6]–[8]. Hydrophilic surfaces
meanwhile delay the formation of a stable vapor layer from forming and thus delaying the critical heat
flux. A combination of these types of surfaces allows for an optimization of the heat transfer performance
[6]–[9].
In addition to microstructures, silicon and copper nanowire coatings have also been used for two-phase
heat transfer enhancement. These types of surfaces have been shown to produce CHF values in the range of
120-250 W/cm2 [10]–[12]. Such CHF enhancements have been attributed to high nucleation site density,
superhydrophilicity, and enhanced capillary wicking.

3
All of the previously mentioned experimental results were obtained with a heat transfer surface
comprised of a silicon base material which is advantageous in small applications such as electronics
cooling. These types of surface enhancement techniques are, however, not practical for applications which
require metallic heat transfer surfaces and much larger areas.
The enhancement of heat transfer using metallic surfaces is especially important for large scale
operations like in the nuclear power plant industry. Some work has been done to enhance heat transfer with
a metallic base surface using techniques such as anodizing processes or material deposition to achieve the
desired micro/nanostructures; however these techniques are often applicable to a limited type of base
material. For zircaloy-4 (commonly used in the nuclear industry), it has been shown that the critical heat
flux can be increased up to about 200 W/cm2 by using a simple anodizing method [13], [14]. This work
resulted in a very good enhancement of the critical heat flux but no real enhancement of the heat transfer
coefficients. In other studies, alumina was deposited onto platinum using atomic layer deposition [15] and
zinc oxide was deposited onto copper and aluminum surfaces in order to enhance two-phase heat transfer
[16]. The alumina deposition on platinum resulted in a CHF of around 120 W/cm2 while the zinc oxide
covered surface only reached maximum heat fluxes of about 80 W/cm2. Both techniques resulted in an
enhancement of the heat transfer coefficients. Anodizing has also been applied to aluminum surfaces [17]
to induce a nanoporous layer. This resulted in a CHF of around 90 W/cm2 but minimal heat transfer
coefficient enhancement. Other enhancement techniques have also been applied to metallic surfaces such
as copper. Surface sintering and the addition of nanorods have been shown to increase the heat transfer
coefficients of both types of surfaces but with no major enhancement of the critical heat flux [18], [19].
The present study focuses on the pool boiling heat transfer performance of 304 stainless steel multiscale
micro/nano-structures fabricated via Femtosecond Laser Surface Processing (FLSP). FLSP uses an ultra-
fast laser to ablate and form a self-organized array of mound like microstructures with a nanoparticle layer
on nearly any metallic surface [20]. This method is a one step process that has the advantage of being able
to process nearly any size of area with a very high precision.

4
EXPERIMENTAL PROCEDURES
Surface Processing and Characterization
The impact of multiscale surface structures on the heat transfer coefficient and critical heat flux of
stainless steel was investigated through the characterization of four FLSP-generated samples with a
polished sample as a control. Structured surfaces fabricated via FLSP are characterized by a series of self-
organized quasi-periodic microstructure covered by a layer of nanoparticles[21]–[27]. Specific physical
characteristics including the peak to valley height, microstructure spacing, and nanoparticle layer thickness
are a function of the laser fluence and number of incident laser pulses. A schematic of the FLSP setup is
shown in Figure 1. The fabrication laser was a Ti:Sapphire (Spitfire, Spectra Physics) that produced ~50
femtosecond pulses with a central wavelength of 800 nm at a 1 kHz repetition rate. The laser power was
controlled through a combination of a half-wave plate and a polarizer. The pulses were focused using a
125 mm focal length plano-convex lens (PLCX-25.4-64.4-UV-670-1064) with a broadband antireflection
coating covering the laser spectrum. The sample was placed on a computer-controlled 3D translation stage
and translated through the beam path of the laser in order to process an area larger than the laser spot size.
The number of pulses incident on the sample was controlled by adjusting the translation speed of the
sample.

5
Fig.1 Schematic of the femtosecond laser surface processing (FLSP) used in present study
The defining physical characteristics for the samples analyzed in the present study as well as the laser
parameters used in fabrication are summarized in Table 1; scanning electron microscope (SEM) images
and 3D profiles of the samples are shown in Figure. 2. The 3D profiles of the sample surfaces were
generated using a 3D confocal laser scanning microscope (Keyence VK-X200). The Peak to Valley
Height, RMS surface roughness, and Surface Area Ratio (total area of the microstructures divided by the
projected area) are measured with the Keyence instrument. The separation between the microstructures is
determined by a 2D Fast Fourier Transform analysis of the SEM image.
Table 1: Physical characteristics of the 304 stainless steel analyzed samples.
The control sample in the present study was 304 stainless steel polished to a mirror finish through the
use of a series of buffing compounds. As can be seen from Fig. 2, the FLSP samples have mound like
microstructures surrounded by deep valleys. Although it cannot be seen from the SEM images in Figure 2,
the mound like microstructures are covered in a layer of nanoparticles [23], [28]. Samples S1 – S3 are a
series created with varying laser fluence but constant shot number (N = 840). The surface structures are
Below Surface Growth (BSG) Mounds as described in Ref [21]. A visual inspection of Figure 2
demonstrates that the microscale structures in this series are similar in shape, but increase in size and
separation. Quantitative analysis shows that these samples all have roughly equivalent surface area ratios,
but have concurrently increasing peak-to-valley height, RMS surface roughness, and microstructure
separation. Sample S4 was fabricated with a higher laser fluence in order to generate Above Surface
Growth (ASG) Mounds [21]; this sample is characterized by taller, narrower microstructures surrounded
by circular pits.
Sample Fluence (J/cm2) Number of Shots Peak to Valley Height (µm) Surface Roughness (µm) Surface Area Ratio Separation (µm)
Polished -- -- -- 0.22 1.09 --
S1 0.7 840 7.1 1.4 3.85 6.0
S2 1.4 840 22.3 4.6 3.79 15.9
S3 2.1 840 31.3 7.8 3.82 26.1
S4 4.1 230 35.8 7.4 4.7 20.1

6

7
Fig. 2 SEM and laser confocal microscope images of the femtosecond laser processed surfaces. Left –
Confocal microscope 3D profile, Right – SEM images
It is well known that the wetting and the wicking ability of a surface greatly affects its heat transfer
performance. The FLSP process has a significant impact on the wetting and wicking ability of the surface.
A Ramé -Hart Model 590 F4 Series Goniometer and Tensiometer was used to measure the contact angle of
both the polished and processed samples using deionized water. The contact angle of the polished surface
was found to be approximately 80° while FLSP surfaces all had contact angles of nearly zero. When a
small droplet is placed on each of the surfaces, the droplet is absorbed in its entirety into the surface in a
very fast manner. The surfaces are considered superwicking because the wetting front easily spreads across
the entire surface in a matter of a few seconds as confirmed by flow visualization using a high speed
camera. The superwicking behavior is attributed to the presence of the porous layer of nanoparticles that
induces high capillary wicking actions
Pool Boiling Experimental Setup and Procedure
A closed system pool boiling experimental setup was used for the heat transfer experiments. This setup
is highlighted in Figure 3. The experimental setup was designed to accommodate a variety of working
fluids. For the presented results, the test rig was filled with eight liters of deionized water. The system was
brought to the saturation temperature of the water at atmospheric pressure by the use of an immersion
heater (Omega - MT-112E2/120V) controlled by an analog variac. The water temperature and internal
pressure were monitored with the use of two K-type thermocouples (Omega - M12KIN-18-U-6-D) and a
pressure transducer (Omega - MMA100V5P4C0T4A5CE) connected to a National Instrument Data
Acquisition Board. The water was degassed for a half hour before measurements were taken; the
evaporated water was directed through a coil condenser (Quark Glass - qc-6-4sp) and noncondensable
gases were vented to the atmosphere. The condenser was supplied with cold water with the use of a chiller.
The experimental setup also includes a bladder accumulator for regulating the overall system pressure. This
8
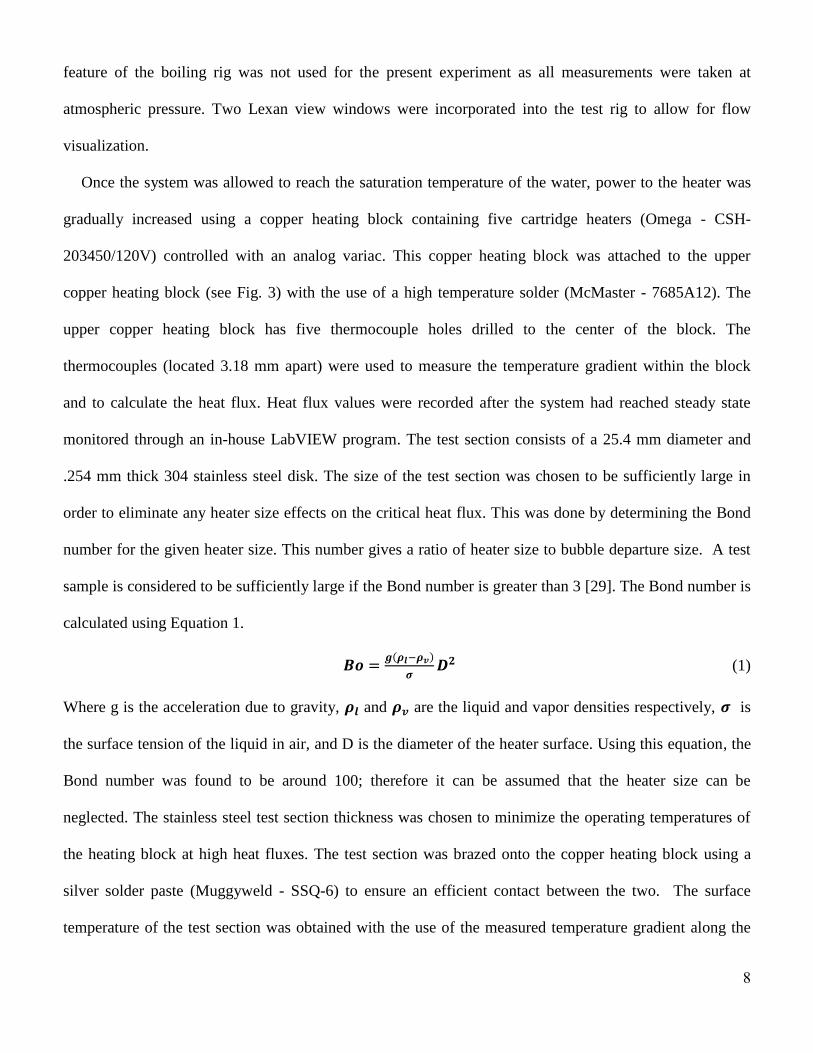
feature of the boiling rig was not used for the present experiment as all measurements were taken at
atmospheric pressure. Two Lexan view windows were incorporated into the test rig to allow for flow
visualization.
Once the system was allowed to reach the saturation temperature of the water, power to the heater was
gradually increased using a copper heating block containing five cartridge heaters (Omega - CSH-
203450/120V) controlled with an analog variac. This copper heating block was attached to the upper
copper heating block (see Fig. 3) with the use of a high temperature solder (McMaster - 7685A12). The
upper copper heating block has five thermocouple holes drilled to the center of the block. The
thermocouples (located 3.18 mm apart) were used to measure the temperature gradient within the block
and to calculate the heat flux. Heat flux values were recorded after the system had reached steady state
monitored through an in-house LabVIEW program. The test section consists of a 25.4 mm diameter and
.254 mm thick 304 stainless steel disk. The size of the test section was chosen to be sufficiently large in
order to eliminate any heater size effects on the critical heat flux. This was done by determining the Bond
number for the given heater size. This number gives a ratio of heater size to bubble departure size. A test
sample is considered to be sufficiently large if the Bond number is greater than 3 [29]. The Bond number is
calculated using Equation 1.
𝑩𝒐 =𝒈(𝝆𝒍−𝝆𝒗)
𝝈𝑫𝟐 (1)
Where g is the acceleration due to gravity, 𝝆𝒍 and 𝝆𝒗 are the liquid and vapor densities respectively, 𝝈 is
the surface tension of the liquid in air, and D is the diameter of the heater surface. Using this equation, the
Bond number was found to be around 100; therefore it can be assumed that the heater size can be
neglected. The stainless steel test section thickness was chosen to minimize the operating temperatures of
the heating block at high heat fluxes. The test section was brazed onto the copper heating block using a
silver solder paste (Muggyweld - SSQ-6) to ensure an efficient contact between the two. The surface
temperature of the test section was obtained with the use of the measured temperature gradient along the
9
heating block. The contact resistance between the copper and stainless steel was neglected due to the very
thin and the highly conductive silver solder braze used. A high temperature PEEK plastic insulating
bushing was used to insulate the upper copper heating block. Fiberglass insulation (not shown in Fig. 3)
was used to insulate the lower copper heating block. High temperature silicon o-rings were used to seal
between the concentric heating and insulating pieces. To ensure that nucleation would not prematurely
occur on the outer edges of the boiling surface, a special epoxy (Mcmaster - 7513A1) was used for bonding
dissimilar materials.
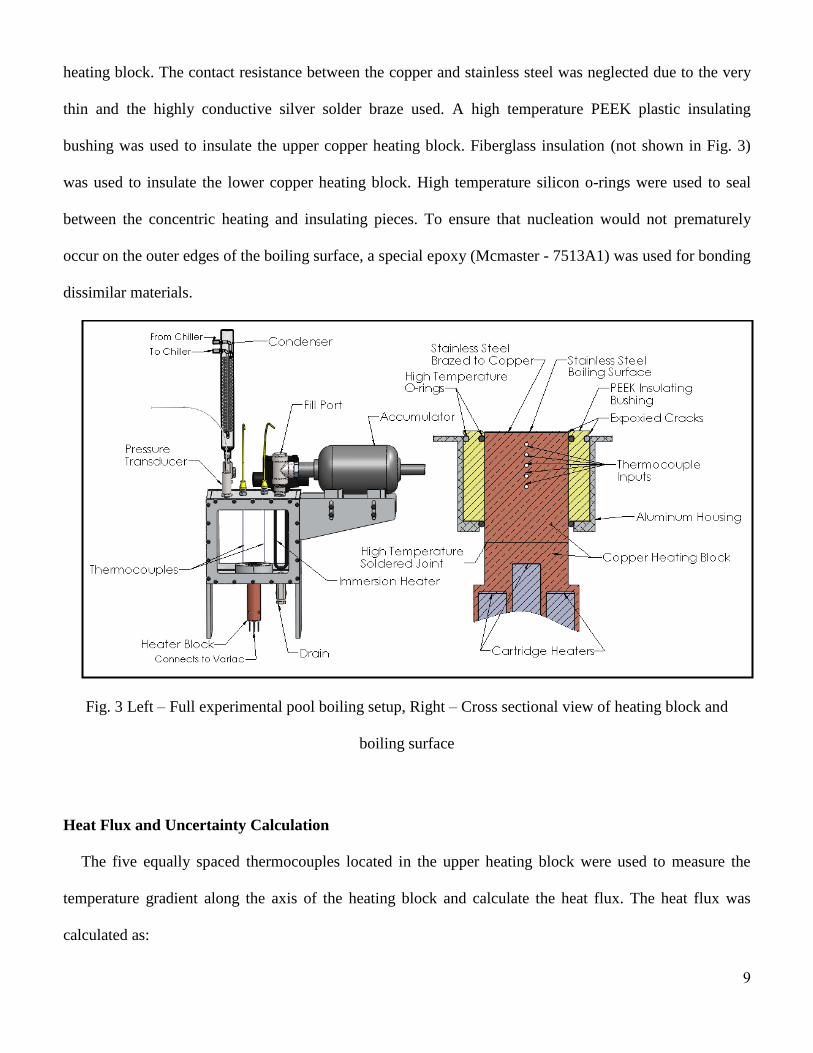
Fig. 3 Left – Full experimental pool boiling setup, Right – Cross sectional view of heating block and
boiling surface
Heat Flux and Uncertainty Calculation
The five equally spaced thermocouples located in the upper heating block were used to measure the
temperature gradient along the axis of the heating block and calculate the heat flux. The heat flux was
calculated as:

10
𝒒′′ = 𝒌𝒄𝑻𝒊−𝑻𝒋
𝒙 (2)
where 𝒌𝒄 is the thermal conductivity of the copper, 𝑻𝒊 and 𝑻𝒋 are the thermocouple temperatures and 𝒙 is
the thermocouple separation distance. The heat flux is calculated between alternating thermocouple
locations. To clarify, if the thermocouples are labeled in order from 1 to 5, the heat flux is calculated
between temperatures 1 and 3, 3 and 5, 2 and 4, and then 1 and 5. This increase in separation distance
reduces the uncertainty of the calculation. The minimum value of x is 6.35 mm. The thermal conductivity
of copper was taken to be constant at a value of 401 W/m-K. The temperature gradient and heat flux were
measured at the four locations and then averaged. The critical heat flux is determined when the monitored
thermocouple temperatures spike on the order of 100 °C and burnout occurs.
Radial heat losses were minimized by insulating the copper heating blocks. The upper heating block
was insulated with a PEEK plastic bushing (kp = .25 W/mK) with a thickness of .635 cm. The lower
heating block was insulated with fiberglass insulation. The thermocouple measurements were used to show
that the upper copper heating block was well insulated and at uniform temperature in the radial direction.
The radial heat loss can be estimated across the PEEK bushing if the aluminum housing (see Figure 3) is
assumed to be at 100 °C since it is in contact with the saturated water. At heat fluxes near the critical heat
flux, the maximum temperature in the upper copper heating block was measured to be 216 °C. It is
assumed that the copper/PEEK interface is at approximately 216 °C due to the highly conductive nature of
the upper copper heating block; hence the radial heat loss can be estimated by Equation 3.
𝒒′′𝒓 = 𝒌𝒑(𝑻𝒊−𝑻𝒘)
𝒓𝒑 (3)
Where 𝒌𝒑 is the PEEK thermal conductivity, 𝒓𝒑 is the PEEK thickness, 𝑻𝒘 is the aluminum temperature at
the wall, and 𝑻𝒊 is the interface temperature. It was found that this heat flux is approximately 0.5 W/cm2
which is less than 1% of the total heat flux measured at the critical heat flux. This approximation was also

11
validated using a full 3D finite element analysis of the heating block, test surface, and insulation assembly.
The boundary conditions for the simulation are as follows: convective heat transfer coefficient of 23,000
W/m2-K at the boiling surface, heat flux of 92 W/cm
2 at the junction of the upper and lower copper heating
blocks, a constant temperature of 100 °C at the PEEK/water and aluminum housing/water interface, and a
natural convection coefficient of 10 W/m2-K at the lower part of the aluminum housing (see Figure 3). The
simulation results were in excellent agreement with the theoretical approximation obtained by Equation 3.
Uncertainties on the heat flux values as well as the surface temperatures were calculated using the
standard error propagation equation. The standard deviation of the heat flux based on the accuracies of the
measurement equipment is given as follows.
∆𝒒′′ = √(𝝏𝒒′′
𝝏𝒙∆𝒙)
𝟐
+ (𝝏𝒒′′
𝝏𝑻𝟏∆𝑻)
𝟐
+ (𝝏𝒒′′
𝝏𝑻𝟐∆𝑻)
𝟐
(4)
The variation of the thermocouple separation (∆𝒙 ) is .08 mm and the thermocouple variation (∆𝑻) is 1 °C.
This leads to an estimated error of approximately 7.5% at an average critical heat flux.
The surface temperature was calculated from the measured heat flux. This calculation considered both
the copper material as well as the stainless steel wafer. The contact between the two materials was assumed
to be ideal due to the highly conductive and very thin layer of silver braze used to join the two. The surface
temperature was therefore calculated as follows:
𝑻𝒔 = 𝑻𝟏 −𝒒′′𝒙𝟏
𝒌𝒄−
𝒒′′𝒙𝒔𝒔
𝒌𝒔𝒔 (5)
Where 𝑻𝟏 is the thermocouple temperature located closest to the surface, 𝒙𝟏 is the distance between 𝑻𝟏 and
the bottom of the stainless steel wafer, 𝒙𝒔𝒔 is the stainless steel wafer thickness, and 𝒌𝒄 and 𝒌𝒔𝒔 are the

12
copper and stainless steel thermal conductivities respectively, allowing for variation with temperature. The
estimated error for the surface temperature can be determined using the following equation.
∆𝑻𝒔 = √(𝝏𝑻𝒔
𝝏𝑻𝟏∆𝑻)
𝟐
+ (𝝏𝑻𝒔
𝝏𝒒′′∆𝒒′′)
𝟐
+ (𝝏𝑻𝒔
𝝏𝒙𝟏∆𝒙𝟏)
𝟐
+ (𝝏𝑻𝒔
𝝏𝒙𝒔𝒔∆𝒙𝒔𝒔)
𝟐
(6)
∆𝒙𝟏, the variation of 𝒙𝟏, is 0.07 mm and ∆𝒙𝒔𝒔 the variation of the wafer thickness is 0.003 mm. With these
variations the error in the surface superheat temperature calculation at the critical heat flux is around 6 –
13% depending on the surface.
In a similar fashion, the uncertainty of the heat transfer coefficients can also be determined using the
extreme cases of the heat flux and surface temperature uncertainties. Using the standard error propagation
method, uncertainties of the heat transfer coefficient range from 11 – 16% depending on the test surfaces.
RESULTS AND DISCUSSION
For each of the sample surfaces tested, measurements were first taken at low heat fluxes and then the
heat flux was gradually increased until critical heat flux was reached. The results are shown in Figure 4. It
can be seen from this figure that there was a drastic difference between the processed and unprocessed
surfaces in their heat transfer performance. The processed surfaces consistently outperformed the polished
sample at every surface temperature. The polished sample was found to have a critical heat flux of 91
W/cm2 at a surface superheat of 40°C. This result closely matches the results found in the literature for a
similar smooth metallic surface [13], [30], [31], as well as critical heat flux correlations [32] such as
Zuber’s and Kandlikar’s. Zuber’s model is given in Equation 7 and Kandlikar’s model is given in Equation
8.
𝑞𝑐 = 𝐾ℎ𝑓𝑔𝜌𝑣 [𝜎𝑔(𝜌𝐿−𝜌𝑣)
𝜌𝑣2 ]
1
4 (7)
13
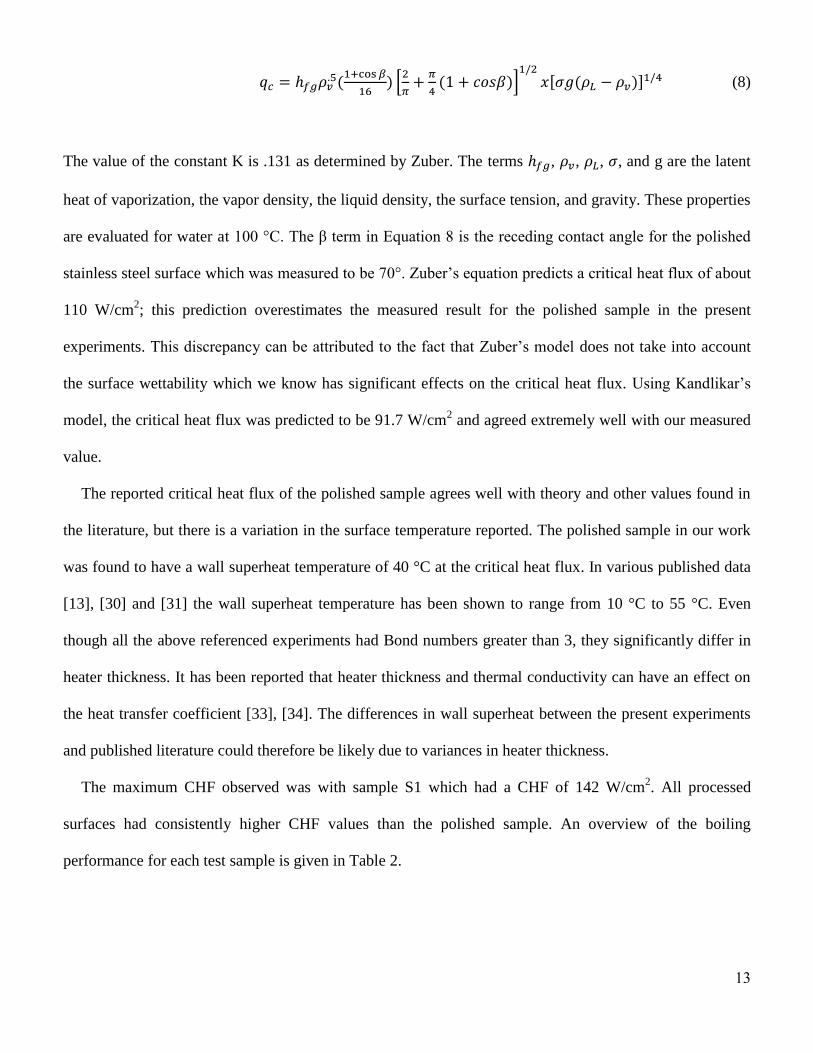
𝑞𝑐 = ℎ𝑓𝑔𝜌𝑣.5(
1+cos 𝛽
16) [
2
𝜋+
𝜋
4(1 + 𝑐𝑜𝑠𝛽)]
1/2
𝑥[𝜎𝑔(𝜌𝐿 − 𝜌𝑣)]1/4 (8)
The value of the constant K is .131 as determined by Zuber. The terms ℎ𝑓𝑔, 𝜌𝑣, 𝜌𝐿, 𝜎, and g are the latent
heat of vaporization, the vapor density, the liquid density, the surface tension, and gravity. These properties
are evaluated for water at 100 °C. The β term in Equation 8 is the receding contact angle for the polished
stainless steel surface which was measured to be 70°. Zuber’s equation predicts a critical heat flux of about
110 W/cm2; this prediction overestimates the measured result for the polished sample in the present
experiments. This discrepancy can be attributed to the fact that Zuber’s model does not take into account
the surface wettability which we know has significant effects on the critical heat flux. Using Kandlikar’s
model, the critical heat flux was predicted to be 91.7 W/cm2 and agreed extremely well with our measured
value.
The reported critical heat flux of the polished sample agrees well with theory and other values found in
the literature, but there is a variation in the surface temperature reported. The polished sample in our work
was found to have a wall superheat temperature of 40 °C at the critical heat flux. In various published data
[13], [30] and [31] the wall superheat temperature has been shown to range from 10 °C to 55 °C. Even
though all the above referenced experiments had Bond numbers greater than 3, they significantly differ in
heater thickness. It has been reported that heater thickness and thermal conductivity can have an effect on
the heat transfer coefficient [33], [34]. The differences in wall superheat between the present experiments
and published literature could therefore be likely due to variances in heater thickness.
The maximum CHF observed was with sample S1 which had a CHF of 142 W/cm2. All processed
surfaces had consistently higher CHF values than the polished sample. An overview of the boiling
performance for each test sample is given in Table 2.

14
Table 2. Summary of boiling performance for each test surface.
Although the four processed samples had the same contact angle, there is a significant difference
between the samples which can no longer be related to a change in the contact angle. It is well known that
reducing the contact angle to zero does not result in reaching a limit on critical heat flux enhancement and
that additional mechanisms become dominant. As can be seen from Table 2 and Figure 4, there is a definite
trend in CHF enhancement for samples S1-S3. For these surfaces the surface area ratio is nearly constant
but the critical heat flux increases with decreasing structure height and spacing. The reason for this increase
in CHF for these samples can be related to the microstructure geometry. As can be seen from Figure 2, the
area between the microstructures increases from S1 to S3. For S1 the mound structures are densely packed
and narrow channels or cracks are formed between microstructures. This network of channels, in addition
to the nanoparticle layer on the microstructures, allows for high capillary wicking effects which help to
quickly replenish the heated surface with cold liquid after local evaporation occurs and consequently delay
the critical heat flux. As the sample number increases, the separation and size of the microstructures also
increase; this results in the formation of deep pits in between the microstructures instead of the channels.
These deep pits and holes reduce the wicking potential of the surfaces and the wicking effect is mainly
dominated by the presence of the layer of nanoparticles covering the mound structures.
Polished 91 39.8 10.8 22,900
S1 142 29.2 8.6 48,600
S2 118 22.6 8.7 52,200
S3 109 22.8 8.2 47,800
S4 122 18.1 7 67,400
Sample
CHF
(W/cm2)
CHF Surface
Superheat (°C)
Onset of Nucleate
Boiling Superheat (°C)
Maximum Heat Transfer
Coefficient (W/m2-K)

15
Fig. 4 Heat fluxes with respect to surface superheat for both the laser processed and polished stainless steel
surfaces
As mentioned earlier, sample S4 is slightly different than the other samples. However, its critical heat
flux enhancement can still be explained by the same approach. S4 resulted in the second highest CHF of
122 W/cm2 observed, however had a larger peak-to-valley height as well as structure spacing. The most
notable geometric difference between S4 and the rest is the surface area ratio as its surface area ratio is
significantly higher than the other samples. This increase in the surface area ratio is the reason for the
increase in critical heat flux over sample S2 which had a much denser microstructure arrangement. The
larger surface area ratio results in more surface area in contact with the liquid and thus can compensate for
a lack of wicking ability due to the larger microstructure spacing. The increase in surface area ratio can
also result in a better wetting surface as described by the classic Wenzel model for a droplet on a rough
surface. The contact angle measurements taken were not able to prove a difference in wettability between
the processed surfaces due to the highly wicking nature of the processed surfaces and the limits of the
measuring device. Hence, S4 has higher CHF than S2 and S3 because of its relatively higher wettability. It
can be therefore concluded from the observed results, that the enhancement in CHF is due to a combination
of both surface wettability and capillary wicking.

16
The local maximum superheat temperature that arises in S2-S4 can be related to the thermal
conductivity of the surface and the active nucleation site density. Since the thermal conductivity of
stainless steel is relatively low compared to other metals such as copper, local sites with different heat
fluxes can occur [33]. As the number of active nucleation sites increase the average surface temperature
would then decrease. Because the processed surfaces have roughness on both the nano and microscale,
there is a wide range of potential nucleation sites that could be activated at high heat fluxes. Near the
critical heat flux, the maximum amount of nucleation sites is active and thus reduces the surface
temperature. The polished sample does not have this nano and microscale roughness so there are no
additional nucleation sites to activate at high heat fluxes and thus the curve remains nearly linear.
Fig. 5 Heat transfer coefficient with respect to wall heat flux for each sample surface
The shift of the boiling curves to the left with the processed surfaces is very advantageous to heat
transfer applications as it corresponds to an enhancement of the heat transfer coefficients and allows for a
large amount of heat to be transferred at relatively low surface temperatures. The steep slope of the curve is
also advantageous because of the relatively small surface temperature change (around 10 °C for S4). For all

17
processed surfaces investigated, significant enhancement of the heat transfer coefficients were observed in
comparison to the polished surface.
Heat transfer coefficients based on the projected area were determined for each of the test samples and
plotted in Fig. 5. A summary of the maximum heat transfer coefficients is also given in Table 2. The
maximum heat transfer coefficient values varied from 22,900 to 67,400 W/m2-K. As expected for nucleate
boiling, the heat transfer coefficients increase with increasing heat flux. The shape of each curve looks
nearly the same for heat flux values up to 90 W/cm2. Beyond this point the slope of the curve for the
processed samples changes significantly. This change in slope is a result of the additional nucleation sites
which become active at higher heat fluxes (e.g., smaller radius cavities); the probability of active
nucleation sites in this region is expected to be different for each test sample.
Samples S1-S3 have very similar heat transfer coefficient curves. This is expected since these surfaces
have nearly identical surface area ratios. The curves of S1-S3 diverge at around 90 W/cm2. Beyond this
point the heat transfer coefficients follow the trend of increasing microstructure peak-to-valley height. The
microstructures act like cooling fins for heat to be conducted through. As the height of the microstructures
increase, the more efficiently the surface is cooled and thus increases the heat transfer coefficient. Sample
S4 consistently has higher heat transfer coefficients than all the other samples. The overall enhancement of
the heat transfer coefficients can be attributed to efficient nucleate boiling and an increase in the surface
area ratio. The increase in the slope beyond the divergent point (at 90 W/cm2) can also be related to the
microstructure peak-to-valley height. As the height is increased the change in slope is also increased. The
enhancement of the heat transfer coefficients at high heat fluxes is due to a combination of the tall nature of
the microstructures [33] and the higher surface area ratio, as well as a higher probability of finding a
nucleation site which can be activated at higher heat fluxes.
As for the Onset of Nucleate Boiling (ONB), it can be seen from Figure 4 and Table 2 that the ONB
occurred at much lower wall superheat values for the processed surfaces when compared to the polished
surface. This is due to the nano and microscale features present on the processed surfaces which allow for

18
nucleation sites that activate with less energy. Figure 6 shows the difference in nucleation between S4 and
the polished surface at low heat fluxes further supporting the above mentioned statement. As can be seen
from Figure 6, sample S4 has a much higher nucleation site density and produces much smaller bubbles
that quickly detach from the surface compared to the polished sample. This difference in bubble size and
departure rate and diameter also occurred at higher heat fluxes and surface temperatures. Sample S4 was
found to have the smallest ONB at around 7 °C compared to about 10 °C for the polished sample.

19
Fig. 6 Near Onset of Nucleate Boiling: Top – polished sample, 13 °C superheat and 3 W/cm2, Bottom – S4,
7.7 °C and 2 W/cm2
CONCLUSIONS
Through the use of femtosecond laser surface processing (FLSP), functionalized stainless steel surfaces
were fabricated with hierarchical micro/nanostructures. The structures consist of mound like
microstructures covered by a dense layer of nanoparticles resulting in highly wetting and superwicking
surfaces with augmented surface area and increased nucleation site density. Pool boiling heat transfer
experimental results revealed that using the laser processed stainless steel surfaces, the critical heat flux
can be increased from 91 to 142 W/cm2 while also increasing the maximum heat transfer coefficients from
23,000 to 67,400 W/m2-K. Increase in the critical heat flux has been attributed to increase in surface
wettability and wicking capabilities. Processed surfaces with tightly packed mound structures resulted in
better wettability and wicking and thus resulted in higher critical heat fluxes. The enhancement in heat
transfer coefficients are related to the surface area ratio, structure height, and the active nucleation site
density. It was found that the higher the surface area ratio the higher the heat transfer coefficients. It was
also found that microstructure peak-to-valley height can result in a cooling fin effect and further increase
the heat transfer coefficients at high heat fluxes. The heat transfer enhancement at low heat fluxes can be
attributed to the increase in nucleation site density and more efficient bubble departure dynamics.
ACKNOWLEDGMENT
This work has been supported by a grant through the Nebraska Center for Energy Sciences Research
(NCESR) with funds provided by Nebraska Public Power District (NPPD) to the University of Nebraska –
Lincoln (UNL) No. 4200000844, a NASA EPSCoR Grant # -NNX13AB17A and by funds from the

20
Department of Mechanical and Materials Engineering and the College of Engineering at UNL, awarded to
SN.
REFERENCES
[1] S. Ndao, Y. Peles, and M. K. Jensen, “Experimental Investigation of Flow Boiling Heat Transfer of Jet Impingement on
Smooth and Micro Structured Surfaces,” Int. J. Heat Mass Transf., vol. 55, no. 19–20, pp. 5093–5101, Sep. 2012.
[2] S. Kim, H. D. Kim, H. Kim, H. S. Ahn, H. Jo, J. Kim, and M. H. Kim, “Effects of Nano-Fluid and Surfaces with Nano
Structure on the Increase of CHF,” Exp. Therm. Fluid Sci., vol. 34, no. 4, pp. 487–495, May 2010.
[3] K.-H. Chu, R. Enright, and E. N. Wang, “Structured Surfaces for Enhanced Pool Boiling Heat Transfer,” Appl. Phys.
Lett., vol. 100, no. 24, p. 241603, 2012.
[4] M. Rahman, S. M. King, E. Olceroglu, and M. Mccarthy, “Nucleate Boiling on Biotemplated Nanostructured Surfaces,”
in ASME 2012 International Mechanical Engineering Congress and Exposition. American Society of Mechanical
Engineers, 2012, pp. 2801–2808.
[5] Z. Yao, Y.-W. Lu, and S. G. Kandlikar, “Micro/nano Hierarchical Structure in Microchannel Heat Sink for Boiling
Enhancement,” in 2012 IEEE 25th International Conference on Micro Electro Mechanical Systems (MEMS), 2012, pp.
285–288.
[6] A. R. Betz, J. Jenkins, C.-J. “Cj” Kim, and D. Attinger, “Boiling Heat Transfer on Superhydrophilic, Superhydrophobic,
and Superbiphilic Surfaces,” Int. J. Heat Mass Transf., vol. 57, no. 2, pp. 733–741, Feb. 2013.
[7] A. R. Betz, J. Xu, H. Qiu, and D. Attinger, “Do Surfaces with Mixed Hydrophilic and Hydrophobic Areas Enhance Pool
Boiling?,” Appl. Phys. Lett., vol. 97, no. 14, p. 141909, 2010.
[8] H. Jo, H. S. Ahn, S. Kang, and M. H. Kim, “A Study of Nucleate Boiling Heat Transfer on Hydrophilic, Hydrophobic
and Heterogeneous Wetting Surfaces,” Int. J. Heat Mass Transf., vol. 54, no. 25–26, pp. 5643–5652, Dec. 2011.
[9] H. T. Phan, N. Caney, P. Marty, S. Colasson, and J. Gavillet, “Surface Wettability Control by Nanocoating: The Effects
on Pool Boiling Heat Transfer and Nucleation Mechanism,” Int. J. Heat Mass Transf., vol. 52, no. 23–24, pp. 5459–
5471, Nov. 2009.
[10] Z. Yao, Y.-W. Lu, and S. G. Kandlikar, “Effects of Nanowire Height on Pool Boiling Performance of Water on Silicon
Chips,” Int. J. Therm. Sci., vol. 50, no. 11, pp. 2084–2090, Nov. 2011.
[11] M.-C. Lu, R. Chen, V. Srinivasan, V. P. Carey, and A. Majumdar, “Critical Heat Flux of Pool Boiling on Si Nanowire
Array-Coated Surfaces,” Int. J. Heat Mass Transf., vol. 54, no. 25–26, pp. 5359–5367, Dec. 2011.
[12] R. Chen, M.-C. Lu, V. Srinivasan, Z. Wang, H. H. Cho, and A. Majumdar, “Nanowires for Enhanced Boiling Heat
Transfer.,” Nano Lett., vol. 9, no. 2, pp. 548–53, Feb. 2009.
[13] H. S. Ahn, C. Lee, H. Kim, H. Jo, S. Kang, J. Kim, J. Shin, and M. H. Kim, “Pool Boiling CHF Enhancement by
Micro/nanoscale Modification of Zircaloy-4 Surface,” Nucl. Eng. Des., vol. 240, no. 10, pp. 3350–3360, Oct. 2010.
[14] H. S. Ahn, C. Lee, J. Kim, and M. H. Kim, “The Effect of Capillary Wicking Action of Micro/nano Structures on Pool
Boiling Critical Heat Flux,” Int. J. Heat Mass Transf., vol. 55, no. 1–3, pp. 89–92, Jan. 2012.

21
[15] B. Feng, K. Weaver, and G. P. Peterson, “Enhancement of Critical Heat Flux in Pool Boiling Using Atomic Layer
Deposition of Alumina,” Appl. Phys. Lett., vol. 100, no. 5, p. 053120, 2012.
[16] T. J. Hendricks, S. Krishnan, C. Choi, C.-H. Chang, and B. Paul, “Enhancement of Pool-Boiling Heat Transfer Using
Nanostructured Surfaces on Aluminum and Copper,” Int. J. Heat Mass Transf., vol. 53, no. 15–16, pp. 3357–3365, Jul.
2010.
[17] C. Young Lee, M. M. Hossain Bhuiya, and K. J. Kim, “Pool Boiling Heat Transfer with Nano-Porous Surface,” Int. J.
Heat Mass Transf., vol. 53, no. 19–20, pp. 4274–4279, Sep. 2010.
[18] J. P. McHale, S. V. Garimella, T. S. Fisher, and G. A. Powell, “Pool Boiling Performance Comparison of Smooth and
Sintered Copper Surfaces with and Without Carbon Nanotubes,” Nanoscale Microscale Thermophys. Eng., vol. 15, no.
3, pp. 133–150, Jul. 2011.
[19] C. Li, Z. Wang, P.-I. Wang, Y. Peles, N. Koratkar, and G. P. Peterson, “Nanostructured Copper Interfaces for Enhanced
Boiling.,” Small, vol. 4, no. 8, pp. 1084–8, Aug. 2008.
[20] C. Zuhlke, T. Anderson, and D. Alexander, “Formation of Multiscale Surface Structures on Nickel via Above Surface
Growth and Below Surface Growth Mechanisms Using Femtosecond Laser Pulses,” Opt. Express, vol. 21, no. 7, pp. 97–
98, 2013.
[21] C. A. Zuhlke, T. P. Anderson, and D. R. Alexander, “Formation of Multiscale Surface Structures on Nickel via Above
Surface Growth and Below Surface Growth Mechanisms Using Femtosecond Laser Pulses,” Opt. Express, vol. 21, no. 7,
pp. 8460–8473, 2013.
[22] C. A. Zuhlke, T. P. Anderson, and D. R. Alexander, “Comparison of the Structural and Chemical Composition of Two
Unique Micro/nanostructures Produced by Femtosecond Laser Interactions on Nickel,” Appl. Phys. Lett., vol. 103, no.
12, p. 121603, 2013.
[23] C. A. Zuhlke, T. P. Anderson, and D. R. Alexander, “Fundamentals of Layered Nanoparticle Covered Pyramidal
Structures Formed on Nickel During Femtosecond Laser Surface Interactions,” Appl. Surf. Sci., vol. 21, no. 7, pp. 8460–
73, Jul. 2013.
[24] C. A. Zuhlke, D. R. Alexander, J. C. Bruce, N. J. Ianno, C. a Kamler, and W. Yang, “Self Assembled Nanoparticle
Aggregates from Line Focused Femtosecond Laser Ablation,” Opt. Express, vol. 18, no. 5, pp. 4329–39, Mar. 2010.
[25] A. Y. Vorobyev and C. Guo, “Direct Femtosecond Laser Surface Nano/microstructuring and Its Applications,” Laser
Photon. Rev., vol. 7, no. 3, pp. 385–407, May 2013.
[26] B. K. Nayak and M. C. Gupta, “Ultrafast Laser-Induced Self-Organized Conical Micro/nano Surface Structures and
Their Origin,” Opt. Lasers Eng., vol. 48, no. 10, pp. 966–973, 2010.
[27] E. Stratakis, A. Ranella, and C. Fotakis, “Biomimetic Micro/nanostructured Functional Surfaces for Microfluidic and
Tissue Engineering Applications,” Biomicrofluidics, vol. 5, no. 1, 2011.
[28] C. Kruse, T. Anderson, C. Wilson, C. Zuhlke, D. Alexander, G. Gogos, and S. Ndao, “Extraordinary Shifts of the
Leidenfrost Temperature from Multiscale Micro/nanostructured Surfaces.,” Langmuir, vol. 29, no. 31, pp. 9798–806,
Aug. 2013.
[29] J. Kim, J. F. Benton, and D. Wisniewski, “Pool Boiling Heat Transfer on Small Heaters: Effect of Gravity and
Subcooling,” Int. J. Heat Mass Transf., vol. 45, no. 19, pp. 3919–3932, Sep. 2002.
[30] D. Wen and Y. Ding, “Experimental Investigation into the Pool Boiling Heat Transfer of Aqueous Based γ-Alumina
Nanofluids,” J. Nanoparticle Res., vol. 7, no. 2–3, pp. 265–274, Jun. 2005.

22
[31] R. J. Benjamin and a. R. Balakrishnan, “Nucleation Site Density in Pool Boiling of Saturated Pure Liquids: Effect of
Surface Microroughness and Surface and Liquid Physical Properties,” Exp. Therm. Fluid Sci., vol. 15, no. 1, pp. 32–42,
Jul. 1997.
[32] S. G. Kandlikar, “A Theoretical Model to Predict Pool Boiling CHF Incorporating Effects of Contact Angle and
Orientation,” J. Heat Transfer, vol. 123, no. 6, p. 1071, 2001.
[33] I. L. Pioro, W. Rohsenow, and S. S. Doerffer, “Nucleate Pool-Boiling Heat Transfer. I: Review of Parametric Effects of
Boiling Surface,” Int. J. Heat Mass Transf., vol. 47, no. 23, pp. 5033–5044, Nov. 2004.
[34] T. L. Chuck and J. E. Myers, “The Effect of Heater Plate Thickness on Boiling Heat-Transfer Coefficients,” Int. J. Heat
Mass Transf., vol. 21, no. 2, pp. 187–191, Feb. 1978.