enhanced vertical resolution processing of dual …enhanced vertical resolution processing of...
TRANSCRIPT

SPWLA 31~1 Annual Logging Symposium. June 24-27.1990
ENHANCED VERTICAL RESOLUTION PROCESSING OF DUAL-SPACED NEUTRON AND DENSITY TOOLS USING STANDARD SHOP CALIBRATION
AND BOREHOLE COMPENSATION PROCEDURES
Michael P. Smith Halliburton Logging Services, Inc.
Houston, Texas
ABSTRACT
Dual-spaced neutron and gamma-gamma density logging tools, using ratio processing and spine- and-ribs plots respectively, provide borehole compensated porosity measurements. The effects of washouts, mudcake, rugose boreholes, and tool standoff are thereby minimized. Standard shop calibration procedures are used to insure porosity measurement accuracy. In the past, the vertical resolution of these porosity measurements has been limited to two or more feet, mainly because of the limitations imposed by the vertical response of the far neutron detector and the perceived need to filter count rates to reduce statistical uncertainties to acceptable levels.
During the last several years, new data processing methods have been proposed to improve the vertical resolution of both neutron and density tools. The near detector count rate from each tool has been used separately to alter the vertical profile of the original borehole compensated logs and thereby to improve vertical resolution. These methods require modifications to standard shop calibrations of both near detectors. Although bed resolution appears to be improved, statistical precision/log repeatability is degraded, and porosity accuracy in rugose boreholes is compromised.
This paper discusses the use of deconvolution to directly improve the far neutron detector vertical resolution. Neutron ratio processing and the current (fixed) shop calibration are still used to provide accurate, borehole compensated neutron porosity measurements. Filtering of the near and far density count rates is reduced to maintain vertical resolution compatibility between the density and the improved neutron porosity measurements. Current (fixed) shop calibrations and standard spine- and-ribs processing are retained for the density tool.
Although the vertical resolution of both tools is improved, statistical precision/log repeatability is somewhat reduced. The much higher count rates provided by newer generation neutron and density tools minimize the importance of the reductions. Effects of borehole mgosity and tool standoff are reduced relative to prior high resolution processing methods.
Topics discussed include neutron and density detector response intervals, materially matched filters, and compatible neutron/density logs. A response function for the far neutron detector is given that describes neutron spreading as a function of porosity; it is used to deconvolve the far neutron count rate and to smooth the near detector count rate so that both detectors sense the same vertical interval, i.e., are material matched. Test pit and well log data show the improvements achieved by the new method.
INTRODUCTION
The preprocessing operations of depth alignment and material matching are critical for accurate borehole compensation with dual-detector logging tools; these operations also eliminate the occurrence of horns or spurious extra beds on logs.‘,’ These two operations are reviewed and it is shown that material matching improves accuracy and repeatability, but degrades vertical resolution. Because of the far neutron source-to-detector spacing, it is not possible to achieve a vertical resolution of better than about two feet while maintaining material matching and the use of simple filtering methods. Both conventional and enhanced methods for processing dual-spaced logging data require material matching.
The present paper discusses a new method for improving vertical resolution while maintaining exactly the same borehole compensation procedures and shop calibrations for both neutron and density tools. The new method is called enhanced vertical resolution processinq (EVR). Material
SS
1

SPWLA 31~ Annual Logging Symposium. June 24-27.1990
matching is extended to include simultaneously gamma ray, neutron, and density measurements. A new compromise between vertical resolution (12 to 15 inches) and log repeatability is possible for many logging applications.
The new method improves the vertical resolution of the far neutron detector by deconvolution techniques. The effective neutron migration length (M’) is used to construct a vertical response function for the far detector and a smoothing function for the near detector. Both forward modeling and deconvolution results are presented for the API Neutron Test Pit at the University of Houston. A new method is employed for processing the natural gamma ray logging data’; material matching to the neutron and densfty tools is provided. Some mathematical details are given in the section “NORMALIZATION AND USE OF THE VRF” and the two sections “FORWARD MODELINGIDECONVOLUTION APPLIED TO THE UNIVERSITY OF HOUSTON API NEUTRON TEST PIT FACILITY.” These three sections can be skipped in an overview reading of this paper.
A logging example is presented in some detail. Standard and enhanced resolution processing are compared in order to show the resolution improvements. A statistical analysis of five repeat log sections is provided.
Enhanced resolution processing is presently available only at computing centers by replaying field tapes. These methods will soon be available for real-time and relog operations at the wellsite.
STANDARD PREPROCESSING OF DUAL-SPACED NEUTRON AND DENSITY TOOLS: DEPTH ALIGNMENT AND MATERIAL MATCHING
Standard preprocessing refers to operations performed on logging data before “traditional” bulk density, neutron ratio, borehole compensation, porosity computations, etc. are performed; important examples include time-to-depth basis conversion, depth alignment, material matching, and application of the current shop calibrations.
Figure 1 schematically shows near and far detector response volumes for a dual-spaced neutron logging tool at a fixed position in a well bore. As the fast neutrons leave the source and slow down and diffuse in the formation/borehole region, they sample the materials present between the source and each detector. By definition, 90% of the measured near and far counts are determined by the borehole and formation material contained wtthin these response volumes. These near and far response volumes are not equal in size and each contains material not found within the other.
An analogous diagram applies to a dual-spaced density logging tool, except that its detector responses are focused into the formation, away from the borehole axis. The surface instrumentation converts all the instantaneous nuclear count rates from a time basis to a depth basis at fixed sample rates of 2 to 10 times per foot, typically by a simple averaging process.
Figures 2 and 3 illustrate two critical operations, namely depth alignment and material matching of the neutron (or density) near and far count rates; these operations ensure that both detectors sense the same vertical extent of formation before any additional processing is performed.’ In these figures, the near and far count rates are referred to a fixed (imaginary) point called the tool’s measure point. These two operations are the basis for both standard and enhanced processing for dual-spaced neutron and density logging tools.‘~2
Notice that the material matching operation (Figure 3) smooths the near detector response so that it matches the far detector response. This operation is vital to obtain proper borehole compensation through the use of two detectors and also to achieve accurate results at bed boundaries, otherwise horns or extra beds will appear. These “beds” can be an insidious problem, since they may be repeatable and present on both neutron and density logs, and yet they may not be real!’ (Figure 5 shows explicitly how a simple block fitter of 15 inches is used to smooth a near neutron count rate to match the far detector resolution.) The exact amount of smoothing of the near detector response for both neutron and density tools using block filters (or more complex filters) must be verified experimentally using test tank and well logging data. This smoothing depends on acquisition sample rates and source-to-detector spacings.
2

SPWLA 31st Annual Logging Symposium. June 2627. 1990
Material matching of dual-spaced detector logging tools thus degrades the near detector vertical resolution, despite the fact that the near detector has much better vertical resolution and typically much higher count rates and better statistical precision/log repeatability than the corresponding far detector.
COMPATIBLE GAMMA RAY, DENSITY, AND NEUTRON LOGGING MEASUREMENTS
Figure 4 shows the response volumes specifically for the GR/DSN&-IIISDL’ nuclear logging tools. The vertical extent of these response volumes ranges from less than 3 inches for the SDL short- spaced Pe measurement to about 24 inches for the DSf@-II far detector measurement. In many logging and post-log processing applications, it is vital to ensure that these measurements are simultaneously material-matched for all three logging tools, so that all measurements for all tools respond to the same vertical extent of formation. Such measurements are called compatible. In this case, it becomes necessary to smooth the gamma ray, short-spaced neutron, and all of the density measurements to match the 24-inch vertical extent of the far neutron detector measurement, Figure 5 shows the block filters that provide the minimum compatible set of measurements. Table 1 includes this set of filters, together with other sets of heavier compatible filters to provide more filtering, should this become necessary. Although heavier filtering reduces vertical resolution, lt does improve statistical precision/log repeatability.
Standard PLS services in current use in the field use medium filtering, with a resolution of 33- 36 inches. The best resolution that can be achieved using conventional processing is light filtering, with a resolution of 21 to 24 inches. These compatible measurements are then available for application of the current shop calibrations, neutron ratio, bulk density, Pe, porosity, and standard borehole compensation procedures.
ENHANCED RESOLUTION PROCESSING OF GRIDSN~WSDL LOGGING MEASUREMENTS
Study of Table 1 and Figures 4 and 5 clearly indicates that the vertical resolution of compatible measurements for the GR/DSN’-IIISDL nuclear tools is controlled by the far DSNB-II detector vertical response interval (24 inches). Furthermore, compatible measurements with a vertical resolution of 12 to 15 inches would require much less fittering for all the other measurements, if only the far DSNB-II measurement could be made to about one half of its natural inherent resolution, Of course, the repeatability of such measurements might be somewhat reduced.
A new method has been developed for obtaining far DSN@-II detector measurements with a vertical resolution of 12 to 15 inches by using the effective neutron migration length (M’) to deconvolve the far detector count rate. M’ is also used to smooth the near count rate to keep both detectors materially matched. The smoothed near rate and deconvolved far rate provide a dewnvolved near/far ratio with enhanced vertical resolution. The same shop calibration wnstants and borehole compensation methods are used with this enhanced ratio to compute a neutron porosity with improved vertical resolution. At the same time, the filtering of all the near and far density tool count rates is reduced to be compatible with these improved neutron porosity values. Standard shop calibrations and borehole compensation methods are retained for the density tool. Simple block filters wntinue to be used for the density tool.‘.’ As discussed in another pape?, enhanced processing of the gamma ray tool may also be performed.
The combined new processing is called Enhanced Vertical Resolution Processing (EVR). As will become clear from a IoctQina example, some loss in reoeatabilitv does result. However. in manv applications, the new cornpromise between vertical resolution improvement and log repeatability will be acceptable. (See Figures 14 to 18 for an example comparing standard and EVR processed logs.) Figures 4 and 5 also show that the SDL tool can always resolve finer detail than the DSf?- II tool. SDL block filters are reduced just enough to be compatible with the enhanced DSNBII vertical resolution.”
ss
* A mark of Halliburlon Logging Servims, Inc.
3
SPWLA 31~ Annual Logging Symposium, June 2627.1990
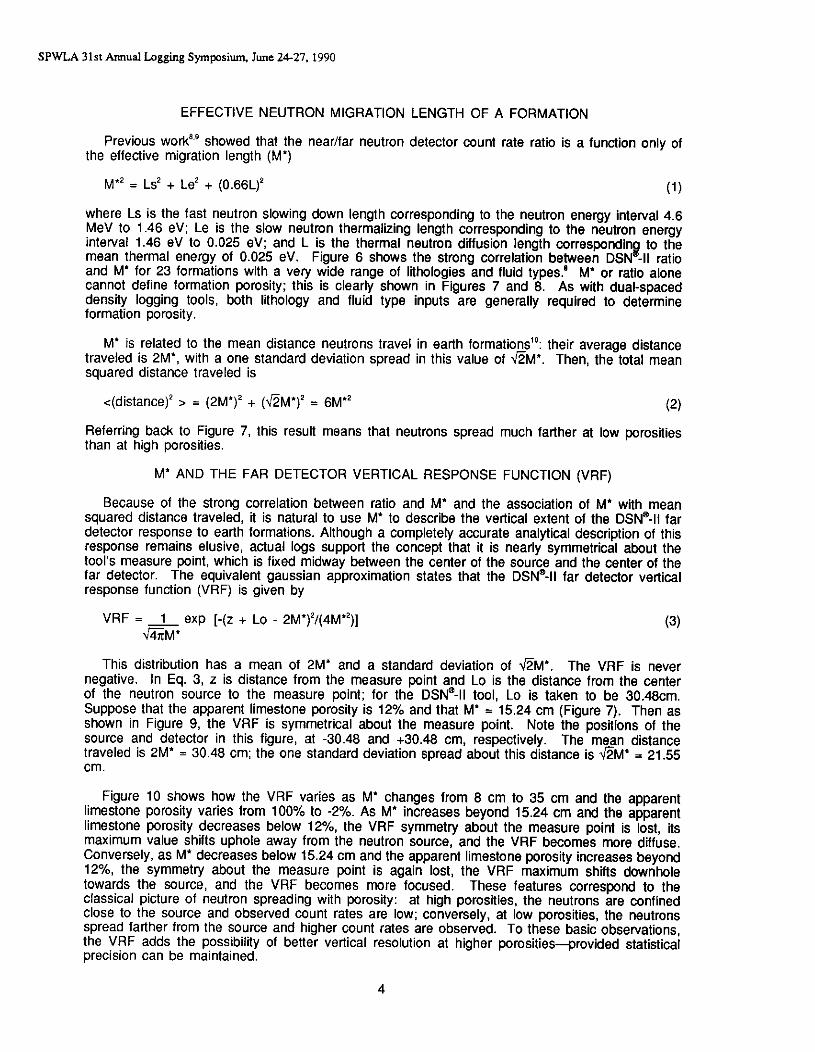
EFFECTIVE NEUTRON MIGRATION LENGTH OF A FORMATION
the Previous ~ork’~~ showed that the near/far neutron detector count rate ratio is a function only of effective migration length (M’)
M” = Ls’ + Le’ + (0.66L)’ (1)
where Ls is the fast neutron slowing down length corresponding to the neutron energy interval 4.6 MeV to 1.46 eV; Le is the slow neutron thermalizing length corresponding to the neutron energy interval 1.46 eV to 0.025 eV; and L is the thermal neutron diffusion length corresponding to the mean thermal energy of 0.025 eV. Figure 6 shows the strong correlation between DSN -II ratio and M’ for 23 formations with a very wide range of lithologies and fluid types.’ M’ or ratio alone cannot define formation porosity; this is clearly shown in Figures 7 and 8. As with dual-spaced density logging tools, both lithology and fluid type inputs are generally required to determine formation porosity.
M’ is related to the mean distance neutrons travel in earth formations”: their average distance traveled is 2M’, with a one standard deviation spread in this value of GM’. Then, the total mean squared distance traveled is
<(distance)* > = (2M’)’ + (GM’)* = 6M” (2)
Referring back to Figure 7, this result means that neutrons spread much farther at low porosities than at high porosities.
M’ AND THE FAR DETECTOR VERTICAL RESPONSE FUNCTION (VRF)
Because of the strong correlation between ratio and M’ and the association of M’ with mean squared distance traveled, it is natural to use M’ to describe the vertical extent of the DSN’-II far detector response to earth formations. Although a completely accurate analytical description of this response remains elusive, actual logs support the concept that it is nearly symmetrical about the tool’s measure point, which is fixed midway between the center of the source and the center of the far detector. The equivalent gaussian approximation states that the DSNsII far detector vertical response function (VRF) is given by
VRF =c& exp [-(z + Lo 2M’)*/(4M”)] (3) Jr*
This distribution has a mean of 2M’ and a standard deviation of GM’. The VRF is never negative. In Eq. 3, z is distance from the measure point and Lo is the distance from the center of the neutron source to the measure point; for the DSN’-II tool, Lo is taken to be 30.48cm. Suppose that the apparent limestone porosity is 12% and that M’ = 15.24 cm (Figure 7). Then as shown in Figure 9, the VRF is symmetrical about the measure point. Note the positions of the source and detector in this figure, at -30.48 and +30.48 cm, respectively. The mean distance traveled is 2M’ = 30.48 cm; the one standard deviation spread about this distance is @M+ = 21.55 cm.
Figure 10 shows how the VRF varies as M’ changes from 8 cm to 35 cm and the apparent limestone porosity varies from 100% to -2%. As M’ increases beyond 15.24 cm and the apparent limestone porosity decreases below 12%, the VRF symmetry about the measure point is lost, its maximum value shifts uphole away from the neutron source, and the VRF becomes more diffuse. Conversely, as M’ decreases below 15.24 cm and the apparent limestone porosity increases beyond 12%, the symmetry about the measure point is again lost, the VRF maximum shifts downhole towards the source, and the VRF becomes more focused. These features correspond to the classical picture of neutron spreading with porosity: at high porosities, the neutrons are confined close to the source and observed count rates are low; conversely, at low porosities, the neutrons spread farther from the source and higher count rates are observed. To these basic observations, the VRF adds the possibility of better vertical resolution at higher porosities-provided statistical precision can be maintained.
4

SPWLA 31s~ Annual Logging Symposium. June 24-27.1990
The VRF may be used to improve the vertical resolution of neutron logs. However, ft is not a tradlional vertical geometrical factor type quantity. As will become more evident in later discussions, the algorithm whereby M’ is computed is a very significant companion to the VRF given by Eq.3. This form for the VRF is particularly convenient for improving vertical resolution, as will be seen by the simplicity of Eqs. 6 and 12. More accurate expressions and representations for the VRF are being investigated to determine to what extent log porosity values might be affected.
NORMALIZATION AND USE OF THE VRF
The VRF of Eq. 3 is normalized to unity-k represents the relative strengths with which the combined source and far detector sample earth formations. In actual logging applications, values of the VRF are needed only for several discrete values of z corresponding to the depth sampling rate. For example, if the depth sampling interval is 3 inches, then z takes on the values (0, +3, f6, ti,...) inches. Denote by VRF(J) the values of the VRF evaluated at a 3-inch data sampling rate, where J = 0, +l, ?2, Then the condition for unity normalization becomes
VRF(-20)+VRF(-19)+...+VRF(-l)+VRF(O)+VRF(+i)+...+VRF(+20)=i (4)
The range J = -20 to +20 is corresponds to -5 feet to +5 feet and is sufficient to encompass the movement of the VRF in most earth formations, i.e., M’ = 6 cm to M’ = 35 cm, as in Figure 10. For example, the notation VRF(-2) represents the value of the VRF at a distance -2x3=-6 inches from the measure point towards the neutron source. This normalization procedure must be repeated at every 3-inch step of log processing.
The VRF is used to handle two different problems, with completely different objectives and algorithms for computing the effective migration length M’. First of all, during logging, M’ may be estimated from the standard near/far ratio and the normalized VRF is then used to deconvolve the DSN@-II far detector response, i.e., to improve ks vertical resolution and thereby to determine more accurately the underlying beds that produced the recorded log. Secondly, if a complete physical and chemical analysis at 3-inch intervals of a formation is known a priori, a macroswgic mixing rule may be used to determine M*. The normalized VRF is then used to predict the DSN -II far detector log response. A reasonable goal for forward modeling is to be able to predict neutron log responses to formations composed of any combination of (3-inch) beds, each of which contains mixtures of any minerals and any fluids.
FORWARD MODELING APPLIED TO THE UNIVERSITY OF HOUSTON API NEUTRON TEST PIT FACILITY
This test facility consists of four 6-foot-thick formations: Austin chalk, Indiana limestone, Carthage marble, and 100% freshwater, with average porosities of 26%, 19%, 2%, and 100%, respectively. Each of the three quarried limestone formations consists of six one-foot slabs. These slabs are further subdivided into four imaginary 3-inch beds. Stationary measurements made near the center of each of the four formations are routinely used to establish the ratio/porosity transform (Figure 6). These same measurements may also be used to establish an empirical relationship between far detector count rate and porosity, at standard borehole conditions. This relationship in turn permits an assignment of a theoretical count rate to each 3-inch bed that is derived from the bed’s measured porosity data. These count rates are shown in Figure 11 and Table 2 and referred to as “the beds” or “the truth,” since if these rates could somehow be determined, then Table 2 could be used to determine their true measured porosities. Denote these theoretical count rates by BEDS(l):
. . . . BEDS(O) ,...I BEDS(99),BEDS(lOO) I... (5)
The VRF(J), when convolved with these count rates, produce the predicted DSN’-II far detector log:
SS
PREDICTED FAR (I) = x VRF(J) * BEDS(I+J) (6) .I=-20
5

SPWLA 31~ Amual Logging Symposium June 24-27.1990
In this way, the VRF is seen simply as a filter applied to the underlying beds that produces the (predicted) log.
The key question that arises is how to determine M’ for use in Eqs. 3 and 4 to obtain VRF(J) for use in Eq. 6. As in Figure 7, if the Ethology, fluid type, and porosty of a formation are given, the effective migration length M’ can be computed. These theoretical M’ values were computed and tabulated in Table 2. However, what is actually needed in order to apply Eq. 3 is a single value of M’ for each position of the tool as it steps across the 3-inch beds comprising the API Neutron Test Facility. A number of mixing rules have been examined, with the following one yielding the best overall agreement between the predicted log and the measured fog:
AGGMSTAR(I) = SORT[geMSTARFILTER(K) * MSTAR’(I+K)] (7)
where the coefficients MSTARFILTER(K) are given in Table 3.
Using these aggregate M’ values in Eqs. 3, 4, and 6 produces the forward modeling results shown in Figure 11. These values compare very favorably wfth the actual recorded values and indicate that the VRF given by Eq. 3 is accurate. Several experimental problems were encountered during the acquisition of the recorded values shown here. Near the bottom, most of the Austin chalk could not be logged because of an excessively long decentralizer assembly. Near the very top of the log, we found it difficult to maintain the tool flush against the Carthage marble with no standoff as the tool entered into 100% freshwater. Study of this figure shows very clearly that the slopes on entering and exiting both the Indiana limestone and the Carthage marble are correctly modeled. The far detector responds “very soon” to the marble/water interface. The low porosity Carthage marble “peak” is pushed downhole towards the neutron source. Both of these features are accurately modeled.
DSN’-II logs will be studied in traditional thin-bed test tanks. Experience shows that the slope of the predicted log is very sensitive to the exact shifting and compression factors of Eq. 3, but not very sensitive to the mixing rule of Eq. 7. Examination of the mixing rule filter values in Table 3 shows that, in effect, material nearest the source is more important than material near the detector.
DECONVOLUTION APPLIED TO THE UNIVERSITY OF HOUSTON API NEUTRON TEST PIT FACILITY
The VRF can be used to deconvolve the DSN’-II far detector count rate log and thereby improve its vertical resolution. Again, the key problem is how to compute M’. Figure 6 suggests a simple method for doing this during logging, based on the standard near/far ratio (R) obtained by using respective near and far block fifters of 27 and 15 inches (Table I, MEDIUM). Thus a polynomial expansion of the form
M* = & + A,R + _.. + A,RN (6)
can be used to obtain M’ from R. One complication is that the coefficients in Eq. 8 are based on data at standard borehole conditions. Hence, the ratios input to Eq. 6 must be corrected for borehole diameter, tool standoff, borehole fluid salinity, etc. so that standard conditions apply (8- inch-diameter, decentralized tool, fresh-water-filled). During actual logging, after this initial value of M’ is used to dewnvolve the far detector count rate, a (smoothed near/deconvolved far) ratio is obtained that can be used to iterate this procedure to improve the estimate for M’ and the accuracy of the deconvolution of the far detector count rate tog.
A number of deconvolution algorithms were examined and this remains an active area of research.‘1.‘3 Results obtained with the traditional Van Cittert deconvolution algorithm are reported.” Denote by FAR(l) the far neutron detector count rates that have been depth-aligned, dead-time- corrected, and lightly prefiltered wfth a three-point, symmetrical fifter that broadens as count rates decrease:
6

SPWLA 31stAMualLoggingSymposium.June24.27.1990
,.., FAR(O),FAR(l) ,..., FAR(99),FAR(lOO) I... (9)
These are observed count rates, i.e., the true vertical response function has already been applied as the tool moved through the wellbore and responded to the beds that were present. Van Cfttert’s deconvolution algorithm begins by applying the VRF to these log values as if they were now the beds, so that a convolved log is obtained:
CONVOLVED FAR(l) = c VRF(J) * FAR(I+J) (10) J=-se
The key assumption of this algorithm is that the shift that is computed between the observed log and the convolved log is the same in magnitude, but opposite in sign, to that obtained when the beds were originally convolved to produce the recorded log. Thus, the final expression for the deconvolved log becomes
DECONVOLVED FAR(l) = ZFAR(I) - c VRF(J) - FAR(I+J) (11) J=-so
Therefore, a filter which accomplishes the Van Cittert deconvolution algorithm in one step from the original log data is simply
-VRF(-20),-VRF(-l9),...,-VRF(-1).2-VRF(O),-VRF(+l),...,-VRF(+19),-VRF(+20) (12)
Since the VRF is never negative and always less than unity, only the center element of this deconvolution filter is positive. This deconvolution filter is symmetric only when the VRF is symmetric (M’ = 15.24 cm, porosity = 12%).
Another operation that must be supported is the smoothing of the near detector response. Both the smoothed near and the deconvolved far must remain materially matched. It was found empirically from analyzing test tank and logging data that a compatible near smoothing function is given by
-z2/M*z NSF = e (13)
Again z is distance away from the measure point. Although the NSF changes its width (vertical extent) as porosity/M* changes, it remains symmetrical about the measure point because its only purpose is to smooth, not to deconvolve.
Figure 12 shows a comparison between the near/far ratio, using standard block filters of 27 and 15 inches for the near and far count rates, and the EVR processed ratio, i.e., smoothed near and deconvolved far. Also shown is M’, as computed using the procedure outlined above. Notice that a better job of deconvolution occurs at higher porosities with their associated smaller M’ values, The Indiana limestone is particularly well resolved, as is the entry into 100% fresh water, whereas the Carthage marble formation, with an M’ value of about 22 cm is poorly resolved. Figure 13 shows the porosity values corresponding to the ratio values of Figure 12. The large overshoot on entry into 100% fresh water from the Carthage marble is exaggerated in porosfty units because of the severe slope present in the ratio/porosity transform at 100% porosity (Figure 8).
Other methods of deconvolution of neutron count rate logs are being studied in order to improve the logs’ vertical resolution. According to the results shown in Figure 12, dual-spaced neutron logging tools resolve vertical detail commensurate with the effective migration length M.-this may represent an ultimate barrier to Significant improvements in vertical resolution obtainable by any methods. We are concentrating on algorfthms that can be applied to real time logging.
SS
7

SPWLA 31st Amual Logging Sympsium. June 24.27. 1990
LOGGING EXAMPLE COMPARING STANDARD AND EVR PROCESSING
Figures 14 to 18 show comparisons between GRIDSN’WSDL logs processed by cunventional means and also by using the EVR processing outlined in this paper. In this example, hole conditions range from very good to excellent. The drilling program did not include the use of any heavy minerals like bartle, so that Pe values in this environment are extremely useful. The logged interval is about 60 meters in extent and O.l-meter intervals were used both for data acquisition and reprocessing. The logged interval is a complex sequence including the Muskeg Salts, Keg River Dolomites and Sands, and the Precambrfan Shield. Anhydrites, shales, and dolomites are present through much of the interval as indicated by core reports. A siderite nodule may be present near X491.4 meters; observed bulk densities approached 3.4 g/cc .and Pe values were near 13.5.
Figure 14 displays the conventional processed GWDSNO-II/SOL logs, with block filters as shown in Table 1, row 2. Figure 15 shows the same logs, but with EVR processing used. The gamma ray log was processed as outlined by Jacobson et al.’ The short-spaced Pe shown is unfiltered and so is not strictly material matched to the density and neutron porosity information. The SDL near and far detector block filters that are compatible with the EVR processed neutron log are 15 and 9 inches, respectively. Figure 16 shows curve-bycufve comparisons between the standard and EVR processing.
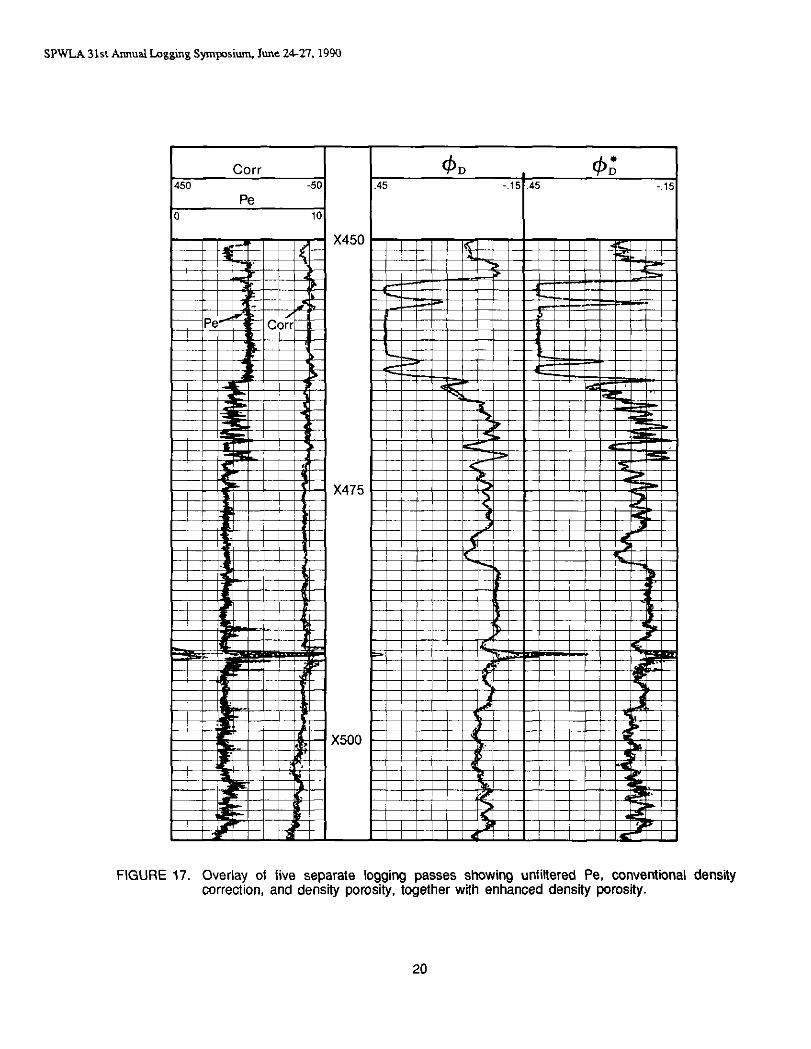
Figures 17 and 18 address the tradeoff between vertical resolution improvement and log repeatability degradation. In these two figures are plotted logging data for 5 individual passes, recorded at speeds that ranged from 7 to 10 meters per minute. In this geological environment, density repeatability will never be excellent because observed bulk densities are high and count rates are low; the converse is true for the neutron logs. Study of these two figures shows that, for many applications, gains in vertical resolution more than offset losses in repeatability. Table 4 summarizes the measured standard deviations obtained from the five repeat runs. These standard deviations result from many kinds of errors, not just those due to nuclear statistics. However, the main conclusion from this data is that the EVR processing reduces repeatability by about a factor of two when compared with conventional processing.
RESULTS AND CONCLUSIONS
Preprocessing of dual-spaced density and neutron logging data should include not only depth alignment, but also material matching of all detector responses so that borehole compensation methods can work accurately, and so that extra beds do not appear in the logs; this applies to all conventional and enhanced data processing methods. Table 1 lists 3-inch block filters for the GR/DSN@-WSDL logging tools that insure that all measurements are materially matched, i.e., compatible. Excellent log repeatability will be obtained. The current conventional PLS-system field practice is to use medium filtering, with a vertical resolution of 33 to 36 inches. Due to the far neutron source-to-detector spacing, the minimum vertical resolution that can be obtained by these methods is 21 to 24 inches.
The new method presented in this paper was developed to improve the vertical resolution of dual-spaced far neutron detector measurements down to the range of 12 to 15 inches. The filtering of the gamma ray, near neutron detector, and both dual-spaced density detectors can be significantly reduced while retaining full compatibility of all measurements, standard shop calibration procedures, and standard dual-detector neutron and density borehole compensation procedures. Simple block filtering can be retained for filtering the density tool information. The new method, called enhanced vertical resolution (EVR) processing, significantly improves neutron vertical resolution while establishing a new compromise with repeatability that will be acceptable in many logging applications. It is anticipated that EVR processing will yield more accurate neutron porosity values in rugose boreholes than previous methods based on near detector profiling.
The new method uses the effective neutron migration length M’ to compute the far neutron detector vertical response function (VRF). VRF forward modeling produces accurate results for the University of Houston API Test Pit Facility. Use of the VRF with Van Cittert deconvolution improves the vertical resolution of neutron logs.
a

SPWLA 31~ Annual Logging Symposium, June 24-27. 1990
Although EVR processing is currently available only by reprocessing telemetry tapes in Houston, it will soon be available in real-time or playback modes at the wellsite.
ACKNOWLEDGMENTS
The author wishes to thank the HLS Research and Engineering Department for support of this work. Larry Jacobson was very encouraging during this work and Abbas Merchant has made several key improvements and suggestions to this paper. I have had several spirited discussions with Darren Smith and Randy Gold on deconvolution of neutron logs. Axe1 Kirchgessner and John Cox helped during the acquisition of our DSf@-II data at the University of Houston. I want to thank Home Oil, Inc. for their assistance in obtaining core data and other information about the well HLS logged for them and for releasing the logging data for publication. Doug Boyd of HLS is very knowledgeable of the geology of the area in which the logs were recorded and was very helpful in preparing the logging example.
1.
2.
3.
4.
5.
6.
7.
8.
9.
10.
11.
12.
13.
14.
REFERENCES
Schultz, W. E., and Thadani, S. G., “Applications of Digital Filtering Techniques to Nuclear Well Logs,” SPWLA 29th Annual Logging Symposium, June 1981.
Flaum, C., Galford, J. E., and Hastings, A., “Enhanced Vertical Resolution Processing of Dual Detector Gamma-Gamma Densrty Logs,” SPWLA 28th Annual Logging Symposium, June 1987.
Galford, J. E., Flaum, C., Gilchrist, Jr., W. A., and Duckett, S. W.,“Enhanced Resolution Processing of Compensated Neutron Logs,” SPE 15541, October 1986.
Flaum, C., Holenka, J. M., and Case, C. R., “Eliminating the Effect of Rugosity from Compensated Density Logs by Geometrical Response Matching,” SPE 19812, 1989.
Mathis, G. L., and Gearhart, D., “Characterization of Vertical Resolution for PE and Density Logging,” SPWLA 29th Annual Logging Symposium, June 1988.
Petler, John S., “Modeling the Spatial Response of a Compensated Density Tool,” paper presented at IEEE Meeting, San Francisco, January 1990.
Jacobson, L. A., Gadeken, L. L., Merchant, G. A., and Wyatt, Jr., D. F., “Enhancement of Nuclear Measurements Through Deconvolution,” paper to be presented at SPWLA 31st Annual Logging Symposium, June 1990.
Smith, M. P., “Neutron Absorption Effects on Dual-Spaced Thermal NeutronLogging Tools,” SPWLA 28th Annual Logging Symposium, June 1987.
Ellis, D. V., Flaum, C., Galford, J. E., and Scott, H. D., “The Effect of Formation Absorption on the Thermal Neutron Porosity Measurement,” SPE 16814, September 1987.
Beckhurts, K. H., and Wirtz, K., Neutron Physics, Springer-Verlag, Berlin, 1964.
Lyle. W. D., and Williams, D. M., “Deconvolution of Well Log Data, An Innovations Approach,” SPWLA 27th Annual Logging Symposium, June 1986.
Gartner, M., “A New Resolution Enhancement Method for Neutron Porosity Tools,” IEEE Trans. Nuclear Science, Vol. 36, No. 1, 1989.
Quirein, J. A., and Purdy, C. C., “Improved Resolution of Nuclear Well Logs,” Paper A, SAID 12th International Formation Evaluation Symposium Transactions, October 1989.
Jansson, Peter A., Deconvolurion With Applications in Spectroscopy, Academic Press, Inc., Orlando, 1984.
ss
9

SPWLA 31st Amual Logging Symposium. June 24-U. 1990
TABLE 1.
MATERIAL-MATCHED BLOCK FILTERS FOR STANDARD PLS PROCESSING OF GR/DSN%SDL DATA
(All quantities are expressed in inches.)
FILTER GR DSN’ss DSN% SDLss SDLls LENGTH
LIGHT 15 15 3 21 15 21-24
MEDIUM 27 27 15 33 27 33-36
HEAVY 39 39 27 4.5 39 45-48
ENHANCED RESOLUTION COMPATIBLE FILTERS
EVR (miihed)
NSF VRF 15 9 12-15
TABLE 2.
BASIC DATA FOR THE UNIVERSITY OF HOUSTON API NEUTRON TEST PIT FACILITY Each row represents a l-foot slab of formation.
In this paper, each l-foot slab consists of 4 (imaginary) beds, each 3-inches thick.
POROSITY(%) M’(cm) COUNTS/SEC
100.0 7.6 773
1.5 22.3 15233 1.0 21.9 14976 1.9 21.8 14961 1.7 22.0 15065 2.6 20.9 14369 1.5 22.3 15219
18.5 13.0 4135 18.7 13.0 4096 18.7 13.0 4096 18.9 12.9 4063 16.5 13.0 4135 19.0 12.9 4046
25.0 17.0 3230 28.7 11.3 2717 25.8 11.8 3119 25.4 11.9 3175 26.2 11.6 3062 25.3 11.9 3189
_
10

TABLE 3.
SPWLA 3161 Annul Logging Symposium June 24-U. 1990
FILTER COEFFICIENTS USED TO COMPUTE AGGREGATE M’ The neutron source is located at -4 and the center of the far neutron detector is at +4.
Each entry here represents an interval of 3 inches.
-6 -5 -4 -3 -2 -1 0 +I +2 +3 +4 +5 +6
.02 .06 .32 .24 .I6 .I2 .08 .08 .04 .03 .02 ,015 .Ol
TABLE 4.
MEASURED STANDARD DEVIATIONS FOR STANDARD AND EVR PROCESSING OF NEUTRON AND DENSITY LOGS
All quantities are stated in porosity units (pu). The neutron and density data were not obtained at the same depths.
NPHI 30 16 9 4 -2
a(NPHI) 1.0 .2 .2 .2 <.I
a(EVRNPHI) 2.0 .5 .5 .4 c.1
DPHI 40 16 2 -4
a(DPHI) .2 1.5 .5 .3
o(EVRDPHI) .3 2.0 1.0 .7
ss
11


SPWLA 31st Annual Logging Sympsiun. June 24-27.1990
Vertical Response Intervals for GR/DSN@‘-IIISDL Tools
GR DSN%s DSN%r.s (Near) (Far)
SDLss SDLLS SDLss SDL,,s (Density! (Density) (Pe) (Pe)
Measurements
FIGURE 4. Vertical response volumes for the GR/DSN”-IIISDL nuclear tools. These volumes are shown depth-aligned at the string’s measure point. The largest volume is that for the DSN@-II far (- 24 inches) and the smallest is that for the SDL near Pe measurement (< 3 inches).
Compatible Filtering for GRIDSN”-IIISDL Tools
DSN-lls\ (Near)
DSN’%,.s
(Far) SDL\\ SDL1.s SDL\s SDL1.s
(Density) (Density) (Pe) (Pe)
Measurements
FIGURE 5. Minimum (“light”) compatible filtering for the GR/DSN@-WSDL nuclear tool string. All count rates (except DSN”-II far) are smoothed with block filters so that all three tools’ count rates are material matched. The minimum vertical response interval is about 2 feet.
SS
13

0 , ! I I , I ,
10 1, 12 13 14 15 16 17 18 19 20 21 22
Effective Neutron Migration Length, M* (cm)
FIGURE 6. Strong correlation between DSN’-II ratio and effective migration length, for a wide range of lithology and fluid types. See Figure 5 from reference 8.
MATRIX MATRIX
MATRIX DENSIT/ ABSORPTION
(g,cc~ CROSS SECTION
W)
Limestone 2,71 7~1 I Sandstone 2.65 10
Dolomite 2~87 10
LIMESTONE
0 I , , , , , , , ! ! I 0 10 20 30 40 50 60 70 80 90 100
Formation Poroslty (%)
FIGURE 7. Effective migration length versus porosity for limestones, sandstones, and dolomites saturated with freshwater. Although tool ratio and M’ are correlated, porosity and M’ are lithology dependent.
14

SPWLA 31stArmualLoggingSymposiumJune2627,1990
16-
01 I I
0 10 20 30 40 50 60 70 80 SO 100
Formation Porosfty (%)
FIGURE 8. DSN’-II near/far ratio versus formation porosity.
.4 -
a 3 Y = 2 .I-
2 Y Center of Far Neutron’Detector
l”~‘l”“l”“1 -20 -15 -10 -5 0 5 10 15 20 25
5inch Steps From Measure Point (z)
FIGURE 9. VRF versus distance from measure point for DSI\$-II. See Eq. 3 in the text. The VRF is symmetric when M’ = 15.24 cm (0 = 12%).
ss
15

SPWLA 31s Annual Logging Symposium. June 24.27. 1990
,2
M* = lOcm,4-43%
M* = 15.24cm ,$= 12% 1 M* = 26cm,@= 0%
3-Inch Steps From Measure Point (z)
FIGURE IO. VRF versus distance from measure point. showing the effects due to variation in M’ (apparent limestone porosity).
15000 - - +A_ x / Y “the beds” or “the truth”
\ - +-i--t measured log readings :
‘:
; 10000- ,” \
\ a
i
\-forward modeling prediction
i & ,?
5000 - tl
\ \ \
v++&
_ -xz@-++ _+ Chalk --)-
0 I l~~~a--I-C~~:,4p~~~~~~~~~
I 96
I 72
I 48 24 0
Depth in 3-inch Steps
FIGURE 11. Forward modeling results for the University of Houston API Neutron Test pit Facility. See Table 2 for porosities, count rates, and M’ values.
16

SPWLA 31s Annual Logging Symposium, June 2427.1990
FIGURE 12. Conventional and enhanced processing 01 measured near/far ratios for the University of Houston API Neutron Test Pit Facility.
FIGURE 13. Conventional and enhanced processing of porosity values from the ratios of Figure 12. Also shown are the measured test pit porosity values for the University of Houston API Neutron Test Pit Facility.
SS
17
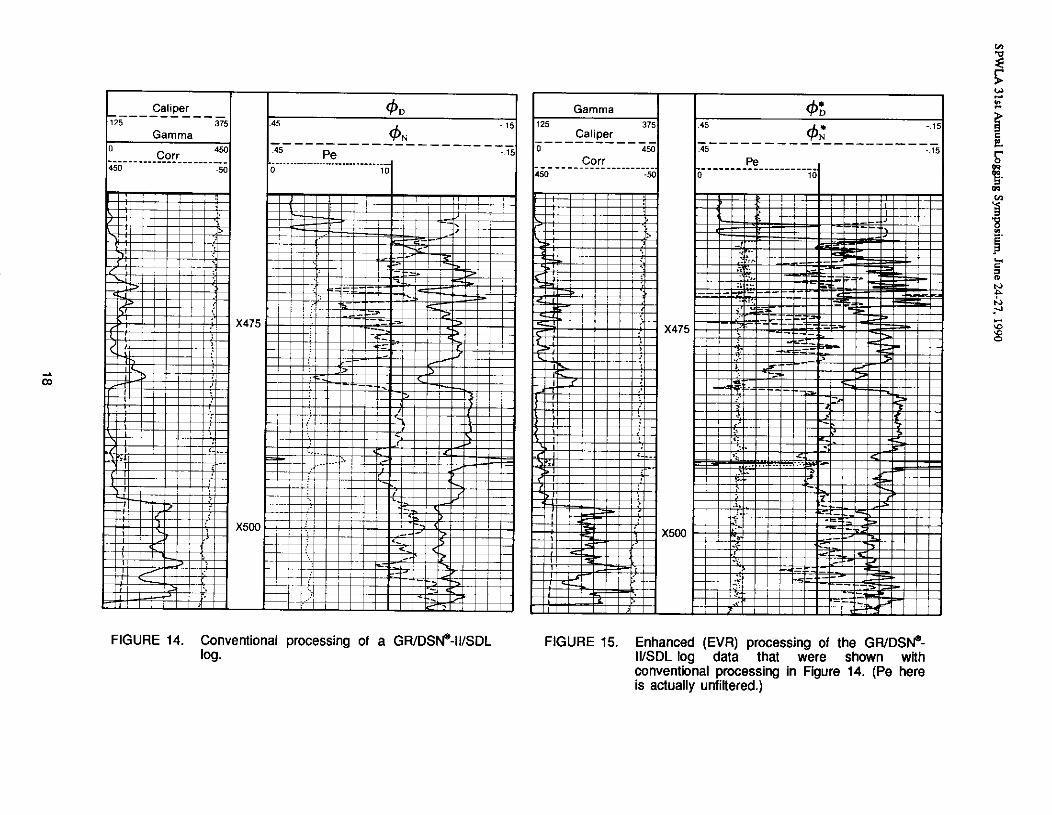
FIGURE 14. Conventional processing of a GR/DSI\P-IIISDL log.
FIGURE 15. Enhanced (EVR) processing of the GWDS@- WSDL log data that were shown with conventional processing in Figure 14. (Pe here is actually unfiltered.)

SPWLA 31st Annual Lagging Symposium. June 24-27. 1990
Pe* _________ ____ ____________.. 0 10
Pe 0 10 H GR* __-___- ___________ 0 450
GR 0 450
E 4,’ 5________‘________,~ 5_____________
&I 6 15 .45
+
SS
FIGURE 16. Comparison of conventional and enhanced processing for a GR/DSN*-IWSDL log. (See Figures 14 and 15.)
19
SPWLA 31s Annual Logging Sympsium he 2&U, 1990
FIGURE 17. Overlay of five separate logging passes showing unfiltered Pe, conventional density correction, and density porosity, together with enhanced density porosity.
20

SPWLA 31st Annual Logging Symposium. June 24-27. 1990
x450
x475
x500
ss
FIGURE 18. Overlay of five separate logging passes showing enhanced gamma ray and neutron, along with conventional neutron.
21
