enhanced vision ight deck technology for commercial ... · ight deck technology for commercial...
TRANSCRIPT

Enhanced vision flight deck technology for commercialaircraft low-visibility surface operations
Jarvis (Trey) J. Arthur, IIIa, R. Michael Normanb, Lynda J. Kramera, Lawrence J.Prinzel, IIIa, Kyle K. E. Ellisa, Stephanie J. Harrisonc and J. Ray Comstocka
aNASA Langley Research Center, Hampton, VA
bBoeing Research and Technology, Hampton, VA
cVirginia Polytechnic Institute and State University, Blacksburg, VA
ABSTRACT
NASA Langley Research Center and the FAA collaborated in an effort to evaluate the effect of Enhanced Vision(EV) technology display in a commercial flight deck during low visibility surface operations. Surface operationswere simulated at the Memphis, TN (FAA identifier: KMEM) airfield during nighttime with 500 Runway VisualRange (RVR) in a high-fidelity, full-motion simulator. Ten commercial airline flight crews evaluated the efficacyof various EV display locations and parallax and minification effects. The research paper discusses qualitative andquantitative results of the simulation experiment, including the effect of EV display placement on visual attention,as measured by the use of non-obtrusive oculometry and pilot mental workload. The results demonstrated thepotential of EV technology to enhance situation awareness which is dependent on the ease of access and locationof the displays. Implications and future directions are discussed.
Keywords: Enhanced Flight Vision Systems, Enhanced Vision, NextGen, Equivalent Visual Operations, FlightSimulation
1. INTRODUCTION
Research and experience has shown that reduced operational tempos and delays in current-day surface operationsdue to low visibility conditions contribute significantly, and are growing in their contribution, to National AirspaceSystem (NAS) delays. To ensure the continuation of safe ground operations during low visibility-conditions, pilotsmust maintain awareness of: 1) their geographic position (i.e., location on the airport); 2) their cleared navigationrouting; 3) the surface types and associated indications (e.g., runways, taxiways, maneuvering/non-maneuveringareas, hold lines, etc.) and, 4) their position with respect to other aircraft, vehicles, and obstacles/objects - allwhile keeping the aircraft on the pavement (i.e., maintaining path control).
Under an Inter-agency Agreement, the NASA Langley Research Center (LaRC) and the FAA are conductingcollaborative research activities to ensure effective technology development and implementation of design stan-dards for the Next Generation Air Transportation System (NextGen). As part of this agreement, research isbeing conducted to assess the introduction and use of Enhanced Vision (EV) and Enhanced Flight Vision Sys-tems (EFVS) advanced cockpit vision technologies for Low Visibility Operations/Surface Movement Guidanceand Control System (LVO/SMGCS).
1.1 Surface Movement Guidance and Control System
As counter-measures to potential loss-of-safety margins in low visibility conditions, the FAA has establishedregulations, standards, and supporting advisory material in the development of Surface Movement Guidanceand Control System (SMGCS) requirements for U.S. airports where scheduled air carriers are authorized toconduct operations when the visibility is less than 1,200 feet Runway Visual Range (RVR). A SMGCS planfacilitates the safe movement of aircraft and vehicles on the airport by establishing rigorous control proceduresand requiring enhanced visual aids. SMGCS involves surveillance, routing, guidance, and control for controllers,
Further author information: Jarvis (Trey) Arthur, E-mail: [email protected], Telephone: 1-757-864-6609
https://ntrs.nasa.gov/search.jsp?R=20130013355 2018-06-19T08:34:34+00:00Z
pilots, vehicle drivers, marshallers, emergency services, airport authorities, regulatory authorities, and securityservices. These plans address the information needs and define the roles and responsibilities of both of the AirNavigation Services Provider and to each aircraft and vehicle operating in the movement area.
Key enabling elements of SMGCS are enhanced visual aids (AC150/5340-30F) consisting of lights, markings,and signage on the airport designed to provide visual cues to pilots and vehicle operators sufficient to maintaintheir situation awareness and to ensure the continuation of safe, efficient ground operations. These enhancedvisual aids establish mechanisms by which surveillance, routing, guidance, and control of surface operations inlow visibility conditions may be achieved.
1.2 Enhanced Vision Systems for commercial operations
The Vehicle Systems and Safety Technologies (VSST) project, under NASA’s Aviation Safety Program, is con-ducting research, development, test and evaluation of crew-vehicle interface technologies to increase the pilots’ability to avoid, detect, and recover from adverse events that could otherwise result in accidents/incidents. Onegoal is to proactively overcome aircraft safety barriers that might otherwise constrain the full realization of theNextGen. Part of this research effort involves the use of synthetic and enhanced vision systems and advanceddisplay media as enabling crew-vehicle interface technologies to meet these safety challenges.
EV is an electronic means to provide a display of the external scene topography (the natural or man-madefeatures of a place or region especially in a way to show their relative positions and elevation) through the useof an imaging sensor, such as a Forward Looking Infrared (FLIR) or millimeter wave radar. Development ofapplications of EV technology for commercial, business, and GA aircraft was energized in January 20041 whenTitle 14 of the US Code of Federal Regulations (CFR) §91.175 was amended such that operators conductingstraight-in instrument approach procedures (in other than Category II or Category III operations) could thenoperate below the published Decision Altitude (DA)/Decision Height (DH) or Minimum Descent Altitude (MDA)when using an approved EFVS. An EFVS, in this application, is an integrated conformal display of EV andsymbology shown on the pilot’s Head-Up Display (HUD). In most atmospheric conditions, especially whennatural visibility is reduced due to night, smoke, or haze, the EV provides a visibility improvement over naturalvision and it can be logically concluded that improvements in situation awareness (awareness of geographicposition, of positioning on the runways and taxiways, and of objects, traffic, and other vehicles) are derived.This information may enable the flight crew (pilot) to more safely operate on the surface, including taxi, parking,and gate operations, or to conduct these operations in weather and visibility conditions for which this wouldnormally be precluded. Such a goal is supported by the FAA’s mid-term vision for NextGen.2 An operationalgoal may be to utilize flight deck equipage (i.e., EV) in lieu of LVO/SMGCS infrastructure requirements (e.g.,enhanced visual aids).
As with any new technology, the integration within the cockpit must be carefully considered. The consid-erations include, for example, the EV display location and the associated cognitive and visual workload andattention in utilizing this information. Further, the integration must also consider how the pilot will fuse thisinformation with the disparate other sources of navigation information, positional awareness, and traffic aware-ness available inside and outside the cockpit.3 This integration must consider the different frames of references,fields-of-regard, and display minification factors for each information source. The EV information itself maybe displayed in an ego-centric or exo-centric format, shown in a head-up or head-down location with variousfields-of-regard or minimization factor. (Note that an EFVS application requires a conformal, ego-centric EVdisplay on the pilot’s HUD). The process of information fusion must span the angular separation between thepaper or electronic charts, the out-the-window information, flight-critical/task-critical instrumentation, and theEV display.
The present research is motivated by the need to quantify the influence of EV operations within the flightdeck during surface operations, and identify if operational credit might be possible whereby an EV-approvedand equipped aircraft could operate in prevailing visibilities lower than currently approved. Consideration of thefield-of-regard/field-of-view, the viewing perspective (ego-centric vs. exo-centric), and the spatial location of theinformation were assumed to be critical factors.

2. EXPERIMENT
The objective of the research presented in this paper was to evaluate the use of EV during LVO/SMGCS andassess the impact of different EV flight deck design considerations; specifically, EV display location, EV imageminification, and EV sensor (camera) parallax.
2.1 Simulation facility
Simulation research was conducted in the NASA LaRC Research Flight Deck (RFD) motion based simulator(Fig. 1). The RFD was configured to mimic the instrument panel of current state-of-the-art commercial transportaircraft, with four 10.5” vertical by 13.25” horizontal, 1280x1024 pixel resolution, color displays tiled across theinstrument panel. Also, the RFD included a mode control panel, Flight Management System (FMS), controldisplay units, and hydraulic-actuated side-stick control inceptors. A collimated Out-the-Window (OTW) sceneprovided approximately 200◦ horizontal by 40◦ vertical field-of-view (FOV) at 26 pixels per degree.
Figure 1. The Research Flight Deck motion simulator at NASA Langley Research Center.
Appropriate pre-recorded Airport-Terminal Information Service (ATIS) messages were presented (aurally)providing information on the environmental conditions and airport status (e.g., SMGCS operations in use) foreach scenario.
The test facility had a navigation and communication facilities simulation that replicated realistic voicecommunication during approach, taxi-out, and taxi-in scenarios. The communications included pre-recordedvoice communications to stage most of the scenarios and create realistic ‘party-line‘ chatter to promote realism.A researcher also provided simulated Air Traffic Control (ATC) directives and information to augment thepre-recorded ATC audio, as well as intervention when required (i.e., when a crew queried ATC with questionsregarding a clearance).
2.2 Enhanced vision simulation
The EV was simulated as a combined short-wave, mid-wave (∼ 1.0 to 5.0 micron) FLIR sensor. The simulatedsensor aperture (normal parallax condition) was placed 5.25 ft below the pilot design eye point reference (DERP),1.5 ft to the right, and 6.5 ft forward, simulating an aircraft “chin” installation. The simulated camera wasaligned with the HUD, so any image shift between the FLIR displayed on the HUD and the OTW was dueonly to installation parallax. The image shift (i.e., error) due to camera parallax for this case was half of themaximum error allowable for an EFVS in accordance with RTCA DO-315,4 equating to a 2.5 mrad image offsetof a point located at a 2000 ft distance. A large parallax error condition was also simulated which moved theFLIR sensor location to a point 10.5 ft below the DERP (lateral and longitudinal locations remained the sameas before), equating to an apparent image shift of approximately 5 mrad for a point at 2000 ft distance, andequivalent to the maximum allowable error in accordance with RTCA DO-315.

2.3 EV display locations
The location of the EV information in the cockpit was varied:
• EV was displayed on the HUD, assuming that the display was used as an EFVS. When other configurationswere tested, the HUD was stowed. The HUD was collimated (focused at approximately optical infinity)and subtends 30◦ H by 24◦ V FOV.
• A 5.6 inch diagonal LCD was placed above the glare shield on the center post of the forward window(“Center Auxiliary Display (AD)”).
• Two additional ADs with a diagonal of 8 inches were placed at 60◦ and 90◦ outboard from the longitudinalaxis (“60◦ AD” and “90◦ AD”). During a data trial, only one of these (or none) ADs were turned-on at agiven location.
• A 6 inch diagonal EV image in the upper left quadrant of the Pilot Monitoring (PM)’s NavigationalDisplay (ND).
2.4 Evaluation pilots
Ten commercial flight crews from various US airlines participated in the experiment. The pilots were pairedbased upon their current employer to try to minimize intercrew conflicts in Standard Operating Procedures andCrew Resource Management procedures. Each pilot held an Airline Transport Pilot rating with at least 100hours of HUD experience and had experience with EV.
2.5 Flight crew training
The Evaluation Pilots (EPs) were given a 45-minute classroom briefing to explain the display concepts and theevaluation tasks for the experiment. After the briefing, a 30-minute training session was conducted to familiarizethe EPs with the RFD simulator. Following this training, 4 hours of data collection was conducted. At the endof the day, a post-test interview was conducted to solicit the crew’s comments on the experiment. The total dutytime for an EP was approximately 8 hours.
2.6 Methodology
The experimental design was a 5 (EV display location) by 2 (image scale/field-of-regard) by 2 (size of parallaxerror) partially factorial within-subjects design. In addition, a baseline condition (no EV/EFVS) was also testedto generate comparative performance data.
The selected configurations are shown in Table 1. Two EV sensor FOVs were simulated. As indicated inTable 1, this created 2 field-of-regard (FOR) (i.e., the angular extent of the external world represented on thedisplay) conditions for testing. The “Normal” FOR corresponds to the sensor FOV which created a non-minifiedHUD EV display (the EV image FOR is approximately the same as the HUD). In other words, the EV image onthe HUD was conformal in that it overlaid the real-world. This same sensor FOV was used on each of the other“Normal” FOR display concepts. The term “Minified” corresponds to when the sensor FOV was doubled. Thiscaused a 2x minification factor (i.e., the ratio of the EV sensor FOV to the display FOV is doubled). As thecamera sensor cannot be mounted at the pilot’s eye, there will be inherent parallax in the EV image especiallynoticeable on the HUD. The terms “Small” and “Large” correspond to the degree of parallax in the EV display,effectively yielding 2.5 and 5.0 mrads of parallax error at a range of 2000 feet.
In addition to the conditions shown in Table 1, two additional run conditions were conducted: a baselinecondition (no Enhanced Vision System (EVS)) and an off-nominal event. The single off-nominal scenario involvedthe detection of a baggage cart, positioned to be visible in the EV image, but not readily OTW. The off-nominalscenario was conducted with two EV locations (HUD and Center AD), thereby, investigating issues associatedwith different head-up positions of EV for the Pilot Flying (PF) and head-up versus head-down for the PM. Theoff-nominal scenario was unexpected by the flight crew and was used to evaluate latent safety issues associatedwith SMGCS operations.
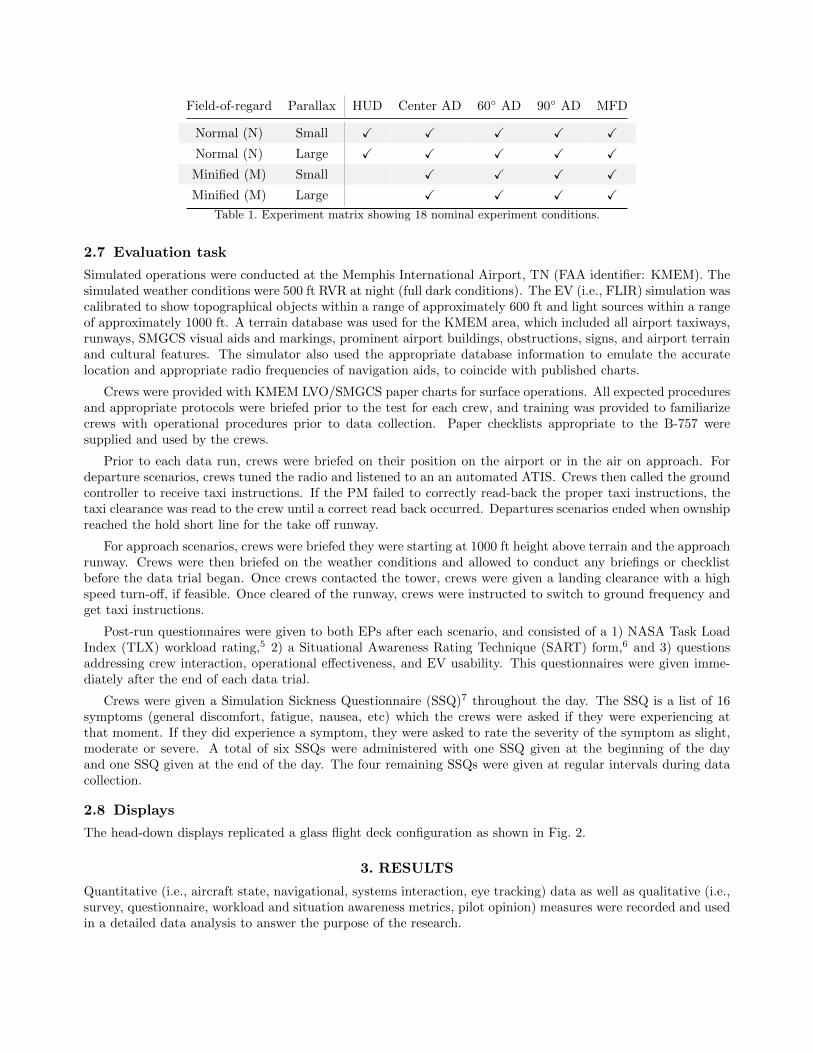
Field-of-regard Parallax HUD Center AD 60◦ AD 90◦ AD MFD
Normal (N) Small X X X X X
Normal (N) Large X X X X X
Minified (M) Small X X X X
Minified (M) Large X X X X
Table 1. Experiment matrix showing 18 nominal experiment conditions.
2.7 Evaluation task
Simulated operations were conducted at the Memphis International Airport, TN (FAA identifier: KMEM). Thesimulated weather conditions were 500 ft RVR at night (full dark conditions). The EV (i.e., FLIR) simulation wascalibrated to show topographical objects within a range of approximately 600 ft and light sources within a rangeof approximately 1000 ft. A terrain database was used for the KMEM area, which included all airport taxiways,runways, SMGCS visual aids and markings, prominent airport buildings, obstructions, signs, and airport terrainand cultural features. The simulator also used the appropriate database information to emulate the accuratelocation and appropriate radio frequencies of navigation aids, to coincide with published charts.
Crews were provided with KMEM LVO/SMGCS paper charts for surface operations. All expected proceduresand appropriate protocols were briefed prior to the test for each crew, and training was provided to familiarizecrews with operational procedures prior to data collection. Paper checklists appropriate to the B-757 weresupplied and used by the crews.
Prior to each data run, crews were briefed on their position on the airport or in the air on approach. Fordeparture scenarios, crews tuned the radio and listened to an an automated ATIS. Crews then called the groundcontroller to receive taxi instructions. If the PM failed to correctly read-back the proper taxi instructions, thetaxi clearance was read to the crew until a correct read back occurred. Departures scenarios ended when ownshipreached the hold short line for the take off runway.
For approach scenarios, crews were briefed they were starting at 1000 ft height above terrain and the approachrunway. Crews were then briefed on the weather conditions and allowed to conduct any briefings or checklistbefore the data trial began. Once crews contacted the tower, crews were given a landing clearance with a highspeed turn-off, if feasible. Once cleared of the runway, crews were instructed to switch to ground frequency andget taxi instructions.
Post-run questionnaires were given to both EPs after each scenario, and consisted of a 1) NASA Task LoadIndex (TLX) workload rating,5 2) a Situational Awareness Rating Technique (SART) form,6 and 3) questionsaddressing crew interaction, operational effectiveness, and EV usability. This questionnaires were given imme-diately after the end of each data trial.
Crews were given a Simulation Sickness Questionnaire (SSQ)7 throughout the day. The SSQ is a list of 16symptoms (general discomfort, fatigue, nausea, etc) which the crews were asked if they were experiencing atthat moment. If they did experience a symptom, they were asked to rate the severity of the symptom as slight,moderate or severe. A total of six SSQs were administered with one SSQ given at the beginning of the dayand one SSQ given at the end of the day. The four remaining SSQs were given at regular intervals during datacollection.
2.8 Displays
The head-down displays replicated a glass flight deck configuration as shown in Fig. 2.
3. RESULTS
Quantitative (i.e., aircraft state, navigational, systems interaction, eye tracking) data as well as qualitative (i.e.,survey, questionnaire, workload and situation awareness metrics, pilot opinion) measures were recorded and usedin a detailed data analysis to answer the purpose of the research.

Figure 2. The PF head-down displays (left) and the PM head-down displays (right). The MFD (EV repeater) is shownin the upper left of the PM ND.
3.1 Effects of display condition
The 5 display conditions were: 1) HUD; 2) Center AD; 3) 60◦ AD; 4) 90◦ AD; and, 5) Multi-Function Display(MFD).
3.1.1 Average taxi speed
Average taxi speeds were calculated as the total distance traveled, divided by the elapsed time. For arrivalscenarios, averaging started when ownship was below 30 knots ground speed on rollout and continued untilthe end of each run. For departure scenarios, averaging started when first above 1.0 knots ground speed, andcontinued until the end of each run.
An Analysis of Variance (ANOVA) was conducted on the average taxi speed (measured in knots) dependentvariable for display condition (19 display conditions). Levenes test for equality of variances was met for thepresent analysis. Display condition was not significant, F (18, 161) = 0.303, p = 0.989, for average taxi speed.The overall mean taxi speed was 11.4 knots with a standard deviation of 2.4 knots.
3.1.2 Head up time, pilot flying
Oculometers provided eye and head position and pointing vectors for each crew throughout the runs. AnANOVA was conducted on the PF head-up time percentage dependent variable for display condition (19 displayconditions). Levenes test for equality of variances was met for the present analysis. Display condition wasnot significant, F (18, 161) = 1.013, p = 0.449, for PF head-up percentage time. Operationally, the presence ofEV and where it was displayed did not affect the PF head-up percentage time when compared to conventionaldisplays without EV information. The overall mean PF head-up percentage time was 66.2% with a standarddeviation of 19.8%.
3.1.3 Head-up time, pilot monitoring
Levene’s test for equality of variances was not met for the PM head-up percentage time. Logarithmic-transformedhead-up time percentage data met Levene’s test for equality of variances and was used in an ANOVA on the PMhead-up time percentage data8 for display condition (19 display conditions). When means of the logarithmic PMhead-up percentage time data are transformed back to original units, the mean reported is actually the geometricmean of the head-up percentage time and that is what is reported. Display condition was not significant,F (18, 157) = 1.507, p = 0.094, for PM head-up percentage time. Operationally, the presence of EV and where itwas displayed did not affect the PM head-up percentage time when compared to conventional displays withoutEV information. The overall (geometric) mean PM head-up percentage time was 53.0%.
3.1.4 Situation awareness
A SART was also administered after each run. The SART incorporated three dominant components: demandon the pilot’s resources, supply of resources, and understanding of the situation. Pilots rated their perception ofthe impact of these components using a 7-point Likert scale.
An ANOVA was conducted on the SART dependent variable for display condition. Mauchly’s Test of Spheric-ity was not significant (p = 0.056). The omnibus F-test revealed a statistically significant difference for display
condition, F (18, 342) = 2.626, p < 0.001. However, the pair-wise comparison analyses with Bonferroni correctionfailed to reveal any significant effects across display conditions (p > 0.05).
A planned comparison was conducted contrasting each of the display conditions (18 conditions) to the baselinecondition (No HUD, No EV). This analysis evinced some significant contrasts. The following display conditionswere rated significantly worse (p < 0.05) than the baseline condition (SART=7.80):
1. 90◦ AD, Normal FOR (N), Small Parallax, F (1, 19) = 4.701, p = 0.043
2. 90◦ AD, Normal FOR (N), Large Parallax, F (1, 19) = 7.325, p = 0.014
3. 90◦ AD, Minified FOR (M), Large Parallax, F (1, 19) = 4.750, p = 0.042
4. 90◦ AD, Minified FOR (M), Small Parallax, F (1, 19) = 6.577, p = 0.019
This result indicates that pilots rated the 90◦ AD location as significantly worse for situation awarenesscompared to the baseline condition. Pilot comments indicate that this reduction in situational awareness (SA)was largely due to its location outside the primary or secondary field-of-view compared to the baseline condition(no EV).
3.1.5 Workload
The NASA TLX assessed workload using six scales associated with mental, physical, and temporal demand,performance, effort, and frustration level. The raw TLX scoring was used based on Hart and Staveland.5
An ANOVA was conducted on display condition for the dependent variable, NASA TLX (using the totalof the 6 attribute ratings). Because the Mauchly’s Test of Sphericity was significant, the Greenhouse-Geissercorrection was applied, F (18, 119) = 2.871, p < 0.01.
Because of the large number of testable conditions (19 including baseline condition), the pair-wise comparisonswith Bonferroni correction did not yield significance (using a significance level α of 0.002=0.05/19). For displaycondition, the objective was to determine whether there were any significant differences for all display conditions(type, parallax, minification) as a whole compared to the baseline condition. Therefore, a planned comparisonwas conducted for each display condition compared to the baseline condition. The planned comparisons showedthat none of the conditions were significantly different in perceived mental workload qualitative ratings from thebaseline with the exception of the following:
1. 90◦ AD, Minified FOR (M), Large Parallax, F (1, 19) = 4.860, p = 0.041
The result confirms that the 90◦ AD location presents workload issues to the pilot particularly when thedisplay has a large minification and large parallax. Although the other 90◦ locations were not found to be ratedsignificantly lower for workload than baseline, the descriptive results do suggest that pilots tended to considerthe 90◦ location poorer for workload compared to baseline.
3.1.6 Post-run questions
Nine questions were presented to crews and asked for their level of agreement on a 7-point Likert scale:
1. I was able to maintain taxi accuracy during SMGCS operation.
2. I was aware of ownship position on the airport surface.
3. I was aware of the cleared SMGCS taxi route.
4. I was aware of traffic and other vehicles during SMGCS operation.
5. I was aware of SMGCS signage, markings, and visual aid.
6. The FLIR presentation was effective for SMGCS taxi operation (ease of access, size, etc.).
7. The display concepts and SMGCS charts contributed to communication effectiveness (ATC and FlightCrew)
8. The display concepts and SMGCS charts promoted crew resource management, coordination, and cohesion.
9. The display concepts and SMGCS charts contributed to perceived safety during SMGCS taxi operation.
The analysis of the post-run questionnaire data for display condition show some advantages of EV presentationonly for Question 1 (“I was able to maintain taxi accuracy during SMGCS operations”) and Question 2 (“I wasaware of ownship position on the airport surface”). Pilots reported being able to better maintain taxi accuracyduring SMGCS operations for most display conditions, except HUD, compared to baseline; those non-HUDdisplays that were non-significant were due largely because of minification factor. At the visibility conditiontested, there were sufficient cues OTW for tactical vehicle control. Since the EV cues on the HUD did not alignperfectly with the OTW cues due to parallax, some crews found this distracting. Flight crews also reportedbeing significantly more aware of ownship position on the airport surface with the FLIR except in the 90◦ ADlocation with minified and large parallax condition. The other post-run question data did not show significantdifferences; the EV display concepts were no different than the baseline (no EV) condition.
Overall, for the EV display conditions (18 experimental conditions), there were few practically significanteffects when results were analyzed solely by display condition. Instead, the data were analyzed as a function ofthe experimental treatment manipulations which were: (a) effect of display type, (b) effect of minification, and(c) effect of parallax as described below.
3.2 Effects of parallax
3.2.1 Average taxi speed
An ANOVA was conducted on the average taxi speed for EV Display Location (HUD, MFD, Center AD, 60◦ AD,90◦ AD) and parallax (Small, Large). The display FOV was fixed at Normal for this analysis. Levene’s testfor equality of variances was met for the present analysis. EV display location (F (4, 81) = 0.143, p = 0.966),parallax (F (1, 81) = 1.2652, p = 0.264), and the second-order interaction of the FLIR display location andparallax (F (4, 81) = 0.126, p = 0.973) were not significant for average taxi speed. Operationally, taxi speed wasnot influenced by the location or the amount of parallax in the EV. The overall mean taxi speed was 11.3 knotswith a standard deviation of 2.4 knots for the normal display FOV runs.
3.2.2 Head-up time, pilot flying
An ANOVA was conducted on the PF head-up time percentage dependent variable for FLIR Display Location(HUD, MFD, Center AD, 60◦ AD, 90◦ AD) and parallax (Small, Large). The display FOV was fixed at Normalfor this analysis. Levene’s test for equality of variances was met for the present analysis. EV display location(F (4, 71) = 0.420, p = 0.794), parallax (F (1, 71) = 0.061, p = 0.806), and the second-order interaction of FLIRdisplay location and parallax (F (4, 71) = 0.292, p = 0.883) were not significant for PF head-up percentage time.Operationally, PF head-up percentage time was not influenced by the location or the amount of parallax in theEV. The overall mean PF head-up time percentage was 71.3% with a standard deviation of 12.7% for the normaldisplay FOV runs.
3.2.3 Head-up time, pilot monitoring
An ANOVA was conducted on the PM head-up time percentage dependent variable for FLIR Display Location(HUD, MFD, Center AD, 60◦ AD, 90◦ AD) and parallax (Small, Large). The display FOV was fixed at Normalfor this analysis. Levene’s test for equality of variances was met for the present analysis. EV display location(F (4, 78) = 2.362, p = 0.060), parallax (F (4, 78) = 2.052, p = 0.156), and the second-order interaction of EVdisplay location and parallax (F (4, 78) = 0.673, p = 0.613) were not significant for PM head-up percentage time.Operationally, PM head-up percentage time was not influenced by the location or the amount of parallax inthe EV. The overall mean PM head-up time percentage was 55.9% with a standard deviation of 14.7% for thenormal display FOV runs.

3.2.4 Situation awareness
No significant main effects or interactions (p > 0.05) were found for effect of parallax (Small, Large) on the SART.Flight crew ratings for SART were practically identical for the small parallax condition (mean = 7.36, std.dev. =3.029) compared to large parallax condition (mean = 7.48, std.dev. = 3.002).
3.2.5 Workload
No significant effects were found for NASA-TLX for effect of parallax.
3.2.6 Post-run questions
For parallax effects, there were significant findings:
• Run Questionnaire Item #1, p = 0.009“Able to maintain taxi accuracy during SMGCS operations”
• Run Questionnaire Item #5, p = 0.002“Aware of SMGCS signage, markings, and visual aids”
• Run Questionnaire Item #7, p = 0.044“Display concepts and SMGCS charts contribute to communication effectiveness”
• Run Questionnaire Item #8, p = 0.014“Display concepts and SMGCS charts promoted CRM”
• Run Questionnaire Item #9, p = 0.010“Display concepts and SMGCS charts contribute to perceived safety”
The results suggest that flight crews preferred large parallax view angles for maintaining taxi awareness andaccuracy; awareness of SMGCS signage, markings, and visual aids; communication effectiveness; and coordina-tion; and enhanced safety. However, the numerical differences indicate that these differences do not represent anoperational or practical significant difference.
3.3 Effects of minification
3.3.1 Average Taxi Speed
An ANOVA was conducted on the average taxi speed dependent variable for EV Display Location (HUD, MFD,Center AD, 60◦ AD, 90◦ AD), Display FOV (Normal, Minified), and parallax (Small, Large). The HUD runswere excluded from this analysis since they only have one FOV level (i.e., normal FOV). EV Display Location(F (3, 137) = 0.113, p = 0.952), Display FOV (F (1, 137) = 0.611, p = 0.436) and parallax (F (1, 137) = 0.448, p =0.504) were not significant for average taxi speed. None of the second-order interactions between the mainfactors were significant (p > 0.05) for this measure. The overall mean taxi speed was 11.4 knots with a standarddeviation of 2.3 knots for these runs.
3.3.2 Head-up time, pilot flying
An ANOVA was conducted on the PF head-up time percentage dependent variable for EV Display Location(HUD, MFD, Center AD, 60◦ AD, 90◦ AD), Display FOV (Normal, Minified), and parallax (Small, Large). TheHUD runs were excluded from this analysis since they only have one FOV level (i.e., normal FOV). The second-order interaction between EV Display Location and parallax (F (3, 131) = 3.159, p = 0.027) was significant forhead-up time percentage. The PF spent more time head-down when there was a large parallax error comparedto the small parallax error when using the off-axis (60 and 90 deg) auxiliary displays and the head-down MFD.This trend was not true when using the center auxiliary display, where pilots spent more head-down time withthe small parallax FLIR. Operationally, these trends may not be relevant since the largest difference betweenhead-up time for the large and small parallax values was only 8% and occurred with the center auxiliary displaywhich (incidentally) was located in a more head-up position than the other 3 displays. The main factors, EV

Display Location (F (3, 131) = 0.259, p = 0.855), Display FOV (F (1, 131) = 2.804, p = 0.096) and parallax(F (1, 143) = 0.355, p = 0.552) were not significant for this measure. The remaining second-order interactionswere also not significant (p > 0.05) for head-up time percentage. The overall mean PF head-up time percentagewas 69.8% with a standard deviation of 12.0%.
3.3.3 Head-up time, pilot monitoring
An ANOVA was conducted on the PM head-up time percentage dependent variable for EV Display Location(HUD, MFD, Center AD, 60◦ AD, 90◦ AD), Display FOV (Normal, Minified), and parallax (Small, Large).The HUD runs were excluded from this analysis since they only have one FOV level (i.e., normal FOV). Themain factors, EV Display Location (F (3, 133) = 0.819, p = 0.486), Display FOV (F (1, 133) = 0.377, p = 0.540)and parallax (F (1, 133) = 0.058, p = 0.810) were not significant for this measure. None of the second-orderinteractions between the main factors were significant (p > 0.05) for this measure. Operationally, no differenceswere seen with PM head-up time percentage due to the EV display location, parallax, or display FOV. Theoverall mean PM head-up time percentage was 55.1% with a standard deviation of 15.4%.
3.3.4 Situation awareness
No significant main effects or interactions (p > 0.05) were found for effect of minification (Normal, Minified) onthe dependent variable of SART.
3.3.5 Workload
No significant main effects or interactions were found for effect of minification.
3.3.6 Post-run questions
No significant effects were found for effect of minification on the post-run questionnaires.
3.4 Off-nominal conflict detection
Two display types (HUD, Center AD) were evaluated for detection of off-nominal events during low visibilitysurface operations. The off-nominal scenario involved a situation where a baggage cart was inadvertently left ona taxiway. The location was also right after a cleared turn onto the taxiway and the hold short of the activerunway for departure. As it was off-axis during the turn, the baggage cart was not visible out the windowduring the turn and it was not illuminated by the nose-mounted landing light. The cart was, however, visiblein the field-of-view of the EV imagery well prior to the turn for both display conditions tested. Therefore, theoff-nominal was designed to evaluate the vigilance of the flight crew to monitor FLIR imagery, as well as theoutside view in SMGCS/LVO, and the potential for the EV to augment hazard avoidance.
The display conditions tested were: HUD (non-minified, small parallax) and Center AD (non-minified, smallparallax). The display conditions were chosen to control for effect of head-up versus head-down and minimizeissues of off-axis presentations (i.e., the 60◦ AD and 90◦ AD display conditions). The display conditions differonly in that the EV was either displayed on the HUD or the Center AD.
No crew hit the baggage cart. Minimum detection distances varied from 51 feet to 124 feet. Detection of thehazard by crew was 30% PF, 40% PM, and 30% both. Detection of the hazard by type was 70% OTW, 20%EV, and 10% both.
3.5 Post-experiment questionnaire
A semi-structured verbal debrief session was held after the post-experiment questionnaire was complete. Thissession generally lasted between 30 and 45 minutes and included items commented upon in the questionnaires,additional issues the pilots noticed during the runs, specific items the researchers had noticed during thatparticular crew’s scenarios, and general comments concerning LVO/SMGCS, and this experiment.
In one question, crews were asked to rate the fidelity of the simulation to real-world SMGCS operations on ascale from 1 to 7 (1 completely unrealistic and 7 being completely realistic). The average rating of the simulationfidelity was 6.

3.6 Simulation Sickness Questionnaire
Of the 120 SSQs given (6 SSQs per pilot, 12 per crew and 10 crews total), 31 (26%) of those questionnaires hadat least one symptom reported. A total of 67 symptoms were reported in all and 70% of those were by the PF.One PF reported 29 (62% of all pilots flying) symptoms. If you remove this PFs data as an outlier, then thereported symptoms were almost evenly split between the PFs and PMs.
One PF reported having moderate fatigue throughout the day. One PM reported moderate eye strain. Otherthan the reported symptoms above, all other symptoms were marked as being slight. Two crews (20%) did notreport any simulation sickness symptoms on any of their questionnaires. The most common symptom reportedby crews was slight fatigue which was reported by 70% of the crews at some point during the day. Usually, thereporting of fatigue occurred before the end of a data block before a break (scheduled break, lunch, end of datacollection).
One PM reported stomach awareness (a precursor to nausea) from viewing the 90◦ AD. This PM noted thestomach awareness when looking at video that was not aligned with the aircraft.
4. DISCUSSION OF RESULTS
A simulation of low visibility surface operations were conducted for various arrival and departure scenarios. Crewsfelt the simulation of SMGCS operations was realistic in terms of simulated weather conditions and workload.Most crews reported no differences in their company’s Standard Operating Procedures (SOPs).
For all but the 90◦ AD condition, the display of EV was not measurably different than the baseline, no EVcondition for taxi speed, head-up time, workload, or situation awareness. Situation awareness and workload wasrated worse for the 90◦ AD condition than the baseline. The 90◦ AD was the least preferred EV display bymost crews as the display was not in the primary nor secondary FOV. Pilots would have to turn their headand actively look for the display creating significant head-down time as compared to glancing at the other EVlocations. It was also noted that having the 90◦ AD so far off boresight could have the potential to create motionsickness. This motion sickness was due to the FLIR video showing motion not inline with the motion of theaircraft.
At the visibility conditions tested, there were sufficient cues OTW for tactical vehicle control. Generally,crews used the EV display as a confirmation tool rather than a primary tool for taxi route awareness. Thoughlights tend to be identified earlier, taxiway signs were not discernible in the EV image. Taxiway signs are usedby crew as a confirmation of SA and the signs were only visible OTW. Since the EV cues on the HUD did notalign perfectly with the OTW cues due to parallax, some crews found this distracting and detracted from thePF’s ability to use the EV image on the HUD as a confirmation tool.
The parallax in the EV image created a ground rush effect especially for the large parallax with the FLIRcamera being much closer to the ground than the pilot’s eye. Crews commented that this parallax gave theperception of a higher taxi speed.
Seeing the clearance bar lights of the Geographic Position Markers (GPMs) in the EV image was valuablein predicting when to start searching for the GPM. Since the EV sensor parallax was simulated to be lowerthan the pilot’s eye, the view angle of the airport surface was lower than the OTW view. Due to this parallax,the GPM is not in view of the EV image very long, approximately 1 second or less depending on ground speed.Essentially, seeing the clearance bar lights early reduced workload as the PM had a better prediction of whenthe GPM would be visible. Thus, crews used the clearance bar lights to anticipate upcoming GPM for positionconfirmation.
Crews stated that the EV image either enhanced or had no effect on Crew Resource Management (CRM).None of the crews felt the EV display was a negative impact on overall CRM.

5. CONCLUSIONS
Twenty pilots (10 crews) participated in a motion-base simulation experiment using real-world operational pro-cedures and communication, with external air and surface traffic during LVO/SMGCS operations. The goal ofthe research was to evaluate the use of EV during LVO/SMGCS and assess the impact of different EV flightdeck design considerations, specifically, display location, image minification, and camera parallax.
The experimental used 5 EV display locations, 2 EV fields-of-regard, and 2 parallax error conditions, inpartially factorial within-subjects design. A baseline condition without EV was also evaluated for comparativepurposes. Departure and arrival scenarios were flown as well as one unexpected, emulating SMGCS LVO night500 RVR operations at Memphis International Airport with the required SMGCS visual aids and proceduresspecified in the Memphis SMGCS plan. The EV (i.e., FLIR) simulation was calibrated to show topographicalobjects within a range of approximately 600 ft and light sources within a range of approximately 1000 ft.
With the OTW visual cues, there were sufficient cues OTW for tactical vehicle control. As such, EV wasused as conformation tool and for all but the 90◦ AD condition, the display of EV did not measurably impact theoperation. There were no significant differences between the EV experimental conditions and the baseline, noEV condition on taxi speed, head-up time, workload, or situation awareness. The display of EV, 90 deg outboardof the flight crew did cause degradations in the workload, SA, and acceptability. The display of EV on the HUDwas sometimes distracting, because by design, the EV was not perfectly aligned with the OTW. Although EVdid not measurably improve performance during surface operations, EV was found to be subjectively beneficial,especially to the PM, in terms of enhanced monitoring and improve situation awareness.
Future work includes evaluating the use of EV when certain required LVO/SMGCS enhanced visual aids arenot present. Further, only one EV and one OTW natural visibility condition was tested. The interaction betweenOTW and enhanced visibility should be evaluated including Level 1 and Level 2 LVO/SMGCS conditions.Finally, the integration of Airport Moving Map (AMM)concepts with LVO/SMGCS chart symbology and EVusage should be tested. AMMs allow the crew to quickly identify their position on the airport surface greatlyincreasing their SA for surface operations. It is believed that coupling this technology with an electronic SMGCSpresentation may provide an enhancement during low visibility surface operations; however, the effect on pilotworkload and head-down time must be assessed.
ACKNOWLEDGMENTS
This work was jointly sponsored by NASA’s Aviation Safety Program (AvSP), Vehicle Systems Safety Technolo-gies project (Mr. Paul Krasa, Program Manager, Mr. Randall Bailey, Project Scientist) and the FAA HumanFactors R&D Project for NextGen, led by Dr. Tom McCloy and Mr. Stephen Plishka. The authors gratefullyacknowledge the contributions of Terry King (FAA) and many NASA Langley technicians, programmers, and en-gineers who support/have supported these research projects. Notable among them are Regina Tober, Lon Kelly,Ming Shih, Jerry Karwac, Wei Anderson, Thomas Feigh, Chris Harrison, Victoria Chung, Sean Kenny, Den-nis Frasca, Tom Wolters, Joe Whiting, Wayne Burge, Catherine Buttrill, Kemper Kibler, Darrell Sacra, PhilipSmith, Sherri Rehfeld, Sonia Herndon, Dale Ashcom, Ben Lewis, Brian Hutchinson, Lindsey Lowe, Donald Buhl,Steve Velotas, and Lisa Rippy.
REFERENCES
1. FAA, “Enhanced flight vision systems,” Advisory Circular 90-106, US Department of Transportation, FederalAviation Administration, Washington DC, USA, June 2010.
2. FAA, “FAA’s NextGen implementation plan,” tech. rep., US Department of Transportation, Federal AviationAdministration, Washington DC, USA, March 2011.
3. A. Alexander, L. Prinzel, C. Wickens, L. Kramer, J. Arthur, and R. Bailey, “Evaluating the effects ofdimensionality in advanced avionic display concepts for synthetic vision systems,” International Journal ofAviation Psychology 19(2), pp. 105–130, 2009.
4. RTCA, “Minimum aviation system performance standards (MASPS) for enhanced vision systems syntheticvision systems, combined vision systems and enhanced flight vision systems,” Tech. Rep. DO-315, RTCA,Inc., December 2008.

5. S. G. Hart and L. E. Staveland, “Development of a multi-dimensional workload rating scale: Results ofempirical and theoretical research,” in Human mental workload, P. A. Hancock and N. Meshkati, eds., pp. 139–183, Elsevier, (Amsterdam, The Netherlands), 1988.
6. R. M. Taylor, “Situational awareness rating technique (SART): The development of a tool for aircrew systemsdesign,” in AGARD Conference Proceedings No 478, Situational Awareness in Aerospace Operations, pp. 3–1– 3–37, (Aerospace Medical Panel Symposium, Copenhagen), October 1990.
7. R. S. Kennedy, N. E. Lane, K. S. Berbaum, and M. G. Lilienthal, “Simulator sickness questionnaire: Anenhanced method for quantifying simulator sickness,” International Journal of Aviation Psychology , pp. 203–220, 1993.
8. G. Dallal, “Confidence intervals involving logarithmically transformed data,” May 2012.http://www.jerrydallal.com/LHSP/ci logs.htm.