enhancement of anaerobic digestion and dark fermentation
TRANSCRIPT

Enhancement of Anaerobic Digestion and Dark
Fermentation process using Attached Growth
system and Chemical Additives
PARNIAN IZADI
A THESIS SUBMITTED TO THE FACULTY OF GRADUATE STUDIES IN
PARTIAL FULFILLMENT OF THE REQUIREMENTS FOR THE DEGREE
OF
MASTER OF APPLIED SCIENCE
GRADUATE PROGRAM
IN
CIVIL ENGINEERING
YORK UNIVERSITY
TORONTO, ONTARIO
AUGUST 2017
© Parnian Izadi, 2017

ii
Abstract
High-energy demand, global warming and shortage of fossil fuels have motivated
researchers to investigate on new energy alternatives with higher efficiencies. Anaerobic digestion
as a biochemical process for degrading complex organics without oxygen, has been used as a
promising technology for waste management systems and the production of energy and mitigation
of the greenhouse gas by utilizing the waste for environmental causes.
In this research, a particulate “BioCord” bioprocess technique is used to enhance of the AD
process and increase the process performance. Usage of surface as a support media for bacterial
growth and creation of biofilm has resulted in many benefits for the AD system such as shortening
the operation and hydraulic retention time and increased efficiency. Moreover, additives of
vitamins and micronutrients have been used to enhance the metabolic rate of AD process. The lab
scale anaerobic biofilm bioreactors were utilized for evaluating the performance of 4 different
BioCords (LS1, LS2, HS1 and HS2). Also, the impact of BioStreme, which as a mixture of metals
in specific concentrations, and vitamins using a mixture of different groups of vitamins has been
experimented as an additive to the system and showed a positive effect on both the biomethane
end biohydrogen production.

iii
Acknowledgement
I would never have been able to finish my dissertation without the guidance of my committee
members, help from friends and support of my family and most importantly my twin sister “Parin”.
I would like to express my deepest gratitude to my advisor, Dr. Ahmed Eldyasti, for his excellent
guidance, caring, patience, and providing me with an excellent atmosphere for doing research, I
would like to thank him for letting me experience researching and helping me to develop my
background in bioengineering, wastewater treatment and biochemistry.
A very special gratitude goes out to my good friends and colleagues, Ahmed Fergala, Moomen
Soliman, Ahmed ElSayed, Mahmoud Mansour and Basma Sobhi and Salma Ibrahim who were
always willing to help and give their best suggestions. It would have been a lonely lab without
them, I would also like to sincerely thank my dear friends Ardavan, Negar and Amirhossein for
always cheering me up and supporting me.
I would like to thank my Family, the amazing soul, my Grandfather, my dearests Laleh, Amir and
Nikki whose value to me only grows with age, my endearing parents, my heroes, for always
supporting me and encouraging me with their best wishes, for standing by me through good and
bad times, I haven’t been able to finish my research without their helps, moral and emotional
support and finally I would thank my beloved sister, Parin, I am grateful for your endless love and
for each second of having you beside me in my life.

iv
Table of Contents Abstract ......................................................................................................................................................... ii
Acknowledgement ....................................................................................................................................... iii
Table of Contents ......................................................................................................................................... iv
List of tables ................................................................................................................................................ vii
List of figures ............................................................................................................................................. viii
Acronyms ..................................................................................................................................................... ix
Chapter 1 Introduction .................................................................................................................................. 1
1.1 Background ......................................................................................................................................... 1
1.2 Problem statement ............................................................................................................................... 3
1.3 Objectives ........................................................................................................................................... 3
1.4 Thesis layout ....................................................................................................................................... 4
1.5 Contribution of thesis .......................................................................................................................... 5
Chapter 2 Literature review .......................................................................................................................... 6
2.1 Abstract ............................................................................................................................................... 6
2.2 Introduction ......................................................................................................................................... 6
2.3 Anaerobic Digestion ........................................................................................................................... 8
2.3.1 Microbial communities .............................................................................................................. 13
2.3.2 Feed characterization ................................................................................................................. 16
2.3.3 Factors affecting the performance of AD process and Biogas generation ................................. 19
2.3.4 Biogas AD reactors .................................................................................................................... 23
2.3.5 Improvement methods on Biogas production process ............................................................... 27
2.3.6 Biogas ........................................................................................................................................ 41
Chapter 3 Enhancement of AD by using particulate growth systems ......................................................... 43
3.1 Introduction ....................................................................................................................................... 43
3.2 Materials and methods ...................................................................................................................... 51
3.2.1 Feeding and seed sludge ............................................................................................................. 51
3.2.2 Biofilm carrier ............................................................................................................................ 52
3.2.3 AD experimental setup and operation ........................................................................................ 53
3.2.4 Analysis...................................................................................................................................... 54

v
3.3 Results and discussion ...................................................................................................................... 55
3.3.1 Anaerobic treatment performance .............................................................................................. 55
3.3.2 Methane production ................................................................................................................... 60
3.3.3 Performance evaluation of BioCord LS2 as attached media ...................................................... 63
3.4 Conclusion ........................................................................................................................................ 64
Chapter 4 Enhancement of AD process using micronutrient supplement addition “BioStreme “ .............. 66
4.1 Introduction ....................................................................................................................................... 66
4.2 Material and methods ........................................................................................................................ 76
4.2.1 Feeding and seed sludge............................................................................................................. 76
4.2.2 BioStreme characteristics ........................................................................................................... 77
4.2.3 AD experimental setup and operation ........................................................................................ 79
4.2.4 Analysis...................................................................................................................................... 81
4.2.5 Kinetic modeling ........................................................................................................................ 82
4.3 Results and discussion ...................................................................................................................... 82
4.3.1 Operational conditions and AD performance ............................................................................ 82
4.3.2 BioStreme Dosage effect ........................................................................................................... 83
4.3.3 Process stability ......................................................................................................................... 85
4.3.4 Methane production ................................................................................................................... 87
4.3.5 Effect of BioStreme and vitamin solution on methanogenic activity ........................................ 88
4.4 Conclusion ........................................................................................................................................ 89
Chapter 5 Enhancement of dark fermentation process using micronutrient supplement addition
(BioStreme and Vitamin solution) .............................................................................................................. 90
5.1 Introduction ....................................................................................................................................... 90
5.2 Materials and methods ...................................................................................................................... 92
5.2.1 Seed sludge and substrate .......................................................................................................... 92
5.2.2 BioStreme Concentration ........................................................................................................... 93
5.2.3 Batch setup and operation .......................................................................................................... 94
5.2.4 Analysis...................................................................................................................................... 96
5.3 Result and discussion ........................................................................................................................ 97
5.3.1 Process performance and operational conditions ....................................................................... 97
5.3.2 BioStreme dosage effect ............................................................................................................ 97

vi
5.3.3 process stability .......................................................................................................................... 98
5.3.4 Hydrogen production ............................................................................................................... 100
5.3.5 Kinetic analysis ........................................................................................................................ 102
5.4 Conclusion ...................................................................................................................................... 104
Chapter 6 Conclusion and future work ..................................................................................................... 105
6.1 Conclusions ..................................................................................................................................... 105
6.2 Direction of future work ................................................................................................................. 106
Bibliography ............................................................................................................................................. 108

vii
List of tables
Table 2-1 Advantages and disadvantages of temperature ranges .......................................... 20
Table 2-2 Advantages and disadvantages of biofilm reactors with particles ........................ 31
Table 2-3 Biogas composition .................................................................................................... 42
Table 3-1 Literature review of attached and moving media ................................................... 50
Table 3-2 Biomass characterization .......................................................................................... 52
Table 3-3 Feed characterization ................................................................................................ 52
Table 3-4 Biofilm characteristics ............................................................................................... 53
Table 3-5 Total performance of all experimental groups ........................................................ 57
Table 3-6 COD analysis of all experimental groups ................................................................ 58
Table 4-1 Advantages and disadvantages of different additives ............................................ 71
Table 4-2 Light metal concentration effect on AD process literature review........................ 73
Table 4-3 Heavy metal concentration effect on AD process literature review ...................... 74
Table 4-4 Mesophilic biomass properties ................................................................................. 76
Table 4-5 Real feed characterization ........................................................................................ 77
Table 4-6 Synthetic feed compositions ...................................................................................... 77
Table 4-7 Biosteme composition ................................................................................................ 78
Table 4-8 Vitamin solution composition ................................................................................... 79
Table 4-9 BioStreme and vitamin solution concentrations in experiments ........................... 81
Table 4-10 Removal efficiency of different micronutrient concentration addition .............. 84
Table 4-11 VFA/ALK, pH and VFA conc. for different supplement concentrations ........... 86
Table 4-12 Gompertz modeling results for nutrient concentrations ...................................... 88
Table 5-1 Biomass characterization ........................................................................................ 127
Table 5-2 BioStreme composition ............................................................................................ 128
Table 5-3 Vitamin solution composition ................................................................................. 129
Table 5-4 Different concentrations of BioStreme and vitamin used in each experiment…132
Table 5-5 Removal efficiencies of different experiments ...................................................... 134
Table 5-6 VFA, pH and VFA/ALK ratio of each experiment ............................................... 135
Table 5-7 Kinetic parameters for each experiment ............................................................... 140
viii
List of figures
Figure 2-1 Waste conversion processes ..................................................................................................... 7
Figure 2-2 AD process configuration......................................................................................................... 9
Figure 2-3 AD stages ................................................................................................................................. 10
Figure 2-4 Carbon flow in AD with active methanogens ....................................................................... 14
Figure 2-5 Reactors configuration ........................................................................................................... 25
Figure 2-6 Reactors configuration ........................................................................................................... 27
Figure 2-7 Biofilm formation process ...................................................................................................... 32
Figure 3-1 Schematic diagram of the experimental setup ..................................................................... 54
Figure 3-2 COD removal and of all groups in experiment .................................................................... 59
Figure 3-3 COD removal percentages ..................................................................................................... 60
Figure 3-6 VSS removal efficiencies ........................................................................................................ 63
Figure 3-8 Attached biomass to BioCords .............................................................................................. 64
Figure 4-1 experimental setup configuration ......................................................................................... 80
Figure 4-2 VFA/ALK for different nutrient concentration ................................................................... 86
Figure 5-4 Effect of micronutrient dosage on Ah .................................................................................. 101
Figure 5-5 Cumulative Hydrogen production for each experiment ................................................... 102

ix
Acronyms
ACF Activated Carbon fiber
AF Anaerobic filter
AD Anaerobic Digestion
AFBR Anaerobic fluidized bed reactors
AMPT Automatic Methane potential test
ASBR Anaerobic sequencing batch reactor
ATP Adenosine triphosphate
BAS Biofilm Airlift Suspension
BOD Biochemical Oxygen demand
CGW Cotton gin waste
CM Cow manure
COD Chemical Oxygen demand
CSTR Completely stirred tank reactor
EGSB Expanded Granular Sludge Blanket
EPS Extracellular polymeric substances
FID Flame ionization detector
GC Gas chromatography
HCB Hydrogen consuming bacteria
HPB Hydrogen producing bacteria
HPR Hydrogen production rate
HRT Hydraulic retention time
IC Internal Circulation

x
MBR Membrane bioreactor
OFMSW Organic fraction of municipal solid waste
OLR Organic loading rate
PAH Polycyclic aromatic hydrocarbons
PET Polyethylene Terephthalate
PVC Polyvinyl chloride
SRT Solids retention time
TCD Thermal conductivity detector
TS Total solids
TSS Total suspended solids
UASB Up-flow Anaerobic Sludge Blanket
VFA VFAs
VS Volatile solids
VSS Volatile suspended solids

1
1.1 Background
Chapter 1 Introduction
AD is the preferred treatment process for organic wastes due to its low nutrient requirements, low
biomass yield, and Biogas (CH4) production. AD processes have been widely applied to various
complex feedstock including municipal wastewater sludge, chemical, and agricultural industry
wastewaters. In conventional AD, the acid-forming and methane-forming microorganisms are kept
together in a single reactor and there is a delicate balance between these two microbial groups,
because both groups differ widely in terms of physiology, nutritional needs, growth kinetics, and
sensitivity to environmental conditions. However, current conventional AD processes require a
hydraulic retention time (HRT) of up to 40 days to achieve the necessary stabilization of organic
wastes, which translates to a large footprint (Metcalf and Eddy, 1972).
Notwithstanding the fact that numerous bioreactor configurations and system schemes are
currently available for a wide variety of environmental applications such as Up-flow Anaerobic
Sludge Blanket (UASB), Expanded Granular Sludge Blanket (EGSB), Biofilm Airlift Suspension
(BAS), and Internal Circulation (IC), it remains a major challenge to design and develop a
sustainable bioreactor system. These systems are not only capable of integrating functions i.e.
biodegradation, biomass-liquid separation, and biomass retention at high suspended solids content
while reducing energy demand but also can be easily applied to retrofit existing conventional
technologies (Mustafa et al. 2014). The AnBioCord offers numerous advantages over conventional
systems including low footprint, decoupling of hydraulic retention time (HRT) from solids
retention time (SRT), and high biomass-liquid separation. Additionally, Biofilms in AnBioCord
are complex layers of microorganisms that coat surfaces exposed to substrates. The hydrodynamic

2
strength significantly affects the microbial adhesion to the solid-liquid interface by acting as a
repulsive or attractive force, thereby influencing the rate of bio-Methane production. Therefore,
there is a pressing need to fully investigate the performance of Biofilms in AnBioCord using a
novel Biofilm Anaerobic BioCord Bioreactors (AnBioCord) and investigate the
hydrodynamics and kinetics of different BioCords to develop a high rate bio Methane yield biofilm
AD process. In addition, using micronutrients as supplements (BioStreme) to AD process as
another available enhancement method offer many advantages over common systems such as
inexpensive additive supplement, no requirement in changing the configuration of the
conventional system and lowering the lag phase of the process, with positive effect on Biogas
production.

3
1.2 Problem statement
AD has always been a method for producing alternative energy sources that can be used instead of
fossil fuels, production of Biogas by AD process can reduce Carbon dioxide gas emission, and it
also has no negative impact on ozone layer depletion and acid rain production. Furthermore the
residue from AD process is a rich source for Nitrogen and phosphorus that are used as fertilizers
for plant growth, this process can be used for treating a wide variety of wastes from agricultural to
municipal waste (Kwietniewska & Tys 2014). However, with all the advantages mentioned the
long startup time and low process stability has been the main obstacles for more commercialization
of this system. Attached growth systems have been studied for increasing the process efficiency,
however majority of studies have addressed the usage of membrane bioreactors, moving bed
bioreactors and specific fixed film reactors, no research has been done on BioCords as support
media in anaerobic condition in order to increase the process efficiency and Biogas production,
Furthermore, addition of micronutrient supplementation as an enhancement method has been
tested to boost the AD and dark fermentation process by increasing the micronutrients dosage,
required for bacterial growth in order to increase the methane and hydrogen production,
respectively.
1.3 Objectives
In this research, the development of new AD systems was undertaken. The specific research
objectives are:
1- Development of new anaerobic biofilm BioCord process in collaboration with Bishop
Water Technology, ON, Canada, for increasing the process efficiency, stability and
decrease the process failure as well as increasing the Biogas production.

4
2- Improve the existing AD processes using an additive to increase the process efficiency and
system stabilization utilizing nutrient supplements containing BioStreme manufactured by
Ecolo odor technologies, ON, Canada and vitamin solution.
3- Establishing a new anaerobic process by increasing the efficiency of dark fermentation
process by additive usage for the system and evaluating different concentrations of
additives for a more effective result in higher hydrogen production.
1.4 Thesis layout
This thesis comprises of six chapters. After an introduction in the first chapter, a comprehensive
literature review including microbial characteristics of AD, effective parameters on the process,
different waste materials available, reactor configuration, enhancement methods on AD as well as
dark fermentation process principles is presented in Chapter 2.
In chapter 3, the detailed description and methodology from experiment on enhancement of AD
by utilizing attached media in batch reactors are provided. Also, a comprehensive result and
discussion is presented on process efficiency and Biogas production.
Chapter 4, focuses on utilization of additives including BioStreme and vitamin solution to AD
process in batch reactors, describing the material and methods and a detailed discussion on the
results, in addition a kinetic modelling using the Gompertz modeling equation has been done for
understanding the Biogas production.
In chapter 5, the detailed description and methodology from experiment on enhancement of dark
fermentation by utilizing micronutrient supplementation in batch reactors are provided. Also, a
comprehensive discussion and results are available as well as kinetic modeling on Hydrogen
production.

5
Finally, chapter 6 compiles the major findings of this study and the direction of future work.
1.5 Contribution of thesis
This study provides an insight into AD as a biological process for treatment of wastes, which will
produce Biogas and help in waste management procedure. This study aimed at reaching a stable
AD process with high process efficiency and Methane production, and to evaluate the impact of
additives on AD and dark fermentation process. A new attached media has been used to overcome
the challenges of the AD process. This novel biofilm has been previously used in aerobic systems
and has been successfully developed, these methods do not require any specific changes to the
conventional AD process which, is cost effective and can prevent biomass accumulation and
process failure.

6
2.1 Abstract
Chapter 2 Literature review
Rapid growth in population, increase in expectations and demands in energy requirements have
resulted in a sharp increase in production of municipal and industrial waste, climate change and
are the start point for global concern in case of fossil fuel deficiency. These are the reasons for
searching for novel solutions such as alternative fuel sources, including methods such as AD of
biomass, AD is widely applied to various waste streams. In this chapter a comprehensive review
has been done on AD for Biogas production including reviews on factors affecting the efficiency,
reactor design and methane production process. However conventional method had rather low
efficiency, different methods are taking place as a means of increasing methane production and
removal efficiency of the process. In this chapter, various effective improvement methods are
presented, lastly, dark fermentation in which anaerobic bacteria can be used to produce hydrogen
is reviewed in details with a review on effective parameters on this process as well as some
technical challenges which can improve hydrogen production are discussed.
2.2 Introduction
The world is highly dependent on fossil fuels for energy provision and all evidence indicate
depilation of this energy source, also these energy sources resulted in several environmental issues
such as pollution and greenhouse gas emission. Moreover substantial increase in untreated and
unmanaged waste creating odor, hygienic issues and detrimental environmental concerns, the
rising need of energy year by year, for reducing the independence on fossil fuels are the main
reasons for researchers to search for new resources of energy production and waste management
(Kwietniewska & Tys 2014). From all the renewable sources such as solar, wind, hydroelectric
and nuclear, biomass seems to be the most promising source of energy from the start since this

7
source can be guaranteed, woody biomass has been an important energy source for mankind
(Kwietniewska & Tys 2014), using waste as a source of energy isn’t novel, animal waste has been
used as a fuel source for burning for many years (Lyberatos 2010). There are various methods and
technologies that are used for energy production from biomass which are grouped into
thermochemical, biochemical and physicochemical conversion processes shown in Figure 2-1
(Appels et al. 2011). Many alternative energy sources have been studied, nowadays, biological
methods for waste management and clean energy production have been widely used, and anaerobic
biological processes seem to be promising processes (Li et al. 2011).
Figure 2-1 Waste conversion processes
Organic waste
Physicochemical
process
Thermochemical
process
Biochemical
process
Extraction/ separation
Trans- esterification
Combustion Carbonization Gasification Fermentation Anaerobic
digestion
Liquefaction Pyrolysis Vegetable
oil methanol
Biodiesel
Bio-ethanol
Biogas
Heat
Charcoal
Syngas
Methanol
Pyrolysis oil
8
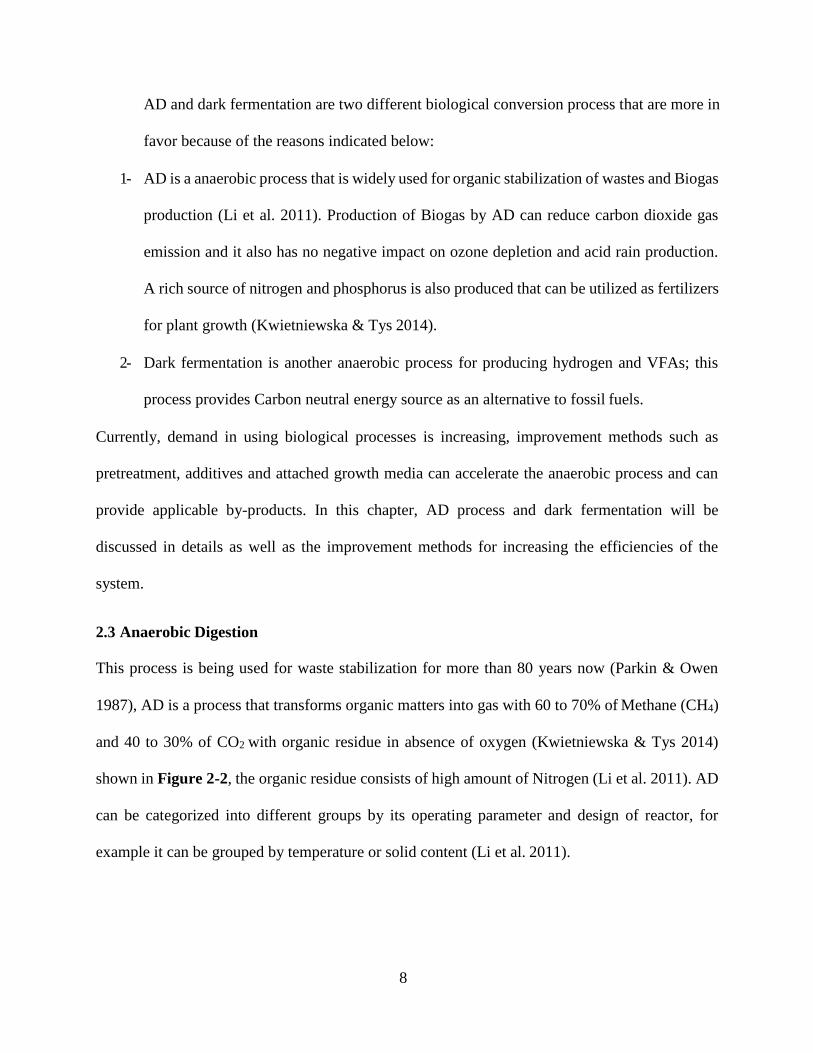
AD and dark fermentation are two different biological conversion process that are more in
favor because of the reasons indicated below:
1- AD is a anaerobic process that is widely used for organic stabilization of wastes and Biogas
production (Li et al. 2011). Production of Biogas by AD can reduce carbon dioxide gas
emission and it also has no negative impact on ozone depletion and acid rain production.
A rich source of nitrogen and phosphorus is also produced that can be utilized as fertilizers
for plant growth (Kwietniewska & Tys 2014).
2- Dark fermentation is another anaerobic process for producing hydrogen and VFAs; this
process provides Carbon neutral energy source as an alternative to fossil fuels.
Currently, demand in using biological processes is increasing, improvement methods such as
pretreatment, additives and attached growth media can accelerate the anaerobic process and can
provide applicable by-products. In this chapter, AD process and dark fermentation will be
discussed in details as well as the improvement methods for increasing the efficiencies of the
system.
2.3 Anaerobic Digestion
This process is being used for waste stabilization for more than 80 years now (Parkin & Owen
1987), AD is a process that transforms organic matters into gas with 60 to 70% of Methane (CH4)
and 40 to 30% of CO2 with organic residue in absence of oxygen (Kwietniewska & Tys 2014)
shown in Figure 2-2, the organic residue consists of high amount of Nitrogen (Li et al. 2011). AD
can be categorized into different groups by its operating parameter and design of reactor, for
example it can be grouped by temperature or solid content (Li et al. 2011).

9
Figure 2-2 AD process configuration
This process consist of four different stages: hydrolysis, acidogenesis, acetogenesis and
methanogenesis shown in Figure 2-3, however some literatures indicated that AD process has only
three stages of hydrolysis, acidogenesis and methanogenesis, but the AD product and results are
the same (C. Zhang et al. 2014).
Organic waste
Manure
Fuel
Biogas Biomethane
Acid forming
bacteria
Methane
producing
bacteria Heat
Anaerobic digestion
Complex organics Simple organics Volatile acids
Fertilizer

10
Figure 2-3 AD stages
In the first step (hydrolysis) complex organic matters are broken down to proper sized materials to
access the cell walls as energy and nutrient source, this stage is critical since wastewater consists
of many insoluble components which can’t be utilized by bacteria. This step of the process is
attained by extracellular, hydrolytic enzymes produced by bacteria population for this matter
(Parkin & Owen 1987). In this step, proteins, lipids and carbohydrates are converted to amino
acids, sugars and fatty acids respectively (Li et al. 2011), presence of sufficient extracellular
hydrolytic enzymes are crucial for providing the proper contact of bacteria with organics without
facing limitation in stabilization rate of total reaction. In the next step, these simpler organics are
Complex organic
matters
Amino acid, sugar
Fatty acid
Biodegradable organic matters
carbohydrate
protein
lipid
Propionate,
butyrate
acetate
Hydrogen and
carbon dioxide
Methane and
carbon dioxide
me
tha
no
ge
ne
sis
a
ce
tog
en
esis
aci
do
ge
ne
sis
h
yd
roly
sis
11
converted to VFAs, CO2, H2, and acetic acids, besides acetic acids, smaller organic acids such as
propionic, butyric and valeric acid is produced in the second step, acidification. Hydrogen
produced in this step is an energy source that is consumed by methanogenic bacteria for methane
formation (Parkin & Owen 1987). In the third stage of the process, acetate, carbon dioxide and
hydrogen are digested which are utilized for methane production (C. Zhang et al. 2014), there are
two types of bacteria present in this step of the process, 1- Hydrogen-producing acetogenic bacteria
that produces hydrogen and 2- hydrogen-consuming acetogenic bacteria which produces acetate.
Hydrogen is important for organic consumption and production adjustment, but hydrogen pressure
is important, if it departs from the proper range it would inhibit methane production (Parkin &
Owen 1987). In the last step of the process, for stabilization, methane and carbon dioxide is
produced. Two different groups of methanogens are present; one group uses acetate to produce
methane and other group uses hydrogen and carbon dioxide.
Most of AD processes used today are single stage processes, which are dependent on different
parameters such as pH, ammonia, nutrients and trace elements therefore it is very important to be
in the right range of characteristics for a long term AD process (C. Zhang et al. 2014).
In dark fermentation, the overexploitation of fossil fuels and the understanding that this source of
energy isn’t endless, which can excessively increase the CO2 gas emission and can result in energy
crisis worldwide, are the reasons for exploring for alternative sources of energy that are more
environmentally friendly and renewable (Lyberatos 2010). H2 can be an alternative energy source
that has the potential to produce sustainable fuels, without generating greenhouse gases. This
source of energy has higher energy yield compared to other sources such as methane, natural gas
and ethanol (Meng et al. 2014). However most of this energy source is produced from fossil fuels,
therefore it is very important to provide a more environmentally friendly method for hydrogen

12
production (Meng et al. 2014) and also the main obstacles are the high production and storage cost
(Chong et al. 2009). Hydrogen is an odorless, colorless, tasteless and safe gas that produces no
pollutants (Chong et al. 2009), it just produces water. There are different methods for hydrogen
production such as chemical and electrolysis pathways. In water electrolysis method, water is
electrolyzed in to molecular hydrogen and oxygen gases using electric energy, therefore the cost
of the electricity input defines the cost of the method. The thermochemical hydrogen methods used
are steam reforming, partial oxidation/auto-thermal reforming and gasification of coal and woody
biomass (Chen 2006), but their high cost and energy requirement has led the attractions towards
biological pathways for hydrogen production (Chong et al. 2009). The biological pathways for
Hydrogen production are bio-photolysis of water, photo-fermentation and dark fermentation of
organics, dark fermentation has the highest yield with the simplest way of operation (Lyberatos
2010). This process is a biological process that is used for hydrogen production without any
lighting sources, many different feeding sources can be used in this process such as stillage,
leachate and sludge, a more economical way for this method is to use organic wastes instead of
pure cultures since it can also perform as a wastewater treatment process as well as hydrogen
production system (Meng et al. 2014). Using mixed cultures can help with higher environmental
sustainability as well. However mixed cultures contain both hydrogen producing and hydrogen
reducing bacteria, so methods such as pretreatment should be applied to eliminate the hydrogen
consuming groups (HCB) and maintaining the hydrogen producing bacteria (HPB). The seed
sludge used for dark fermentation is a mixed culture since it can be more resistant to changes in
temperature and pH, however their kind of cultures consist both bacteria groups (Meng et al. 2014),
dark fermentation mostly takes place in anaerobic condition by anaerobic bacteria, and the most

13
common organic substance for hydrogen production is glucose for acetate production shown in
equation 1-1 (Lyberatos 2010):
C6H12O6 + 4H2O 2CH3OO¯ + 2HCO3¯ + 4H+ + 4H2 (Equation 1-1)
Dark fermentation has low efficiency in Hydrogen production since most of its enthalpy is used
for VFA formation, Acetate and butyrate are the pathways for hydrogen production, about 33% of
glucose is converted to H2 through acetate pathway and 17% over butyrate pathway. The pathway
equations are shown below (1-2), (1-3):
C6H12O6 + 2H2O 4H2 + 2CH3COOH + 2CO2 acetate pathway (Equation 1-2)
C6H12O6 2H2 + CH3CH2CH2COOH + 2CO2 butyrate pathway (Equation 1-3)
2.3.1 Microbial communities
AD is a complex process with multi-step microbial communities that have to be in high synergy
for better process performance (Appels et al. 2011). The microorganisms present in this process
are classified into four groups of hydrolytic, fermentative, acetogenic and methanogenic bacteria.
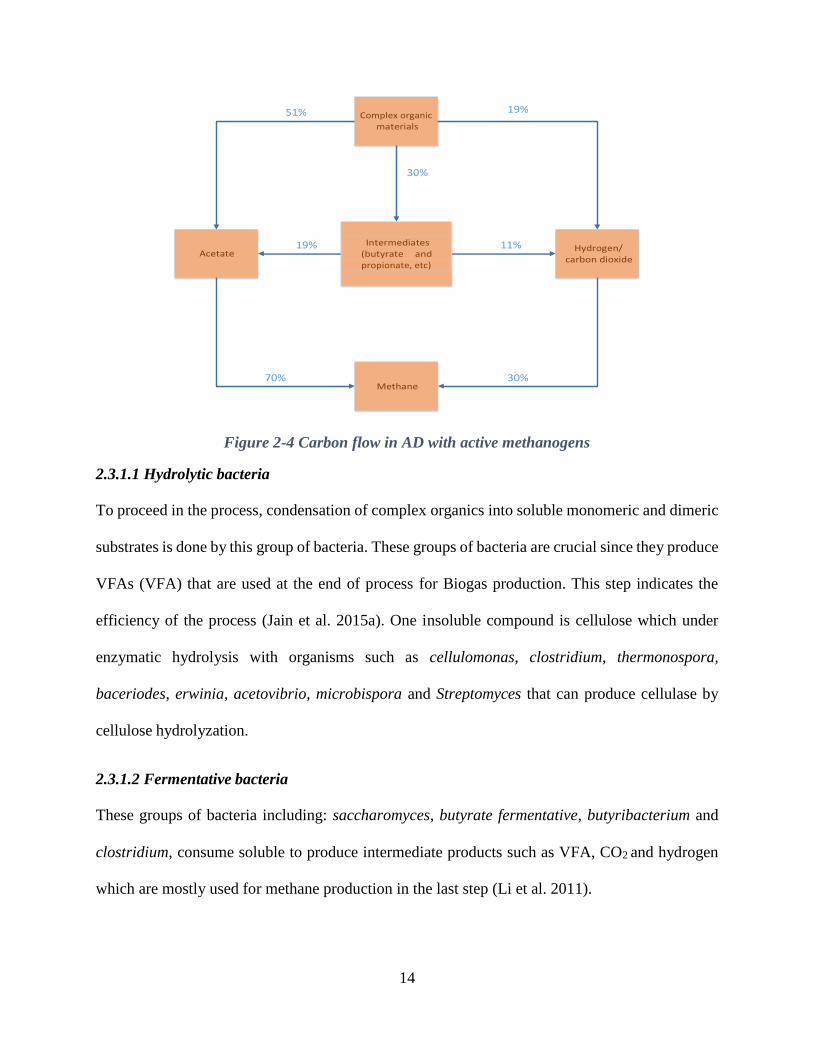
Figure 2-4 indicates the carbon flow in AD. In a well performed process most of carbon flow takes
place between methanogens and fermentative organisms and only 20 to 30% of it is converted to
intermediate products before transforming to methane and carbon dioxide (Birgitte K. Ahring et
al, 2003).
14
Complex organic
materials
Acetate
Hydrogen/
carbon dioxide
51% 19%
30%
70% 30%
Methane
19%
Intermediates
(butyrate and propionate, etc)
11%
Figure 2-4 Carbon flow in AD with active methanogens
2.3.1.1 Hydrolytic bacteria
To proceed in the process, condensation of complex organics into soluble monomeric and dimeric
substrates is done by this group of bacteria. These groups of bacteria are crucial since they produce
VFAs (VFA) that are used at the end of process for Biogas production. This step indicates the
efficiency of the process (Jain et al. 2015a). One insoluble compound is cellulose which under
enzymatic hydrolysis with organisms such as cellulomonas, clostridium, thermonospora,
baceriodes, erwinia, acetovibrio, microbispora and Streptomyces that can produce cellulase by
cellulose hydrolyzation.
2.3.1.2 Fermentative bacteria
These groups of bacteria including: saccharomyces, butyrate fermentative, butyribacterium and
clostridium, consume soluble to produce intermediate products such as VFA, CO2 and hydrogen
which are mostly used for methane production in the last step (Li et al. 2011).

15
2.3.1.3 Acetogenic bacteria
Acetogenic bacteria are different from acetate forming fermentative bacteria since this group can
reduce carbon dioxide for acetate production. They consist of two groups: 1- completely
acetogenic such as acetobacterium, sporomusa and 2- non-acetogenic microorganisms such as
clostridium, ruminococcus and eubacterium (Li et al. 2011). Abundance and diversity of acetogens
and importance of acetate for methane production is the reason for potency of AD, however it
should be considered that acetogens are hydrogen producer bacteria, so it is very important to have
the proper relationship between acetogens (H2 producers) and methanogens (H2 consumers) (Jain
et al. 2015a).
2.3.1.4 Methane forming bacteria
These groups of bacteria are very sensitive to environmental changes, they produce methane and
carbon dioxide by conversion of acidic and acetogenic fermentation, most bacteria groups in this
step are rod and sphere shaped (Mustafa et al. 2014), the methane produced is 70% from acetic
acid fermentation and 30% from Hydrogen and CO2 redox reaction (Jain et al. 2015a). In
methanogenic phase there are few energy sources such as formic acid, acetic acid, methanol and
hydrogen (Parkin & Owen 1987). For this process to reach its optimal level it is important to
provide equal speed of decomposition in the sequential steps. As mentioned a balance between
acid formers and methane fermenters is substantial for high efficiency. Methane producers are
sensitive to environmental condition for example the pH level should be in the range of 6.5 to 8
while if the acid formers grow in a faster pace the pH will drop to an improper level for methane
production, therefore keeping a balance in feeding supply, temperature and pH in the system is
very important (Jain et al. 2015a).
16
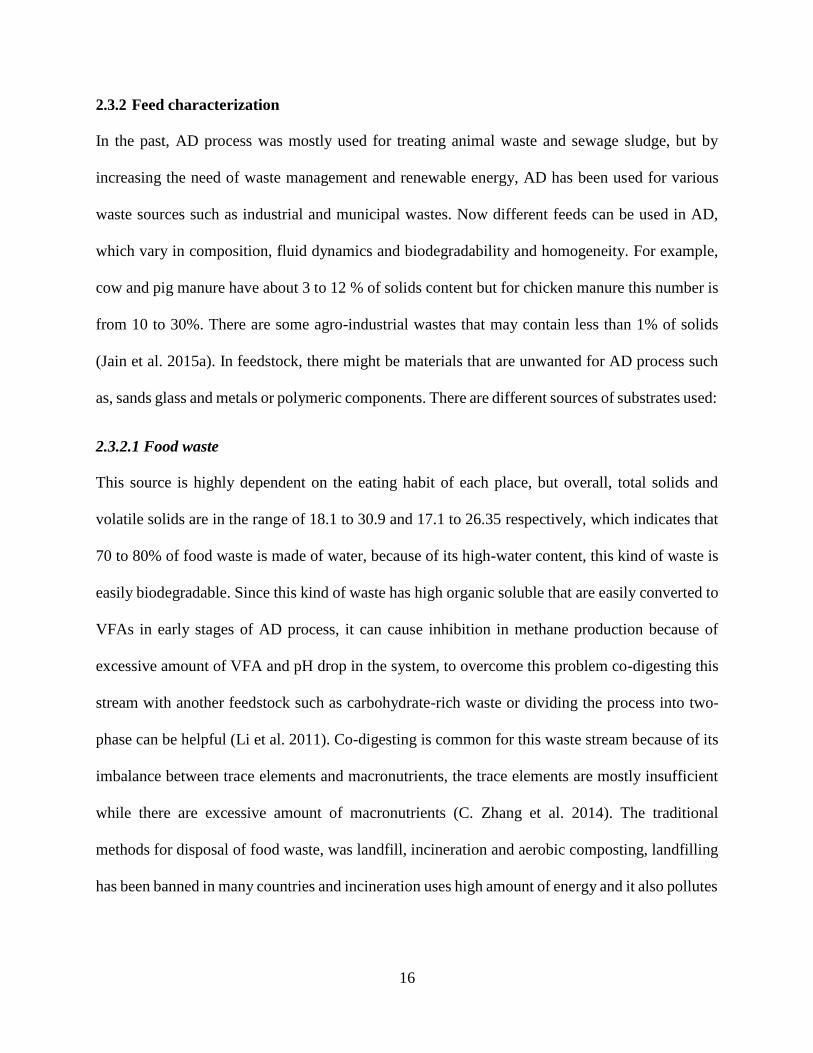
2.3.2 Feed characterization
In the past, AD process was mostly used for treating animal waste and sewage sludge, but by
increasing the need of waste management and renewable energy, AD has been used for various
waste sources such as industrial and municipal wastes. Now different feeds can be used in AD,
which vary in composition, fluid dynamics and biodegradability and homogeneity. For example,
cow and pig manure have about 3 to 12 % of solids content but for chicken manure this number is
from 10 to 30%. There are some agro-industrial wastes that may contain less than 1% of solids
(Jain et al. 2015a). In feedstock, there might be materials that are unwanted for AD process such
as, sands glass and metals or polymeric components. There are different sources of substrates used:
2.3.2.1 Food waste
This source is highly dependent on the eating habit of each place, but overall, total solids and
volatile solids are in the range of 18.1 to 30.9 and 17.1 to 26.35 respectively, which indicates that
70 to 80% of food waste is made of water, because of its high-water content, this kind of waste is
easily biodegradable. Since this kind of waste has high organic soluble that are easily converted to
VFAs in early stages of AD process, it can cause inhibition in methane production because of
excessive amount of VFA and pH drop in the system, to overcome this problem co-digesting this
stream with another feedstock such as carbohydrate-rich waste or dividing the process into two-
phase can be helpful (Li et al. 2011). Co-digesting is common for this waste stream because of its
imbalance between trace elements and macronutrients, the trace elements are mostly insufficient
while there are excessive amount of macronutrients (C. Zhang et al. 2014). The traditional
methods for disposal of food waste, was landfill, incineration and aerobic composting, landfilling
has been banned in many countries and incineration uses high amount of energy and it also pollutes

17
the air, using food waste as direct animal feed can also be problematic since it can cause different
diseases (C. Zhang et al. 2014).
2.3.2.2 Agricultural waste and energy crops
AD for producing Biogas has various advantages such as flexible use of produced methane as fuel
as an alternative for natural gas, there has been many research on using energy crops and residues
for CO2 emission reduction (Demirel & Scherer 2011), This waste has high potential in producing
Biogas and it is available at very low cost, the carbohydrates inside this waste are mostly in form
of polysaccharides, cellulose and hemicellulose which because of their covalence bonds are not
available for fermentation and break down, for this reason, pretreatment methods are used such as
dilute acids, steam explosion and lime and ammonia pretreatments (Li et al. 2011). Residues from
food crops and energy crops such as wheat, beet and maize have high potential in AD usage, the
methane production potential of cellulose containing wastes can only be indicated after proper
pretreatment, however co-digesting of this source with other wastes can provide the needed
nutrients and increase the process efficiency (Appels et al. 2011).
2.3.2.3 Algae
Recently, new sources have been used for AD process such as microalgae. The algal sink toward
the anoxic and aphotic zone of the reservoir and they die which means they become a part of the
bottom deposit and degradation occurs which produces excessive amount of phosphorus and
ammonium and also releases toxic gases such as H2S, the process lowers the oxygen which is
dangerous for wildlife especially fish species, This source requires a lot of fertilizers and needs
management of waste for the residue which AD process can overcome the problems and can
balance the nitrogen and phosphorus excessive production. The characteristics of microalgae is

18
highly dependent on physical, chemical and biological factors, the cultivation method and
environmental conditions such as light and salination (Kwietniewska & Tys 2014).
2.3.2.4 Organic fraction of municipal solid waste (OFMSW)
This kind of waste is a mixture of different sources from food waste to yard waste, therefore it is
highly dependent on the waste collection from place to place considering the season as well. This
waste has potential in Biogas production in AD process but its residue is hard to handle and needs
to be disposed in landfills or incinerated (Li et al. 2011). The composition of this waste varies with
the location, for example in rural areas the waste mostly may contain garden waste, the waste can
also change by season considering the difference in lifestyle and culture of each place (Appels et
al. 2011).
2.3.2.5 Dairy waste
Dairy industry is very crucial since it provides essential human nutrition from milk, such as cheese,
butter and yogurt, the dairy wastewater is produced by washing the equipment and by products of
each process, this wastewater consists of mostly lactose, soluble proteins, lipids, mineral salts, this
kind of waste includes many organics alongside with other pollutants which can highly pollute the
environment if not properly treated (Karadag et al. 2015).
2.3.2.6 Sewage sludge
The sludge produced during wastewater treatment process as a by-product of the chemical,
physical and biological treatment processes is very important to be properly treated, using AD
process seems to be an environmentally friendly and economical method for treatment of this
waste, this process offers the highest methane production yield worldwide (Appels et al. 2011).
19
2.3.3 Factors affecting the performance of AD process and Biogas generation
2.3.3.1 pH level and VFA concentration
VFA which consist of acetic acid, propionic acid, butyric acid and valeric acid are the main
intermediates of the AD process. The VFA inside the AD process can be converted to CO2 and
CH4 by methanogenic bacteria. These components are not inhibitory by themselves but they can
reduce the pH to a certain level, accumulation of VFA can result in pH drop which long chain fatty
acids prevent the activity of gram positive bacteria including methanogens (Kwietniewska & Tys
2014) and failure of the system, acetic acid and propionic acid are the most important acids in
Biogas production, for a proper process the acetic acid to propionic acid ratio should be less than
1.4 and the acetic acid concentration should be less than 0.8 g/l, there are different methods used
for measurement of VFA such as high performance liquid chromatography, gas chromatography
or ion exclusion which are quite time consuming and material based which are not suitable for
commercial scale. VFA indicates the pH level of the process which is very important. Fermenters
need pH range of 4 to 8.5 while methanogens need pH level of 6.5 to 7.2. There are different VFA
that are important in each pH level, in low pH acetic and butyric acid is important while in higher
pH level acetic and propionic acids have more significant effects (C. Zhang et al. 2014).
2.3.3.2 Temperature range
Intra-cellular proteins thermos stability in microbial communities indicate the system’s stability to
temperature changes (Amani et al. 2010). This parameter influences the Methane yield and the
activity of enzymes and co-enzymes. There are three different ranges of temperature used for
bacterial growth: psychrophilic (under 20°C), mesophilic (between 35° to 55° C) and thermophilic
(above 55°C) conditions. Thermophilic temperature has higher specific growth rates, high
metabolic rate and better rates for destruction of pathogens with higher methane production.
Nitrogen degradation and phosphorus assimilation is higher in thermophilic condition, as well as

20
Increased net of biomass yield of
methanogenic population
more sensitivity to environment. It is known that the temperature change rate should be less than
1°C/day, higher rates ends in process failure (C. Zhang et al. 2014). Thermophilic conditions are
mostly not used since it is tricky to heat up a tank to such high temperatures, in high efficiency
systems the energy required is offset by higher gas production, the advantages and disadvantages
of each temperature range is indicated in Table 2-1. Temperature levels are very important since
it can directly affect the growth (Jain et al. 2015b). By combining mesophilic and thermophilic
temperature conditions, stability problem in the process can be mainly solved by using mesophilic
reactor as a polishing stage (Han & Dague 1997).
Table 2-1 Advantages and disadvantages of temperature ranges
Temperature advantages disadvantages
range
Slow process
Psychrophilic High energy demand for bio-
(15℃) degradation (Appels et al. 2008)
Less sensitive to environmental Low Methane yield (C. Zhang et al.
Mesophilic changes 2014)
(30-40℃)
Fast due to increase in biochemical High energy requirement
Thermophilic
(50-60℃)
reaction rates
Improved dewatering
High pathogen destruction
High odor potential (Lettinga et al.
2001)

21
2.3.3.3 C/N ratio
Except for carbon, nitrogen is also an important source for microorganism to produce cell protein
which is important for Biogas production, both carbon and nitrogen are important for AD process
since nitrogen helps with building cell structure and carbon helps in providing energy (Jain et al.
2015b), it is important to be in the proper range of C/N ratio, for solid state waste the right range
is between 20.1 to 30.1 to prevent excessive production of total ammonia nitrogen and VFAs as
intermediates, since they can decrease the methanogenic activity for methane production, however
for solid state waste the C/N ratio is dependent on feedstock, but 25.1 seems to be optimal level
(Li et al. 2011). For algae as feedstock pH and C/N ratio are completely related. The optimal C/ N
ratio is between 20 to 35, lower C/N ratio means protein rich material which results in excessive
ammonia production that effects the activity of microorganism and higher amount of VFA
production (Kwietniewska & Tys 2014).
2.3.3.4 Organic loading rate
This factor indicates the number of volatile solids fed to the system every day in continuous
systems. most systems operate in organic loading rate of 0.5 to 1.6 kgVS/M3.day (Jain et al. 2015b)
Rising the organic loading rate can increase the methane production and can result in smaller
reactors and lower cost (Jain et al. 2015b) until reaching the overloading stage which will
accumulate acid and the fermentation step will stop. Adding substrate to the system before
adaption taking place can cause high VFA production and pH drop in the system which inhibits
methane production (Kwietniewska & Tys 2014). OLR fluctuations in the system in short time
durations with a wide range can disturb the balance between methanogenesis and acidogenesis
stages in the AD process (Amani et al. 2010).

22
2.3.3.5 Retention time
Retention time is the time needed for degradation of all organics which depends on temperature
and composition. The average retention time for mesophilic condition is 15 to 30 days and is
shorter for thermophilic condition. There are two different retention times: 1- hydraulic retention
time 2- solid retention time (Kwietniewska & Tys 2014).
Hydraulic retention time (HRT)
HRT is the ratio of reactor volume to influent flow rate. Short HRT can cause accumulation of
VFAs and bacterial loss which ends in wash out in the system, also longer HRT can result in
ineffective utilization of components (Kwietniewska & Tys 2014). HRT may vary from season to
season by temperature change or day to day by feedstock change, so the optimal HRT varies with
waste composition, temperature and system’s details (Buekens 2005).
Solid retention time (SRT)
SRT is a common parameter used for designing in wastewater treatment plants which indicates the
amount of residence time for microorganism in the reactor, which is directly related to the growth
rate of microorganisms, providing the time for organisms to reproduce themselves, high SRTs will
provide the proper time duration for slow growth bacteria enrichment, establishing a more diverse
microbial community in the system (Clara et al. 2005).
2.3.3.6 Nutrients
The most important nutrients needed for AD process are C, H2, O2, N2, P and S among all nutrients
N2 and S are the ones that are facing deficiency in feed stocks such as municipal solid waste which
means extra supplement should be added (Jain et al. 2015b), nitrogen and phosphorus are the most
important ones among all other nutrients, other micronutrients are nickel, cobalt, sodium,
23
selenium, tungsten, magnesium, barium and molybdenum which are mainly sufficient in the
wastewater itself (Amani et al. 2010).
2.3.3.7 Ammonia
This material is the product of nitrogen rich compound biodegradation such as protein which is
mostly in form of ammonium (NH4+) or free ammonia (NH3). This compound is essential for
growth of bacteria however it also can be toxic in high concentrations. It is reported that in C/N
ratio under 30, ammonia is in low levels which resulted in low AD performance, however high
loading rates can cause VFA accumulation but having the enough ammonia can result in avoidance
of VFA inhibition and higher methane production. Except for buffer capacity, ammonia is
inhibitory to many bacteria in high concentration, which it diffuses the cell membrane and stops
cell function, literature indicates that acetoclastic methanogens are more sensitive to ammonia
inhibition compared to the hydrogenotrophic bacteria, so it mostly stops methane production in
the system, there are various methods for excessive ammonia removal such as biological nitrogen
elimination, stripping or membrane contactors (C. Zhang et al. 2014).
2.3.4 Biogas AD reactors
there are different reactors that can be utilized in AD considering the growth process which can be
suspended or attached growth process, in suspended growth systems the microorganisms and
substrate can freely move around in the reactor while in attached systems microorganisms intend
to grow on a support media surface which provides more surface area for microorganism growth
(Mustafa et al. 2014). Below there are reactor types that are mainly used in AD systems:
2.3.4.1 Completely stirred tank reactor (CSTR)
This reactor contains a mixer for an even mixture inside the system, inadequate mixing can result
in less stabilized waste, decrease in Biogas production and an uneven distribution of

24
microorganisms, enzymes and substrate (Kaparaju et al. 2008). CSTR reactors can be both in
single stage or two stage process, the difference is in separation of the process steps, in two stage
process the methanogenesis stage is separated from the acidogenesis step since these stages may
have different operational conditions and duration for microorganism growth (Mustafa et al. 2014).
2.3.4.2 Anaerobic sequencing batch reactor (ASBR)
This kind of reactor has a cycle pathway with four sequential steps: feed, react, settle and decant,
this reactor has the advantage of higher Biogas production and also high food to microorganism
ratio comparing to CSTR reactor however it has less capacity in organic loading rate (Mustafa et
al. 2014), this reactor is of interest because of no clarifier requirement and higher retention time
for slow growing bacteria community (Bouallagui et al. 2005). By filling the reactor with support
media anaerobic sequencing batch biofilm reactor can be introduced, in conventional ASBR there
is granular biomass available while in ASBBR there are other support media such as polyurethane
foams available for microorganism growth (Karadag et al. 2015).
2.3.4.3 Anaerobic membrane bioreactor (AnMBR)
This reactor is a more novel technology compared to other systems, with advantages such as low
sludge production with a complete biomass retention however problems such as membrane fouling
which ends in higher energy requirement and lower process performances are the main
disadvantages of this reactor which requires more studies (Mustafa et al. 2014).
2.3.4.4 Anaerobic plug flow
These reactors mainly contain an insulated vessel and a heated tank which is mostly made of
reinforced concrete, steel or fiberglass without any need of internal mixing, these digesters can
operate in different temperature conditions (Karadag et al. 2015).

25
Permeate Bi
influent Biogas recycle
ASBR
CSTR Fill React Settle Decant
ogas
Anaerobic Plug flow
AMBR
Figure 2-5 Reactors configuration
2.3.4.5 Covered lagoons
These systems contain a large lagoon with a gas tight cover, they mainly operate in ambient
temperature and have very long hydraulic retention time of up to 45 days (Karadag et al. 2015).
2.3.4.6 Anaerobic filter
Anaerobic filter is a common biofilm reactor that is mainly effective on low strength wastewaters,
the feeding system in this reactor can be single or multiple, the single feeding can be either
horizontal or vertical (down-flow or up-flow) (Karadag et al. 2015), this reactor has the advantages
of high organic loading capacity, low hydraulic retention time and low sensitivity to shocks in the
system, since this reactor is effective for low solid content wastewaters, it is mostly a secondary
wastewater treatment and is mostly combined with another treatment process (Mustafa et al. 2014).
Outflow
Motor
Feed
Inflow
product
influent effluent
Sludge Blanket
Mem
brane
Agitator
Biog
as

26
2.3.4.7 Up-flow anaerobic sludge blanket (UASB)
This kind of reactor mostly contains dense granules that are produced inside the reactor itself, the
wastewater moving from bottom of the reactor towards upper side of the reactor, going through
the dense layer of granule inside the reactor (Mustafa et al. 2014). Expanded granular sludge bed
(EGSB) is a reactor which is very similar to UASB reactor but the main difference is that it can
treat higher liquid velocity compared to UASB reactor (Mustafa et al. 2014).
2.3.4.8 Anaerobic fluidized bed reactors
These reactors are mostly used for industrial wastewater treatment, such as food industries and
paper industries, AFBR offers a lot of advantages such as high stability process, high treatment
efficiency and high heat and mass transfer rates (Mustafa et al. 2014).

27
Support media
Suspended growth
Effluent
Biogas
Effluent
Recycle Fluidized bed
carries
Biogas
Liquid and
solid
Anaerobic Filter
Anaerobic covered lagoon
Influent
AFBR
Influent
Influent
Figure 2-6 Reactors configuration
2.3.5 Improvement methods on Biogas production process
2.3.5.1 Pretreatments
There are various physical, chemical and enzymatic pretreatment that can be used for higher
biodegradation of solid organic wastes, many studies have showed different pretreatments such as
chemical, mechanical, ultrasound and thermal have been successful in increasing the Biogas
production. Pretreatment helps weakening the cell walls for allowing methanogenic bacteria to use
the organic material inside the cell, in AD process, hydrolysis step is the rate limiting step, so it is
Biogas
Effleunt
Gas bubbles
Sludge blanket
UASB
Sludge bed
Baffle

28
important to enhance this stage for whole process improvement, there are many factors that affect
hydrolysis such as feed characterization, structure and particle size, acceleration of this stage can
be done by different pretreatment methods (C. Zhang et al. 2014). By physical treatment smaller
particles are produced which have higher specific surface area which is beneficial for Biogas
production, hydrogen production before methane production can also be an improvement for
biodegradation and hydrolysis (Kwietniewska & Tys 2014).
2.3.5.1.1 Mechanical pretreatment
This pretreatment is defined for breaking down the substrate particles into smaller sizes which can
increase the specific surface area that can provide better contact between substrate and inoculum,
which improves AD process. Larger particle size materials produce less amount of methane
because of a decrease in COD degradation. There are different kind of mechanical pretreatments
that are used for AD such as sonication, collision, high pressure homogenizer, maceration and
liquefaction (Jain et al. 2015a). In various studies, it was mentioned that mechanical pretreatment
on municipal solid waste has minor effect on methane production and Biogas composition, Izumi,
studied the effect of size reduction on methane production in food waste and found size reduction
can increase up to 40% of COD conversion and 28% of methane production, however decreasing
the size to less than 0.7mm can cause VFA accumulation, which drops the pH level and results in
less methane production (Izumi et al. 2010).
2.3.5.1.2 Chemical pretreatment
By using strong acids, alkalis and oxidants, organic compounds are destructed since AD needs pH
adjustment with alkalinity, it is preferred to use alkalinity pretreatment, solution and saponication
occur in these reactions which reduce the particle size and increases the specific surface area, the
preferred chemicals for alkalinity pretreatment is NaOH and Ca(OH)2, however NaOH can highly

29
boost the AD process but it is fairly expensive compared to Ca(OH)2, therefore mostly this
chemical is used (López Torres & Espinosa Llorens 2008), acid pretreatment is considered suitable
for substrates with high level of lignocellulose content, really strong acid usage can result in
production of unwanted materials such as furfural and hydroxymethylfurfural, this method is not
suitable for carbohydrate rich wastes since it can produce high amount of VFA because of
degradation acceleration and accumulation (Jain et al. 2015a). Among chemical methods for
pretreatment, ammonia pretreatment is receiving attention since it doesn’t produce a side waste
stream because ammonia can be utilized as a Nitrogen source in the process (Zhong et al. 2011).
2.3.5.1.3 Thermal pretreatment
This treatment enhances the dewatering process as well as the digestible handling. A wide range
between 50 to 250°C are used to improve AD process, however some articles have showed that
heating higher than 70°C can cause accumulation because of new chemical bonds (Jain et al.
2015a), therefore thermal pretreatment can be divided in two groups, 1- heating up to 70◦C or
120◦C which increases the Biogas production up to 20 to 30% 2- heating up to 160°C or 180°C
which increases the Biogas production from 40 to 100% , so however it increases the Biogas
production much higher but the results may vary in a wide range (Bougrier et al. 2008). Using
thermal pretreatment for sludge wastes can breakdown the gel structure and release the
intracellular water bound which means this method provides a high level of solubilisation and
enhancement of methane production (Bougrier et al. 2007).
2.3.5.2 Co-digestion
Adding a second stream to provide the missing nutrients in the first stream can improve the
physicochemical characteristics which increases the process efficiency, this improvement method
offers easier sludge handling, inhibition prevention and C/N ratio adjustment. Improving the

30
loading rate by co-digestion can be economically feasible and can result in higher Methane
production by nutrient balance (Kwietniewska & Tys 2014). Even in some situations co-digestion
can provide the moisture content of the feed, however co-digestion may have some disadvantages
such as high cost of slurry transportation and difficulty in combining different waste policies
(Mata-Alvarez et al. 2000). (Yen & Brune 2007) have studied on co-digestion of algal sludge and
waste paper with high Carbon content, the C/N ratio in algal sludge is mainly low which results in
release of excessive amount of total ammonia Nitrogen and VFAs, co-digesting algal sludge with
paper waste increased the Methane production by two times, by increasing the C/N ratio to an
optimum level. (Macias-Corral et al. 2008) experimented the co-digestion of dairy cow manure
(CM), organic fraction of municipal solid waste (OFMSW) and cotton gin waste (CGW), the
results showed higher Methane yield up to 172 m3 Methane/ dry waste per ton in co-digesting of
CM and OFMSW compared to single waste treatments, co-digesting of CGW and CM also resulted
in 87 m3 Methane/ dry waste per ton which is higher than individual wastes.
2.3.5.3 Attached growth systems
In cases, startup time of AD takes up to 4 months or more, an important way to provide a more
economical process is to shorten the time duration (Escudié et al. 2011), Using granules and carrier
materials such as biofilm are two methods of preserving the high biomass concentration and
shortening the startup time, there are several important factors for choosing carrier materials and
adhesion of microorganisms on them, mostly for microorganism to adhere to carrier material,
physicochemical properties such as roughness and low surface energy and microbiological
composition of inoculum is important (Habouzit et al. 2011). Most of the materials used as carriers
are highly porous and have a high specific surface (Barca et al. 2015). Carrier materials can have
different shapes and sizes. They can be granular, cylindrical and spheroidal. Depending on the

31
kind of reactor used in the experiment different sizes with considering the density of the carrier
material are in use (Barca et al. 2015). Biofilm process can be divided into three groups: 1-. Moving
medium in which biofilms continuously are in motion inside reactors by mechanical, hydraulic or
air force such as anaerobic fluidized bed or moving bed bioreactors. 2- Fixed medium systems that
consists of motionless media like anaerobic filter and up flow anaerobic sludge blanket Fixed film
reactors which may have a problem of clogging that occurs mainly in filters. 3- anaerobic sludge
Granulation mostly taking place in UASB reactors. The advantages and disadvantages of biofilm
is showed in the table below:
Table 2-2 Advantages and disadvantages of biofilm reactors with particles
Advantages Disadvantages
High reactor concentration Difficulty in measuring biofilm thickness
Compact reactor with smaller size Clearing up of particles because of biofilm
overgrowth
Minimization in sludge production Costly liquid distributers
High biofilm surface area Long start-up time for biofilm formation
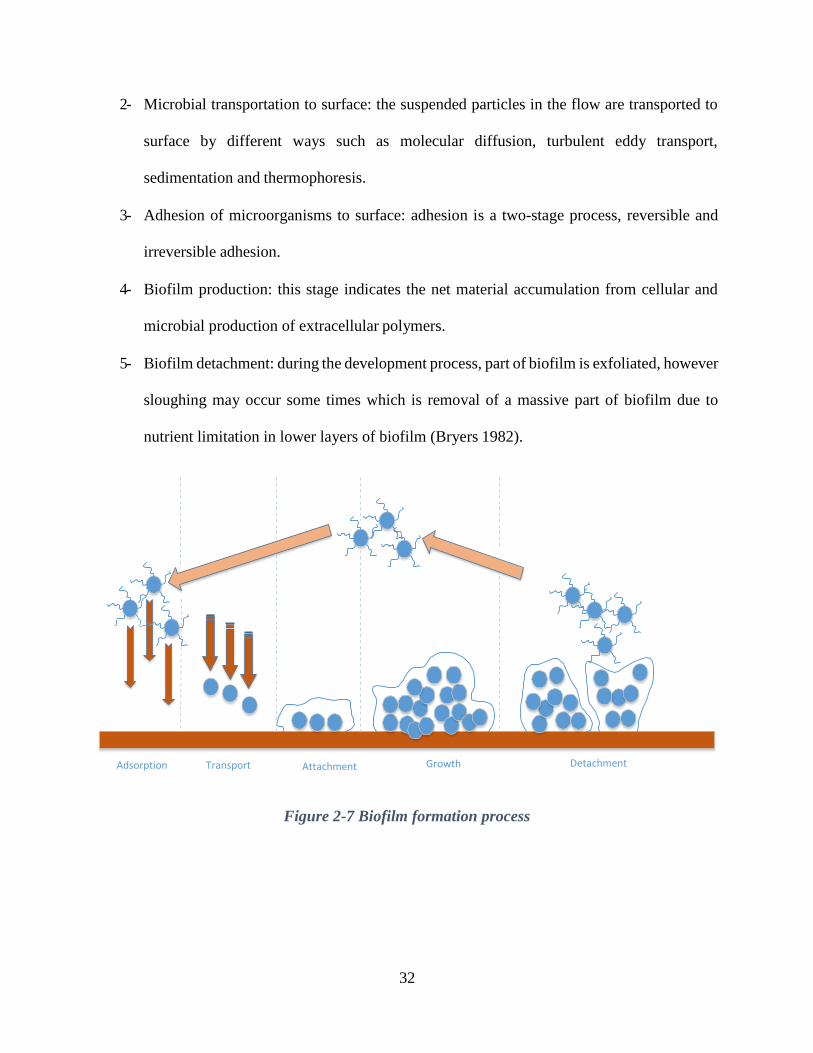
2.3.5.3.1 Biofilm process stages
Development of biofilm is a biological reaction process with different stages as below shown in
Figure 2-7:
1- Adsorption: materials with different characteristics are adsorbed to organic layer in very
short time duration (minutes) of water disclosure.
32
2- Microbial transportation to surface: the suspended particles in the flow are transported to
surface by different ways such as molecular diffusion, turbulent eddy transport,
sedimentation and thermophoresis.
3- Adhesion of microorganisms to surface: adhesion is a two-stage process, reversible and
irreversible adhesion.
4- Biofilm production: this stage indicates the net material accumulation from cellular and
microbial production of extracellular polymers.
5- Biofilm detachment: during the development process, part of biofilm is exfoliated, however
sloughing may occur some times which is removal of a massive part of biofilm due to
nutrient limitation in lower layers of biofilm (Bryers 1982).
Adsorption Transport Attachment Growth Detachment
Figure 2-7 Biofilm formation process

33
2.3.5.3.2 Different biofilm structures
Sludge granulation
The major success in UASB reactors are because of granulation formation, this phenomenon
allows higher loading rate compared to conventional process, also granulation decreases the
reactor size and operation cost. There are two main reasons for high loading rates, 1- high settling
parameters of granules, which are the main reason for uncoupling of hydraulic retention time and
solid retention time. 2- granular sludge provide high methanogenic activity, the studies show that
acetogenic bacteria in granules are highly connected to hydrogenotrophic methanogens which
provide high hydrogen transfer, which results in high degradation rates.
There are different theories on anaerobic sludge granulation separated into three groups of
physical, microbial and thermodynamic. Physical theory: in this theory, physical conditions such
as liquid and gas up-flow velocity, suspended solid, removal of excessive sludge are the reasons
for granulation.
Microbial theory: this theory is based on microorganism characteristics, in this theory physical
approaches are also considered, the granulation parameters are based on the microbiology and the
reactor conditions such as hydrodynamics.
Thermodynamic theory: in this theory, energy involved in adhesion is the main term in granulation
mechanism analysis, hydrophobicity and electrophoretic mobility are the factors that are important
in this theory (Hulshoff Pol et al. 2004).
Moving medium
Moving medium as a group of biofilm process can improve the digestion system by increasing the
retention time of microorganisms inside the reactor. Moving bed reactors contain biofilms that are
attached to the carrier which can freely move inside the reactor (Azizi & Sithebe 2015). For

34
different wastes, various kind of materials can be used as attached media, for example for dairy
waste seashell, charcoal, plastic materials, ceramics and natural stones are used (Karadag et al.
2015). Treatment of high strength milk permeate as a dairy waste has been studied in anaerobic
moving bed biofilm reactor in mesophilic condition with organic loading rate of 2 to 20
gTCOD/L.day, the results showed 86.3-73.2% of TCOD removal and maximum substrate
utilization rate of 89.3 gTCOD/L.day (Wang et al. 2009). A study on polyethylene carriers with
different characteristics showed that higher specific surface area in carriers which resulted in
higher COD removal of 80%with OLR of 29.59 gCOD/L.day (Chai et al. 2014).
Fixed film medium
Another group of biofilm process is fixed film reactors, such as anaerobic filter, which consists of
a vertical filter bed that contains inert materials as support media to ease the interaction of
microorganisms and substrate (Switzenbaum 1983). These reactors offer many advantages such as
shortening the HRT from 30 to 40 day to few hours, enhanced process performance because of
increase in specific surface area, however there has to be careful consideration for choosing the
proper carrier material in order to provide a long life of fixed film, the materials used should be
non-biodegradable, available in market and inexpensive; nylon, PVC (Polyvinyl chloride) and clay
pipes have been used for years now (Yadvika et al. 2004), the main problem for fixed film reactors
are is the excessive accumulation of biomass in the reactor because of long time period for running
the experiment (Escudié et al. 2011). There have been many studies on utilizing fixed film medium
for AD, (Vartak et al, 1997), experimented on two different attached media, limestone gravels and
polyester mattings and a combination of both in two different temperature ranges of psychrophilic
(10°C) and mesophilic (37°C), comparing them to conventional system without support media, the
results showed significant methane production increase and maximum reduction in VS and COD

35
in mesophilic condition as well. A study was done on cane molasses stillage in fixed film reactor
packed with a plastic medium, with loading rate of 14.2 -20.4 kgCOD/m3.day and HRT of 3.3 to
2.5 days, the results showed 85 to 97% of BOD and 60 to 73% of COD removal with Biogas
production of 6.5-8.4 m3/m3.day (Bories et al. 1988). experiment on treatment of distillery spent
wash treatment was done in anaerobic fixed film reactor using different media such as charcoal,
coconut coir and nylon fibre, the results showed higher Biogas production up to 7.2 m3/m3.day
with 64% COD removal without any pre-treatment of substrate using coconut coir as support
material (Acharya et al. 2008). (Kennedy et al. 1988) studied on treatment of landfill leachate, both
in up-flow blanket filter and down-flow stationary film reactor which achieved 97% of COD
removal in both systems, inorganic heavy metals were accumulated in both reactors, coated the
biofilm support in down-flow stationary film reactor and concentrated in reactor sludge bed and
filter media on up-flow blanket filter reactors.
2.3.5.4 Additives
AD is a strong way of stabilization of sludge resulting from waste water treatment plants.
Biological anaerobic treatment of wastewater’s working principle is based on a mixture of diverse
types of bacteria functioning in a mixed culture. The performance of the process is strongly
dependent on the balance of AD fundamentals, because of low yield of the anaerobic processes in
contrast to aerobic pathways, the concentrations of nutrients required for the procedure are lower.
If AD process is showing poor performance without any obvious reason, deficiency of trace metals
may be the problematic matter that needs to be checked, underestimation of importance of trace
element requirement in commercialized level may be a crucial complication (Demirel & Scherer
2011).
36
Some of the most important factors affecting the bacterial growth and resulting in optimization of
the process are as following; retention time, proper pH and temperature, proper feeding and
sufficient number of nutrients, reliance of anaerobic fermentation and microbial growth is very
high to availability of the proper level of nutrient supplements (Demirel & Scherer 2011).
Addition of nutrients may solve the problem of the process with high concentrations of VFAs. It
can also affect the metabolic rate of the digestion and by increasing the substrate degradation rate,
it may result in lower reactor sizes and costs (Parkin & Owen 1987).
Except for nutrients needed for AD process there are different light and heavy metals that are
required for AD process, the light metals such as (Na, K, Mg, Ca and Al) and heavy metals such
as (Cr, Co, Cu, Zn and Ni) which are important for enzyme synthesis and activity although even
metals can cause inhibition in the AD process (C. Zhang et al. 2014). Free metals such as iron,
nickel, cobalt, molybdenum, selenium and tungsten are essential for groups of methanogenic
bacteria such as: Methanosarcina barkeri; Methanospirillum hungatii; Methanocorpusculum
parvum; Methanobacterium thermoautotrophicum, and Methanobacterium wolfei;
Methanococcus voltae, and Methanococcus vanielli, and Methanococcoides methylaten (Demirel
& Scherer 2011), Using different metals can increase the Biogas production by utilizing in enzyme
structure of bacteria. Magnesium, calcium, sodium and potassium may be toxic to the process,
high concentrations of calcium results in excessive Carbonate and phosphate production which
limits the mass transfer occurring in biomass, high concentrations of heavy metals such as copper,
zinc, chromium and nickel in substrate results in non- biodegradable heavy metal accumulation
which will have negative effect on process (Kwietniewska & Tys 2014), heavy metals can cause
enzyme function and structure disruption, however the level of inhibition depends on the chemical
form of the metal, pH and redox potential. Inhibition by heavy metals mostly occur in treatment

37
of municipal sewage and sludge or industrial wastewater. There are many substrate sources that
lack in metal concentrations therefore, addition of metal elements is studied (C. Zhang et al. 2014).
Below different additives are discussed in details:
2.3.5.4.1 Enzymes
There are different contaminants that need to be degraded in wastes such as hydrocarbons, phenols,
acids, esters and alcohols that can be biodegraded easily, although there are some compounds such
as polychlorinated biphenyls (PCBs) and polycyclic aromatic hydrocarbons (PAHs) that are less
biodegradable, therefore for biodegradation these compounds should interact with enzymatic
systems (Gianfreda & Rao 2004), adding enzymes to AD process can shorten the digesting time,
increase the digestibility of the sludge and decrease the cost of disposal, using enzymes can
increase the release of extracellular polymeric substances (EPS) and also can convert resistant
elements to biodegradable ones (Yang et al. 2010). Extracellular polymeric substances consist of
a wide range of oxidoreductases and hydrolases, these enzymes can transform polymeric
substances to partially degraded or oxidized compounds that can easily be utilized by cells
(Gianfreda & Rao 2004). Using enzymes as an additive in food waste treatment through AD
allowed higher organic loading rate in the process (Romano et al. 2009), for example using
Aspergillus sp. A-1 as an enzyme for treatment of citrus peels improved the AD process and also
pretreating the peels with fungus enzymes increased the organic loading rate up to 50% (Akao et
al. 1992).
2.3.5.4.2 Light metals
Light metals such as sodium, potassium, calcium and magnesium like any other micro nutrient are
essential for microbial growth and specific growth rate, they are present in the influent in moderate

38
concentrations, however increase in their concentration can result in process inhibition and slow
growth in the system (Chen, Jay J. Cheng, et al. 2008).
Calcium
Calcium is important for growth of specific methanogenic groups such as Methanosarcina sp.
strain TM-I, methanococcus voltae and Methanosarcina barkeri with different concentrations
(Murrayt & Zinder 1985), however excessive calcium addition may interrupt sludge retention,
granule growth and stability in the system (Thiele et al. 1989), high calcium content increases the
product of carbonate and phosphate which will reduce methanogenic activity, loss of nutrients and
buffer capacity (Chen, Jay J. Cheng, et al. 2008), there are few studies on effect of calcium on
AD, (Yu et al. 2001) experimented on effect of calcium on UASB reactor, the results showed that
concentrations between 150 to 300 mg/L can boost the process by enhancement of the three stages
of granulation. Calcium Carbonate can also enhance the biomass activity unless the biomass is
scaled, since it will be less active because of mass transfer limitation (Chen, Jay J. Cheng, et al.
2008).
Magnesium
Magnesium concentration up to 300 mg/L does not highly effect the AD, however increasing the
magnesium to a certain level can increase the growth of certain methanogenic bacteria such as
Methanosarcina thermophila TM1 and a Methanosarcinae-dominated UASB reactor (Chen, Jay
J. Cheng, et al. 2008), formation and growth of cells for M. thermophila TM-1 has shown to be
affected by the magnesium concentration, optimal level of Mg2+ of 30 Nm was indicated and
without any magnesium no growth has been reported (Schmidt & Ahring 1993).

39
Sodium
Food industry wastes produce high sodium concentration substrates; sea food wastewaters may
reach sodium concentrations up to 12 g dm-3 , however methane production will face difficulty in
Sodium concentrations of 10-14 g dm-3 (Soto, Mendez and Lema, 1993), for VFA degrading
bacteria, sodium is more inhibitory to propionic acid-utilizing bacteria than to acetic acid-utilizing
bacteria (Chen, Jay J. Cheng, et al. 2008).
Potassium
Low Potassium concentrations result in performance improvement in mesophilic and thermophilic
temperature ranges, however increase in concentration will inhibit the process mostly in
thermophilic temperature ranges, it is observed in different studies that potassium is inhibitory to
acetate producing methanogens, combination of other metals such as Sodium, Calcium and
Aluminum can reduce the Potassium toxicity in the process (Chen, Jay J. Cheng, et al. 2008).
2.3.5.4.3 Heavy metals
Heavy metals can be a part of active site of enzymes and can directly participate in catalysis.
Effective concentrations of these metals can benefit the protein and nucleic acid molecular
structure and indirectly affect the biological pathway controlling by enzymes and membranes
(Vallee and Ulner, 1972). Chromium, Iron, Cobalt, Copper, Zinc, Cadmium, and Nickel are the
main heavy meals available in the wastewater streams in high concentrations, the important
characteristic of heavy metals is that they are not biodegradable and can produce aggregates in the
system that can cause toxicity and process failure (Chen, Jay J. Cheng, et al. 2008). Mainly
methanogens are more affected by heavy metal high concentration compared to acidogens,
however there are some trophic groups and microorganisms available in the process that are more
influenced by toxicity of heavy metals than methanogens (Chen, Jay J. Cheng, et al. 2008). Heavy

40
metals can have different forms in the AD process, they can be in form of sulfide, Carbonate or
hydroxide, they can participate in sorption to solid fraction or intermediate formation, however
only soluble, free forms of heavy metals are toxic (Chen, Jay J. Cheng, et al. 2008). Sensitivity to
heavy metal toxicity in acidogens and methanogens are as shown respectively: Cu > Zn > Cr > Cd
> Ni > Pb and Cd > Cu > Cr > Zn > Pb > Ni (Lin 1993).

41
2.3.5.4.4 Vitamins
There is very few studies on addition of vitamins to AD process, but it has been stated that adding
vitamins can improve the resistant of the process to biotic and abiotic changes and shocks in AD
(Muller and Muller, 2012). (Angelidaki et al. 1990) studied on adding bentonite as an additive to
oil in thermophilic AD, the results showed that bentonite added to the process aided in oil having
less inhibitory effects on start-up time and to the digestion process, it was observed that more than
80% of the oil was degraded in few hours after feeding when bentonite is added to the system.
2.3.6 Biogas
Biogas is nearly 70% methane and almost 30% CO2, the composition of this gas is shown in Table
2-3 (Kwietniewska & Tys 2014), this gas is 20% lighter than air and can’t be converted to liquid
in normal temperature, by removing the CO2 the remaining compressed gas can be used for
stationary applications and transportation, also CNG which is enriched Biogas. there are different
methods for Biogas enrichment in order to remove the CO2 and H2S and water, the easiest and
cheapest method is to used pressurized water as an absorbent liquid, which absorbs the H2S and
CO2 by the down going water, methane can be collected from the vessel in top of the reactor but
the down side of this method is high water requirement (Jain et al. 2015b).

42
Table 2-3 Biogas composition
Biogas elements content
Methane 50-75%
Carbon dioxide 25-50%
water 6-6.5%
Oxygen 0.9-1.1%
Nitrogen 3.9-4.1%
Hydrogen -
Hydrogen sulfide <0.1-0.8%
Trace elements -
The Biogas composition indicates the stability of the system; the process is stable when the
products are only CH4 and CO2 but if H2 and CO are also in the final gas composition then there
is a disturbance in the system, mass balance helps with methane production measurement while
energy balance helps with maintaining the proper temperature level. In COD mass balance, 90%
of the COD is converted to methane and the other 10% is used for biomass inside the reactor, in
theory a rate of 0.35 m3 CH4/kg COD is considered for estimation of methane production, the
products of anaerobic degraded organic materials are the most oxidized form of Carbon (CO2) and
the most reduced form which is CH4 in Biogas, the amount of Biogas produced in digesters are
always lower than the theoretical values which is because of 1- a part of substrate is used for
biomass synthesis, 2- some of the substrate never gets used for producing effluent and 3- here
might be a lack of nutrients (Jain et al. 2015b).

43
Chapter 3 Enhancement of AD by using particulate growth
systems 3.1 Introduction
Sharp boost in population and urbanization has resulted in higher living standards and energy
demand (Minghua et al. 2009) which are the main reasons for waste production expedition (Abarca
et al. 2013). Various environmental challenges from waste by the community and the waste
characterization, requires different methods for recovering and reusing the materials in waste
which is known as waste management (Demirbas 2011). The usage of proper waste management
strategy is a method for Biogas production which can be a versatile carrier for taking over the
conventional energy sources such as fossil fuels for generating electricity, heat and vehicle fuels
(Weiland 2010). Biogas is environmentally friendly and efficient energy because of its low
hazardous pollutants. The Biogas is a product of AD process as a clean energy source which by
proper functioning can result in providing partial energy demands, resource conservation and
protection of environmental sources (Yadvika et al. 2004), however it mostly contains only 55 to
65% of methane. By upgrading the Biogas, the product which is called methane rich Biogas can
also be used for chemical and material production (Appels et al. 2011).
AD (AD) is a promising technology as a waste management system that produces energy
and reduces the greenhouse gas by utilizing the waste, moreover the product of AD process named
digestate is capable for agricultural use as fertilizer (Adu-gyamfi et al. 2012a). AD as a widely
used waste treatment method, converts organic materials present in the waste to Biogas in an
oxygen free environment, by complex microorganism community (Gong et al. 2011). There are
multiple factors that have impact on AD such as bacterial community, contact of microorganisms
and substrate, retention time and mass transfer (Karim et al. 2005). With all the disadvantages of

44
AD process such as slow start-up, short Biogas production duration and toxicity (Ye et al. 2005);
(Gong et al. 2011), its efficiency mainly in Biogas production can be highly enhanced by microbial
community engineering. Methane formation occurs in four connected stages namely, hydrolysis,
acidogenesis, acetogenesis and methanogenesis which are linked to each other because of
sequential work of each microbe (Adu-gyamfi et al. 2012b) in which the microbial community of
AD process consists of acidogenic, acetogenic and methanogenic bacteria that the later community
plays an important role in methane production since this group has higher sensitivity to
environmental changes, therefore efficient AD process requires development in methanogenic
bacteria (Mustafa et al. 2014).
Aside from microbial fouling (Langer et al. 2014a), using biofilms as a fixed media
increases the retention time of microorganisms in the system which boosts the number of
methanogens in reactor which is a possible approach for higher Biogas production. For example,
Jonatan (Andersson & Björnsson 2002) studied the effect of straw as a biofilm carrier on AD and
demonstrated that it produces higher Biogas and also has higher COD removal of 50 – 73% at
different OLR of 2.4-24gCOD/L.day comparing to suspended plastic carriers. Usage of biofilms
results in higher efficiency in the degradation of organic matters which is an outcome of
aggregation of microorganisms, by that the biomass increases and more efficient degradation
occurs (Langer et al. 2014b), Biomass wash out, a common problem in AD systems can also be
addressed by using biofilms as fixed media. These advantages offered re due to EPS synthesis by
microbial cells that offer protection for biofilm and can increase the stability of the system (Langer
et al. 2014b)(Sutherland 2001), hence this is why suspended cultures are more affected by
environmental conditions such as temperature, pH, nutrition concentration and toxicity comparing
to fixed media. For instance, David (Martinez-Sosa et al. 2011) studied treatment of municipal
45
wastewater using submerged membrane bioreactor which indicated over 90% of COD removal
efficiency with less pathogens and toxicity in the effluent. Kuan (Show & Tay 1999) studied the
influence of support media in an anaerobic filter reactor which indicated 78% removal compared
to 57% of COD removal in suspended growth system. Biofilm characteristics is categorized into
two groups of granular and fibrous biofilms. Granular biofilms are more likely to result in clogging
that defines excess head loss and frequent backwash (Wang et al. 2005). In contrast fibrous
biofilms seem to have the capability to overcome this problem (Gong et al. 2011). As mentioned,
one of the advances available for AD process is improving its waste stabilization and solid
reduction by understanding the microbiology process in the system. Possible solution is using
attached media in reactor, because of slow growth of methanogenic bacteria, reactors have to
provide long contact time for substrates and enzymes with bacterial communities. Therefore, for a
better fermentation, there is a need for long solid retention time, on the other hand, it is more
economical to have short hydraulic retention times. Conventional anaerobic reactors lack the
ability to separate SRT from HRT and attached media is a solution to this problem. Configuration/
application of using biofilm in treating wastes originates from trickling filter from 1980s. Attached
growth systems have several advantages over suspended growth systems such as less maintenance
and required energy as well as compactness of reactors.
Biofilm process can be divided into two groups: 1- Moving medium in which biofilms
continuously are in motion inside reactors by mechanical, hydraulic or air force such as anaerobic
fluidized bed or moving bed bioreactors. 2- Fixed medium systems that consists of motionless
media like anaerobic filter and up flow anaerobic sludge blanket Fixed film reactors have a
problem of clogging that occurs mainly in filters.

46
Moving medium as the first group of biofilm process can also improve the digestion system
by increasing the retention time of microorganisms inside the reactor. Moving bed reactors contain
biofilms that are attached to the carrier which can freely move inside the reactor. As mentioned
before attached media reactors have smaller footprint and are highly resistant to shock loads.
Moving bed reactors and anaerobic fluidized bed reactors, both contain moving mediums (Azizi
& Sithebe 2015). There have been many studies on AFBR reactor, these reactors provide high
purification capacity with no problem of clogging or sludge retention, and microorganisms grow
on small particles because of large available surface area provided by the carriers. These reactors
are compact and rather small. Biofilm thickness produced in these reactors are dependent on
turbulence of Biogas produced in the system (Heijnen et al. 1989), (Buffiere et al. 1998) studied
treatment of red wine distillery wastewater using a down flow fluidized bed with ground particles
as support media and achieved 85% of TOC removal in OLR of 4.5 kgTOC/m3.day and Methane
production of 64% of 6.8 L/L.day.
As mentioned before, diary waste is considered a complex wastewater because of lipids,
proteins and carbohydrates present inside it. (Rafael Borja & Banks 1995) experimented treating
of ice cream wastewater in mesophilic condition in OLR of 15.6 gCOD/L.d and 8 hours of HRT,
in an AFBR reactor using saponite mainly consisting of magnesium silicate as its support media.
This reactor resulted in 94.5% of COD removal and 61% of methane production from 0.33
L/gCOD removed of gas production.
Zeolite as a common moving media seems to be a perfect biofilm for AFBR reactor because
of its high specific surface area, (Fernández et al. 2007) studied the usage of zeolite as support
media for AFBR reactor with OLR of 20 gCOD/L.day that resulted in 90% COD removal with
methane production yield of 0.29 LCH4/gCOD consumed.

47
Moving bed bioreactors with a moving medium are compact reactors that are used for
municipal and industrial wastewater for COD removal, nitrification and denitrification. (Sheli &
Moletta 2007) studied treatment of vinasses in a mixed moving bed biofilm reactor and found out
that in OLR of 1.37 to 4.62 gsCOD/L.day with HRT of 2.8 to 6.3 day, the reactors achieved 68 to
92% of COD removal, however increasing the OLR could result in a drop in the removal
efficiency. (Rodgers et al. 2004) Rodgers Used MBR reactor with plastic biofilm media in
mesophilic condition for treating whey wastewater. The COD removal efficiency reached 89% in
HRT of 1 day and OLR of 11.6 kgCOD/m3.day, by decreasing the HRT to 0.6 day and increasing
the OLR to 15.2 kgCOD/m3.day, COD removal decreased to 81%. The overall Methane yield was
333.4 LCH4/kgCOD removed with 63% of methane. Milk permeate which is high in fat, protein,
lactose and mineral salts has been experimented by (Wang et al. 2009) in a AMBR reactor, Wang
found that a 87-73% COD removal can be achieved in OLR of 2 to 20 gTCOD/L.d with Methane
yield of o.341 LCH4/gTCOD removed. The second group of biofilm process is fixed film reactors,
as mentioned one of the fixed film reactors is anaerobic filter, which consists of a vertical filter
bed that contains inert materials as support media to ease the interaction of microorganisms and
substrate. This reactor is well suited for treating soluble wastes, without any need of recycle with
a rather low solid production, Anaerobic Filter reactors requires power for pushing the liquid to
have an upstream flow, and these reactors are mainly satisfactory for low strength wastes with low
organic loading rates (Switzenbaum 1983),(Rodgers & Zhan 2003). (Young & McCarty 1969)
studied on anaerobic filter reactor filled with stones as its support media for treating synthetic
wastewater with concentration below 6000 mg COD/L with organic loading rate of 26.5 to 212
LB COD/d.1000cu.ft, the liquid detention time was 4.5 to 7.2 hours. In OLR of 26.5 LB

48
COD/d.1000cu.ft, and HRT of 7.2 hours the reactors had the highest COD removal of 93%, by
increasing the OLR, COD removal efficiency dropped to lower than 60%, in the highest rate.
Borja (R. Borja & Banks 1995) also studied anaerobic filter (AF) and anaerobic fluidized
bed reactor (FBR) for treating palm oil mill effluent (POME) waste, both reactors worked in
organic loading of 10 gCOD/L.day and 6 hours residence time and resulted in 90% of COD
removal, by increasing the OLR to 40 gCOD/L.day, both reactors showed lower COD removal
efficiencies, however FBR had better results with 78% of COD removal. AF reactor did not operate
in organic loading higher than 20 gCOD/L.day. This is probably because POME waste is
considered a high strength waste with high COD and SS concentration and anaerobic filter is
mostly suitable for low strength wastewaters. According to (Ruiz et al,1997) slaughterhouse waste
which is considered a medium to high concentration waste can be treated using anaerobic filter
reactor and a UASB reactor, results of the experiment shows 90% of COD removal with OLR of
1 to 5 kgCOD/m3.day for UASB reactor but higher OLRs only achieved 60% COD removal. AF
reactor contained PVC raschig rings as its supporting media, this reactor showed poor results
compared to UASB reactor and in OLRs higher than 5 kgCOD/m3.day destabilizing and washout
occurred in the system. Overall, the highest Methane production of 53% of 1.34 m3/m3.day (total
Biogas production) occurred with HRT of 1.2 day at OLR of 6.58 kgCOD/m3.day with COD
removal of 93% in UASB reactor. The highest methane production of 33% of 1.06 m3/m3.day
(total Biogas production) resulted with HRT of 0.6 day and OLR of 8.36 kgCOD/m3.day with
COD removal of 67% in AF reactor.
As mentioned before, UASB reactor is another fixed film reactor which is more preferable
compared to AF since it has more ability in treating higher strength wastes and also no need of
specific support media, however less requirement on using media may be a disadvantage as well

49
since it means there is a need for a sludge with high settling properties. (Wiegant & Lettinga 1985)
Reported that thermophilic AD process in a UASB reactor for treating sugar wastewater results in
a 26.9 m3/day Biogas production with 57% for methane in OLR of 49.3 kgCOD/m3.day.
AD process is suitable for Dairy waste which is very rich in carbohydrates but it contains
low suspended solids, (Gavala & Kopsinis 1999) found out that by using UASB reactor with OLR
of 6.2 gCOD/L.day, COD removal up to 98% can be achieved however increasing the OLR can
decrease the removal efficiency by more than 10%. This specific attached media reactor is suitable
for different wastes with various strengths. (Lu et al. 2015) Experimented treatment of starch
wastewater using UASB reactor at an OLR of 4 gCOD/L.day which achieved 82 to 98% of COD
removal and methane production of 0.33 LCH4/gCOD removed, however increasing HRT more
than 3 hours caused VFA accumulation, the optimal HRT was 6 hours. There are also studies on
treatment of landfill leachate, (Kennedy 2000) experimented using sequencing batch and
continuous flow UASB reactors with OLR of 0.6 to 19.7 gCOD/L.day, the sequencing batch had
COD removal of 71 to 92% with HRT of 24, 18 and 12 hours, the continuous reactor resulted in
77% to 91% of COD removal with the same HRTs.
Table 3-1 shows various studies taken place on fixed film and moving bed reactors in
anaerobic condition.

50
Table 3-1 Literature review of attached and moving media
reactor type of feed media HRT OLR Temp
(°C)
COD
removal
reference
anaerobic cassava starch nylon fibre 5.4 0.5-4 >25° 94% (Chaiprase
hybrid filter wastewater days gCOD/L.d rt et al.
ay 2003)
anaerobic ice cream filter pack 1.28 35 35° 80% (Hawkes
filter wastewater days gCOD/L.d et al.
ay 1995)
UASB leachate from granular 0.44 15.8 37° 96% (Shin et
food waste sludge days gCOD/L.d al. 2001)
ay UASB dairy waste granular 6 6.3 35° 98% (Gavala &
sludge days gCOD/L.d Kopsinis
ay 1999)
UASB wastewater granular 6 hrs 4 35° 82- (Lu et al.
with starch sludge gCOD/L.d 98.7% 2015)
ay UASB as the sole granular 36 hrs 6.6 35° 73% (Dinsdale
Carbon source sludge gCOD/L.d et al.
ay 1997)
moving bed landfill bio carriers 4 4.08 35° 91% (Chen et
biofilm leachate made of days gCOD/L.d al. 2008)
reactor organic ay system polymer
mixed with Nano-sized inorganic ingredients
moving bed landfill bio carriers 1 7.66 35° 92% (Chen et
biofilm leachate made of days gCOD/L.d al. 2008)
reactor organic ay system polymer
mixed with Nano-sized inorganic ingredients
moving bed landfill bio carriers 2.5 6.27 35° 89% (Chen et
biofilm leachate made of days gCOD/L.d al. 2008) reactor organic ay system polymer
mixed with Nano-sized inorganic ingredients
anaerobic primary sludge zeolite 4 19 37° 68% (Andalib
fluidized from days gCOD/L.d et al. bed municipal ay 2014)
bioreactor(A wastewater nFBR) treatment
mo
ving
bed
rea
cto
rs
fixe
d f
ilm
rea
ctors
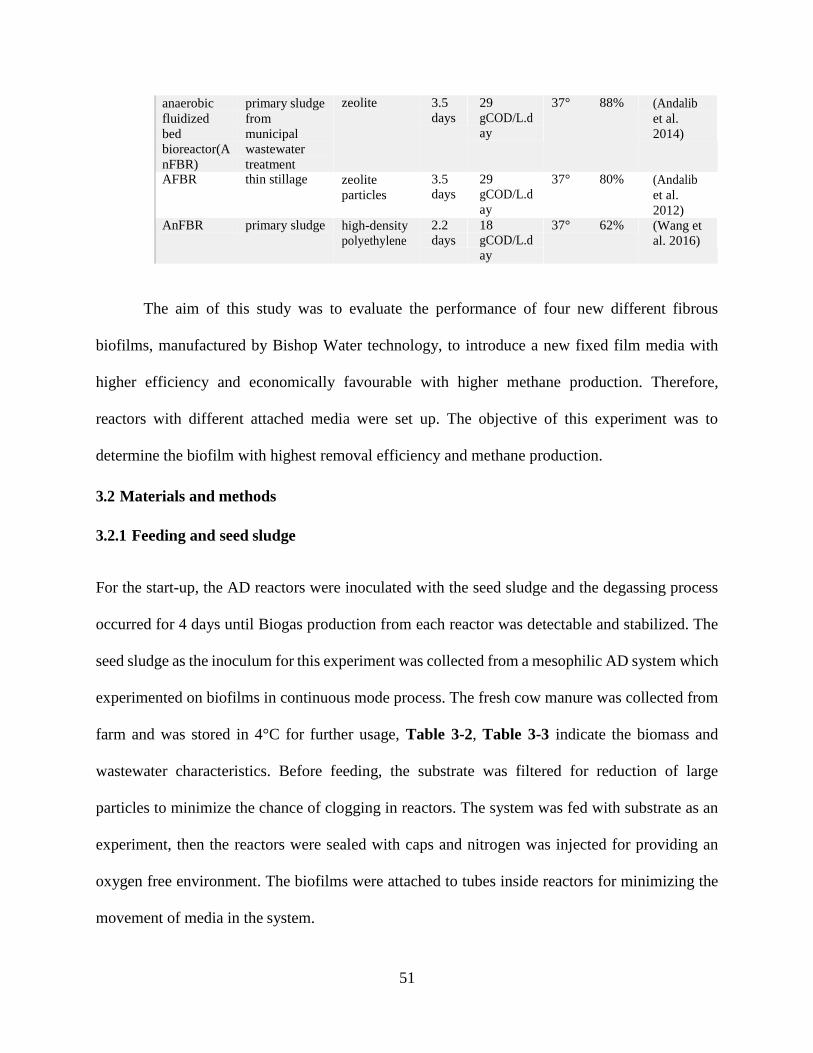
51
anaerobic
fluidized
bed
bioreactor(A
nFBR)
primary sludge
from
municipal
wastewater
treatment
zeolite 3.5
days
29
gCOD/L.d
ay
37° 88% (Andalib
et al.
2014)
AFBR thin stillage zeolite
particles
3.5 days
29 gCOD/L.d
ay
37° 80% (Andalib
et al.
2012) AnFBR primary sludge high-density
polyethylene
2.2
days
18 gCOD/L.d
ay
37° 62% (Wang et
al. 2016)
The aim of this study was to evaluate the performance of four new different fibrous
biofilms, manufactured by Bishop Water technology, to introduce a new fixed film media with
higher efficiency and economically favourable with higher methane production. Therefore,
reactors with different attached media were set up. The objective of this experiment was to
determine the biofilm with highest removal efficiency and methane production.
3.2 Materials and methods
3.2.1 Feeding and seed sludge
For the start-up, the AD reactors were inoculated with the seed sludge and the degassing process
occurred for 4 days until Biogas production from each reactor was detectable and stabilized. The
seed sludge as the inoculum for this experiment was collected from a mesophilic AD system which
experimented on biofilms in continuous mode process. The fresh cow manure was collected from
farm and was stored in 4°C for further usage, Table 3-2, Table 3-3 indicate the biomass and
wastewater characteristics. Before feeding, the substrate was filtered for reduction of large
particles to minimize the chance of clogging in reactors. The system was fed with substrate as an
experiment, then the reactors were sealed with caps and nitrogen was injected for providing an
oxygen free environment. The biofilms were attached to tubes inside reactors for minimizing the
movement of media in the system.
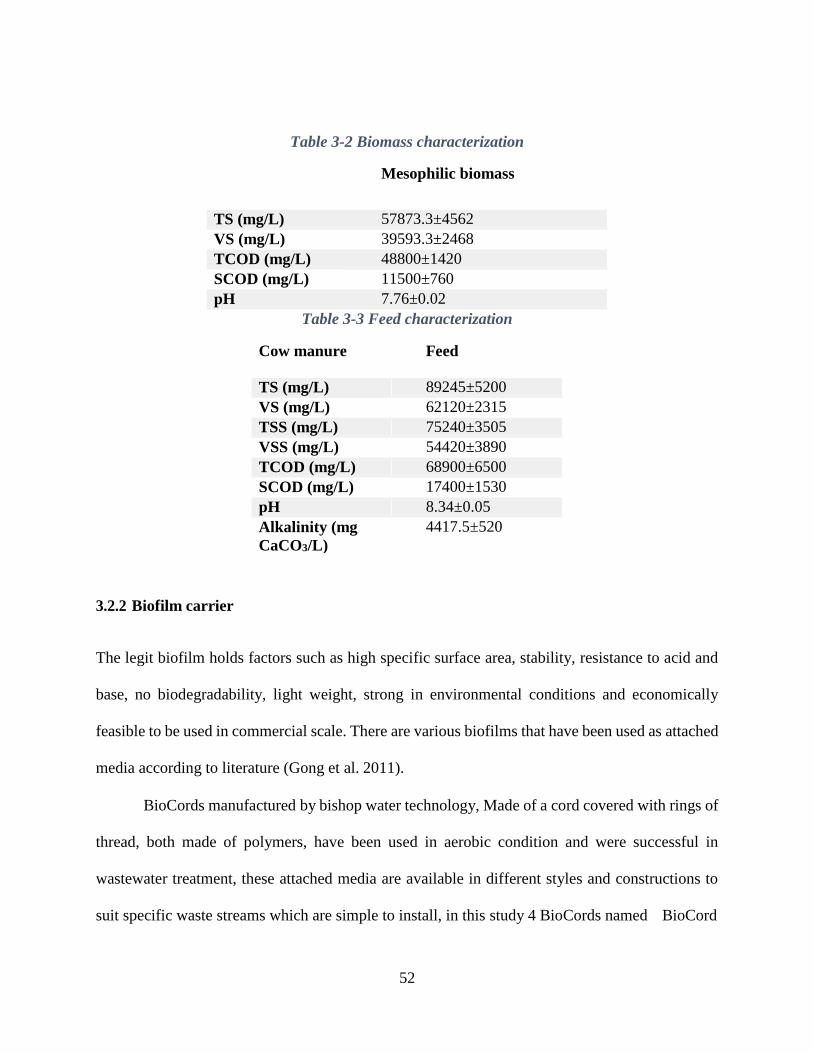
52
Table 3-2 Biomass characterization
Mesophilic biomass
TS (mg/L) 57873.3±4562
VS (mg/L) 39593.3±2468
TCOD (mg/L) 48800±1420
SCOD (mg/L) 11500±760
pH 7.76±0.02
Table 3-3 Feed characterization
Cow manure Feed
TS (mg/L) 89245±5200
VS (mg/L) 62120±2315
TSS (mg/L) 75240±3505
VSS (mg/L) 54420±3890
TCOD (mg/L) 68900±6500
SCOD (mg/L) 17400±1530
pH 8.34±0.05
Alkalinity (mg
CaCO3/L)
4417.5±520
3.2.2 Biofilm carrier
The legit biofilm holds factors such as high specific surface area, stability, resistance to acid and
base, no biodegradability, light weight, strong in environmental conditions and economically
feasible to be used in commercial scale. There are various biofilms that have been used as attached
media according to literature (Gong et al. 2011).
BioCords manufactured by bishop water technology, Made of a cord covered with rings of
thread, both made of polymers, have been used in aerobic condition and were successful in
wastewater treatment, these attached media are available in different styles and constructions to
suit specific waste streams which are simple to install, in this study 4 BioCords named BioCord

53
HS1, BioCord HS2, BioCord LS1 and BioCord LS2 with different specifications indicated in Table
3-4 are evaluated in anaerobic condition.
Table 3-4 Biofilm characteristics
biofilm
number
specific
surface area
Accessible
surface area
length application
BioCord HS1 2.4m2/m 0.14 m2 6 cm Ideal for wastewater
with high suspended
solids BioCord HS2 2.4m2/m 0.14 m2
6 cm
1.2m2/m 0.14 m2 10 cm Biological treatment
for low and medium
concentration
BioCord LS1
BioCord LS2 1.6m2/m 0.14 m2 8 cm
3.2.3 AD experimental setup and operation
Five groups of 3 reactors were conducted in the experiment, the first group was set as the control
system without any biofilm media, and the other four groups contained one specific kind of
BioCord attached to the tube inside reactors. The schematic of reactors is shown in Figure 3-1
which consists of 4 main sections, the reactors were experimented in 35°C constant temperature,
as shown in Figure 3-1, and the incubation system was connected to motor controller for
determination of agitators. For Biogas production measurement, the system is connected to
automatic methane potential test (AMPTs), which contains CO2-fixing unit which are vails
containing alkaline solution that retains other gases except CH4 that allows to pass through to gas
volume measuring device, that digital pulses are produced by certain amount of gas flow which
goes through the device and at last control and analysis unit displays the results. (Bioprocess
Control Sweden manual, 2016)

54
Gas volume
measuring device
Carbon dioxide
fixing unit
control
BioCord LS1
BioCord LS 2
BioCord HS 1
BioCord HS 2
Motor controlling
system
connections
Gas
measuring
device
bation unit
Figure 3-1 Schematic diagram of the experimental setup
3.2.4 Analysis
Anaerobic batch reactors were used to conduct methane production potential and rate by using
biofilm as an effective pathway for microorganism growth. The amount of substrate and the
biomass is measured by considering food to microorganism ratio. Five series of samples from feed
and substrate were collected and firstly diluted and filtered through 0.45 µm, analysis was achieved
using standard methods for wastewater examination, total COD and soluble COD, solids (TS, VS,
TSS and VSS) and alkalinity in influent and effluent were measured per the standards, pH was
measured using pH-meter.
Control and
analysis unit
Incu

55
Produced Biogas was measured by the bioprocess control system which automatically
analyzed methane production of each reactor using the automatic methane potential test system.
The measuring data were downloaded on daily basis from the device.
3.3 Results and discussion
3.3.1 Anaerobic treatment performance
AD is considered a likely preferable technology for recovering energy through waste treatment,
however its disadvantages has limited the application of this process. A biofilm as an improvement
method can optimize methane production as well as the removal efficiencies. Nonetheless
selection of the right attached media for each process is the key challenge. For instance Wei Jia
Gang (Gong et al. 2011) studied three different biofilm carriers (activated carbon fibre (ACF),
polyvinyl alcohol fibre and glass fibre) in anaerobic digesters and indicated that ACF had the most
promising results with the highest methane production and removal efficiencies. In another study
(Martí-herrero et al. 2014) PET (Polyethylene Terephthalate) rings were used as biofilm carriers
and resulted in 44% more Biogas production compared to the reference condition.
In this study four types of BioCords have been used for evaluation of AD process, since
the reactors were maintained at nearly the same VS and pH range, BioCords performance are
comparable, the organic loading rate was fixed on 2.8 gCOD/L during long term mesophilic
experiment for all 15 batch reactors, the food to microorganism ratio (F/M) was 0.68
mgCOD/mgVSS.day in the beginning of process and decreased by deficiency of substrate in time.
The total performance is indicated in the Table 3-5 for all groups of experiment.
Figure 3-2, Figure 3-3 indicate influent and effluent COD and COD removal rate in the
batch bioreactors with different BioCords with each group’s methane production. The influent
COD concentration for all 5 groups varied from 68700 to 69000 mg/L with average of 68900
56
mg/L. During the process, COD removal rates increased and resulted in decreased COD
concentration in effluents, however removal efficiencies indicate that BioCord LS2 obtained the
highest amount of COD removal with 88 % compared to the other three groups of BioCords and
to control system with 78 % removal, measurement of TCOD and SCOD removal efficiencies
confirmed the precession of BioCord LS2. Also, as shown in Table 3-6 BioCord LS2 has the
highest mass balance. The removal of COD as pollutant showed that reactors containing BioCord
LS2 had higher rates of degradations which resulted in higher Methane production rates, an
adequate range of removal efficiencies in anaerobic reactors for degrading organic materials is
dependent on the quality of methanogenic bacteria which can efficiently convert VFAs to methane
and CO2 in an oxygen free environment (Gong et al. 2011).
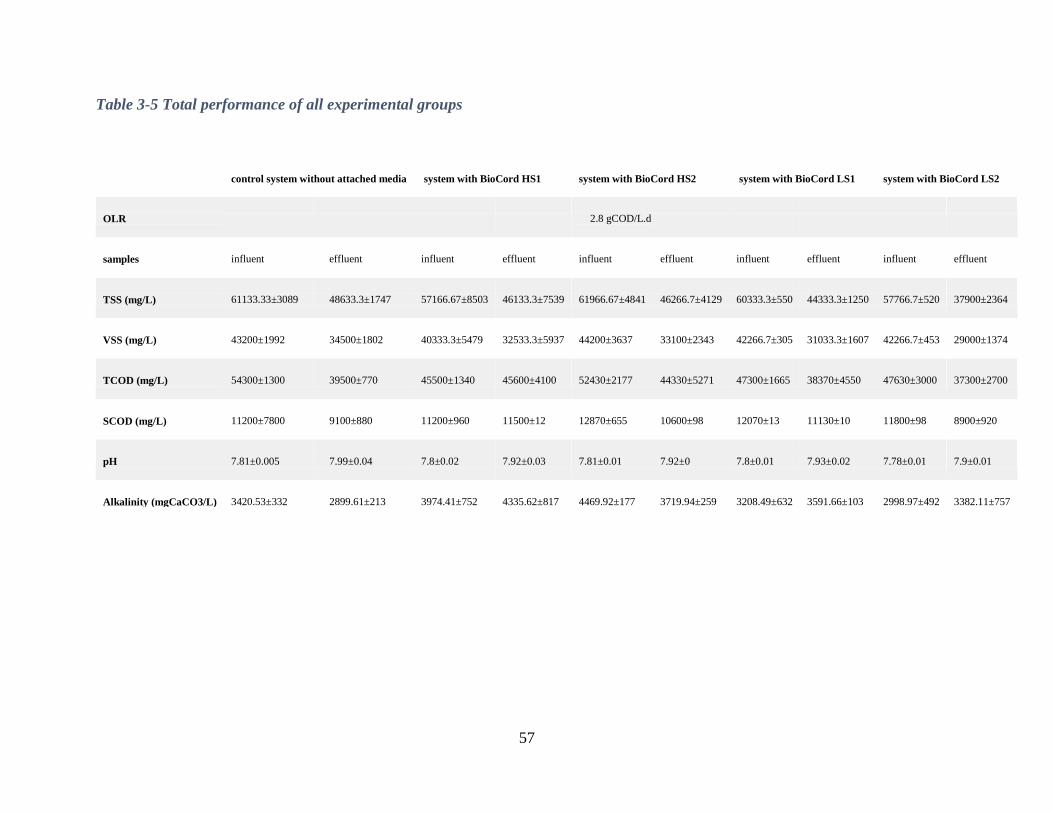
57
Table 3-5 Total performance of all experimental groups
control system without attached media system with BioCord HS1 system with BioCord HS2 system with BioCord LS1 system with BioCord LS2
OLR
2.8 gCOD/L.d
samples
influent
effluent
influent
effluent
influent
effluent
influent
effluent
influent
effluent
TSS (mg/L)
61133.33±3089
48633.3±1747
57166.67±8503
46133.3±7539
61966.67±4841
46266.7±4129
60333.3±550
44333.3±1250
57766.7±520
37900±2364
VSS (mg/L)
43200±1992
34500±1802
40333.3±5479
32533.3±5937
44200±3637
33100±2343
42266.7±305
31033.3±1607
42266.7±453
29000±1374
TCOD (mg/L)
54300±1300
39500±770
45500±1340
45600±4100
52430±2177
44330±5271
47300±1665
38370±4550
47630±3000
37300±2700
SCOD (mg/L)
11200±7800
9100±880
11200±960
11500±12
12870±655
10600±98
12070±13
11130±10
11800±98
8900±920
pH
7.81±0.005
7.99±0.04
7.8±0.02
7.92±0.03
7.81±0.01
7.92±0
7.8±0.01
7.93±0.02
7.78±0.01
7.9±0.01
Alkalinity (mgCaCO3/L)
3420.53±332
2899.61±213
3974.41±752
4335.62±817
4469.92±177
3719.94±259
3208.49±632
3591.66±103
2998.97±492
3382.11±757

58
Table 3-6 COD analysis of all experimental groups
CH4
(mL/d)
TCO
D
in(mg
/L)
TCO
D
eff(m
g/L)
COD
remov
al eff
TCOD
in
(g/d)
TCO
D out
(g/d)
TCOD
for
CH4(m
g/L)
VSS
in(mg/
L)
VSS
out(mg/L
)
VSS
rem
oval
eff
CH4
(L/gCO
Dconsumed)
Theoret
ical
CH4
(mL/d)
CH4
(L/d
ay)
Measured
CH4/Theo
retical
CH4
%
COD
mass
balance
control 870.90 68900 15300 78% 1.378 0.307 2204.8 75240 34500 54% 1137.37 18760 0.871 0.046 81%
HS1 1048.27 68900 11500 83% 1.378 0.230 2653.8 75240 32533.33 57% 1278.37 20090 1.048 0.052 87%
HS2 1067.27 68900 10600 85% 1.378 0.213 2701.9 75240 33100 56% 1281.45 20405 1.067 0.052 89%
LS1 1042.33 68900 11130 84% 1.378 0.223 2638.8 75240 31033.33 59% 1263.00 20219 1.042 0.052 88%
LS2 1141.57 68900 8600 88% 1.378 0.172 2890.0 75240 29000 61% 1325.20 21105 1.142 0.054 92%

59
Figure 3-2 COD removal and of all groups in experiment
The variation of influent ammonia effluent and removal efficiency of NH4-N was investigated.
The influent NH4-N for all 15 reactors varied from 2200 to 3000 mg/L with an average of 2500
mg/L. results showed that reactors had removal rates around 22% which indicates that little
ammonia was utilized by bacteria and nitrification was not remarkable, however BioCord LS2 had
higher nitrification rates, resulting in less ammonia concentration in effluent. Results showed that
higher COD removal can be obtained by using biofilm, while it isn’t very specific to say which
BioCord had higher ammonia removal efficiency. The pH always varied in a quite narrow range
which signified the minimum amount of VFAs being accumulated inside reactors, in the
acidogenesis stage of AD, VFA are produced following by conversion of these acids to acetate.
This intermediate product (VFA) causes microbial stress which is the reason for instability of
anaerobic process by overloading that can cause VFA repletion which is the reason for pH decline.
Carbohydrates are hydrolysed to sugar following by a fermentation stage that produces VFAs, and
proteins are also degraded to VFAs, decrease in pH can kill the methanogenic bacteria and prevent
COD removal efficiencies
95%
90%
85%
80%
75%
70%
65%
day 0 day 1 day 2 day 3 day 6 day 51
time (day)
control HS1 HS2 LS1 LS2
CO
D r
emo
val e
ffci
ency
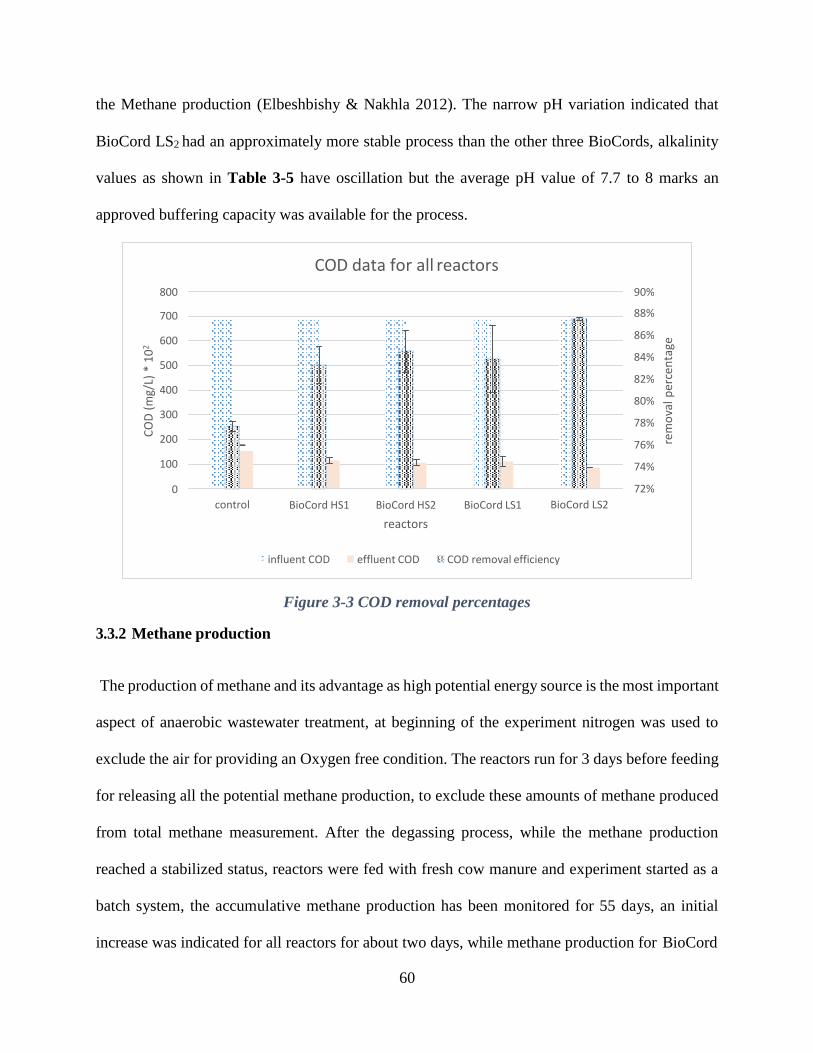
60
the Methane production (Elbeshbishy & Nakhla 2012). The narrow pH variation indicated that
BioCord LS2 had an approximately more stable process than the other three BioCords, alkalinity
values as shown in Table 3-5 have oscillation but the average pH value of 7.7 to 8 marks an
approved buffering capacity was available for the process.
Figure 3-3 COD removal percentages
3.3.2 Methane production
The production of methane and its advantage as high potential energy source is the most important
aspect of anaerobic wastewater treatment, at beginning of the experiment nitrogen was used to
exclude the air for providing an Oxygen free condition. The reactors run for 3 days before feeding
for releasing all the potential methane production, to exclude these amounts of methane produced
from total methane measurement. After the degassing process, while the methane production
reached a stabilized status, reactors were fed with fresh cow manure and experiment started as a
batch system, the accumulative methane production has been monitored for 55 days, an initial
increase was indicated for all reactors for about two days, while methane production for BioCord
COD data for all reactors
800
700
600
500
400
300
200
100
0
90%
88%
86%
84%
82%
80%
78%
76%
74%
72%
control BioCord HS1 BioCord HS2 BioCord LS1
reactors
BioCord LS2
influent COD effluent COD COD removal efficiency
CO
D (
mg/
L) *
10
2
rem
ova
l per
cen
tage

61
LS2 was considerably higher than other BioCords, before reaching a stabilized behaviour. In the
first 40 days, the values of Methane production had an increasing path, then it started to decrease
because of deficiency of substrate. The methane production carried out from batch reactors
containing BioCord LS2 has shown higher than the ones with BioCord HS1, BioCord HS2 and
BioCord LS1, reporting a 26 mL/d for the first 39 days and 7 mL/d for the remaining 18 days’
efficiency on an average basis for the whole experiment. With respect to Methane yield an average
0.015 LCH4/gCOD removed were obtained for BioCord LS2 from day 0 to 51 which is about 10
% higher than the control system and approximately 5 to 10 % higher than the other 3 BioCords.
Application of BioCord HS1, BioCord HS2 and BioCord LS1 seemed to have minor effect on
increasing methane production thus, less positive results for methane production was indicated
from these BioCords.
The results mentioned indicated that for methane production shown in Error! Reference source
not found., it was likely that BioCord implementation as attached media could improve AD
process, also lower standard deviation marks higher stability in reactors containing BioCord LS2,
hence significance of choosing proper attached media is indicated for treatment of cow manure.
The initial results demonstrated that BioCord LS2 should be the most effective BioCord among the
4 tested biofilms for AD process.
Figure 3-4 Cumulative Methane production for experimental groups

62
BioCord HS1
1200
1000
800
600
400
200
0 0 3 6 9 12 15 18 21 24 27 30 33 36 39 42 45 48
day
BioCord HS2
1200
1000
800
600
400
200
0 0 3 6 9 12 15 18 21 24 27 30 33 36 39 42 45 48
day
Control
1200
1000
800
600
400
200
0 0 3 6 9 12 15 18 21 24 27 30 33 36 39 42 45 48
day
BioCord LS1
1200 1000
800
600
400
200
0
0 2 4 6 8 101214161820222426283032343638404244464850
day
BioCord LS2
1200 1000
800
600
400
200
0
0 3 6 9 12 15 18 21 24 27 30 33 36 39 42 45 48
day
cum
ula
tive
met
han
e p
rod
uct
ion
(N
ml/
day
) cu
mu
lati
ve M
eth
ane
pro
du
ctio
n
(Nm
l/d
ay)
cum
ula
tive
met
han
e p
rod
uct
ion
(N
ml/
day
)
cum
ula
tive
met
han
e p
rod
uct
ion
(N
ml/
day
)
cum
ula
tive
met
han
e p
rod
uct
ion
(N
ml/
day
)

63
3.3.3 Performance evaluation of BioCord LS2 as attached media
The initial results of experiment indicated high potential for BioCord LS2 as the preferable attached
media in AD treatment of cow manure. For brighter vision on application of this BioCord, nitrogen
and alkalinity was measured, also biofilms were weighed for indication of attached VSS. Figure
3-4, Error! Reference source not found. indicate the total VSS removal efficiencies for all
groups of experiment. The aim was to have a more specialized look on preference of this biofilm.
The results show that BioCord LS2 had about 5 times more attached biomass with negligible
standard deviation shown in Figure 3-5 which indicated higher amount of waste measurement in
a more stabilized environment, moreover reactors containing BioCord LS2 tend to keep their
methane production in a more consistent trend during a longer-term time period compared to other
three BioCords.
Figure 3-4 VSS removal efficiencies
VSS removal comparison
80%
70%
60%
50%
40%
30%
20%
day0 day1 day2 day3 day6 day51
time(day)
VSS removal eff of control
VSS removal LS1
VSS removal HS1
VSS removal LS2
VSS removal HS2

64
Figure 3-5 Attached biomass to BioCords
3.4 Conclusion
This experiment emphasizes the importance of using BioCords as attached media in anaerobic
condition. The results showed that reactors containing BioCord LS2 as biofilm carrier had superior
performance compared to other BioCords evaluated and compared to control system. the
experiment indicated that:
BioCord LS2 had higher amount of Methane production, almost 10 to 15% higher
than other BioCords and 30% higher than the conventional system.
Attached VSS/m2
60.0
50.0
40.0
30.0
20.0
10.0
0.0
BioCord HS1 BioCord HS2 BioCord LS1 BioCord LS2
BIOCORD TYPE
ATT
AC
HED
VSS
/m2

65
This BioCord showed higher removal efficiency in comparison with the control
system.
Addition of BioCord as an attached media didn’t negatively affect the process by
causing clogging due to biofilm formation.
These BioCords are available in market and are economically feasible without
any need of major change in the configuration of the system.

66
Chapter 4 Enhancement of AD process using micronutrient
supplement addition “BioStreme “ 4.1 Introduction
In order to provide humans and animals with required energy and to support a safe food provision
and to reduce the fossil fuel usage and pollution caused by this source (LIN, 2008), novel handling
and recycling methods for organic material and animal waste is used, AD with Biogas production
is one such method for taking care of this matters (Holm-Nielsen et al. 2009).This process can be
used for reducing the pollution caused by different industries as well as offsetting the usage of
operation by fossil fuels. AD offers many advantages from low sludge production to energy
recovery but the main obstacles for commercialization are long startup time and low process
stability. The problems are often caused by difference in physiology, nutrition and growth kinetics
in methane and acid forming bacteria inhibition caused by different substances (Chen, Jay J Cheng,
et al. 2008). This process is a common process used for treating different groups of organic
materials separated in 5 groups of: 1- sewage sludge 2- animal manure 3- food industry waste 4-
agricultural residues and crops 5- organic fraction of municipal solid waste. This process has been
used for many years however, improving the economic aspects as well as increasing the Biogas
production is attracting a lot of attention, utilizing methods such as pretreatment and co-digestion
has been studied more compared to introducing additives to the system (Romero-Guiza et al.
2016). There has been studies on additives with different approaches such as 1-low concentration
nutrient supplementation 2-high concentration inhibitors adsorbing 3- buffer capacity
improvement and 4- substrate biodegradability enhancement, however results of many studies are
not comparable since there are difference in substrate, enzyme dosage and digester configuration
(Romero-Guiza et al. 2016), for a proper AD in commercialized level, process stability is in high
importance. Therefore paying attention to nutritional requirements is required, since nutritional

67
deficiency, results in an unstable process increasing the chance of failure (M_Kayhanian,1995).
For a well-performed AD process, nutrients are required in right ratio and concentrations in
substrate, the nutrients can be grouped into macro and micro nutrients, nutritional deficiency may
cause incomplete bioconversion of organic materials which results in process failure,
methanogenic bacteria require a wide variety of mineral nutrients for a strong growth
(M_Kayhanian, 1995). As mentioned limitation in micro and macronutrients can be the main
reason for poor performance in AD, process stability is a major problem for AD systems which
leads to unstable methane production. Therefore, there has been studies on AD process to
overcome the AD instability problem and on effective results of adding nutrients in order to
increase the Methane production and process stability by maintaining a proper pH level and
preventing the VFA accumulation. For instance a study on energy crops treatment supplemented
with micro and macro were experimented in single stage continuous reactor, the nutrient
supplement increased the methane yield and also it shorten the hydraulic retention time (Nges &
Björnsson 2012), in a similar experiment (Zhang et al. 2011) investigated on piggery waste with
nutrient supplement and found out higher methane yield and lower levels of VFA accumulation
comparing to its control system, nutrients micronutrients are components existing in biomass
which are important for buffering role, micronutrients on the other hand, are essential for many
enzymatic reactions for methane production (Romero-Guiza et al. 2016), different groups of
methanogens such as Methanosarcina barkeri; Methanospirillum hungatii; Methanocorpusculum
parvum; Methanobacterium thermoautotrophicum, and Methanobacterium wolfei;
Methanococcus voltae, and Methanococcus vanielli, and Methanococcoides methylaten (Demirel
& Scherer 2011) are influenced by free metal ions as micro-nutrients such as nickel, iron and
cobalt, there has been more attention on deficiency of trace elements, despite of the input liquid
68
from different animal wastes, it is assumed that different wastes such as organic wastes, kitchen
and slaughterhouse waste consist of sufficient trace elements and micronutrients but this
assumption has been under question recently (Schattauer et al. 2011), In literature adding different
micronutrients such as Co, Fe, Mo, Ni and Se have been studied (M_Kayhanian,1995).
The macronutrients in AD process are carbon, nitrogen phosphorus, potassium and sulfur, each
and every macronutrient has its own specific function and influence on this process:
Carbon is the primary source for energy and is the main source in bacterial cell structure. Since
most of organic materials are rich in Carbon source then Carbon is not considered to restrict the
process, by defining the ratios of C/N, C/P and C/K, the nutritional requirement can be found.
Nitrogen is also a primary nutrient, this nutrient is essential for synthesis in microbes, in different
forms such as reduced form which is required for protein synthesis. Phosphorus is less essential
compared to carbon or nitrogen but it is still important for nucleic acid synthesis. Potassium is
required for increasing the permeability of cell walls aiding in nutrient transportation. Sulfur can
be present in forms of non-reduced (Sulfate) or reduced-form (Sulfide) in the AD process, the non-
reduced form, sulfates are considered inhibitory to methanogenesis stage, methanogens are only
capable of using reduced-form of sulfur, sulfide, effecting the methanogenesis growth, however
sulfides are required by different enzymes, H2S gas production and sulfide precipitation by heavy
metals are the negative points of this nutrient (M_Kayhanian,1995).
Different metals as micronutrients can have different advantages such as providing elements for
important enzymatic reactions preventing sulfide toxicant actions and stimulating biomass
(Oleszkiewicz and Sharma, 1990), heavy metals such as Cr, Cu and Zn are highly effective on
acidogenesis and methanogenesis stages of AD process, many of these metals are essential for
activity and growth of microbial communities, the exact amount of trace elements required are

69
different in various sources of wastewater (Fermoso et al. 2009). Cobalt as one of micronutrients
is essential for specific enzymes such as Carbon monoxide dehydrogenase. Copper, as an additive
haven’t resulted in any specific effect however this nutrient has been present in different
methanogenic strains. Iron is an essential micronutrient and one of the most predominant elements
for its conductive characteristics and low cost (Romero-Guiza et al. 2016), it offers various
advantages such as activating different enzymes such as pyruvate-ferredoxin oxidoreductase, and
discharging extracellular polymers, different forms of Iron is known to accelerate the AD process,
in a study by (Y. Zhang et al. 2014), addition of Iron to activated sludge process was investigated
rather than pretreatment since it is more cost effective, in this study Iron was added as powder and
scrap to the reactor, all forms of Iron increased the methane yield but the highest increase was for
reactor containing rusty scraps of Iron with 30% of enhancement. molybdenum is important for
formate dehydrogenase however, concentrations of this metal inhibits the production of important
sulfides, this metal is crucial for methane fermentation, there has been various concentrations used
in different studies but the optimum range of Fe for methanogenesis stage is between 280 mg/m3
to 50.4 mg/m3 (Demirel & Scherer 2011). Nickel is essential for the compounds called F factor
430 in cells which is present in all methanogenic bacteria, Nickel can also be the only source for
energy, (Williams et al. 1986) investigated on adding Ni as NiCl2 to poultry waste digester, it was
shown that utilizing Ni additive increased the Biogas production in early stages after addition,
although it didn’t necessarily increased the methane content in Biogas, in another study, nickel
addition was studied on cattle dung treatment, with an optimum range of 4.2-6.2 µg Ni/g of dry
matter in cattle dung, both methane content and Biogas production increased (Dar, 1987), however
increasing the Ni concentration more than the limitation point it causes inhibition to
methanogenesis stage (Demirel & Scherer 2011). Selenium and Tungsten are both components

70
present in formate dehydrogenase, Tungsten has also been reported to have essential effect on
degrading propionate (Zellner & Winter 1987). Zinc similar to copper is present in high
concentrations in methanogenic bacteria, however this compound is a part of different enzymes, it
is not known to be essential for AD process (M_Kayhanian, 1995). Ni, Co and Fe are the most
common nutrient supplement studied in AD process since they are essential for Carbon-monoxide
dehydrogenase, Acetyl-CoA decarbonylase, methyl-H4 STP:HS-CoM methyltransferase, methyl-
CoM reductase and other enzymes that are important in acetoclastic methanogenesis pathways
(Romero-Guiza et al. 2016), also these metals are known to be essential in acetotrophic pathway
for Methane producing bacteria in which acetate is oxidized to Carbon dioxide and Hydrogen
which is continued by hydrogenotropic methanogenesis (Zhu & Tan 2009), Table 4-2, Table 4-3
indicate studies on different light and heavy metals as nutrient supplement to AD process with
stimulatory and inhibitory ranges of each. Enzymes have been used as pretreatment to complex
organics such as lignocellulosic and lipid rich materials, however enzymes can also be added to
AD process as nutrient supplement, adding enzymes to AD process can shorten the digesting time,
increase the digestibility of the sludge and decrease the cost of disposal, using enzymes can
increase the release of extra cellular polymeric substances (EPS) and also can convert resistant
elements to biodegradable ones (Yang et al. 2010), enzymes have high capability to act under toxic
and various environmental conditions, they can operate in conditions which different
microorganisms, predators and inhibitors are present, because of their smaller size and higher
solubility and mobility they have easier access to substrates compared to microbes (Romero-Guiza
et al. 2016) . In study co-digestion of grease trap and sewage sludge was investigated with addition
of lipase enzyme, at first adding grease trap to sewage sludge decreased the biodegradability
however by addition of lipase to the system, the obstacle was completely overcome, moreover it
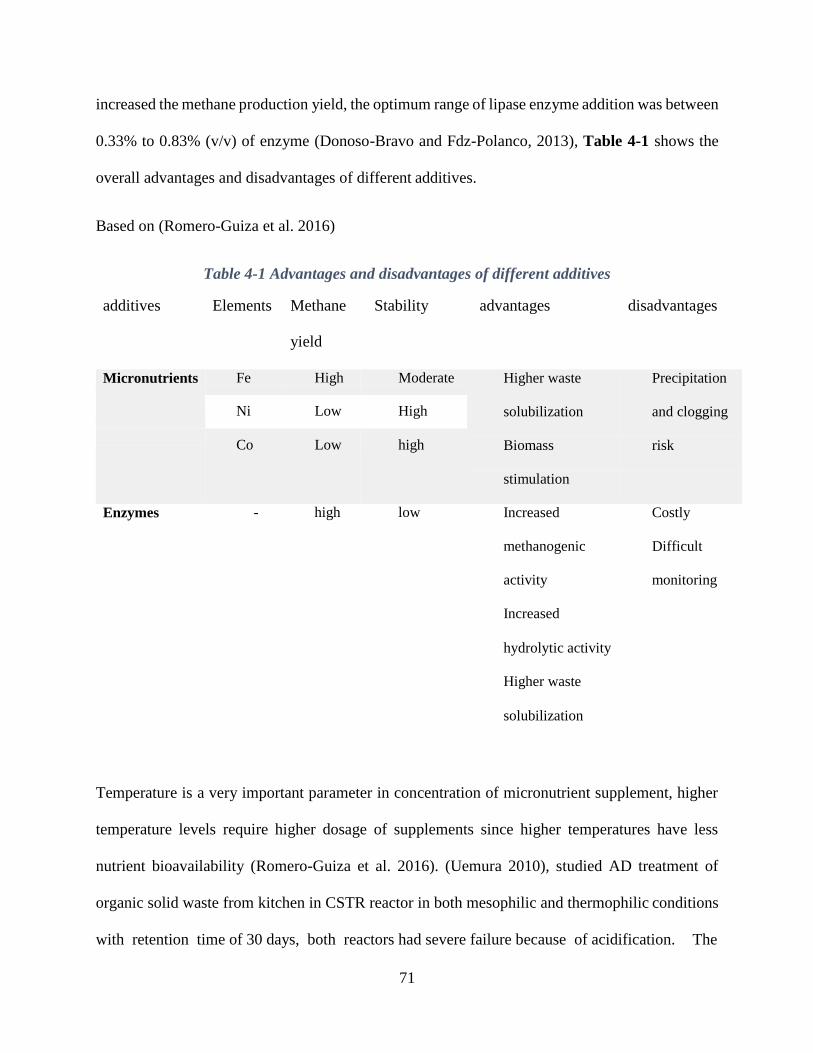
71
increased the methane production yield, the optimum range of lipase enzyme addition was between
0.33% to 0.83% (v/v) of enzyme (Donoso-Bravo and Fdz-Polanco, 2013), Table 4-1 shows the
overall advantages and disadvantages of different additives.
Based on (Romero-Guiza et al. 2016)
Table 4-1 Advantages and disadvantages of different additives
additives Elements Methane
yield
Stability advantages disadvantages
Micronutrients Fe High Moderate Higher waste
solubilization
Biomass
stimulation
Precipitation
and clogging
risk
Ni Low High
Co Low high
Enzymes - high low Increased
methanogenic
activity
Increased
hydrolytic activity
Higher waste
solubilization
Costly
Difficult
monitoring
Temperature is a very important parameter in concentration of micronutrient supplement, higher
temperature levels require higher dosage of supplements since higher temperatures have less
nutrient bioavailability (Romero-Guiza et al. 2016). (Uemura 2010), studied AD treatment of
organic solid waste from kitchen in CSTR reactor in both mesophilic and thermophilic conditions
with retention time of 30 days, both reactors had severe failure because of acidification. The

72
mesophilic system recovered by addition on nutrient supply but not the thermophilic system,
indicating that thermophilic reactor required higher concentrations of supplements.

73
Light metals substrate Stimulatory
concentration
Inhibitory
concentration
reference
Synthetic wastewater 7000 mg/L - (Jackson-Moss & contacting glucose Duncan 1991) Synthetic wastewater/acetic 200 mg/L 2500-4000 mg/L (Kugelman & acid Mccarty 1965)
Calcium Lactose >120 mg/L <120 mg/L (Huang et al,
1995) Synthetic wastewater 150-300 mg/L <300 mg/L
(Yu et al. 2001) Synthetic wastewater (alpha 720 mg/L - (Ahring et al.
Magnesium medium) Synthetic wastewater
300 mg/L
400 mg/L 1991) (Schmidt &
Ahring 1993)
Potassium Synthetic wastewater/ acetic
acid
>400 mg/L <400 mg/L (Kugelman &
Mccarty 1965) Mesophilic coffee waste >1200 mg/L <1200 mg/L (Fernandez & Forster 1993) Thermophilic coffee waste >200 mg/L <200 mg/L (Fernandez & Forster 1993) Synthetic acetate broth 350 mg/L - (Khan & Ashraf 1988) - - 3500-5500 mg/L (Mccarty 1964)
Sodium (moderately)
8000 mg/L
(strongly)
Table 4-2 light metal concentration effect on AD process literature review

74
2 mg/L 27 mg/L wastewater Glucose based synthetic
(Altaş 2009)
Table 4-3 Heavy metal concentration effect on AD process literature review
Heavy
metals
substrate Stimulatory
concentration
Inhibitory concentration reference
Nickel
Zinc
N/A 81 mg/L Different ratios of acetic, (Lin 1993)
propionic and butyric acid
N/A
440 mg/L Different ratios of acetic
propionic and butyric acid
(Lin 1993)
Glucose based synthetic
4 mg/L 35 mg/L wastewater
Sucrose
(Altaş 2009)
N/A 1600 mg/L containing wastewater (Li & Fang
2007)
7.5 mg/L 2 mg/L Glucose-based synthetic (Altaş 2009)
wastewater
4.5 mg/L N/A Sucrose-based wastewater (Chen, Jay J.
Cheng, et al.
2008)
N/A 1600 mg/L Sucrose containing (Li & Fang
wastewater 2007)
N/A 3000 mg/L Sucrose containing (Li & Fang 2007)
Chromium
15 mg/L 60 mg/L wastewater
Sucrose based wastewater
(Chen, Jay J
Cheng, et al.
2008)

75
Tungsten
<0.04 mg/L
N/A Basal synthetic medium
containing propionate
(Worm et al.
2009)
Iron
<0.3 mg/L
N/A Basal synthetic medium
containing propionate
(Worm et al.
2009)
Cobalt
Molybdenum
<19 mg/L 160-320 mg/L Growth medium with (Gikas 2007)
dextrose, peptone and yeast
extract as Carbon
0.2 mg/L N/A source Synthetic wastewater
(Kida et al. 2001)
<0.05 N/A Basal synthetic medium
mg/L containing propionate (Worm et al.
2009)

76
4.2 Material and methods
4.2.1 Feeding and seed sludge
In the startup phase, the reactors were inoculated with anaerobic seed sludge from Humber
treatment plant (ON, Canada) for almost 4 days for degassing process until the Biogas production
from each reactor reaches a stationary phase therefore it won’t influence the Biogas production
from the substrate fed to the system. Four different experiments were done on different
concentrations of nutrients, both synthetic wastewater and real raw anaerobic sludge collected
from the Humber treatment plant were utilized as feeding substrate, all the reactors were run in
batch mode, therefore they were fed once at the beginning of the experiment and sparked with
nitrogen gas and sealed with caps for providing the anaerobic condition, the nutrient solutions were
mixed with the substrate prior to feeding process. Table 4-4, Table 4-5 and Table 4-6 indicate the
biomass, real and synthetic feed respectively.
Table 4-4 Mesophilic biomass properties
Mesophilic biomass
TS (mg/L) 4620
VS (mg/L) 2795
TCOD (mg/L) 3700
SCOD (mg/L) 2500
pH 7.07

77
Table 4-5 Real feed characterization
Feed
TS (mg/L) 6895
VS (mg/L) 5145
TSS (mg/L) 6025
VSS (mg/L) 5015
TCOD (mg/L) 9000
SCOD (mg/L) 5000
pH 6.3
Alkalinity (mg CaCO3/L) 2452
Table 4-6 Synthetic feed compositions
Feed
Comp.
CH3COOH
(mL/LF)
NH4Cl
(g/LF)
K2HPO4
(g/LF)
MgSO
4·7H2
O
(g/LF)
CaCl2·2H2
O
(g/LF)
Yeast
(g/LF)
NaHCO3
(g/LF)
Con. 9.5-38 0.93 0.1 0.03 0.03 0.03 6.2-24.8
Feed
Comp.
Trace
element
(mL/LF)
Con. 1
Trace
element
FeCl2·4H2
O
MnCl2·4H2
O
H3BO3 ZnCl2 CuCl2 AlCl3 CoCl2·6
H2O
Con.
(mg/L)
2000 500 50 50 30 50 50
Trace
element
NiCl2
Con.
(mg/L)
50
4.2.2 BioStreme characteristics
Supplying different macro and micronutrients is essential to many AD processes since it has been
determined that limitation in nutrients cause poor process performance, addition of different
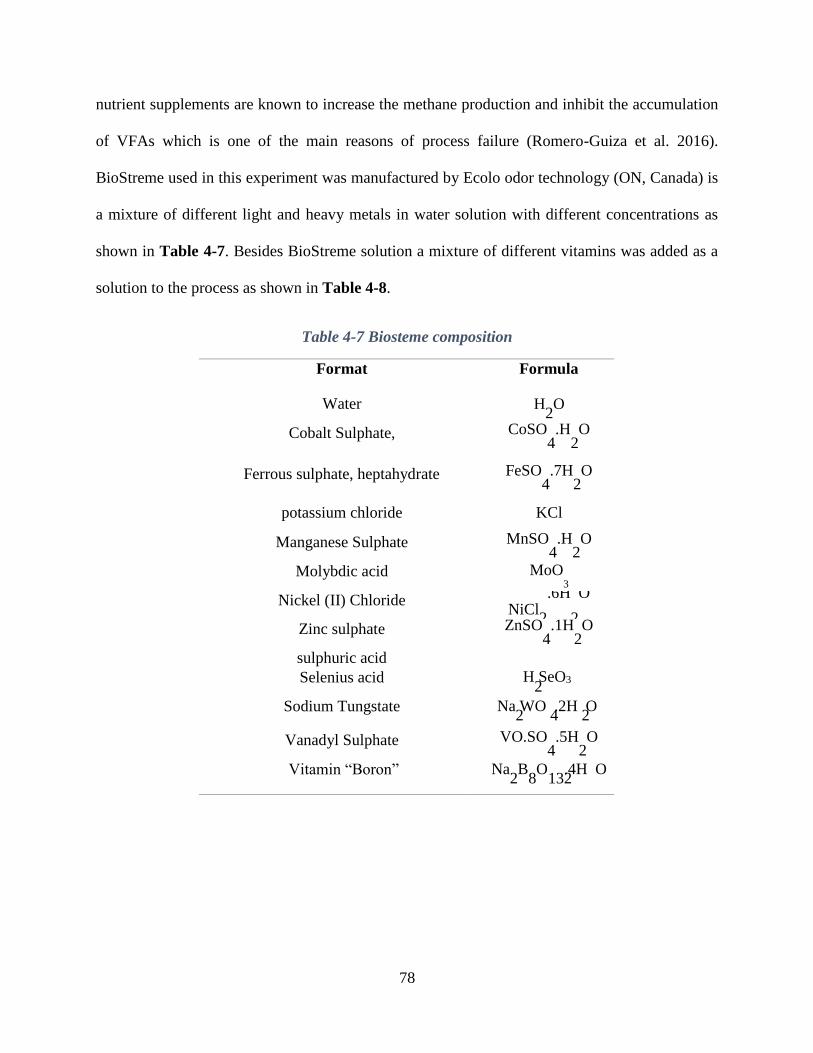
78
nutrient supplements are known to increase the methane production and inhibit the accumulation
of VFAs which is one of the main reasons of process failure (Romero-Guiza et al. 2016).
BioStreme used in this experiment was manufactured by Ecolo odor technology (ON, Canada) is
a mixture of different light and heavy metals in water solution with different concentrations as
shown in Table 4-7. Besides BioStreme solution a mixture of different vitamins was added as a
solution to the process as shown in Table 4-8.
Table 4-7 Biosteme composition
Format Formula
Water
H O 2
Cobalt Sulphate, CoSO .H O 4 2
Ferrous sulphate, heptahydrate FeSO .7H O 4 2
potassium chloride KCl
Manganese Sulphate MnSO .H O 4 2
Molybdic acid MoO 3
Nickel (II) Chloride .6H O
NiCl2 2
Zinc sulphate ZnSO .1H O 4 2
sulphuric acid
Selenius acid H SeO3 2
Sodium Tungstate Na WO .2H O 2 4 2
Vanadyl Sulphate VO.SO .5H O 4 2
Vitamin “Boron” Na B O .4H O 2 8 132

79
Table 4-8 Vitamin solution composition
component vitamin note
Niacin amide B3 Water-like solution
Pantothenic B5 Water-like solution
D-biotin B7 Water-like solution
Folic acid Group of B Bright yellow solution
Palmitate Group of A Milky solution
Ascorbic acid C Water-like solution
4.2.3 AD experimental setup and operation
4 series of experiment were conducted using different concentrations of BioStreme and vitamin
solution in different time periods, all 4 series of experiment were operated in mesophilic (37°C)
condition as shown in the schematic in Figure 4-1, the incubation system was connected to motor
controller for determination of agitators. For Biogas production measurement, the system is
connected to automatic methane potential test (AMPTs), which contains CO2-fixing unit which
are vails containing alkaline solution that retains other gases except CH4 that allows to pass through
to gas volume measuring device, that digital pulses are produced by certain amount of gas flow
which goes through the device and at last control and analysis unit displays the results (Bioprocess
Control Sweden, 2016).

80
connections Gas volume measuring
device
Measuring device
Carbon dioxide fixing
unit
Control and analysis unit
Incubation unit
Figure 4-1 Experimental setup configuration Computer
4 series of experiment BioStreme and vitamin solution concentrations are categorized in Table
4-9:
control
Biostreme conc. 1
Biostreme conc. 2
Biostreme conc. 3
Biostreme conc. 4
Motor controlling
system

81
Table 4-9 BioStreme and vitamin solution concentrations in experiments
experiment BioStreme conc. Vitamin conc.
2 20 ppm -
50 ppm
100 ppm
4 100 ppm
200 ppm
300 ppm
100ppm of BioStreme + 100
ppm of vitamin
200ppm of BioStreme + 100
ppm of vitamin
300ppm of BioStreme + 200
ppm of vitamin
4.2.4 Analysis
Anaerobic batch reactors were used to conduct methane production potential and rate by using
biofilm as an effective pathway for microorganism growth. The amount of substrate and the
biomass is measured by considering food to microorganism ratio. samples from reactors were
collected and diluted and filtered through 0.45 µm, analysis was achieved using standard methods
for wastewater examination, total COD and soluble COD, solids (TS, VS, TSS and VSS) and
alkalinity in influent and effluent were measured per the standards, pH was measured using pH-
3 100 ppm 100ppm of BioStreme + 50
ppm of vitamin
200 ppm 200ppm of BioStreme + 50
ppm of vitamin
1 10 ppm -
20ppm
50ppm

82
meter. The VFA concentration in final samples were measured using gas chromatography (GC)
device. Produced Biogas was measured by the bioprocess control system which automatically
analyzed methane production of each reactor using the automatic methane potential test system.
The measuring data were downloaded on daily basis from the device.
4.2.5 Kinetic modeling
Mathematical modeling of microbial growth has been conducted to measure various parameters,
such as the specific growth rate and lag time to investigate microbial growth under different
physical and chemical conditions. There are many sigmoidal models available. In this study
Gompertz model has been used for modeling which could be applied to microbial growth. The
logistic models consider the rate of gas production to be equivalent to microbial activity, as
represented by the amount of gas already produced, and to the feeding concentration. The
Gompertz model assumption is that the rate of gas production is corresponding to the microbial
activity, but the proportionality parameter decreases with time, following first-order kinetics,
which can be attributed to the decrease in efficiency of the fermentation rate with time (Altaş
2009). In this study, first cumulative methane production of each case was determined by time,
then the Gompertz model was applied to measure the methane production potential (A), maximum
rate of methane production (µm), and the duration of the lag phase (ƛ).
Y(t) = A*Exp[-Exp(µ*e/A(ƛ-t) +1)] (Equation 4-1)
4.3 Results and discussion
4.3.1 Operational conditions and AD performance
Micronutrient supplements were added to the substrate in order to increase the process
performance and meet the basic nutrient requirements for AD process, the amount of nutrients
added was increased by experiment, to analyze the selected micronutrients such as Fe, Ni and Mo

83
which are known to be beneficial to AD process, the concentration increased in order to influence
the Methane production, mostly anaerobic sludge contains sufficient amount of nitrogen and
phosphorus, however micronutrients such as iron, nickel and cobalt may not be existent in a form
available for utilization even though the total concentrations may appear sufficient (Zitomer et al.
2008).
Table 4-10 is the experimental results showing the removal efficiency for COD and VSS and at
each experiment with different levels of micronutrients added in the substrate prior to feeding, the
resulting experimental durations were from 10 to 45 days for different nutrient concentration
levels, since different concentrations, had different timing in affecting the anaerobic reactor
performance, the startup time for almost all systems were between 1 to 3 days before starting to
produce Biogas.
4.3.2 BioStreme Dosage effect
Several BioStreme dosage were tested, with and without the presence of vitamin, all experiments
were carried out with the same inoculum and substrate (real and synthetic waste stream) from the
same origin but taken at different times, which can have crucial effect on the results of the
experiment. In the first experiment, 3 concentrations of 10, 20 and 50 ppm of BioStreme were
mixed with synthetic wastewater prior to feeding and were experimented in triplicates with a
control system and a control containing trace-elements for comparison means. Increase in
concentration of BioStreme increased the COD removal and VSS removal efficiency, the control
system resulted in 62% and 39% of COD and VSS removal while reactors containing 50ppm of
BioStreme solution had 90% and 72% of COD and VSS removal respectively, the time duration
was only 10 day since after this time the Biogas production reached its stationary phase and no
activity was observed in reactors, In the second experiment 3 concentrations of 20, 50 and 100
84
ppm of BioStreme were studied mixed with synthetic wastewater as well containing to control
systems, with and without trace element, in this experiment the average COD removal was lower
than the first experiment, which is caused by the reasons mentioned or it may be caused by personal
and laboratory errors and differences between two time periods, despite of the differences,
increasing the concentration of supplement addition to 100 ppm did not highly effect the COD
removal while the COD removal of the reactors containing 20, 50 and 100 ppm of BioStreme were
68, 67 and 66%, however they were all higher compared to the control with only 54% of COD
removal efficiency. In the third experimental study, other than BioStreme, vitamin solution was
also added to reactors, except for control system, two groups of reactors were spiked with 100 and
200 ppm of BioStreme and 2 other groups were injected with 100ppm and 200ppm of BioStreme
with 50ppm of vitamin mixed in substrate, in this study real raw anaerobic wastewater was used
as feedstock. The results showed a low difference in COD removal comparing to the conventional
system, however the VSS removal was as high as 66% in both reactors with 200ppm of BioStreme
with and without vitamin, while the control system had 49% of VSS removal. Mixture of vitamin
and BioStreme in this experiment didn’t specifically showed the effect of vitamin on AD process
performance, therefore in the fourth experiment other than BioStreme and mixture of BioStreme
and vitamin, vitamin concentration was also studied solely, in this experiment real wastewater was
fed as substrate, the results for COD and VSS removal had fairly low difference however the
results show that high concentration of BioStreme between 100 and 300ppm increases the removal
efficiencies, however there is not a linear relation between increasing the concentration over 100
and higher removal efficiencies, vitamin addition had positive results on COD removal but it
showed poor results in VSS removal comparing to the conventional process.
Table 4-10 Removal efficiency of different micronutrient concentration addition

85
experiments Time
duration
(day)
BioStreme
concentration
added (ppm)
Vitamin
concentration
added (ppm)
COD
removal
efficiency
VSS removal
efficiency
1 10 10 20
50
88% 90%
90%
68% 66%
72% -
2 28 20
50
100
68%
67%
66%
74%
69%
71% -
3 45 100 200
100
200
91% 88%
83%
86%
61% 62%
66%
66%
50
50
4 25 100 200
300 -
-
100
300
- -
-
100
200
100
200
92% 90%
91% 90%
92%
89%
91%
45% 52%
48% 37%
39%
37%
47%
4.3.3 Process stability
Process stability is defined by VFA, VFA to alkalinity ratio and pH, using two different substrate
sources for series of experiment shows differences in these parameters, however adding nutrient
supplement in different concentration to both synthetic and real waste streams didn’t result in
process failure because of inhibition caused by excessive metal ion concentration in BioStreme,
with a value of less than 0.5 for VFA to alkalinity ratio for all reactors in series of experiment
shown if Figure 4-2 which indicated there has been no process inhibition or acidification, and also
the pH value range of 7.3 to 7.9 shown in Table 4-11 during operation shows that there has been
a stable process, on the other hand in the first two experiment using synthetic wastewater, all
reactors were stable but the reactors containing nutrient supplement produced Biogas for a longer
period of time compared to the control system.

86
Figure 4-2 VFA/ALK for different nutrient concentration
Table 4-11 VFA/ALK, pH and VFA conc. for different supplement concentrations
experiments Time
duration
(day)
BioStreme
concentration
added (ppm)
Vitamin
concentration
added (ppm)
VFA Conc. g/l pH value VFA/Alk.
1 10 -
10
20
50
2.03
1.99
2.24
2.60
7.53
7.50
7.52
7.53
0.25
0.28
0.33
0.4
-
2 28 -
20
50
100
2.42 2.51
2.67
2.22
7.66 7.70
7.70
7.72
0.34 0.32
0.33
0.3
-
3 45 -
100
200
100
200
2.77 2.69 2.71
2.85
2.67
7.35 7.39 7.39
7.36
7.34
0.41 0.40 0.42
0.43
0.39
50
50
4 25 -
100
200
300 -
-
100
300
- -
-
-
100
200
100
200
2.84 2.71
3.33
2.56 3.00 2.91
2.73
2.86
7.37 7.47
7.41
7.39 7.44 7.45
7.41
7.42
0.33 0.39
0.45
0.34 0.41 0.39
0.36
0.38
VFA/ALK for different samples
bio300+ vit 200 bio 100+ vit 100 vit 200ppm vit 100ppm 200ppm+50ppm vit 100ppm+50ppm vit bio 300ppm 200ppm bio 100ppm 50ppm 20ppm 10ppm
0 0.1 0.2 0.3 0.4 0.5 0.6 0.7
fin
al V
FA/A
LK

87
4.3.4 Methane production
BioStreme addition was tested in order to evaluate the potential effect of micronutrients on
removal efficiencies and its contribution to the total methane produced, Error! Reference source
not found. show the cumulative methane production for batch tests. In regards to the application
of micronutrient addition to AD process, for synthetic feedstock methane production increased
with all BioStreme concentration addition compared to control system, however utilizing real
wastewater resulted in diverse effect of nutrient on methane production, addition of BioStreme
solely in concentrations higher than 100 ppm, resulted in higher methane production, while vitamin
addition didn’t follow any specific trend as shown in the Error! Reference source not found.,
there are dosages of solutions that adversely affected methane production, mixture of 200 ppm of
BioStreme and 50 ppm of vitamin resulted in the highest methane production compared to other
mixtures used, the figures show that addition of metals didn’t negatively affect the lag time of
methane production.

88
4.3.5 Effect of BioStreme and vitamin solution on methanogenic activity
The cumulative methane production of different concentrations of BioStreme and vitamin has been
conducted in Error! Reference source not found., the cumulative methane production values are
available in Table 4-12, showing the difference in methane production content and lag times of
different experiments, also as shown certain nutrient dosages boosted the methane production, for
understanding the effect of nutrient supplement on methanogenic activity, the experimental data
were fitted to Gompertz model equation (4-2) using non-linear regression in excel.
Y(t) = A*Exp[-Exp(µ*e/A(ƛ-t) +1)] (4-2)
Table 4-12 Gompertz modeling results for nutrient concentrations
cumulative
Methane
production
A(Nml) µ (d-1) ƛ (day) ƛ(hr.)
Exp.
1 control 137 126.9 123.5 0.12 2.88
10s 141.3 131.77 113.03 0 0
20s 140.4 134.8 118.14 0.1 2.4
50s 154.3 132.76 110.99 0.09 2.16
2 control 159.6 141.4 139.7 0.12 2.88
20s 189.6 167.4 121.6 0.02 0.48
50s 187.7 171.4 121.3 0.01 0.24
100s 192.5 175.4 75.8 0 0
3 control 1651.9 1743.78 89.22 4.46 107.04
100s 1799.6 1832.18 104.31 4.4 108
200s 1736.5 1854.51 62.7 2.66 63.84
100+50 1579.9 1608.9 78.4 2.93 70.32
200+50 1826.8 1838.06 94.91 4.32 103.68
4 control 1476.6 1404.8 164.9 4.54 108.96
100ppm 1390.8 1440.59 145.75 3.95 94.8
200ppm 1408.3 1450.57 152.23 3.54 84.96
300ppm 1468.1 1473.94 153.58 3.6 86.4
100vit 1350.8 1443.5 104.74 4.43 106.32
200vit 1503 1695.1 110.62 2.74 65.76
100ppm+100ppm 1511 1565.9 150.9 4.5 108
300ppm+200ppm 1382.8 1421.5 157.03 4.2 100.8

89
Since the experiments had different time durations, the parameters and cumulative methane
productions are different, for the first experiment the values of methane production potential (A,
mL), maximum specific methane production rate (µ, 1/day), and lag-phase duration (ƛ, h) were
showing that:
In each experiment addition of BioStreme and vitamins to the system, increased the
methane production potential compared to the conventional system.
Addition of supplements positively affected the process lag time by decreasing the time
needed for starting the methane production.
Increasing the dosage of the BioStreme and addition of vitamin didn’t necessarily boost
the potential in methane production.
The results show that in the first two experiment using synthetic feed, different concentrations
of BioStreme, increased the Biogas production potential and decreased the lag phase period,
however in the 3rd and 4th experiment using real waste as feedstock and mixture of BioStreme
and vitamin showed few fluctuations, but overall it resulted in higher Biogas production
potential and lower lag phases, 100ppm BioStreme with 50 ppm vitamin mixture had lower
Biogas production potential compared to control system, which may be because of clogging
occurred in Biogas measurement tubes during the experiment.
4.4 Conclusion
The results show that micronutrient addition to AD process, enabled stable operation and relatively
higher methane production, the addition of selected nutrients to synthetic wastewater as a batch
process, increased the process performance, however it seems like real wastewater already
contained the required nutrients, however continuous addition of nutrient to the process rather than
a batch process may increase the process performance and methane yield in a more obvious way.
90
Chapter 5 Enhancement of dark fermentation process using
micronutrient supplement addition (BioStreme and Vitamin
solution)
5.1 Introduction
Nowadays, the world energy needs are provided highly by fossil fuels which will eventually result
in fossil fuel deficiency, other than that utilization of this energy source, highly increases the
emission by COx, NOx, SOx, ashes, tars and other organic compounds (Das 2001), In order to
overcome the problems caused by overexploitation of fossil fuels, new energy sources have been
developed, hydrogen as one of the cleanest with high energy conversion has attracted a lot of
attention, there are different methods available for hydrogen production from chemical to physical
and biological methods, biological methods have more of an interest since they are
environmentally friendly with less need of energy requirement, (LIN 2008). hydrogen is the most
abundant element available and the lightest element, it is a safe energy source to people and
environment, today because of sharp increase in population and higher energy demands, utilizing
hydrogen as an alternative energy source is a satisfying option (Das 2001), however the main
problem right now is that most of the hydrogen utilized it produced from fossil fuels, production
of hydrogen from biological methods are exiting ways to develop the potential of hydrogen
production, there are different biological methods such as bio-photolysis, indirect bio-photolysis,
photo-fermentations, and dark-fermentation (Levin et al. 2004). dark fermentation as one of the
methods have high potential both to decrease the waste disposal problems and to produce high
potential energy sources from waste, this process is a biological process that transforms organic
substrates to Biogas containing mostly hydrogen and carbon dioxide by strictly anaerobic bacteria
and also facultative anaerobes in absence of Oxygen (Lyberatos 2010) in different temperature

91
ranges, from mesophilic condition to hyper-thermophilic temperatures (Levin et al. 2004), There
are different pathways for hydrogen production in dark fermentation process, in one pathway
acetic acid is the end product, in which four moles of H2 is produced per 1 mole of glucose used,
but in another pathway butyrate is the end product which 2 moles of hydrogen is produced per 1
mole of glucose used (Levin et al. 2004). Different substrate sources can be used for this process
however, carbohydrate, cellulose and starch based feedstock are most preferred (Lyberatos 2010).
with all the advantages that this process offers, dark fermentation produces a mixture of mostly
H2, CO2 but also contains CH4, CO and H2S in less amounts, the main challenge is the gas
composition (Levin et al. 2004), also dark fermentation can be used to produce hydrogen and treat
different waste streams, seed sludge that can be derived from different sources such as sewage
sludge, anaerobically digested sludge, acclimated sludge, compost, animal manure and soil
(Lyberatos 2010) has a wide variety of microorganism community present which may be beneficial
for easier adaption to environmental changes and shocks, and also to increase the substrate
degradation but on the other hand, waste streams contain both H2-consuming and H2- producing
bacteria at the same time, therefore different enhancement methods such as pretreatment from
physicochemical to biological can be used to eliminate the H2- consuming organisms (Meng et al.
2014).
There has been studies on different factors to understand the limiting factors in dark fermentation
process, some studies have focused on activity of hydrogen producing enzymes however there
hasn’t been any absolute evidence for this matter, metal ions are known to be effective on cell
growth operating as enzyme factors, the most important metals that effect the dark fermentation
process are Mg, Na, Zn and Fe in which magnesium had the highest influence by activating over
10 enzymes such as hexokinase, phosphofructokinase and phosphoglycerate kinase (Chong et al.

92
2009), also there has been study on effect of Iron in different concentrations on hydrogen
production in dark fermentation process which resulted in higher H2 production (Zhang et al. 2005)
also in another study it was found that in lower than ambient temperature more concentrations of
Iron is needed in order to activate the Hydrogenase by bacteria for oxidation of reduced ferredoxin
to produce molecular hydrogen (Zhang & Shen 2006).
In this study, the effect of BioStreme as a nutrient supplement which is a mixture of different heavy
and light metals in water solution, and also vitamin solution in different concentrations was
investigated on hydrogen production in dark fermentation process.
5.2 Materials and methods
5.2.1 Seed sludge and substrate
anaerobically seed sludge from Humber treatment plant, ON, Canada was used as the seed, the
sludge was preheated to 70°C for 30 minutes prior to use, the Error! Reference source not found.
shows the characteristics of seed sludge, 15 reactors were experimented in parallel, the systems
were seeded with 500 ml of sludge and started up in a batch mode with the feed containing glucose
with the composition: glucose 32 g/l, NaHCO3 2-16 g/l, CaCl2 140 mg/L, MgCl2.6H2O 160 mg/L,
NH4HCO3 600 mg/L, MgSO4.7H2O 160 mg/L, Urea 500-2000 mg/L, Na2CO3 124-300 mg/L,
KHCO3 156 mg/L, K2HPO4 15-20 mg/L, H3PO4 250-1500 mg/L and trace solution 500 mg/L,
therefore they were fed once at the beginning of the experiment and sparked with nitrogen gas and
sealed with caps for providing the anaerobic condition, the nutrient solutions were mixed with the
substrate prior to feeding process

93
Table 5-1 Biomass characterization
Mesophilic biomass
TS (mg/L) 6867
VS (mg/L) 1955
TCOD (mg/L) 4550
SCOD (mg/L) 2500
pH 5.5
5.2.2 BioStreme Concentration
Supplying different macro and micronutrients is essential to many AD processes since it has been
determined that limitation in nutrients cause poor process performance, addition of different
nutrient supplements are known to increase the methane production and inhibit the accumulation
of VFAs which is one of the main reasons of process failure (Romero-Guiza et al. 2016).
BioStreme used in this experiment manufactured by Ecolo odor technology, ON, Canada, is a
mixture of different light and heavy metals in water solution with different concentrations as
shown in Error! Reference source not found.. Besides BioStreme solution a mixture of different
vitamins was added as a solution to the process shown in Table .
Table 5-2 BioStreme composition
Format Formula
Water
H O 2
Cobalt Sulphate, CoSO .H O 4 2
Ferrous sulphate, heptahydrate FeSO .7H O 4 2
potassium chloride KCl
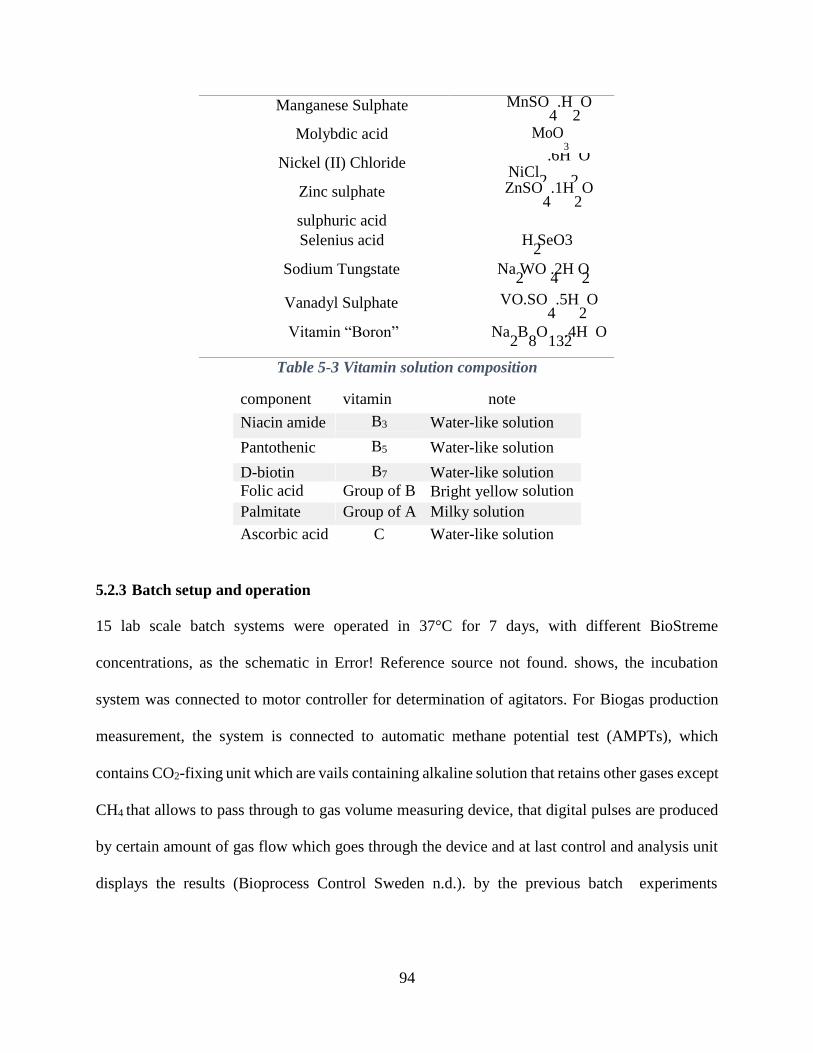
94
Manganese Sulphate MnSO .H O 4 2
Molybdic acid MoO 3
Nickel (II) Chloride .6H O
NiCl2 2
Zinc sulphate ZnSO .1H O 4 2
sulphuric acid
Selenius acid H SeO3 2
Sodium Tungstate Na WO .2H O 2 4 2
Vanadyl Sulphate VO.SO .5H O 4 2
Vitamin “Boron” Na B O .4H O 2 8 132
Table 5-3 Vitamin solution composition
component vitamin note
Niacin amide B3 Water-like solution
Pantothenic B5 Water-like solution
D-biotin B7 Water-like solution
Folic acid Group of B Bright yellow solution
Palmitate Group of A Milky solution
Ascorbic acid C Water-like solution
5.2.3 Batch setup and operation
15 lab scale batch systems were operated in 37°C for 7 days, with different BioStreme
concentrations, as the schematic in Error! Reference source not found. shows, the incubation
system was connected to motor controller for determination of agitators. For Biogas production
measurement, the system is connected to automatic methane potential test (AMPTs), which
contains CO2-fixing unit which are vails containing alkaline solution that retains other gases except
CH4 that allows to pass through to gas volume measuring device, that digital pulses are produced
by certain amount of gas flow which goes through the device and at last control and analysis unit
displays the results (Bioprocess Control Sweden n.d.). by the previous batch experiments

95
connections Gas volume measuring
device
Measuring device
Carbon dioxide fixing
unit
Control and analysis unit
)
conducted, volume of substrate and seed were calculated based on a substrate to biomass (S°/X°)
ratio of 1.2 gCOD/gVSS using the equation below (5-1) (Nasr et al. 2014):
S°/X° = Vsub(L)∗TCODeq(g/L)
( )∗ (
(Equation 5-1)
In which Vsub and Vseed represent the substrate and seed volume respectively, TCOD eq is the TCOD
equivalent for different ratios of missing volumes of waste-stream. The initial pH of all bottles was
adjusted to 5-5.5 using HCl.
Incubation unit
Computer
Figure 5-1 Experimental system configuration
control
Biostreme conc. 1
Biostreme conc. 2
Biostreme conc. 3
Biostreme conc. 4
Motor controlling
system

96
4 different concentrations of BioStreme and vitamin were used as shown in Error! Reference
source not found., with a control system for comparison means.
Table 5-4 Different concentrations of BioStreme and vitamin used in each experiment
Reactor groups BioStreme conc. (ppm) Vitamin conc. (ppm)
control - -
1 100 -
2 200 -
3 300 -
4 100 100
5.2.4 Analysis
The Biogas production composition including hydrogen, methane and CO2 was measured by
AMPTS device and the Hydrogen production was determined by a gas chromatograph SRI 8610C
equipped with a thermal conductivity detector (TCD) and a molecular sieve column, nitrogen was
used the carrier gas, the temperature for column and TCD was set 80°C. the concentration of VFAs
were also analyzed using a gas chromatograph with a flame ionization detector (FID) using a fused
silica column MXT-WAX, for this measurement helium is used as the carrier gas, the temperature
of the column and detector were set at 200°C, total COD and soluble COD, solids (TS, VS, TSS
and VSS) and alkalinity in influent and effluent were measured per the standards, pH was measured
using pH-meter.

97
5.3 Result and discussion
5.3.1 Process performance and operational conditions
Micronutrient supplements were added to the substrate in order to increase the process
performance and meet the basic nutrient requirements for dark fermentation process, the amount
of nutrients addition was increased, to analyze the selected micronutrients such as Fe, Ni and Mo
which are known to be beneficial to anaerobic process. The concentration increased in order to
influence the hydrogen production, mostly anaerobic sludge contains sufficient amount of
Nitrogen and phosphorus, however micronutrients such as Iron, Nickel and Cobalt may not be
existent in a form available for utilization even though the total concentrations may appear
sufficient (Zitomer et al. 2008).
Table 4-5 shows the results for COD and VSS removal efficiency in each BioStreme and vitamin
dosage which was mixed with the substrate prior to feeding, the experiment duration was 48-72
hours.
5.3.2 BioStreme dosage effect
Several BioStreme dosages were tested with or without the presence of vitamin, all experiments
were carried out using the same source of substrate and inoculum, in the experiment 3 different
concentrations of BioStreme 100, 200 and 300ppm and also a mixture of 100ppm of BioStreme
and 100ppm of vitamin were tested, all experiments run in triplicates with a control system for
comparison means. As shown, increase in the concentration of BioStreme and also adding vitamin
increased the COD and VSS removal of the system, however the COD removal for all reactors
were rather low without any known reasons, addition of nutrient supplement in any concentration
has positive effect on both COD and VSS removal compared to the conventional system.

98
Table 5-5 Removal efficiencies of different experiments
Reactor
type
BioStreme conc.
(ppm)
Vitamin conc. (ppm) COD removal VSS removal
control - - 14% 24%
1 100 - 39% 33%
2 200 - 46% 44%
3 300 - 40% 44%
4 100 100 55% 49%
5.3.3 process stability
Process stability is defined by VFA, VFA to alkalinity ratio and pH, , adding nutrient supplement
in different concentration to synthetic waste streams didn’t result in process failure because of
inhibition caused by excessive metal ion concentration in BioStreme, with a value of less than 1.8
for VFA to alkalinity ratio for all reactors in series of experiment shown in Error! Reference
source not found. which indicated there has been no process inhibition or acidification, and also
the pH value range of 4.5 to 5.5 shown in Error! Reference source not found. during operation
shows that there has been a stable process except for one of the control reactors that had a pH value
of 3 which resulted in process failure and VFA acclimation in the system, the data from this reactor
was eliminated from the study, VFA concentration ranges from 0.5 to 0.9 g/l for all reactors shown
in Error! Reference source not found. and Figure .

99
Table 5-6 VFA, pH and VFA/ALK ratio of each experiment
Reactor type BioStreme(ppm) Vitamin(ppm) VFA (mg/L) pH VFA/ALK
control - - 925.5 4.4 1.4
1 100 - 806.3 4.9 1.2
2 200 - 1016.6 5.0 1.2
3 300 - 1045 4.8 1.8
4 100 100 940 5.1 1.1
Figure 5-2 VFA concentration of each experiment
VFA concentration
VFA (mg/L)
0 200 400 600 800 1000 1200
biostreme 100+ vitamin 100 biostreme 300
biostreme 200 biostreme 100
control
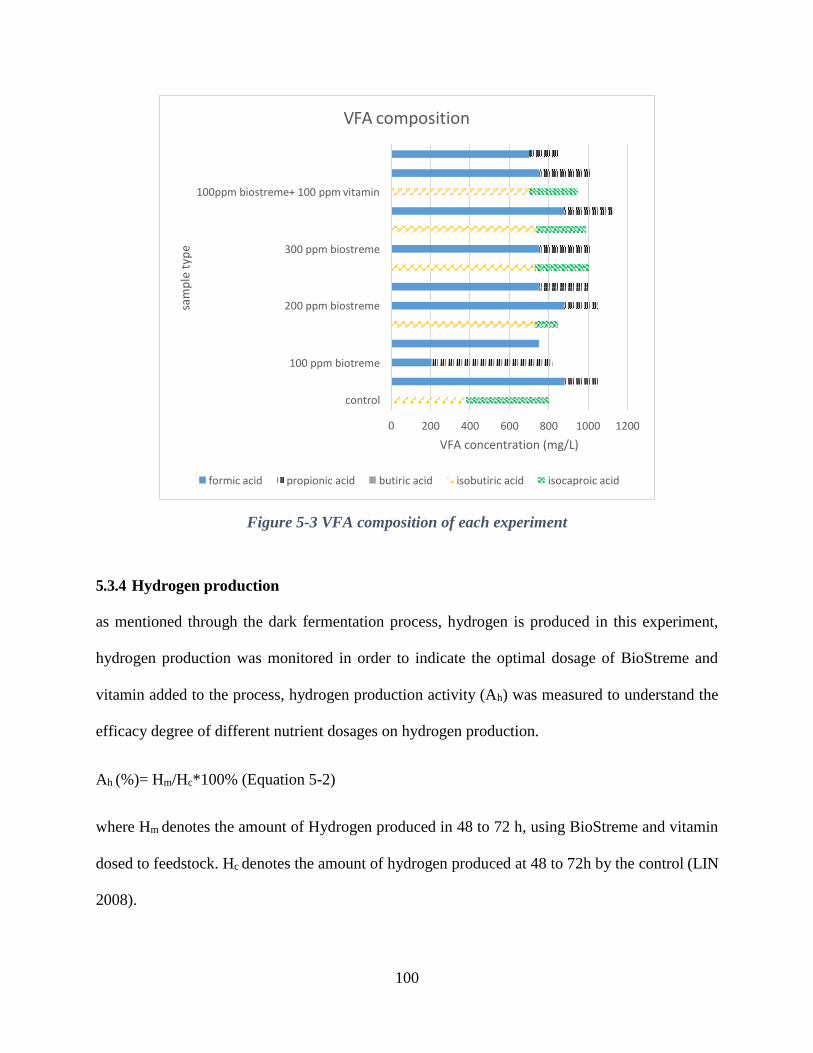
100
Figure 5-3 VFA composition of each experiment
5.3.4 Hydrogen production
as mentioned through the dark fermentation process, hydrogen is produced in this experiment,
hydrogen production was monitored in order to indicate the optimal dosage of BioStreme and
vitamin added to the process, hydrogen production activity (Ah) was measured to understand the
efficacy degree of different nutrient dosages on hydrogen production.
Ah (%)= Hm/Hc*100% (Equation 5-2)
where Hm denotes the amount of Hydrogen produced in 48 to 72 h, using BioStreme and vitamin
dosed to feedstock. Hc denotes the amount of hydrogen produced at 48 to 72h by the control (LIN
2008).
VFA composition
100ppm biostreme+ 100 ppm vitamin
300 ppm biostreme
200 ppm biostreme
100 ppm biotreme
control
0 200 400 600 800 1000 1200
VFA concentration (mg/L)
formic acid propionic acid butiric acid isobutiric acid isocaproic acid
sam
ple
typ
e
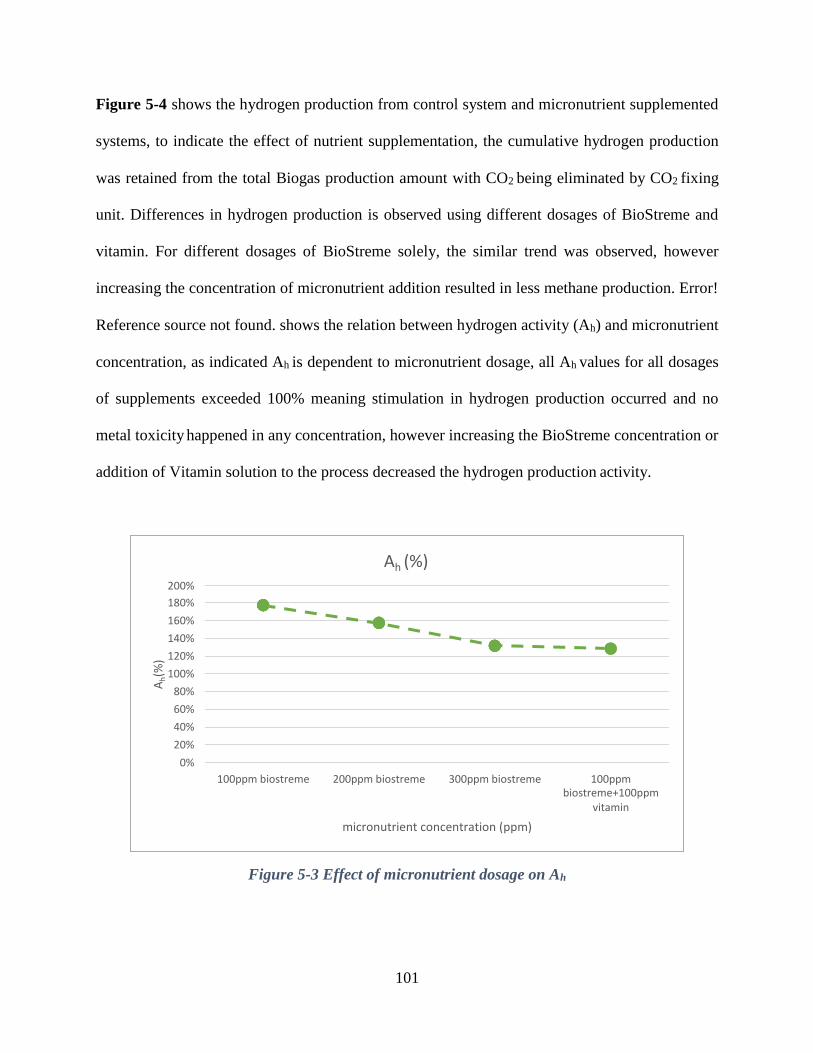
101
Figure 5-4 shows the hydrogen production from control system and micronutrient supplemented
systems, to indicate the effect of nutrient supplementation, the cumulative hydrogen production
was retained from the total Biogas production amount with CO2 being eliminated by CO2 fixing
unit. Differences in hydrogen production is observed using different dosages of BioStreme and
vitamin. For different dosages of BioStreme solely, the similar trend was observed, however
increasing the concentration of micronutrient addition resulted in less methane production. Error!
Reference source not found. shows the relation between hydrogen activity (Ah) and micronutrient
concentration, as indicated Ah is dependent to micronutrient dosage, all Ah values for all dosages
of supplements exceeded 100% meaning stimulation in hydrogen production occurred and no
metal toxicity happened in any concentration, however increasing the BioStreme concentration or
addition of Vitamin solution to the process decreased the hydrogen production activity.
Figure 5-3 Effect of micronutrient dosage on Ah
Ah (%) 200%
180%
160%
140%
120%
100%
80%
60%
40%
20%
0%
100ppm biostreme 200ppm biostreme 300ppm biostreme 100ppm biostreme+100ppm
vitamin
micronutrient concentration (ppm)
Ah(%
)

102
Figure 5-4 Cumulative Hydrogen production for each experiment
5.3.5 Kinetic analysis
The hydrogen production potential, maximum hydrogen production rate (HPR) and lag phase time
were elucidated using the modified Gompertz equation (5-3), that has been used to describe the
progress of cumulative hydrogen production obtained from a batch experiment
H(t)=P*exp (-exp((Rm*e/P) *(ƛ-t) +1)) (Equation 5-3)
where H(t) is the cumulative hydrogen production (mL), P is the hydrogen production potential
(mL), Rm is the maximum hydrogen production rate (mL/h), e is the 2.71828, ƛ is the lag-phase
time (h), t is the time (h). The cumulative hydrogen production of different concentrations of
BioStreme and vitamin has been conducted in Figure 5-4, the cumulative hydrogen production
values are available in Error! Reference source not found., showing the difference in hydrogen
production content and lag times of different dosages, as shown higher nutrient dosages boosted
Hydrogen production
200
180
160
140
120
100
80
60
40
20
0
0 24
time (hour)
48
control 100ppm 200ppm 300ppm 100ppm+100ppm
Hyd
roge
n p
rod
uct
ion
(N
ml)

103
the hydrogen production, for understanding the effect of nutrient supplement on methanogenic
activity, the experimental data were fitted to Gompertz model using non-linear regression in excel.
Table 5-7 Kinetic parameters for each experiment
cumulative
Hydrogen
production
P(Nml) Rm(Nml/h) Y(h)
control 109.9 109.5 60 6
BioStreme 100ppm 187.7 160.18 60 4
BioStreme 200ppm 166.6 161.91 60 4.4
BioStreme 300ppm 139.4 133.87 60 5
BioStreme 100ppm+
vitamin 100ppm
136 133.8 60 5
Since all dosages were experimented in the same time duration results can be compared with each
other, the hydrogen production potential was BioStreme 200ppm> BioStreme 100ppm>
BioStreme 300ppm> BioStreme 100ppm+ vitamin 100ppm> control which shows that increasing
the dosage higher than 300ppm and addition of vitamin to nutrient supplement decreases the
potential in hydrogen production, however all systems supplemented with BioStreme and vitamin
had higher hydrogen production and lower lag phase compared to the control system. At the end
of experiment, when the hydrogen production decreases, the hydrogen content of each process was
measured using gas chromatography and the results showed that all reactors containing BioStreme
had higher hydrogen content compared to control system, in addition the reactors supplied with
100 and 200ppm of BioStreme had twice hydrogen production than control system, however with
increasing the dosage and adding the vitamin the hydrogen percentage decreased.
104
5.4 Conclusion
The results show that addition of micronutrient to dark fermentation process, enabled higher
process efficiency and Biogas production with higher hydrogen content, the process was done as
a batch system with only one spike of micronutrient along with feeding, however continuous
feeding with micronutrient addition may result in higher process performance compared to batch
system.

105
Chapter 6 Conclusion and future work
This chapter summarizes the major findings of this thesis along with the direction of future
work
6.1 Conclusions
In this thesis, the aim was to evaluate enhancement methods for boosting AD process for higher
Biogas production and removal efficiency as well as higher stability in performance, two main
enhancement methods have been developed, the main findings are:
Attached media usage in AD process increased the Methane production and process
performance, four different BioCords were used, and all four groups resulted in higher
efficiency compared to the conventional system.
BioCord LS2 showed the highest results with 30% higher Methane production compared
to the control system and 10-15% higher than other BioCords.
BioCord LS2 had the highest COD and VSS removal of 88% and 61% respectively
comparing to other attached media groups as well as the control system.
Usage of BioCord as an improvement method is a rather easy and inexpensive way since
there is no need for change in reactor configuration.
Another method for improving AD is supplement addition, usually the process lacks in the
micronutrient concentration, however using the proper number of additives is critical since
inhibition may occur with excessive amount of added elements.
Addition of supplement named BioStreme and vitamin solution increased the COD and
VSS removal efficiency, moreover increasing the concentration of additives seems to boost
the process performance.

106
Increasing the concentration of BioStreme up to 300 ppm increased the cumulative
methane production, however addition of vitamin showed fluctuation in the results.
Addition of BioStreme to the process enhanced the kinetics of the process, it increased the
methane production potential and it decreased the lag time, the results were boosted by
increasing the dosage.
Since addition of BioStreme had beneficial effect on methane production form AD process
it has been tested to indicate whether it can boost the hydrogen production using the dark
fermentation process, with the same anaerobic bacteria groups.
Addition of BioStreme and vitamin solution increased the hydrogen production and the
process performance both in removal efficiency and the system stability.
Despite of an increase in process performance in AD process by addition of higher dosage
of supplement, increasing the concentration of BioStreme and vitamin to dark fermentation
process for hydrogen production decreased the process performance and hydrogen
production.
100 ppm of BioStreme seem to be the optimal range of BioStreme addition with twice as
much hydrogen content compared to the control system.
6.2 Direction of future work
Considering the positive effect of enhancement methods on batch AD and dark fermentation
process for methane and hydrogen production respectively, future works can be further
experimented for improving the processes, several facts can be pointed out:
Performing continuous AD process, to evaluate the process performance with BioStreme
added substrate.

107
Addition of BioStreme to substrate several hours prior to feeding to provide the time for
adaption and also for the bacteria to utilize the trace elements for boosting the hydrolysis
stage.

108
Bibliography
Abarca, L., Maas, G. & Hogland, W., 2013. Solid waste management challenges for cities in
developing countries. Waste Management, 33(1), pp.220–232. Available at:
http://dx.doi.org/10.1016/j.wasman.2012.09.008.
Acharya, B.K., Mohana, S. & Madamwar, D., 2008. Anaerobic treatment of distillery spent wash
- A study on upflow anaerobic fixed film bioreactor. Bioresource Technology, 99(11),
pp.4621–4626.
Adu-gyamfi, N., Rao, S. & Hobbs, P.J., 2012a. Bioresource Technology Optimizing anaerobic
digestion by selection of the immobilizing surface for enhanced methane production.
BIORESOURCE TECHNOLOGY, 120, pp.248–255. Available at:
http://dx.doi.org/10.1016/j.biortech.2012.06.042.
Adu-gyamfi, N., Rao, S. & Hobbs, P.J., 2012b. Bioresource Technology Optimizing anaerobic
digestion by selection of the immobilizing surface for enhanced methane production.
BIORESOURCE TECHNOLOGY, 120, pp.248–255.
Ahring, B.K. et al., 1991. Effects of cations on Methanosarcina thermophila TM-1 growing on
moderate concentrations of acetate: production of single cells. Applied Microbiology and
Biotechnology, 35(5), pp.686–689.
Akao, T. et al., 1992. The methane fermentation of Citrus unshu peel pretreated with fungus
enzymes. Bioresource Technology, 41(1), pp.35–39.
Altaş, L., 2009. Inhibitory effect of heavy metals on methane-producing anaerobic granular
sludge. Journal of Hazardous Materials, 162(2-3), pp.1551–1556.
Amani, T., Nosrati, M. & Sreekrishnan, T.R., 2010. Anaerobic digestion from the viewpoint of
microbiological, chemical, and operational aspects — a review. Environmental Reviews,
18(NA), pp.255–278.
Andersson, J. & Björnsson, L., 2002. Evaluation of straw as a biofilm carrier in the
methanogenic stage of two-stage anaerobic digestion of crop residues. Bioresource
Technology, 85(1), pp.51–56.
Angelidaki, I., Petersen, S.P. & Ahring, B.K., 1990. Effects of lipids on thermophilic anaerobic
digestion and reduction of lipid inhibition upon addition of bentonite. Applied Microbiology
and Biotechnology, 33(4), pp.469–472.
Anon, 1995_-_M_Kayhanian_-_Pilotscalehighsolidsthermophilicanaerobicdigestion[retrieved-
2017-05-29].pdf.
Anon, Attached film media performance in psychrophilic anaerob[retrieved-2016-11-09].pdf.
Anon, Ruiz Treatment of slaughterhouse wastewater in a UASB reactor.pdf.

109
Appels, L. et al., 2011. Anaerobic digestion in global bio-energy production: Potential and
research challenges. Renewable and Sustainable Energy Reviews, 15(9), pp.4295–4301.
Available at: http://linkinghub.elsevier.com/retrieve/pii/S1364032111003686.
Appels, L. et al., 2008. Principles and potential of the anaerobic digestion of waste-activated
sludge. Progress in Energy and Combustion Science, 34(6), pp.755–781.
Azizi, S. & Sithebe, N.P., 2015. Use of Electro-Chemical Process for Waste Sludge Generated
from Moving Bed Bioreactor. International Journal of Environmental Science and
Development, 6(8), pp.585–589. Available at:
http://www.ijesd.org/index.php?m=content&c=index&a=show&catid=68&id=1017.
Barca, C. et al., 2015. Anaerobic biofilm reactors for dark fermentative hydrogen production
from wastewater: a review. Bioresource Technology, 185, pp.386–398. Available at:
http://linkinghub.elsevier.com/retrieve/pii/S0960852415002424.
Biofilms, A.A., 1995. ( A )? =. , 45(c), pp.212–218.
Bioprocess Control Sweden, AMPTS II & AMPTS II Light Automatic Methane Potential Test
System Operation and Maintenance Manual.
Biotech, E., No Title,
Bories, A., Raynal, J. & Bazile, F., 1988. Anaerobic digestion of high-strength distillery
wastewater (cane molasses stillage) in a fixed-film reactor. Biological Wastes, 23(4),
pp.251–267.
Borja, R. & Banks, C.J., 1995. Comparison of an Anaerobic Filter and an Anaerobic Fluidized
Bed Reactor Treating Palm Oil Mill Effluent. Process Biochemistry, 30(6), pp.511–521.
Borja, R. & Banks, C.J., 1995. Response of an anaerobic fluidized bed reactor treating ice-cream
wastewater to organic, hydraulic, temperature and pH shocks. Journal of Biotechnology,
39(3), pp.251–259.
Bouallagui, H. et al., 2005. Bioreactor performance in anaerobic digestion of fruit and vegetable
wastes. Process Biochemistry, 40(3-4), pp.989–995.
Bougrier, C., Delgenès, J.P. & Carrère, H., 2008. Effects of thermal treatments on five different
waste activated sludge samples solubilisation, physical properties and anaerobic digestion.
Chemical Engineering Journal, 139(2), pp.236–244.
Bougrier, C., Delgenès, J.P. & Carrère, H., 2007. Impacts of thermal pre-treatments on the semi-
continuous anaerobic digestion of waste activated sludge. Biochemical Engineering
Journal, 34(1), pp.20–27.
Bryers, J.D., 1982. Processes Governing. , XXIV, pp.2451–2476.

110
Buekens, A., 2005. Energy recovery from residual waste by means of anaerobic digestion
technologies. The future of residual waste management in Europe 2005, pp.1–15.
Buffiere, P., Moletta, R. & Elmaleh, S., 1998. ANAEROBIC DIGESTION OF WINE
DISTILLERY WASTEWATER IN DOWN-FLOW FLUIDIZED BED. , 32(12), pp.3593–
3600.
Chai, S. et al., 2014. Anaerobic treatment of winery wastewater in moving bed biofilm reactors.
Desalination and Water Treatment, 52(10-12), pp.1841–1849.
Chen, W., 2006. Biological hydrogen production by anaerobic fermentation by.
Chen, Y., Cheng, J.J. & Creamer, K.S., 2008. Inhibition of anaerobic digestion process: A
review. Bioresource Technology, 99(10), pp.4044–4064. Available at:
http://linkinghub.elsevier.com/retrieve/pii/S0960852407001563.
Chen, Y., Cheng, J.J. & Creamer, K.S., 2008. Inhibition of anaerobic digestion process: a review.
Bioresource technology, 99(10), pp.4044–64. Available at:
http://www.sciencedirect.com/science/article/pii/S0960852407001563 [Accessed July 9,
2014].
Chong, M. et al., 2009. Biohydrogen production from biomass and industrial wastes by dark
fermentation. International Journal of Hydrogen Energy, 34(8), pp.3277–3287.
Clara, M. et al., 2005. The solids retention time - A suitable design parameter to evaluate the
capacity of wastewater treatment plants to remove micropollutants. Water Research, 39(1),
pp.97–106.
Dar, H., 1987. Response of a Cattle Dung Methane Fermentation to. Control, 22, pp.261–268.
Das, D., 2001. Hydrogen production by biological processes: a survey of literature. International
Journal of Hydrogen Energy, 26(1), pp.13–28.
Demirbas, A., 2011. Waste management , waste resource facilities and waste conversion
processes. Energy Conversion and Management, 52(2), pp.1280–1287. Available at:
http://dx.doi.org/10.1016/j.enconman.2010.09.025.
Demirel, B. & Scherer, P., 2011. Trace element requirements of agricultural biogas digesters
during biological conversion of renewable biomass to methane. Biomass and Bioenergy,
35(3), pp.992–998.
Donoso-Bravo, A. & Fdz-Polanco, M., 2013. Anaerobic co-digestion of sewage sludge and
grease trap: Assessment of enzyme addition. Process Biochemistry, 48(5-6), pp.936–940.
Elbeshbishy, E. & Nakhla, G., 2012. Batch anaerobic co-digestion of proteins and carbohydrates.
Bioresource Technology, 116, pp.170–178. Available at:

111
http://linkinghub.elsevier.com/retrieve/pii/S0960852412006578.
Escudié, R. et al., 2011. Control of start-up and operation of anaerobic biofilm reactors: An
overview of 15 years of research. Water Research, 45(1), pp.1–10.
Fermoso, F.G. et al., 2009. Metal supplementation to UASB bioreactors: from cell-metal
interactions to full-scale application. Science of the Total Environment, 407(12), pp.3652–
3667.
Fernández, N. et al., 2007. Real evidence about zeolite as microorganisms immobilizer in
anaerobic fluidized bed reactors. Process Biochemistry, 42(4), pp.721–728. Available at:
http://www.sciencedirect.com/science/article/pii/S135951130600451X.
Fernandez, N. & Forster, C.F., 1993. A study of the operation of mesophilic and thermophilic
anaerobic filters treating a synthetic coffee waste. Bioresource Technology, 45(3), pp.223–
227.
Gavala, H. & Kopsinis, H., 1999. Treatment of dairy wastewater using an upflow anaerobic
sludge blanket reactor. Journal of agricultural …, 73, pp.59–63. Available at:
http://www.sciencedirect.com/science/article/pii/S0021863498903912.
Gianfreda, L. & Rao, M.A., 2004. Potential of extra cellular enzymes in remediation of polluted
soils: A review. Enzyme and Microbial Technology, 35(4), pp.339–354.
Gikas, P., 2007. Kinetic responses of activated sludge to individual and joint nickel (Ni(II)) and
cobalt (Co(II)): An isobolographic approach. Journal of Hazardous Materials, 143(1-2),
pp.246–256.
Gong, W.J. et al., 2011. Selection and evaluation of biofilm carrier in anaerobic digestion
treatment of cattle manure. Energy, 36(5), pp.3572–3578. Available at:
http://dx.doi.org/10.1016/j.energy.2011.03.068.
Habouzit, F. et al., 2011. Influence of support material properties on the potential selection of
Archaea during initial adhesion of a methanogenic consortium. Bioresource Technology,
102(5), pp.4054–4060.
Han, Y. & Dague, R., 1997. Laboratory Studies on the Temperature-Phased Anaerobic Digestion
of Domestic Wastewater Sludge. Wat. Env. Res., 69(6), pp.1139–1143.
Heijnen, J.J. et al., 1989. Review on the application of anaerobic fluidized bed reactors in waste-
water treatment. The Chemical Engineering Journal, 41(3), pp.37–50.
Holm-Nielsen, J.B., Al Seadi, T. & Oleskowicz-Popiel, P., 2009. The future of anaerobic
digestion and biogas utilization. Bioresource Technology, 100(22), pp.5478–5484.
Hulshoff Pol, L.W. et al., 2004. Anaerobic sludge granulation. Water Research, 38(6), pp.1376–
112
1389.
Izumi, K. et al., 2010. Effects of particle size on anaerobic digestion of food waste. International
Biodeterioration & Biodegradation, 64(7), pp.601–608. Available at:
http://www.sciencedirect.com/science/article/pii/S0964830510001344.
Jackson-Moss, C. a & Duncan, J.R., 1991. The effect of aluminium on Anaerobic digestion.
Biotechnology Letters, 13(2), pp.143–148.
Jain, S. et al., 2015a. A comprehensive review on operating parameters and different
pretreatment methodologies for anaerobic digestion of municipal solid waste. Renewable
and Sustainable Energy Reviews, 52, pp.142–154. Available at:
http://www.sciencedirect.com/science/article/pii/S1364032115007388 [Accessed August
13, 2015].
Jain, S. et al., 2015b. A comprehensive review on operating parameters and different
pretreatment methodologies for anaerobic digestion of municipal solid waste. Renewable
and Sustainable Energy Reviews, 52, pp.142–154. Available at:
http://linkinghub.elsevier.com/retrieve/pii/S1364032115007388.
Kaparaju, P. et al., 2008. Effects of mixing on methane production during thermophilic anaerobic
digestion of manure: Lab-scale and pilot-scale studies. Bioresource Technology, 99(11),
pp.4919–4928.
Karadag, D. et al., 2015. A review on anaerobic biofilm reactors for the treatment of dairy
industry wastewater. Process Biochemistry, 50(2), pp.262–271. Available at:
http://linkinghub.elsevier.com/retrieve/pii/S1359511314005832.
Karim, K. et al., 2005. Anaerobic digestion of animal waste: Effect of mode of mixing. Water
Research, 39(15), pp.3597–3606.
Kennedy, K., 2000. Treatment of landfill leachate using sequencing batch and continuous flow
upflow anaerobic sludge blanket (UASB) reactors. Water Research, 34(14), pp.3640–3656.
Kennedy, K.J., Hamoda, M.F. & Guiot, S.G., 1988. Anaerobic Treatment of Leachate Using
Fixed Film and Sludge Bed Systems. Journal Water Pollution Control Federation, 60(9),
pp.1675–1683.
Khan, A.H. & Ashraf, M.Y., 1988. Effect of sodium chloride on growth and mineral composition
of sorghum. Acta Physiologiae Plantarum, 10(3), pp.257–264.
Kida, K. et al., 2001. Influence of Ni2+ and Co2+ on methanogenic activity and the amounts of
coenzymes involved in methanogenesis. Journal of Bioscience and Bioengineering, 91(6),
pp.590–595.
Kugelman, I.J. & Mccarty, P.L., 1965. Cation toxicity and stimulation in anaerobic waste

113
treatment. Water Pollution Control Federation, 37(1), pp.97–116.
Kwietniewska, E. & Tys, J., 2014. Process characteristics, inhibition factors and methane yields
of anaerobic digestion process, with particular focus on microalgal biomass fermentation.
Renewable and Sustainable Energy Reviews, 34, pp.491–500. Available at:
http://dx.doi.org/10.1016/j.rser.2014.03.041.
Langer, S. et al., 2014a. Dynamics of biofilm formation during anaerobic digestion of organic
waste. Anaerobe, 29, pp.44–51. Available at:
http://dx.doi.org/10.1016/j.anaerobe.2013.11.013.
Langer, S. et al., 2014b. Dynamics of biofilm formation during anaerobic digestion of organic
waste. Anaerobe, 29, pp.44–51.
Lettinga, G., Rebac, S. & Zeeman, G., 2001. Challenge of psychrophilic anaerobic wastewater
treatment. Trends in Biotechnology, 19(9), pp.363–370.
Levin, D.B., Pitt, L. & Love, M., 2004. Biohydrogen production: Prospects and limitations to
practical application. International Journal of Hydrogen Energy, 29(2), pp.173–185.
Li, C. & Fang, H.H.P., 2007. Inhibition of heavy metals on fermentative hydrogen production by
granular sludge. Chemosphere, 67(4), pp.668–673.
Li, Y., Park, S.Y. & Zhu, J., 2011. Solid-state anaerobic digestion for methane production from
organic waste. Renewable and Sustainable Energy Reviews, 15(1), pp.821–826.
LIN, C., 2008. Heavy metal effects on fermentative hydrogen production using natural mixed
microflora. International Journal of Hydrogen Energy, 33(2), pp.587–593.
Lin, C.-Y., 1993. Effect of heavy metals on acidogenesis in anaerobic digestion. Water Research,
27(1), pp.147–152.
López Torres, M. & Espinosa Llorens, M. d C., 2008. Effect of alkaline pretreatment on
anaerobic digestion of solid wastes. Waste Management, 28(11), pp.2229–2234.
Lu, X. et al., 2015. Operation performance and granule characterization of upflow anaerobic
sludge blanket (UASB) reactor treating wastewater with starch as the sole carbon source.
Bioresource Technology, 180, pp.264–273. Available at:
http://dx.doi.org/10.1016/j.biortech.2015.01.010.
Lyberatos, I.N.G.A.G., 2010. Biohydrogen Production from Biomass and Wastes via Dark
Fermentation : A Review. , pp.21–39.
M??ller, K. & M??ller, T., 2012. Effects of anaerobic digestion on digestate nutrient availability
and crop growth: A review. Engineering in Life Sciences, 12(3), pp.242–257.
Macias-Corral, M. et al., 2008. Anaerobic digestion of municipal solid waste and agricultural

114
waste and the effect of co-digestion with dairy cow manure. Bioresource Technology,
99(17), pp.8288–8293.
Martí-herrero, J. et al., 2014. Bioresource Technology Improvement through low cost biofilm
carrier in anaerobic tubular digestion in cold climate regions. , 167, pp.87–93.
Martinez-Sosa, D. et al., 2011. Anaerobic submerged membrane bioreactor (AnSMBR) for
municipal wastewater treatment under mesophilic and psychrophilic temperature
conditions. Bioresource Technology, 102(22), pp.10377–10385. Available at:
http://dx.doi.org/10.1016/j.biortech.2011.09.012.
Mata-Alvarez, J., Macé, S. & Llabrés, P., 2000. Anaerobic digestion of organic solid wastes. An
overview of research achievements and perspectives. Bioresource Technology, 74(1), pp.3–
16.
Mccarty, P.L., 1964. Anaerobic Waste Treatment Fundamentals.
Meng, Y., Yeong, T. & Ching, J., 2014. A review of sustainable hydrogen production using seed
sludge via dark fermentation. Renewable and Sustainable Energy Reviews, 34, pp.471–482.
Minghua, Z. et al., 2009. Municipal solid waste management in Pudong New Area , China.
Waste Management, 29(3), pp.1227–1233. Available at:
http://dx.doi.org/10.1016/j.wasman.2008.07.016.
Murrayt, P.A. & Zinder, S.H., 1985. Nutritional Requirements of Methanosarcina Strain TM-1.
Analysis, 50(1), pp.49–55.
Mustafa, N. et al., 2014. Anaerobic digestion of municipal wastewater sludges using anaerobic
fluidized bed bioreactor. Bioresource technology, 172(December), pp.461–6. Available at:
http://www.sciencedirect.com/science/article/pii/S0960852414013406.
Nasr, N. et al., 2014. Biohydrogen production from pretreated corn cobs. International Journal
of Hydrogen Energy, 39(35), pp.19921–19927.
Nges, I.A. & Björnsson, L., 2012. High methane yields and stable operation during anaerobic
digestion of nutrient-supplemented energy crop mixtures. Biomass and Bioenergy, 47,
pp.62–70.
Oleszkiewicz, J.A. & Sharma, V.K., 1990. Stimulation and inhibition of anaerobic processes by
heavy metals-A review. Biological Wastes, 31(1), pp.45–67.
Parkin, B.G.F. & Owen, W.F., 1987. Fundamentals of anaerobic digestion of wastewater
sludges. , 112(5), pp.867–920.
Rodgers, M. & Zhan, X.-M., 2003. Moving-medium biofilm reactors. Reviews in Environmental
Science and Biotechnology, (2003), pp.213–224.

115
Rodgers, M., Zhan, X.-M. & Dolan, B., 2004. Mixing Characteristics and Whey Wastewater
Treatment of a Novel Moving Anaerobic Biofilm Reactor. Journal of Environmental
Science and Health, Part A, 39(8), pp.2183–2193. Available at:
http://www.tandfonline.com/doi/abs/10.1081/ESE-120039383#.Ve9Cl5fpV9g.
Romano, R.T. et al., 2009. The effect of enzyme addition on anaerobic digestion of Jose Tall
Wheat Grass. Bioresource Technology, 100(20), pp.4564–4571.
Romero-G??iza, M.S. et al., 2016. The role of additives on anaerobic digestion: A review.
Renewable and Sustainable Energy Reviews, 58, pp.1486–1499.
Schattauer, A. et al., 2011. Abundance of trace elements in demonstration biogas plants.
Biosystems Engineering, 108(1), pp.57–65.
Schmidt, J.E. & Ahring, B.K., 1993. Effects of magnesium on thermophilic acetate-degrading
granules in upflow anaerobic sludge blanket (UASB) reactors. Enzyme and Microbial
Technology, 15(4), pp.304–310.
Sheli, C. & Moletta, R., 2007. Anaerobic treatment of vinasses by a sequentially mixed moving
bed biofilm reactor. Water Science and Technology, 56(2), pp.1–7.
Show, K.Y. & Tay, J.H., 1999. Influence of support media on biomass growth and retention in
anaerobic filters. Water Research, 33(6), pp.1471–1481.
Soto, M., M??ndez, R. & Lema, J.M., 1993. Sodium inhibition and sulphate reduction in the
anaerobic treatment of mussel processing wastewaters. Journal of Chemical Technology &
Biotechnology, 58(1), pp.1–7.
Sutherland, I.W., 2001. Biofilm exopolysaccharides: A strong and sticky framework.
Microbiology, 147(1), pp.3–9.
Switzenbaum, M.S., 1983. Anaerobic fixed film wastewater treatment. Enzyme and Microbial
Technology, 5(4), pp.242–250.
Thiele, J.H. et al., 1989. Ecoengeneering high rate anaerobic digestion systems: analysis of
improved syntrophic biemethanation catalysts. Biotechnol Bioeng, 35, pp.990–999.
Uemura, S., 2010. Mineral requirements for mesophilic and thermophilic anaerobic digestion of
organic solid waste. Int. J. Environ. Res., 4(1), pp.33–40.
Wang, R.C., Wen, X.H. & Qian, Y., 2005. Influence of carrier concentration on the performance
and microbial characteristics of a suspended carrier biofilm reactor. Process Biochemistry,
40(9), pp.2992–3001.
Wang, S. et al., 2009. Performance and kinetic evaluation of anaerobic moving bed biofilm
reactor for treating milk permeate from dairy industry. Bioresource Technology, 100(23),

116
pp.5641–5647. Available at: http://dx.doi.org/10.1016/j.biortech.2009.06.028.
Weiland, P., 2010. Biogas production: Current state and perspectives. Applied Microbiology and
Biotechnology, 85(4), pp.849–860.
Wiegant, W.M. & Lettinga, G., 1985. Thermophilic anaerobic digestion of sugars in upflow
anaerobic sludge blanket reactors. Biotechnology and Bioengineering, XXVII, pp.1603–
1607.
Williams, C.M., Shih, J.C.H. & Spears, J.W., 1986. Effect of nickel on biological methane
generation from a laboratory poultry waste digester. Biotechnology and Bioengineering,
28(11), pp.1608–1610.
Worm, P. et al., 2009. Decreased activity of a propionate degrading community in a UASB
reactor fed with synthetic medium without molybdenum, tungsten and selenium. Enzyme
and Microbial Technology, 45(2), pp.139–145.
Yadvika et al., 2004. Enhancement of biogas production from solid substrates using different
techniques - A review. Bioresource Technology, 95(1), pp.1–10.
Yang, Q. et al., 2010. Enhanced efficiency of biological excess sludge hydrolysis under
anaerobic digestion by additional enzymes. Bioresource Technology, 101(9), pp.2924–
2930.
Ye, F.X., Chen, Y.X. & Feng, X.S., 2005. Advanced start-up of anaerobic attached film
expanded bed reactor by pre-aeration of biofilm carrier. Bioresource Technology, 96(1),
pp.115–119.
Yen, H. & Brune, D., 2007. Anaerobic co-digestion of algal sludge and waste paper to produce
methane. Bioresource Technology, 98(1), pp.130–134. Available at:
http://linkinghub.elsevier.com/retrieve/pii/S0960852405005365.
Young, J.C. & McCarty, P.L., 1969. The anaerobic filter for waste treatment. Journal - Water
Pollution Control Federation, 41(519), p.Suppl:R160+.
Yu, H.Q., Tay, J.H. & Fang, H.H.P., 2001. The roles of calcium in sludge granulation during
UASB reactor start-up. Water Research, 35(4), pp.1052–1060.
Zellner, G. & Winter, J., 1987. Growth promoting effect of tungsten on methanogens and
incorporation of tungsten-185 into cells. FEMS Microbiology Letters, 40(1), pp.81–87.
Zhang, C. et al., 2014. Reviewing the anaerobic digestion of food waste for biogas production.
Renewable and Sustainable Energy Reviews, 38, pp.383–392. Available at:
http://dx.doi.org/10.1016/j.rser.2014.05.038.
Zhang, L., Lee, Y.W. & Jahng, D., 2011. Anaerobic co-digestion of food waste and piggery
117
wastewater: Focusing on the role of trace elements. Bioresource Technology, 102(8),
pp.5048–5059.
Zhang, Y. et al., 2014. Enhanced high-solids anaerobic digestion of waste activated sludge by the
addition of scrap iron. Bioresource Technology, 159, pp.297–304.
Zhang, Y., Liu, G. & Shen, J., 2005. Hydrogen production in batch culture of mixed bacteria
with sucrose under different iron concentrations. International Journal of Hydrogen Energy,
30(8), pp.855–860.
Zhang, Y. & Shen, J., 2006. Effect of temperature and iron concentration on the growth and
hydrogen production of mixed bacteria. International Journal of Hydrogen Energy, 31(4),
pp.441–446.
Zhong, W. et al., 2011. Comparison of chemical and biological pretreatment of corn straw for
biogas production by anaerobic digestion. Renewable Energy, 36(6), pp.1875–1879.
Available at: http://dx.doi.org/10.1016/j.renene.2010.12.020.
Zhu, X. & Tan, X., 2009. Metalloproteins/metalloenzymes for the synthesis of acetyl-CoA in the
Wood-Ljungdahl pathway. Science in China, Series B: Chemistry, 52(12), pp.2071–2082.
Zitomer, D.H., Johnson, C.C. & Speece, R.E., 2008. Metal Stimulation and Municipal Digester
Thermophilic/Mesophilic Activity. Journal of Environmental Engineering, 134(1), pp.42–
47.