enhancing children's conceptual understanding of mathematics through chartworld software
TRANSCRIPT
This article was downloaded by: [University of Chicago Library]On: 18 November 2014, At: 15:50Publisher: RoutledgeInforma Ltd Registered in England and Wales Registered Number: 1072954 Registered office: MortimerHouse, 37-41 Mortimer Street, London W1T 3JH, UK
Journal of Research in Childhood EducationPublication details, including instructions for authors and subscription information:http://www.tandfonline.com/loi/ujrc20
Enhancing Children's Conceptual Understanding ofMathematics Through Chartworld SoftwareDon Ploger a & Steven Hecht ba Florida Atlantic Universityb Children's Learning Institute, University of Texas Health Science Center at HoustonPublished online: 03 Nov 2009.
To cite this article: Don Ploger & Steven Hecht (2009) Enhancing Children's Conceptual Understanding ofMathematics Through Chartworld Software, Journal of Research in Childhood Education, 23:3, 267-277, DOI:10.1080/02568540909594660
To link to this article: http://dx.doi.org/10.1080/02568540909594660
PLEASE SCROLL DOWN FOR ARTICLE
Taylor & Francis makes every effort to ensure the accuracy of all the information (the “Content”)contained in the publications on our platform. However, Taylor & Francis, our agents, and our licensorsmake no representations or warranties whatsoever as to the accuracy, completeness, or suitabilityfor any purpose of the Content. Any opinions and views expressed in this publication are the opinionsand views of the authors, and are not the views of or endorsed by Taylor & Francis. The accuracy ofthe Content should not be relied upon and should be independently verified with primary sources ofinformation. Taylor and Francis shall not be liable for any losses, actions, claims, proceedings, demands,costs, expenses, damages, and other liabilities whatsoever or howsoever caused arising directly orindirectly in connection with, in relation to or arising out of the use of the Content.
This article may be used for research, teaching, and private study purposes. Any substantial orsystematic reproduction, redistribution, reselling, loan, sub-licensing, systematic supply, or distribution inany form to anyone is expressly forbidden. Terms & Conditions of access and use can be found at http://www.tandfonline.com/page/terms-and-conditions
Journal of Research in Childhood Education2009, Vol. 23, No. 3
Copyright 2009 by the Association forChildhood Education International
0256-8543/09
267
Chartworld is a flexible computer program that allows children to create a wide variety of patterns. There is a mathematical reason for each pattern, and one of the strengths of the program is that children can explore the patterns at any stage of understand-ing, and can learn mathematics as they explore. With Chartworld, children can easily create models showing: multiples, the commutative property of multiplication, perfect squares, division as the inverse of multiplication, division with remainder, factors, prime numbers, divisibility tests, and the Sieve of Eratosthenes. Chartworld emphasizes conceptual rea-soning based on number sense, in addition to the more traditional focus on rote memo-rization. The development of Chartworld was influenced by the work of Seymour Papert (1980), who developed Logo, a highly popular computer language during the 1980s. Logo proved to be simple enough for
Abstract. Two randomized control/treatment experiments tested the effectiveness of Chartworld software on enhancing mathematical knowledge of 3rd-graders. In Experiment 1, 196 children were randomly assigned to receive either Chartworld or textbook instruction on number operations. ANCOVAs indicated significant group differences in favor of Chartworld in the magnitude of posttest performance while controlling for pretested ability (p < .05). For Experiment 2, which covered divisibility and prime numbers, the results demonstrated significantly greater gains in conceptual knowledge for Chartworld (p < .001). These experiments provide corroborating evidence that Chartworld is an effective method of instructional delivery for conceptual knowledge.
Don PlogerFlorida Atlantic UniversitySteven HechtChildren’s Learning Institute, University of Texas Health Science Center at Houston
Enhancing Children’s Conceptual Understanding of Mathematics Through Chartworld Software
kindergartners to draw shapes and yet pow-erful enough for college students to write sophisticated programs to solve problems in differential geometry (Abelson & diSessa, 1981). Despite all of the potential benefits, Logo has not gained widespread acceptance in the public school classrooms. In an effort to build upon Logo’s consider-able strengths and to correct its weaknesses, Andrea diSessa (2000; diSessa & Abelson, 1986) developed Boxer, a programming language in which text editing, graphics, and database capability are all integrated with programming. Chartworld is written in Boxer, which has proved to be flexible enough for students to write programs on a wide range of topics (diSessa 2000; diSessa & Abelson, 1986). Crucially, it is very easy to modify any program in response to re-quests from teachers and students. This research incorporates a fully ran-domized controlled experimental design.
Dow
nloa
ded
by [
Uni
vers
ity o
f C
hica
go L
ibra
ry]
at 1
5:50
18
Nov
embe
r 20
14
PlogER ANd HECHt
268
Theoretical and empirical evidence converge to support the conclusion that poor perfor-mance in working with numbers may be largely traced to separation between con-ceptual understandings of properties about numbers and performing operations with numbers, such as performing arithmetic. Conceptual knowledge can be defined as the awareness of what mathematical symbols mean, and the ability to represent relations among numbers in multiple ways. Bransford, Brown, and Cocking (2000) and Kilpatrick, Swafford, and Findell (2001) re-viewed the major cognitive science perspec-tives that provide a framework on which any information-processing model of mathemat-ics skills should be based. Consistent with these reports, this study on Chartworld also assumes that it is necessary for children to coordinate conceptual knowledge in order to understand the underlying meanings of arithmetical operations with numbers. Thus, conceptual knowledge reveals the logical structure of any math domain. The ability to understand the meaningfulness of numbers, operations, and applications is often cited as one of the defining char-acteristics of the emerging construct in the mathematical cognition literature referred to as “number sense” (Berch, 2005). Conceptual understandings about whole numbers are important for children to be able to apply their understandings toward solving procedural and word problem tasks (Hecht 2002, 2006; Hecht, Close, & Santisi, 2003; Hecht, Vagi, & Torgesen, 2007). Children’s ability to rep-resent quantitative information enables them to see the meaning behind number operations. This, in turn, enables accurate representation of arithmetical relations in word problems. The present study will provide visual representations for multiplication, divi-sion, and prime numbers, which students can then apply toward solving novel word problems. In order to document this, we have de-veloped quantitative tests that measure children’s knowledge about their under-
standings of numbers. We also use direct observations of the classroom experiences of teachers helping children develop conceptual understandings in the process of operating with numbers.
Overview of Chartworld Chartworld software can be used to teach arithmetic and number theory (Ploger & Della Vedova, 1999; Ploger & Rooney, 2005). Unlike other computer-based meth-ods, Chartworld allows children to create, modify, and extend colorful models that can be explored to understand mathematics in a progressively deeper way. Children use Chartworld to create a variety of visually in-teresting patterns that express fundamental mathematical ideas. Children can even be-gin exploring using Chartworld before they completely understand these ideas; teachers
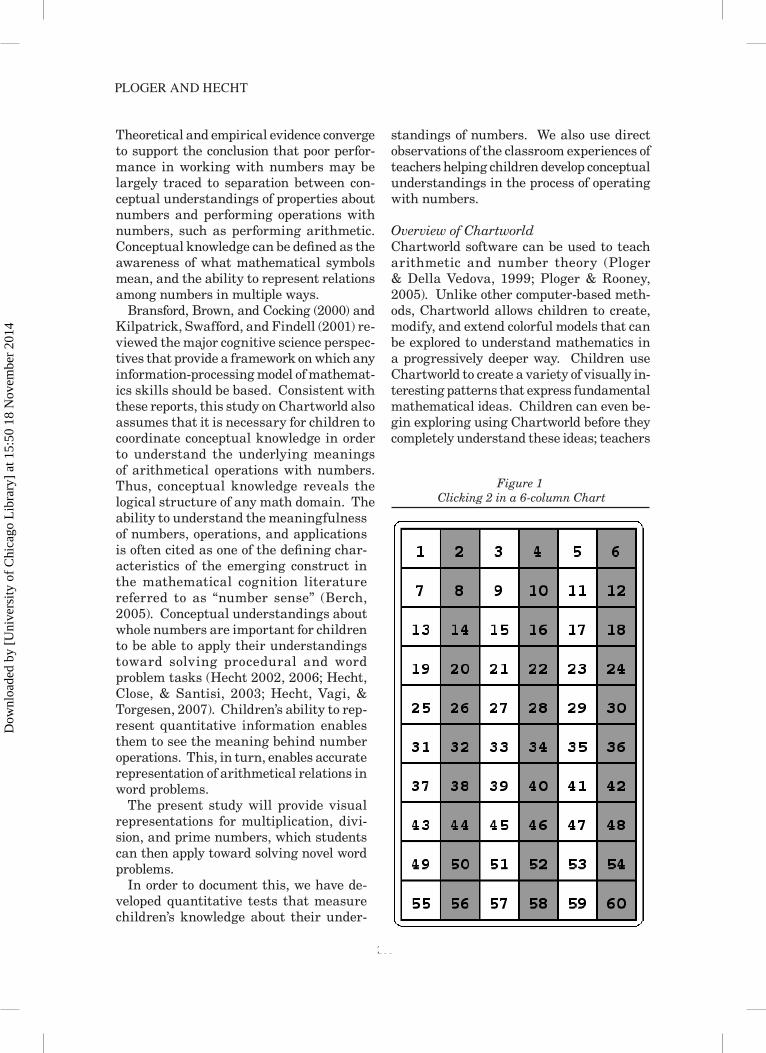
Figure 1 Clicking 2 in a 6-column Chart
Dow
nloa
ded
by [
Uni
vers
ity o
f C
hica
go L
ibra
ry]
at 1
5:50
18
Nov
embe
r 20
14
CoNCEPtuAl uNdERStANdINg of MAtHEMAtICS tHRougH CHARtwoRld
269
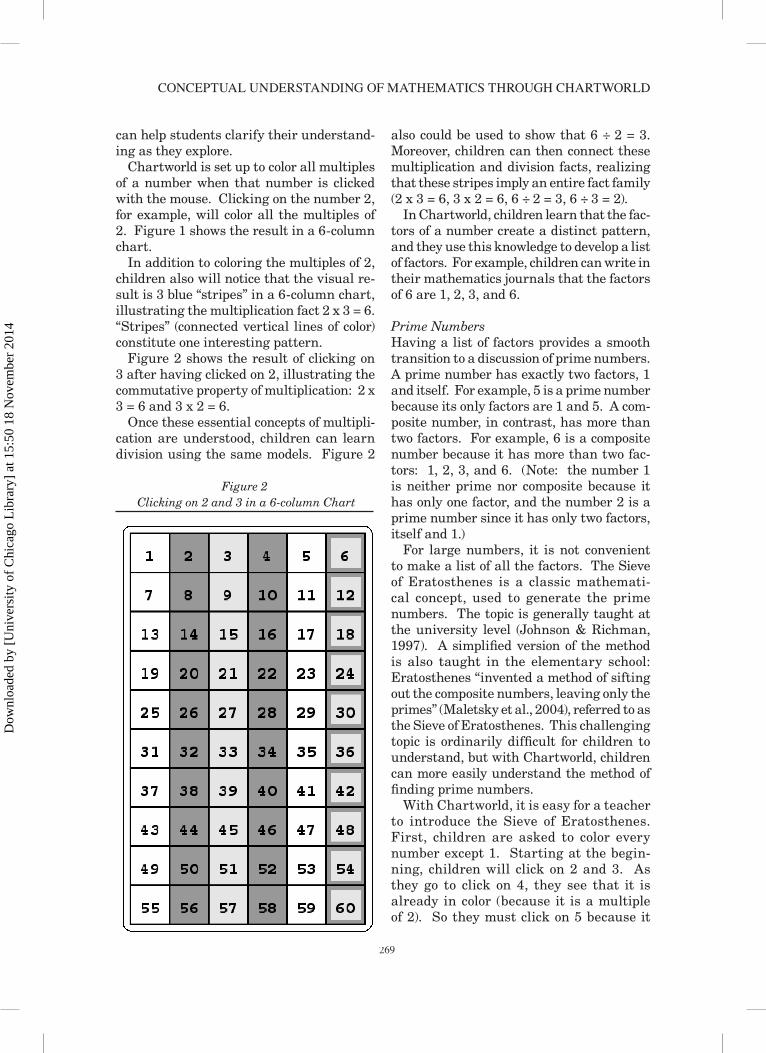
can help students clarify their understand-ing as they explore. Chartworld is set up to color all multiples of a number when that number is clicked with the mouse. Clicking on the number 2, for example, will color all the multiples of 2. Figure 1 shows the result in a 6-column chart. In addition to coloring the multiples of 2, children also will notice that the visual re-sult is 3 blue “stripes” in a 6-column chart, illustrating the multiplication fact 2 x 3 = 6. “Stripes” (connected vertical lines of color) constitute one interesting pattern. Figure 2 shows the result of clicking on 3 after having clicked on 2, illustrating the commutative property of multiplication: 2 x 3 = 6 and 3 x 2 = 6. Once these essential concepts of multipli-cation are understood, children can learn division using the same models. Figure 2
also could be used to show that 6 ÷ 2 = 3. Moreover, children can then connect these multiplication and division facts, realizing that these stripes imply an entire fact family (2 x 3 = 6, 3 x 2 = 6, 6 ÷ 2 = 3, 6 ÷ 3 = 2). In Chartworld, children learn that the fac-tors of a number create a distinct pattern, and they use this knowledge to develop a list of factors. For example, children can write in their mathematics journals that the factors of 6 are 1, 2, 3, and 6.
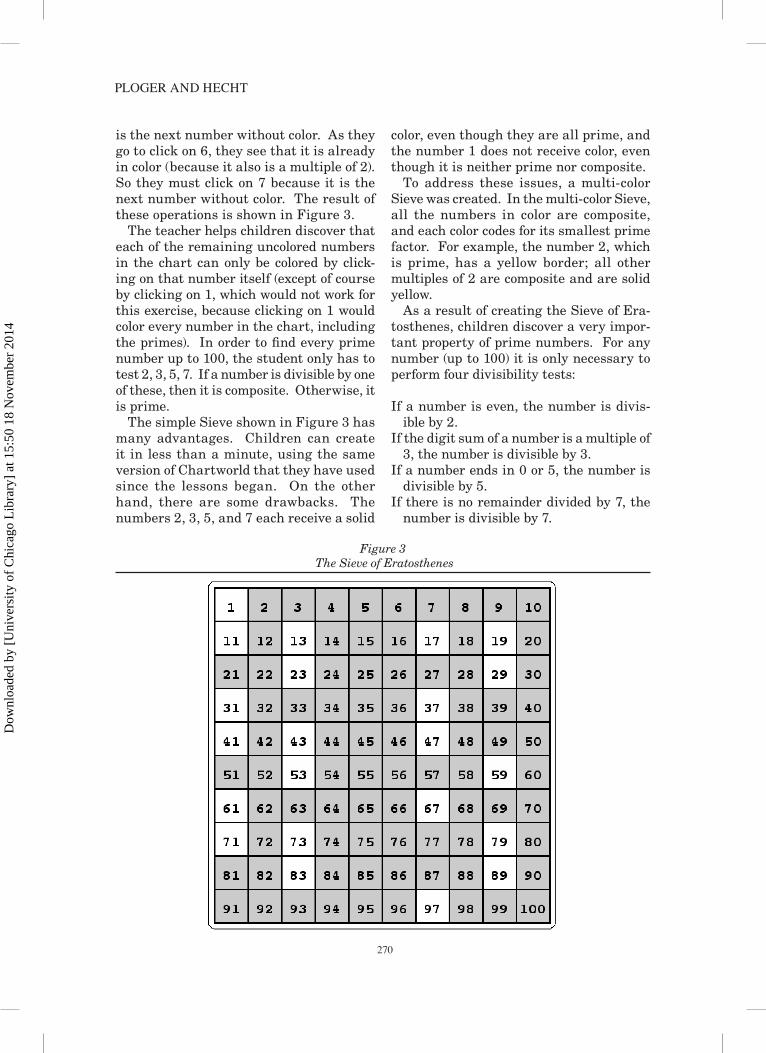
Prime NumbersHaving a list of factors provides a smooth transition to a discussion of prime numbers. A prime number has exactly two factors, 1 and itself. For example, 5 is a prime number because its only factors are 1 and 5. A com-posite number, in contrast, has more than two factors. For example, 6 is a composite number because it has more than two fac-tors: 1, 2, 3, and 6. (Note: the number 1 is neither prime nor composite because it has only one factor, and the number 2 is a prime number since it has only two factors, itself and 1.) For large numbers, it is not convenient to make a list of all the factors. The Sieve of Eratosthenes is a classic mathemati-cal concept, used to generate the prime numbers. The topic is generally taught at the university level (Johnson & Richman, 1997). A simplified version of the method is also taught in the elementary school: Eratosthenes “invented a method of sifting out the composite numbers, leaving only the primes” (Maletsky et al., 2004), referred to as the Sieve of Eratosthenes. This challenging topic is ordinarily difficult for children to understand, but with Chartworld, children can more easily understand the method of finding prime numbers. With Chartworld, it is easy for a teacher to introduce the Sieve of Eratosthenes. First, children are asked to color every number except 1. Starting at the begin-ning, children will click on 2 and 3. As they go to click on 4, they see that it is already in color (because it is a multiple of 2). So they must click on 5 because it
Figure 2 Clicking on 2 and 3 in a 6-column Chart
Dow
nloa
ded
by [
Uni
vers
ity o
f C
hica
go L
ibra
ry]
at 1
5:50
18
Nov
embe
r 20
14
PlogER ANd HECHt
270
is the next number without color. As they go to click on 6, they see that it is already in color (because it also is a multiple of 2). So they must click on 7 because it is the next number without color. The result of these operations is shown in Figure 3. The teacher helps children discover that each of the remaining uncolored numbers in the chart can only be colored by click-ing on that number itself (except of course by clicking on 1, which would not work for this exercise, because clicking on 1 would color every number in the chart, including the primes). In order to find every prime number up to 100, the student only has to test 2, 3, 5, 7. If a number is divisible by one of these, then it is composite. Otherwise, it is prime. The simple Sieve shown in Figure 3 has many advantages. Children can create it in less than a minute, using the same version of Chartworld that they have used since the lessons began. On the other hand, there are some drawbacks. The numbers 2, 3, 5, and 7 each receive a solid
color, even though they are all prime, and the number 1 does not receive color, even though it is neither prime nor composite. To address these issues, a multi-color Sieve was created. In the multi-color Sieve, all the numbers in color are composite, and each color codes for its smallest prime factor. For example, the number 2, which is prime, has a yellow border; all other multiples of 2 are composite and are solid yellow. As a result of creating the Sieve of Era-tosthenes, children discover a very impor-tant property of prime numbers. For any number (up to 100) it is only necessary to perform four divisibility tests:
If a number is even, the number is divis-ible by 2.
If the digit sum of a number is a multiple of 3, the number is divisible by 3.
If a number ends in 0 or 5, the number is divisible by 5.
If there is no remainder divided by 7, the number is divisible by 7.
Figure 3 The Sieve of Eratosthenes
Dow
nloa
ded
by [
Uni
vers
ity o
f C
hica
go L
ibra
ry]
at 1
5:50
18
Nov
embe
r 20
14
CoNCEPtuAl uNdERStANdINg of MAtHEMAtICS tHRougH CHARtwoRld
271
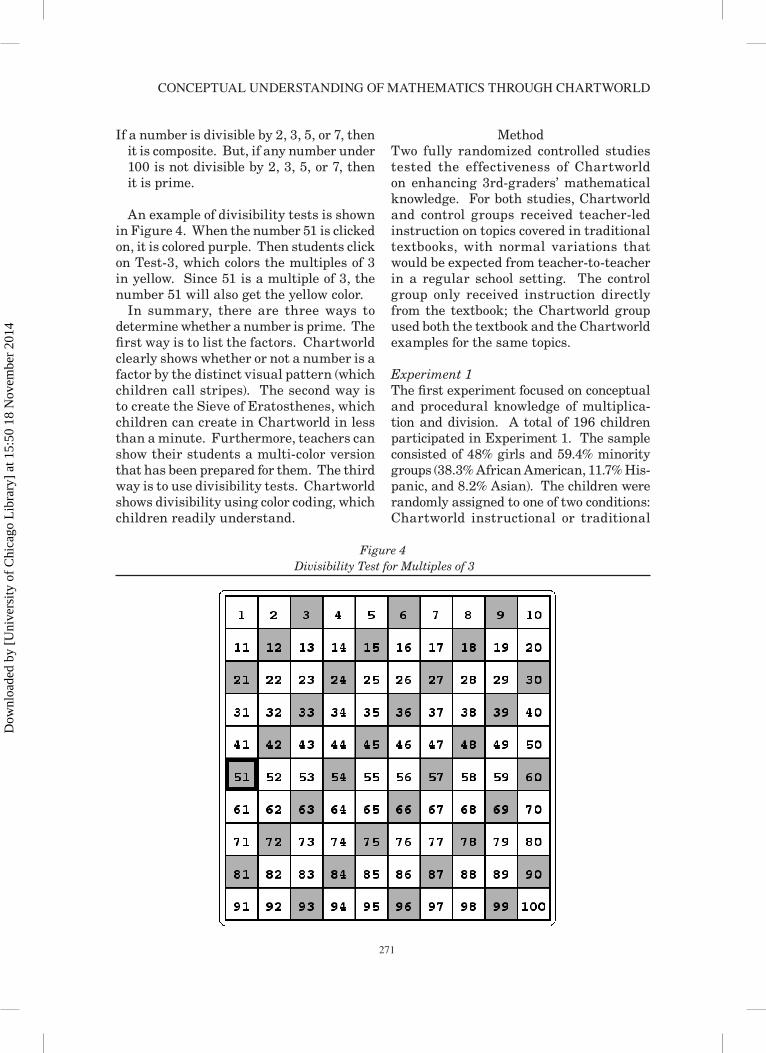
If a number is divisible by 2, 3, 5, or 7, then it is composite. But, if any number under 100 is not divisible by 2, 3, 5, or 7, then it is prime.
An example of divisibility tests is shown in Figure 4. When the number 51 is clicked on, it is colored purple. Then students click on Test-3, which colors the multiples of 3 in yellow. Since 51 is a multiple of 3, the number 51 will also get the yellow color. In summary, there are three ways to determine whether a number is prime. The first way is to list the factors. Chartworld clearly shows whether or not a number is a factor by the distinct visual pattern (which children call stripes). The second way is to create the Sieve of Eratosthenes, which children can create in Chartworld in less than a minute. Furthermore, teachers can show their students a multi-color version that has been prepared for them. The third way is to use divisibility tests. Chartworld shows divisibility using color coding, which children readily understand.
MethodTwo fully randomized controlled studies tested the effectiveness of Chartworld on enhancing 3rd-graders’ mathematical knowledge. For both studies, Chartworld and control groups received teacher-led instruction on topics covered in traditional textbooks, with normal variations that would be expected from teacher-to-teacher in a regular school setting. The control group only received instruction directly from the textbook; the Chartworld group used both the textbook and the Chartworld examples for the same topics.
Experiment 1 The first experiment focused on conceptual and procedural knowledge of multiplica-tion and division. A total of 196 children participated in Experiment 1. The sample consisted of 48% girls and 59.4% minority groups (38.3% African American, 11.7% His-panic, and 8.2% Asian). The children were randomly assigned to one of two conditions: Chartworld instructional or traditional
Figure 4 Divisibility Test for Multiples of 3
Dow
nloa
ded
by [
Uni
vers
ity o
f C
hica
go L
ibra
ry]
at 1
5:50
18
Nov
embe
r 20
14
PlogER ANd HECHt
272
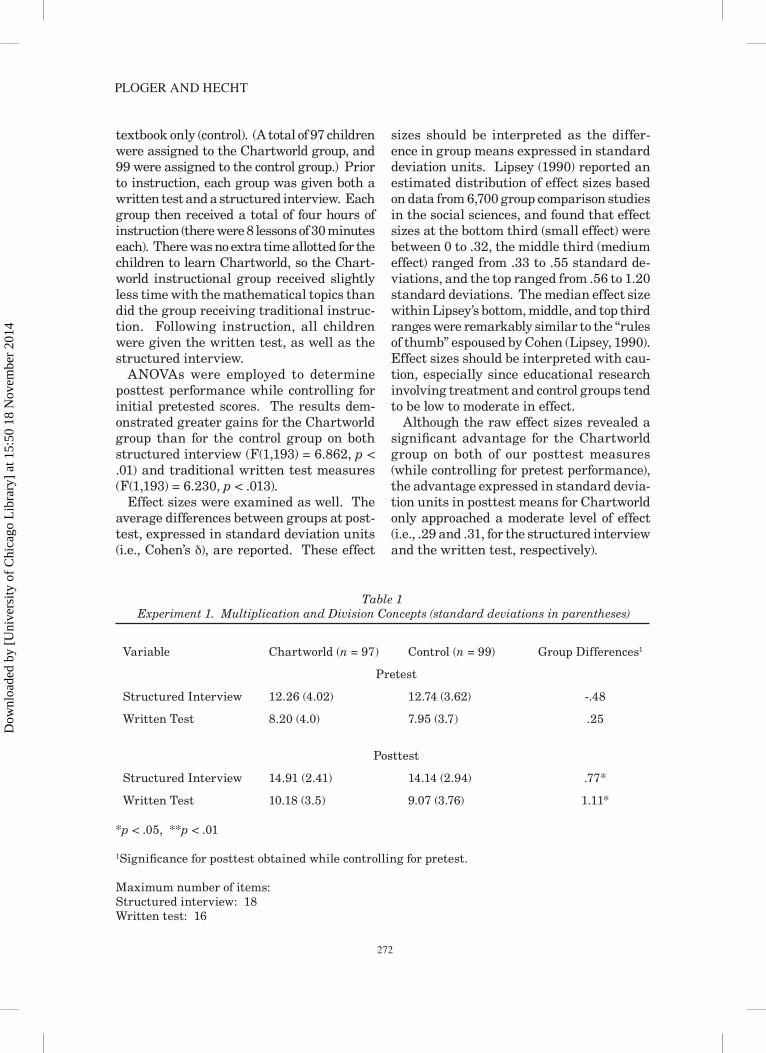
textbook only (control). (A total of 97 children were assigned to the Chartworld group, and 99 were assigned to the control group.) Prior to instruction, each group was given both a written test and a structured interview. Each group then received a total of four hours of instruction (there were 8 lessons of 30 minutes each). There was no extra time allotted for the children to learn Chartworld, so the Chart-world instructional group received slightly less time with the mathematical topics than did the group receiving traditional instruc-tion. Following instruction, all children were given the written test, as well as the structured interview. ANOVAs were employed to determine posttest performance while controlling for initial pretested scores. The results dem-onstrated greater gains for the Chartworld group than for the control group on both structured interview (F(1,193) = 6.862, p < .01) and traditional written test measures (F(1,193) = 6.230, p < .013). Effect sizes were examined as well. The average differences between groups at post-test, expressed in standard deviation units (i.e., Cohen’s d), are reported. These effect
sizes should be interpreted as the differ-ence in group means expressed in standard deviation units. Lipsey (1990) reported an estimated distribution of effect sizes based on data from 6,700 group comparison studies in the social sciences, and found that effect sizes at the bottom third (small effect) were between 0 to .32, the middle third (medium effect) ranged from .33 to .55 standard de-viations, and the top ranged from .56 to 1.20 standard deviations. The median effect size within Lipsey’s bottom, middle, and top third ranges were remarkably similar to the “rules of thumb” espoused by Cohen (Lipsey, 1990). Effect sizes should be interpreted with cau-tion, especially since educational research involving treatment and control groups tend to be low to moderate in effect. Although the raw effect sizes revealed a significant advantage for the Chartworld group on both of our posttest measures (while controlling for pretest performance), the advantage expressed in standard devia-tion units in posttest means for Chartworld only approached a moderate level of effect (i.e., .29 and .31, for the structured interview and the written test, respectively).
Table 1 Experiment 1. Multiplication and Division Concepts (standard deviations in parentheses)
Variable Chartworld (n = 97) Control (n = 99) Group Differences1
Pretest
Structured Interview 12.26 (4.02) 12.74 (3.62) -.48
Written Test 8.20 (4.0) 7.95 (3.7) .25
Posttest
Structured Interview 14.91 (2.41) 14.14 (2.94) .77*
Written Test 10.18 (3.5) 9.07 (3.76) 1.11* *p < .05, **p < .01
1Significance for posttest obtained while controlling for pretest.
Maximum number of items:Structured interview: 18Written test: 16
Dow
nloa
ded
by [
Uni
vers
ity o
f C
hica
go L
ibra
ry]
at 1
5:50
18
Nov
embe
r 20
14
CoNCEPtuAl uNdERStANdINg of MAtHEMAtICS tHRougH CHARtwoRld
273
Experiment 2The second controlled experiment was con-ducted approximately three weeks after the state-mandated high-stakes testing (the Florida Comprehensive Assessment Test) was completed by the district. (The second experiment taught 4th-grade mathematics, and the 3rd-grade children responded well to this challenge.) The second experiment focused on con-ceptual and procedural knowledge of prime and composite numbers. The 3rd-graders received a total of four hours of instruction on prime and composite numbers. As before, children were again randomly assigned to one of two conditions: Chartworld instruc-tional or traditional textbook (control). In this randomized process, some children were assigned to a different group than in the first study; some were assigned to the same group. They were told that this as-signment would be the result of a coin flip. The children actually saw the flip of the coin, and they accepted the rules of the game. A total of 187 children were randomly assigned to one of two conditions: 107 children were assigned to the Chartworld group, and 80
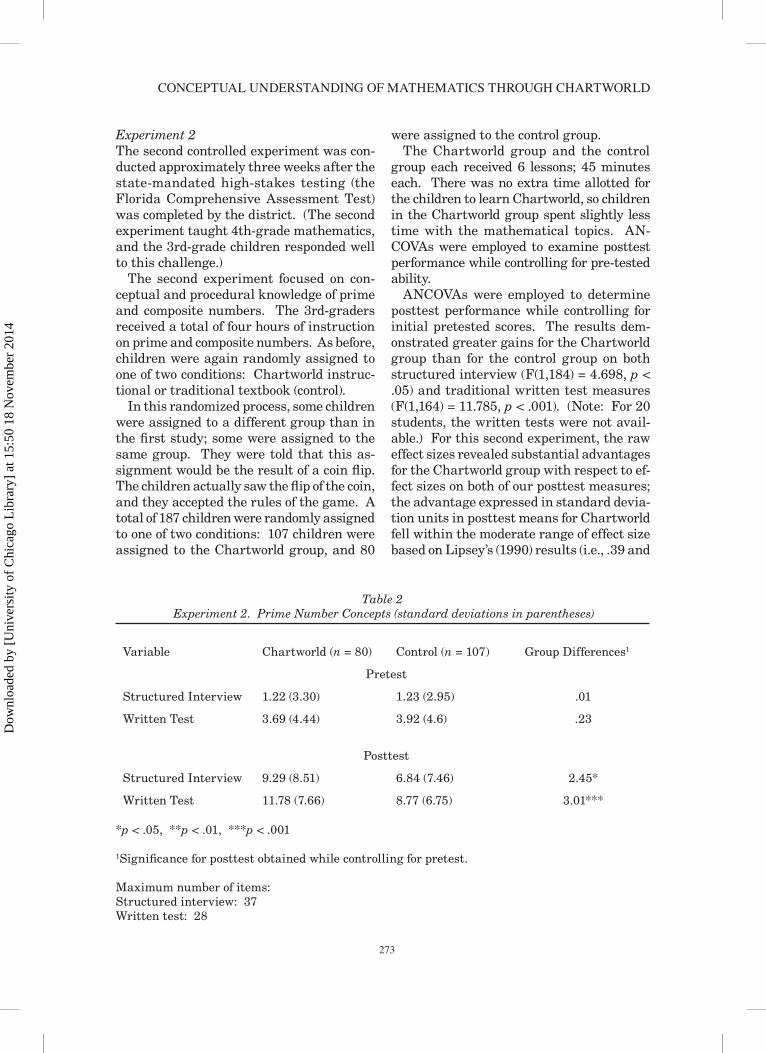
were assigned to the control group. The Chartworld group and the control group each received 6 lessons; 45 minutes each. There was no extra time allotted for the children to learn Chartworld, so children in the Chartworld group spent slightly less time with the mathematical topics. AN-COVAs were employed to examine posttest performance while controlling for pre-tested ability. ANCOVAs were employed to determine posttest performance while controlling for initial pretested scores. The results dem-onstrated greater gains for the Chartworld group than for the control group on both structured interview (F(1,184) = 4.698, p < .05) and traditional written test measures (F(1,164) = 11.785, p < .001). (Note: For 20 students, the written tests were not avail-able.) For this second experiment, the raw effect sizes revealed substantial advantages for the Chartworld group with respect to ef-fect sizes on both of our posttest measures; the advantage expressed in standard devia-tion units in posttest means for Chartworld fell within the moderate range of effect size based on Lipsey’s (1990) results (i.e., .39 and
Table 2 Experiment 2. Prime Number Concepts (standard deviations in parentheses)
Variable Chartworld (n = 80) Control (n = 107) Group Differences1
Pretest
Structured Interview 1.22 (3.30) 1.23 (2.95) .01
Written Test 3.69 (4.44) 3.92 (4.6) .23
Posttest
Structured Interview 9.29 (8.51) 6.84 (7.46) 2.45*
Written Test 11.78 (7.66) 8.77 (6.75) 3.01*** *p < .05, **p < .01, ***p < .001
1Significance for posttest obtained while controlling for pretest.
Maximum number of items:Structured interview: 37Written test: 28
Dow
nloa
ded
by [
Uni
vers
ity o
f C
hica
go L
ibra
ry]
at 1
5:50
18
Nov
embe
r 20
14
PlogER ANd HECHt
274
process continues until someone in the class states: “Clicking on 9 will make 2 stripes in an 18-column chart because 9 x 2 = 18.” The teacher does not stop at this point. Instead, she asks, “If clicking on 9 makes 2 stripes, what will happen when we click on 2?” The teacher continues until the students reply that “Clicking on 2 will make 9 stripes because 2 x 9 = 18.” The teacher then asks, “Other than 2 and 9, is there any number we can click on that will make stripes?” At this stage, the teacher is looking for a complete answer: “Clicking on 3 will make 6 stripes because 3 x 6 = 18, and clicking on 6 will make 3 stripes because 6 x 3 = 18. These two number sen-tences show the commutative property: 3 x 6 = 6 x 3 = 18.” Children will find certain visual patterns particularly interesting. Many of these pat-terns are mathematically rich, as well as important to the mathematics curriculum. Teachers can use these features to develop instruction that appeals to children both visually and intellectually. The participating teachers noted that children enjoyed working with Chartworld. However, their initial spontaneous explora-tions were not connected to the central ideas
.41, for the structured interview and the written test, respectively). Thus, Experi-ment 2 provided corroborating evidence that Chartworld provides an effective method of instructional delivery that enhances student learning.
The Role of the Teacher The teacher directs the children to examine the factors of each number. The children learn that the smallest factor (other than 1) of any number must be prime. This knowledge is of great value in determin-ing whether a number is prime: it is only necessary to perform divisibility tests by using prime numbers. Chartworld gives students the freedom to explore a wide range of mathematical topics on their own, leading them to a mastery of centrally important mathematical topics in the curriculum. The teacher’s role is crucial. The teacher poses questions, and, as the students re-spond, the teacher suggests ways to extend the activity. For example, in an 18-column chart, the teacher asks, “What number will make stripes?” If a student says that click-ing on 9 will make stripes, the teacher asks, “How many?” In addition, the teacher asks the very important question: “Why?” The
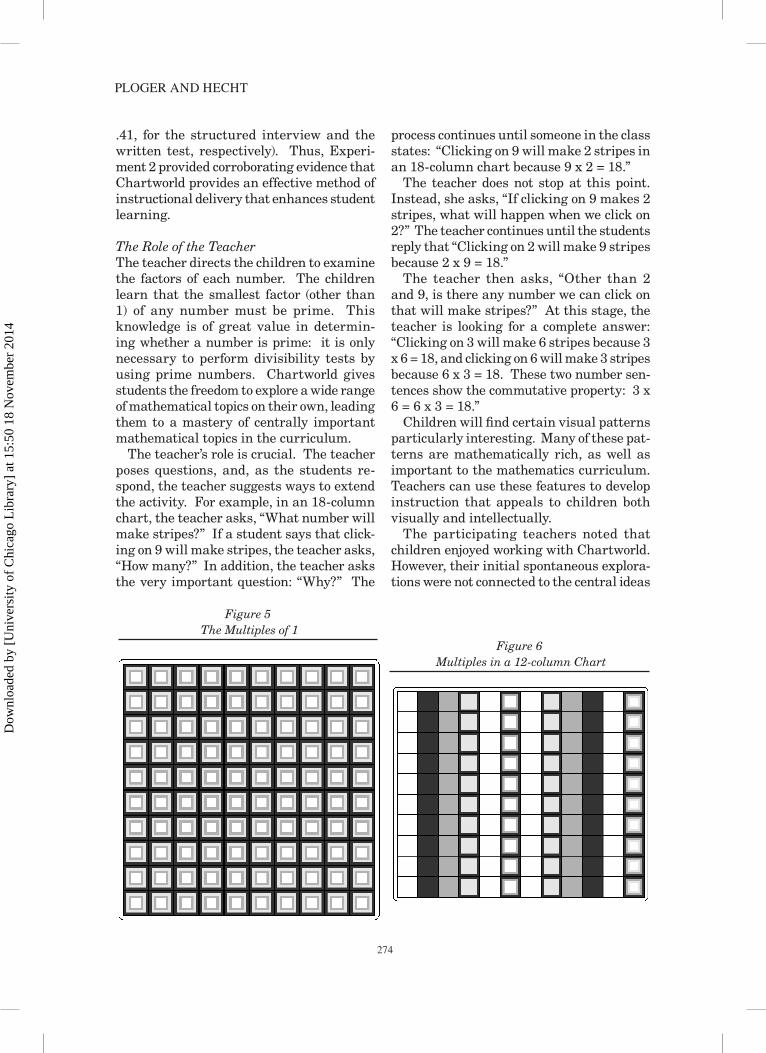
Figure 5 The Multiples of 1
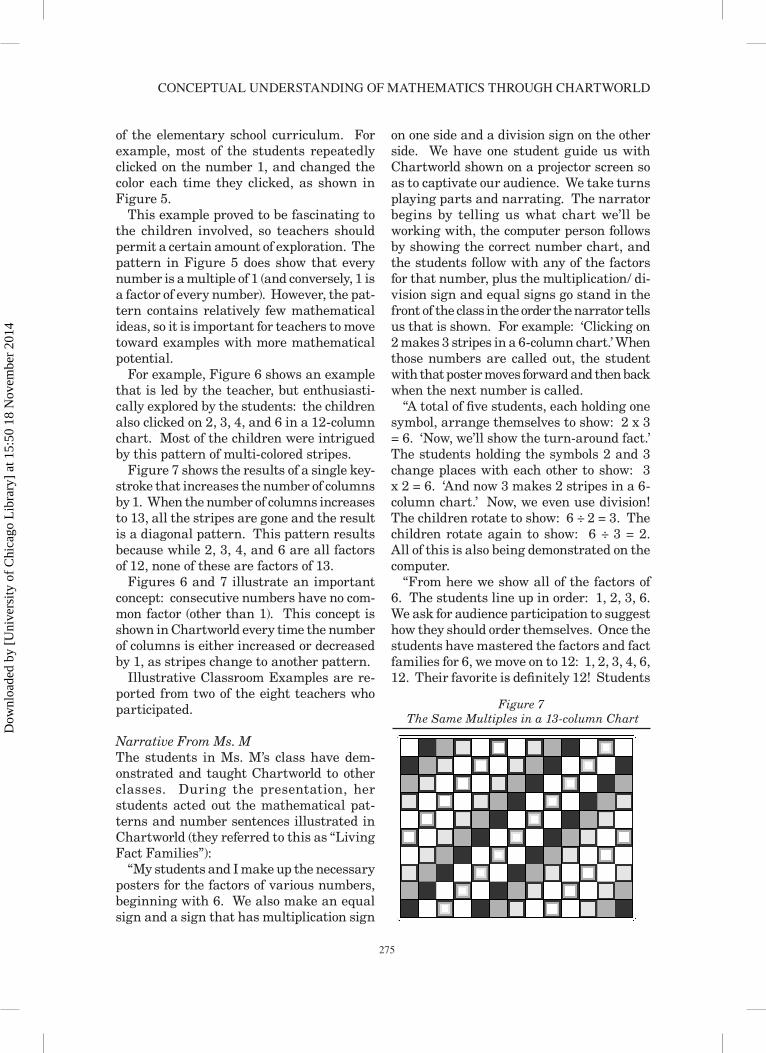
Figure 6 Multiples in a 12-column Chart
Dow
nloa
ded
by [
Uni
vers
ity o
f C
hica
go L
ibra
ry]
at 1
5:50
18
Nov
embe
r 20
14
CoNCEPtuAl uNdERStANdINg of MAtHEMAtICS tHRougH CHARtwoRld
275
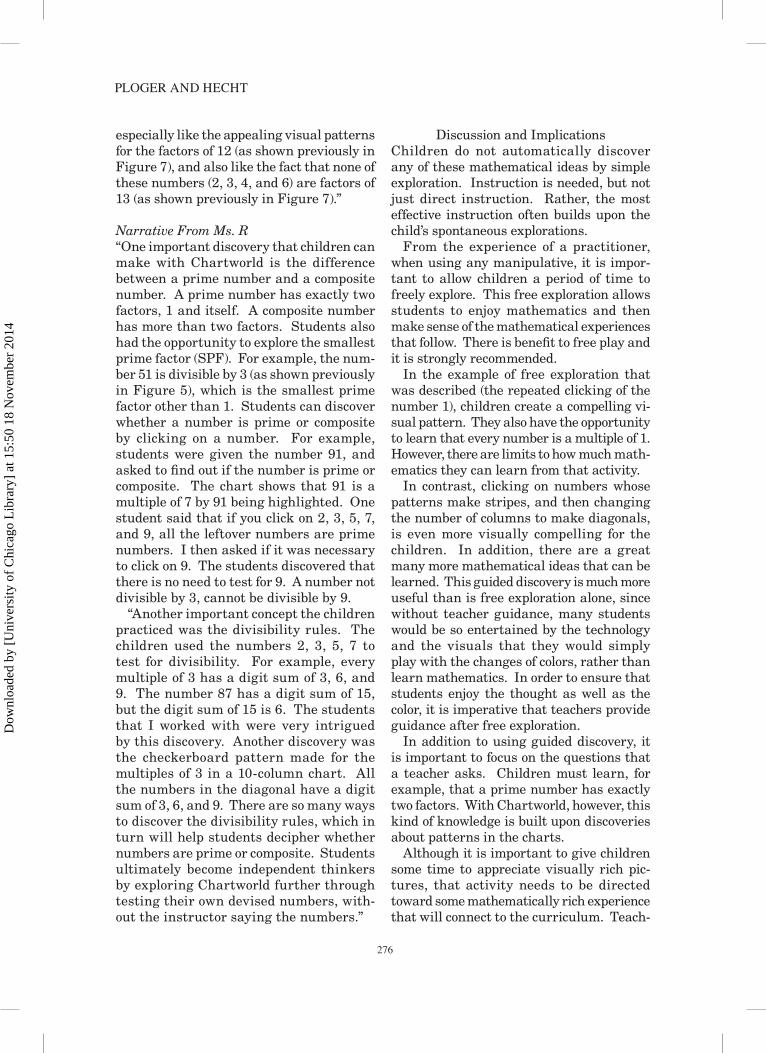
of the elementary school curriculum. For example, most of the students repeatedly clicked on the number 1, and changed the color each time they clicked, as shown in Figure 5. This example proved to be fascinating to the children involved, so teachers should permit a certain amount of exploration. The pattern in Figure 5 does show that every number is a multiple of 1 (and conversely, 1 is a factor of every number). However, the pat-tern contains relatively few mathematical ideas, so it is important for teachers to move toward examples with more mathematical potential. For example, Figure 6 shows an example that is led by the teacher, but enthusiasti-cally explored by the students: the children also clicked on 2, 3, 4, and 6 in a 12-column chart. Most of the children were intrigued by this pattern of multi-colored stripes. Figure 7 shows the results of a single key-stroke that increases the number of columns by 1. When the number of columns increases to 13, all the stripes are gone and the result is a diagonal pattern. This pattern results because while 2, 3, 4, and 6 are all factors of 12, none of these are factors of 13. Figures 6 and 7 illustrate an important concept: consecutive numbers have no com-mon factor (other than 1). This concept is shown in Chartworld every time the number of columns is either increased or decreased by 1, as stripes change to another pattern. Illustrative Classroom Examples are re-ported from two of the eight teachers who participated.
Narrative From Ms. M The students in Ms. M’s class have dem-onstrated and taught Chartworld to other classes. During the presentation, her students acted out the mathematical pat-terns and number sentences illustrated in Chartworld (they referred to this as “Living Fact Families”): “My students and I make up the necessary posters for the factors of various numbers, beginning with 6. We also make an equal sign and a sign that has multiplication sign
on one side and a division sign on the other side. We have one student guide us with Chartworld shown on a projector screen so as to captivate our audience. We take turns playing parts and narrating. The narrator begins by telling us what chart we’ll be working with, the computer person follows by showing the correct number chart, and the students follow with any of the factors for that number, plus the multiplication/ di-vision sign and equal signs go stand in the front of the class in the order the narrator tells us that is shown. For example: ‘Clicking on 2 makes 3 stripes in a 6-column chart.’ When those numbers are called out, the student with that poster moves forward and then back when the next number is called. “A total of five students, each holding one symbol, arrange themselves to show: 2 x 3 = 6. ‘Now, we’ll show the turn-around fact.’ The students holding the symbols 2 and 3 change places with each other to show: 3 x 2 = 6. ‘And now 3 makes 2 stripes in a 6-column chart.’ Now, we even use division! The children rotate to show: 6 ÷ 2 = 3. The children rotate again to show: 6 ÷ 3 = 2. All of this is also being demonstrated on the computer. “From here we show all of the factors of 6. The students line up in order: 1, 2, 3, 6. We ask for audience participation to suggest how they should order themselves. Once the students have mastered the factors and fact families for 6, we move on to 12: 1, 2, 3, 4, 6, 12. Their favorite is definitely 12! Students
Figure 7 The Same Multiples in a 13-column Chart
Dow
nloa
ded
by [
Uni
vers
ity o
f C
hica
go L
ibra
ry]
at 1
5:50
18
Nov
embe
r 20
14
PlogER ANd HECHt
276
especially like the appealing visual patterns for the factors of 12 (as shown previously in Figure 7), and also like the fact that none of these numbers (2, 3, 4, and 6) are factors of 13 (as shown previously in Figure 7).”
Narrative From Ms. R “One important discovery that children can make with Chartworld is the difference between a prime number and a composite number. A prime number has exactly two factors, 1 and itself. A composite number has more than two factors. Students also had the opportunity to explore the smallest prime factor (SPF). For example, the num-ber 51 is divisible by 3 (as shown previously in Figure 5), which is the smallest prime factor other than 1. Students can discover whether a number is prime or composite by clicking on a number. For example, students were given the number 91, and asked to find out if the number is prime or composite. The chart shows that 91 is a multiple of 7 by 91 being highlighted. One student said that if you click on 2, 3, 5, 7, and 9, all the leftover numbers are prime numbers. I then asked if it was necessary to click on 9. The students discovered that there is no need to test for 9. A number not divisible by 3, cannot be divisible by 9. “Another important concept the children practiced was the divisibility rules. The children used the numbers 2, 3, 5, 7 to test for divisibility. For example, every multiple of 3 has a digit sum of 3, 6, and 9. The number 87 has a digit sum of 15, but the digit sum of 15 is 6. The students that I worked with were very intrigued by this discovery. Another discovery was the checkerboard pattern made for the multiples of 3 in a 10-column chart. All the numbers in the diagonal have a digit sum of 3, 6, and 9. There are so many ways to discover the divisibility rules, which in turn will help students decipher whether numbers are prime or composite. Students ultimately become independent thinkers by exploring Chartworld further through testing their own devised numbers, with-out the instructor saying the numbers.”
Discussion and ImplicationsChildren do not automatically discover any of these mathematical ideas by simple exploration. Instruction is needed, but not just direct instruction. Rather, the most effective instruction often builds upon the child’s spontaneous explorations. From the experience of a practitioner, when using any manipulative, it is impor-tant to allow children a period of time to freely explore. This free exploration allows students to enjoy mathematics and then make sense of the mathematical experiences that follow. There is benefit to free play and it is strongly recommended. In the example of free exploration that was described (the repeated clicking of the number 1), children create a compelling vi-sual pattern. They also have the opportunity to learn that every number is a multiple of 1. However, there are limits to how much math-ematics they can learn from that activity. In contrast, clicking on numbers whose patterns make stripes, and then changing the number of columns to make diagonals, is even more visually compelling for the children. In addition, there are a great many more mathematical ideas that can be learned. This guided discovery is much more useful than is free exploration alone, since without teacher guidance, many students would be so entertained by the technology and the visuals that they would simply play with the changes of colors, rather than learn mathematics. In order to ensure that students enjoy the thought as well as the color, it is imperative that teachers provide guidance after free exploration. In addition to using guided discovery, it is important to focus on the questions that a teacher asks. Children must learn, for example, that a prime number has exactly two factors. With Chartworld, however, this kind of knowledge is built upon discoveries about patterns in the charts. Although it is important to give children some time to appreciate visually rich pic-tures, that activity needs to be directed toward some mathematically rich experience that will connect to the curriculum. Teach-
Dow
nloa
ded
by [
Uni
vers
ity o
f C
hica
go L
ibra
ry]
at 1
5:50
18
Nov
embe
r 20
14
CoNCEPtuAl uNdERStANdINg of MAtHEMAtICS tHRougH CHARtwoRld
277
ers need to find a balance: allowing explora-tion without losing direction; and providing instructional guidance while preserving an important level of freedom for students.
(submitted 11/30/07; accepted 10/6/08)
ReferencesAbelson, H., & diSessa, A. (1981). Turtle geometry:
The computer as a medium for exploring math-ematics. Cambridge, MA: MIT Press.
Berch, D. B. (2005). Making sense of number sense: Implications for children with math-ematical disabilities. Journal of Learning Dis-abilities, 38, 333-339.
Bransford, J. D., Brown, A. L., & Cocking, R. R. (Eds.). (2000). How people learn. Washington, DC: National Academies Press.
diSessa, A. A. (2000). Changing minds: Com-puters, learning and literacy. Cambridge, MA: MIT Press.
diSessa, A., & Abelson, H. (1986). Boxer: A reconstructible computational medium. Com-munications of the ACM, 29, 859-868.
Hecht, S. A., Vagi, K. J., & Torgesen, J. K. (2007). Fraction skills and proportional reasoning. In D. B. Berch & M. M. M. Mazzocco (Eds.), Why is math so hard for some children? The nature and origins of mathematical learning difficul-ties and disabilities (pp. 121-132). Baltimore: Brookes Publishing.
Hecht, S., Close, L., & Santisi, M. (2003). Sources of individual differences in fraction skills. Journal of Experimental Child Psychology, 86, 277-302.
Hecht, S. A. (2006). Group differences in adult simple arithmetic: Good retrievers, not-so-good retrievers, and perfectionists. Memory and Cognition, 34, 207-216.
Hecht, S. A. (2002). Counting on working memory in simple arithmetic when counting is used for problem solving. Memory and Cognition, 30, 447-455.
Johnson, B. L., & Richman, F. (1997). Numbers and symmetry: An introduction to algebra. New York: CRC Press.
Kilpatrick, J., Swafford, J., & Findell, B. (2001). Adding it up: Helping children learn mathemat-ics. Washington, DC: National Academies Press.
Lipsey, M. W. (1990). Design sensitivity: Statistical power for experimental research. Newbury Park, CA: Sage Publications.
Maletsky, E., Roby, T., Andrews, A., Bennett, J.,
Burton, G., Luckie, L., McLeod, J., Newman, V., & Scheer, J. (2004). Harcourt math (Grade 4, Florida Edition). Orlando, FL: Harcourt.
Papert, S. (1980). Mindstorms. New York: Basic Books.
Ploger, D., & Rooney, M. (2005). Teaching number operations with Chartworld: Guidelines for the classroom. Dimensions, 25, 6-12.
Ploger, D., & Della Vedova, T. (1999). Dynamic charts in the elementary classroom. Learning and Leading With Technology, 26, 38-41.
AcknowledgmentsTeachers are central to the success of any work in the schools. No matter how good the tech-nology is, the approach must be helpful to the teachers. Our project has been very fortunate in this respect. We thank Michael Rooney, who has worked with Chartworld for over a decade. His excellent results with Chartworld in the classroom are an inspiration to us all. We thank Principal Charles McCanna for his consistent dedication to his teachers, and for applying his extensive technical skills to help us achieve success. We thank Principals Peggy Roberts and Carol Lesser, who have been most gracious with their support. We thank Kathleen O’Rourke and Steven Peskin, who have helped us coordinate with the schools, and Penelope Fritzer for provid-ing useful comments on previous versions of this manuscript. We thank Margaret Nelson and Sylvia Ramgadoo for their skill and enthusiasm in helping their students learn Chartworld. And, we thank Mary Beth Mazza and Deborah Howell, who coordinated the day-to-day work in the schools with both skill and grace.
Chartworld SoftwareChartworld materials were developed by Don Ploger, Associate Professor of Education at Florida Atlantic University. The Chartworld toolset, from which materials were constructed, was created by Andrea A. diSessa in the Boxer programming environment: www.PyxiSystems.com. Chartworld lessons were developed in a collabora-tive effort between Don Ploger and Michael Rooney, a Mathematics Consultant and Resource Specialist whose focus is staff development and working with children throughout the United States. This research was supported by a grant to Don Ploger and Steven Hecht from the Multi-Univer-sity Reading, Mathematics, and Science Initiative (MURMSI), funded by the U.S. Department of Education.
Dow
nloa
ded
by [
Uni
vers
ity o
f C
hica
go L
ibra
ry]
at 1
5:50
18
Nov
embe
r 20
14