enhancing high volume fly ash concretes using fine ...bentz/aciminneapolisgreencementspaper... ·...
TRANSCRIPT
Enhancing High Volume Fly Ash Concretes Using Fine Limestone Powder
by Jussara Tanesi, Dale Bentz, and Ahmad Ardani
Synopsis: One of the primary approaches to producing more sustainable concretes consists of replacing 50 % or
more of the portland cement in a conventional concrete with fly ash, producing a so-called high volume fly ash
(HVFA) concrete. While these mixtures typically perform admirably in the long term, they sometimes suffer from
early-age performance issues including binder/admixture incompatibilities, delayed setting times, low early-age
strengths, and a heightened sensitivity to curing conditions. Recent investigations have indicated that the
replacement of a portion of the fly ash in these concrete mixtures by a suitably fine limestone powder can mitigate
these early-age problems. The current study investigates the production of concrete mixtures where either 40 %
or 60 % of the portland cement is replaced by fly ash (Class C or Class F) and limestone powder, on a volumetric
basis. The mixtures are characterized based on measurement of their fresh properties, heat release, setting times,
strength development, rapid chloride penetrability metrics and surface resistivity. The limestone powder not only
accelerates the early age reactions of the cement and fly ash, but also provides significant benefits at ages of 28 d
and beyond for both mechanical and transport properties.
Keywords: Constructability; fine limestone powder; high volume fly ash concrete; setting; sustainability.

Biography:
ACI member Jussara Tanesi, currently with SES Group and Associates, is a contracted project manager to the
Federal Highway Administration (FHWA) at Turner-Fairbank Highway Research Center. She is a member of ACI
Committees 211, 231, 236, 238, and 325, and a former director of the ACI National Capital Chapter. She is a
member-at-large of ASTM C09 and a member of C01. She received her Ph.D. and her B.S. in Civil Engineering
from the University of Campinas in Brazil and her M.S. in Civil Engineering from the University of Sao Paulo.
ACI member Dale P. Bentz is a Chemical Engineer in the Materials and Structural Systems Division, National
Institute of Standards and Technology (NIST), Gaithersburg, MD. He received his B.S. in Chemical Engineering
from the University of Maryland and his M.S. in Computer and Information Science from Hood College. He is a
member of ACI Committees 211-N, 231, 232, 308, and 329. His research interests include experimental and
computer modeling studies of the microstructure and performance of materials.
Ahmad Ardani is a Concrete Materials Research Engineer working for FHWA at Turner-Fairbank Highway
Research Center (TFHRC). His research interests include characterization of supplementary and alternative
cementitious materials. He directs in-house research projects and oversees day-to-day operations of the concrete
laboratories at TFHRC.
INTRODUCTION
One challenge facing the transportation industry in the 21st century is the development of a more
sustainable infrastructure, without sacrificing constructability (Cost, 2011). For example, concrete mixtures with a
lower portland cement factor, such as high volume fly ash (HVFA) mixtures, often suffer from problems at early
ages, including incompatibilities, unacceptable delays in setting times, insufficient early-age strength, and an
increased sensitivity to curing conditions (Bentz et al., 2010). Due to these issues, the replacement level of fly ash
for cement is often directly limited in construction specifications and in some cases, state Departments of
Transportation (DOTs) prohibit the utilization of fly ash mixtures during a portion of their construction season,
typically the winter months, or limit its use to lower levels of replacements. Clearly, these issues must be addressed
to successfully foster an increase in the utilization of HVFA concrete mixtures throughout the US.
Early age cement hydration and pozzolanic reactions can be accelerated by fine filler particles, with
limestone being superior to both silica fume and alumina particles (Kadri et al., 2009). Limestone additions may be
particularly beneficial in systems with supplementary cementitious materials such as those containing fly ash
(De Weerdt et al., 2011a, Bentz et al., 2012, Cost and Bohme 2012) or slag (Menendez et al., 2003, Mounanga
et al., 2011, Cost and Bohme 2012). In the current study, the addition of a fine limestone with a median particle
diameter of 0.7 µm to replace a portion of the fly ash in HVFA concretes with either a 40 % or a 60 % cement
replacement on a volumetric basis is investigated. While previous studies (De Weerdt et al., 2011a, Bentz
et al., 2012, Gurney et al., 2012) have focused mainly on heat release, setting times, and compressive strength
development, here, the concrete mixtures will be characterized with respect to a wide variety of fresh and hardened
properties, including transport characteristics such as surface resistivity and rapid chloride penetrability (RCPT).
RESEARCH SIGNIFICANCE
A variety of mitigation strategies have been developed for offsetting the early-age deficiencies of HVFA
concrete mixtures, including the use of chemical admixtures (Cost 2011), switching to a (finer) Type III cement
(Bentz et al., 2010), and lowering the water-to-cementitious materials ratio (w/cm) by increasing the cement content
of the mixture (De la Varga et al., 2012). From an economic and environmental viewpoint, however, each of these
options generally lacks making a positive contribution to the sustainability of an HVFA mixture. Readily available
fine limestone powders generally cost substantially less and have lower CO2 and energy footprints than the cement
being replaced in a mixture, and may therefore potentially offer both performance and sustainability benefits.
Quantification of these benefits requires a side-by-side comparison of 100 % ordinary portland cement mixtures to
HVFA mixtures with and without the fine limestone additions. Based on such a data set, the perceived advantages
of these ternary blends can be verified, paving the way for their wide spread introduction into practice by the
construction industry.
MATERIALS AND EXPERIMENTAL PROCEDURES
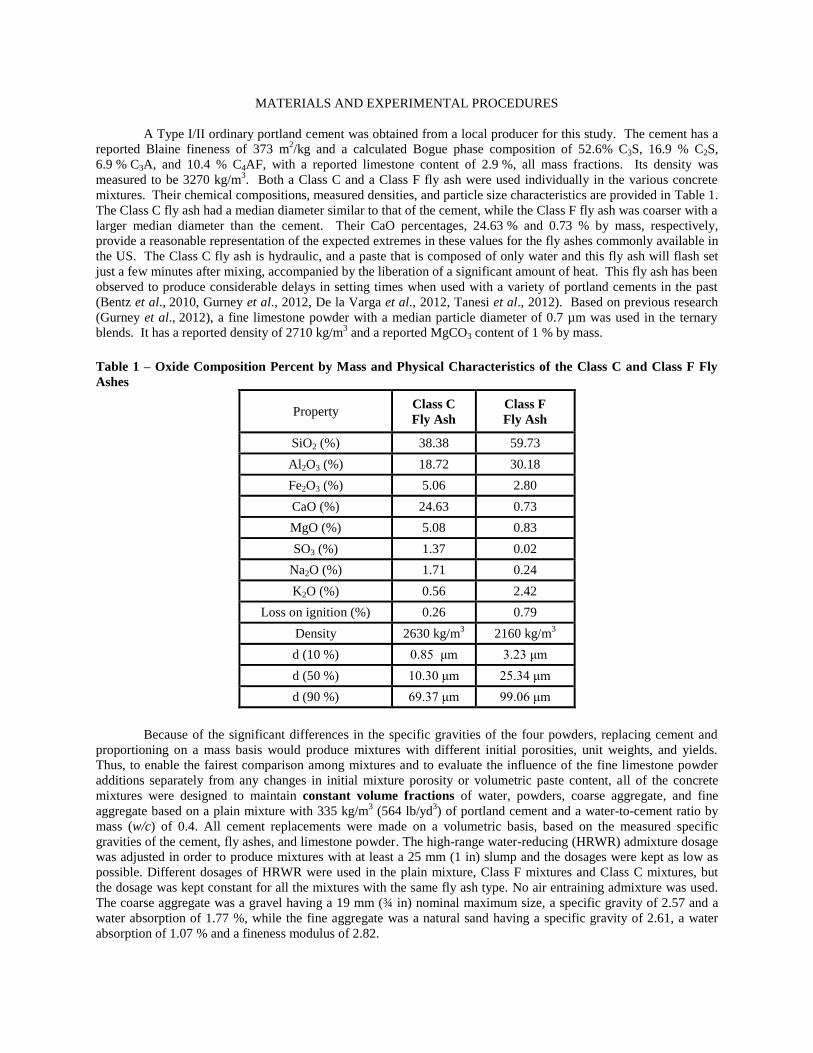
A Type I/II ordinary portland cement was obtained from a local producer for this study. The cement has a
reported Blaine fineness of 373 m2/kg and a calculated Bogue phase composition of 52.6% C3S, 16.9 % C2S,
6.9 % C3A, and 10.4 % C4AF, with a reported limestone content of 2.9 %, all mass fractions. Its density was
measured to be 3270 kg/m3. Both a Class C and a Class F fly ash were used individually in the various concrete
mixtures. Their chemical compositions, measured densities, and particle size characteristics are provided in Table 1.
The Class C fly ash had a median diameter similar to that of the cement, while the Class F fly ash was coarser with a
larger median diameter than the cement. Their CaO percentages, 24.63 % and 0.73 % by mass, respectively,
provide a reasonable representation of the expected extremes in these values for the fly ashes commonly available in
the US. The Class C fly ash is hydraulic, and a paste that is composed of only water and this fly ash will flash set
just a few minutes after mixing, accompanied by the liberation of a significant amount of heat. This fly ash has been
observed to produce considerable delays in setting times when used with a variety of portland cements in the past
(Bentz et al., 2010, Gurney et al., 2012, De la Varga et al., 2012, Tanesi et al., 2012). Based on previous research
(Gurney et al., 2012), a fine limestone powder with a median particle diameter of 0.7 µm was used in the ternary
blends. It has a reported density of 2710 kg/m3 and a reported MgCO3 content of 1 % by mass.
Table 1 – Oxide Composition Percent by Mass and Physical Characteristics of the Class C and Class F Fly
Ashes
Property Class C
Fly Ash
Class F
Fly Ash
SiO2 (%) 38.38 59.73
Al2O3 (%) 18.72 30.18
Fe2O3 (%) 5.06 2.80
CaO (%) 24.63 0.73
MgO (%) 5.08 0.83
SO3 (%) 1.37 0.02
Na2O (%) 1.71 0.24
K2O (%) 0.56 2.42
Loss on ignition (%) 0.26 0.79
Density 2630 kg/m3
2160 kg/m3
d (10 %) 0.85 μm 3.23 μm
d (50 %) 10.30 μm 25.34 μm
d (90 %) 69.37 μm 99.06 μm
Because of the significant differences in the specific gravities of the four powders, replacing cement and
proportioning on a mass basis would produce mixtures with different initial porosities, unit weights, and yields.
Thus, to enable the fairest comparison among mixtures and to evaluate the influence of the fine limestone powder
additions separately from any changes in initial mixture porosity or volumetric paste content, all of the concrete
mixtures were designed to maintain constant volume fractions of water, powders, coarse aggregate, and fine
aggregate based on a plain mixture with 335 kg/m3 (564 lb/yd
3) of portland cement and a water-to-cement ratio by
mass (w/c) of 0.4. All cement replacements were made on a volumetric basis, based on the measured specific
gravities of the cement, fly ashes, and limestone powder. The high-range water-reducing (HRWR) admixture dosage
was adjusted in order to produce mixtures with at least a 25 mm (1 in) slump and the dosages were kept as low as
possible. Different dosages of HRWR were used in the plain mixture, Class F mixtures and Class C mixtures, but
the dosage was kept constant for all the mixtures with the same fly ash type. No air entraining admixture was used.
The coarse aggregate was a gravel having a 19 mm (¾ in) nominal maximum size, a specific gravity of 2.57 and a
water absorption of 1.77 %, while the fine aggregate was a natural sand having a specific gravity of 2.61, a water
absorption of 1.07 % and a fineness modulus of 2.82.
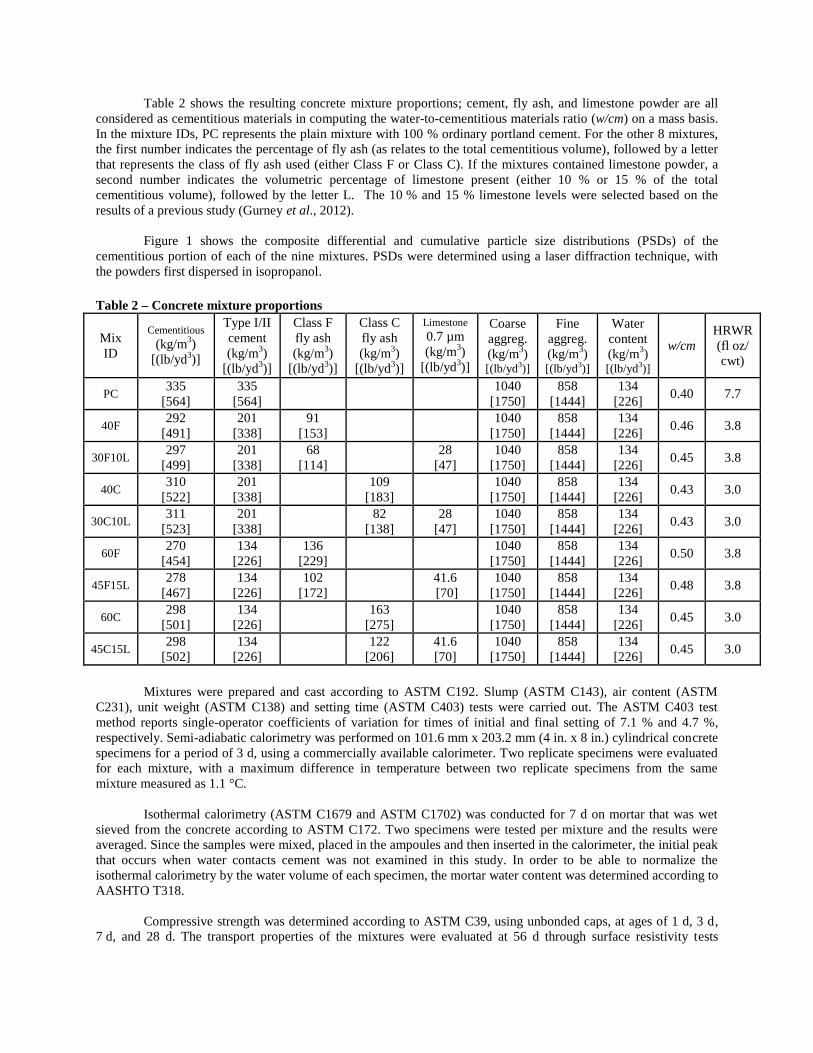
Table 2 shows the resulting concrete mixture proportions; cement, fly ash, and limestone powder are all
considered as cementitious materials in computing the water-to-cementitious materials ratio (w/cm) on a mass basis.
In the mixture IDs, PC represents the plain mixture with 100 % ordinary portland cement. For the other 8 mixtures,
the first number indicates the percentage of fly ash (as relates to the total cementitious volume), followed by a letter
that represents the class of fly ash used (either Class F or Class C). If the mixtures contained limestone powder, a
second number indicates the volumetric percentage of limestone present (either 10 % or 15 % of the total
cementitious volume), followed by the letter L. The 10 % and 15 % limestone levels were selected based on the
results of a previous study (Gurney et al., 2012).
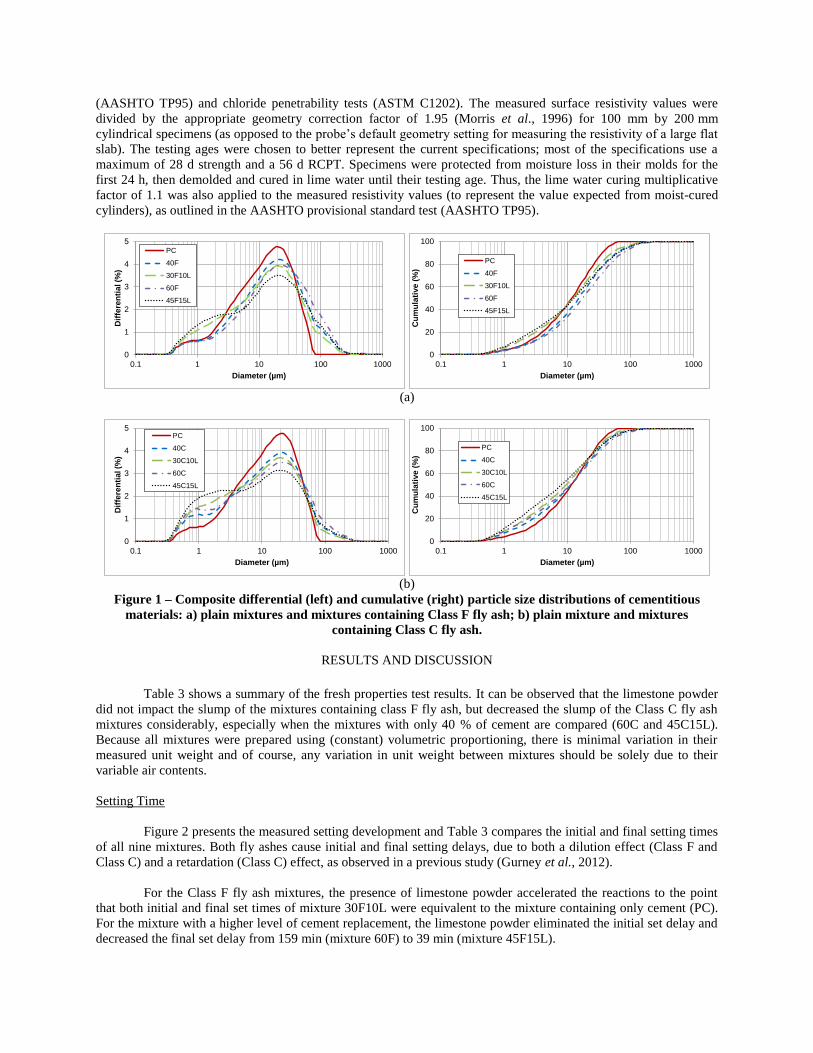
Figure 1 shows the composite differential and cumulative particle size distributions (PSDs) of the
cementitious portion of each of the nine mixtures. PSDs were determined using a laser diffraction technique, with
the powders first dispersed in isopropanol.
Table 2 – Concrete mixture proportions
Mix
ID
Cementitious
(kg/m3)
[(lb/yd3)]
Type I/II
cement
(kg/m3)
[(lb/yd3)]
Class F
fly ash
(kg/m3)
[(lb/yd3)]
Class C
fly ash
(kg/m3)
[(lb/yd3)]
Limestone 0.7 µm
(kg/m3)
[(lb/yd3)]
Coarse
aggreg.
(kg/m3)
[(lb/yd3)]
Fine
aggreg.
(kg/m3)
[(lb/yd3)]
Water
content
(kg/m3)
[(lb/yd3)]
w/cm
HRWR
(fl oz/
cwt)
PC 335
[564]
335
[564]
1040
[1750]
858
[1444]
134
[226] 0.40 7.7
40F 292
[491]
201
[338]
91
[153]
1040
[1750]
858
[1444]
134
[226] 0.46 3.8
30F10L 297
[499]
201
[338]
68
[114]
28
[47]
1040
[1750]
858
[1444]
134
[226] 0.45 3.8
40C 310
[522]
201
[338]
109
[183]
1040
[1750]
858
[1444]
134
[226] 0.43 3.0
30C10L 311
[523]
201
[338]
82
[138]
28
[47]
1040
[1750]
858
[1444]
134
[226] 0.43 3.0
60F 270
[454]
134
[226]
136
[229]
1040
[1750]
858
[1444]
134
[226] 0.50 3.8
45F15L 278
[467]
134
[226]
102
[172]
41.6
[70]
1040
[1750]
858
[1444]
134
[226] 0.48 3.8
60C 298
[501]
134
[226]
163
[275]
1040
[1750]
858
[1444]
134
[226] 0.45 3.0
45C15L 298
[502]
134
[226]
122
[206]
41.6
[70]
1040
[1750]
858
[1444]
134
[226] 0.45 3.0
Mixtures were prepared and cast according to ASTM C192. Slump (ASTM C143), air content (ASTM
C231), unit weight (ASTM C138) and setting time (ASTM C403) tests were carried out. The ASTM C403 test
method reports single-operator coefficients of variation for times of initial and final setting of 7.1 % and 4.7 %,
respectively. Semi-adiabatic calorimetry was performed on 101.6 mm x 203.2 mm (4 in. x 8 in.) cylindrical concrete
specimens for a period of 3 d, using a commercially available calorimeter. Two replicate specimens were evaluated
for each mixture, with a maximum difference in temperature between two replicate specimens from the same
mixture measured as 1.1 °C.
Isothermal calorimetry (ASTM C1679 and ASTM C1702) was conducted for 7 d on mortar that was wet
sieved from the concrete according to ASTM C172. Two specimens were tested per mixture and the results were
averaged. Since the samples were mixed, placed in the ampoules and then inserted in the calorimeter, the initial peak
that occurs when water contacts cement was not examined in this study. In order to be able to normalize the
isothermal calorimetry by the water volume of each specimen, the mortar water content was determined according to
AASHTO T318.
Compressive strength was determined according to ASTM C39, using unbonded caps, at ages of 1 d, 3 d,
7 d, and 28 d. The transport properties of the mixtures were evaluated at 56 d through surface resistivity tests
(AASHTO TP95) and chloride penetrability tests (ASTM C1202). The measured surface resistivity values were
divided by the appropriate geometry correction factor of 1.95 (Morris et al., 1996) for 100 mm by 200 mm
cylindrical specimens (as opposed to the probe’s default geometry setting for measuring the resistivity of a large flat
slab). The testing ages were chosen to better represent the current specifications; most of the specifications use a
maximum of 28 d strength and a 56 d RCPT. Specimens were protected from moisture loss in their molds for the
first 24 h, then demolded and cured in lime water until their testing age. Thus, the lime water curing multiplicative
factor of 1.1 was also applied to the measured resistivity values (to represent the value expected from moist-cured
cylinders), as outlined in the AASHTO provisional standard test (AASHTO TP95).
(a)
(b)
Figure 1 – Composite differential (left) and cumulative (right) particle size distributions of cementitious
materials: a) plain mixtures and mixtures containing Class F fly ash; b) plain mixture and mixtures
containing Class C fly ash.
RESULTS AND DISCUSSION
Table 3 shows a summary of the fresh properties test results. It can be observed that the limestone powder
did not impact the slump of the mixtures containing class F fly ash, but decreased the slump of the Class C fly ash
mixtures considerably, especially when the mixtures with only 40 % of cement are compared (60C and 45C15L).
Because all mixtures were prepared using (constant) volumetric proportioning, there is minimal variation in their
measured unit weight and of course, any variation in unit weight between mixtures should be solely due to their
variable air contents.
Setting Time
Figure 2 presents the measured setting development and Table 3 compares the initial and final setting times
of all nine mixtures. Both fly ashes cause initial and final setting delays, due to both a dilution effect (Class F and
Class C) and a retardation (Class C) effect, as observed in a previous study (Gurney et al., 2012).
For the Class F fly ash mixtures, the presence of limestone powder accelerated the reactions to the point
that both initial and final set times of mixture 30F10L were equivalent to the mixture containing only cement (PC).
For the mixture with a higher level of cement replacement, the limestone powder eliminated the initial set delay and
decreased the final set delay from 159 min (mixture 60F) to 39 min (mixture 45F15L).
0
1
2
3
4
5
0.1 1 10 100 1000
Dif
fere
nti
al (%
)
Diameter (µm)
PC
40F
30F10L
60F
45F15L
0
20
40
60
80
100
0.1 1 10 100 1000
Cu
mu
lati
ve (
%)
Diameter (µm)
PC
40F
30F10L
60F
45F15L
0
1
2
3
4
5
0.1 1 10 100 1000
Dif
fere
nti
al (%
)
Diameter (µm)
PC
40C
30C10L
60C
45C15L
0
20
40
60
80
100
0.1 1 10 100 1000
Cu
mu
lati
ve (
%)
Diameter (µm)
PC
40C
30C10L
60C
45C15L

(a)
(b)
Figure 2 – Setting development: a) plain mixture and mixtures containing Class F fly ash; b) plain mixture
and mixtures containing Class C fly ash.
Table 3 – Fresh properties test results
Slump
(cm) [(in)]
Air (%) Unit Weight
(kg/m3) [(lb/ft
3)]
Initial Setting
Time (min)
Final Setting
Time (min)
PC 3.8 [1.5] 4.0 2311 [144.3] 224 312
40F 1.9 [0.75] 2.6 2323 [145.0] 285 407
30F10L 2.5 [1.0] 3.0 2305 [143.9] 202 307
40C 5.1 [2.0] 3.0 2318 [144.7] 345 473
30C10L 3.2 [1.25] 3.3 2316 [144.6] 259 393
60F 2.5 [1.0] 3.1 2297 [143.4] 291 471
45F15L 1.9 [0.75] 3.0 2297 [143.4] 221 351
60C 12.7 [5.0] 4.4 2295 [143.3] 545 719
45C15L 6.4 [2.5] 3.8 2292 [143.1] 299 474

For the Class C fly ash mixtures, the limestone powder accelerated the reactions as well, but since the
presence of this fly ash retarded setting considerably, the limestone powder did not completely eliminate the delays.
In mixtures with 40 % of cement replacement, the presence of limestone powder decreased the initial set delay
from 121 min (mixture 40C) to 35 min (30C10L) and the final set delay from 161 min (mixture 40C) to 81 min
(30C10L). In mixtures with 60 % cement replacement, the presence of limestone powder decreased the initial set
delay from 263 min (mixture 60C) to 75 min (45C15L) and the final set delay from 353 min (mixture 60C)
to 162 min (45C15L).
Semi-adiabatic calorimetry
The semi-adiabatic temperature measurements for the nine mixtures are provided in Figure 3. The
acceleration of the reactions by the incorporation of limestone into the cement-fly ash blends is easily observed,
particularly for the Class C mixtures. All of the binary and ternary blends, however, exhibit a much smaller
maximum temperature and a more gradual temperature decrease than those observed in the 100 % ordinary portland
cement concrete, which should provide a significant advantage with respect to thermal cracking issues in some
concrete constructions, such as mass concrete.
(a)
(b)
Figure 3 – Semi-adiabatic calorimetry for: a) plain mixture and mixtures containing Class F fly ash and b)
plain mixture and mixtures containing Class C fly ash.
It is interesting to note in Figure 3 that even though the Class C fly ash is more reactive than the Class F fly
ash at intermediate ages (as confirmed by the compressive strength results to follow), the Class F concretes exhibit
a 3 °C to 4 °C higher temperature rise at their peak. Apparently, the initial retardation produced by the Class C fly
ash, along with its accompanying lack of any temperature increase, is substantial enough to also reduce the
subsequent temperature rise produced in these concrete mixtures. Alternatively, the activation energies for these
two fly ashes could be significantly different, which would also produce a different temperature sensitivity and
semi-adiabatic response for the Class C and Class F fly ash mixtures.
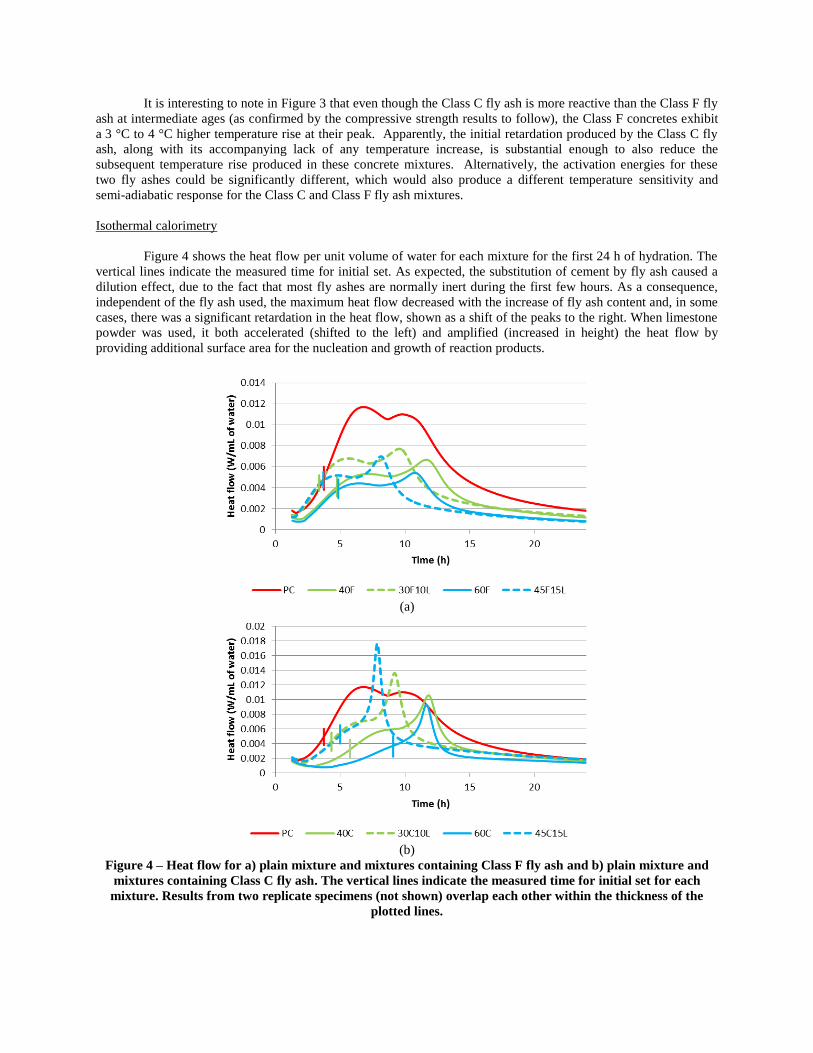
Isothermal calorimetry
Figure 4 shows the heat flow per unit volume of water for each mixture for the first 24 h of hydration. The
vertical lines indicate the measured time for initial set. As expected, the substitution of cement by fly ash caused a
dilution effect, due to the fact that most fly ashes are normally inert during the first few hours. As a consequence,
independent of the fly ash used, the maximum heat flow decreased with the increase of fly ash content and, in some
cases, there was a significant retardation in the heat flow, shown as a shift of the peaks to the right. When limestone
powder was used, it both accelerated (shifted to the left) and amplified (increased in height) the heat flow by
providing additional surface area for the nucleation and growth of reaction products.
(a)
(b)
Figure 4 – Heat flow for a) plain mixture and mixtures containing Class F fly ash and b) plain mixture and
mixtures containing Class C fly ash. The vertical lines indicate the measured time for initial set for each
mixture. Results from two replicate specimens (not shown) overlap each other within the thickness of the
plotted lines.

A typical cementitious system heat profile from isothermal calorimetry shows a first main peak that is
related to the hydration of C3S and a second peak that corresponds to the renewed formation of ettringite. Due to the
reactive aluminate content of the Class C fly ash, mixtures containing this fly ash presented a sharp amplification of
the second peak and both peaks were considerably retarded from those of the plain mixture. The presence of
limestone in these mixtures further amplified this peak and accelerated its occurrence, as the limestone may also
participate in reactions of the aluminate phases in these systems, producing carboaluminates in contrast to the
conventional formation of sulfoaluminate hydrates (De Weerdt et al., 2011b).
The cumulative heat release shown in Figure 5 is normalized per volume of water to examine the
relationship between heat generation and the filling of this pore (water) volume with hydration products (Bentz
et al., 2012). At a given age, the cumulative heat decreases with the increase of fly ash content, but partially recovers
this loss with the presence of limestone powder. Previous studies have indicated that compressive strengths should
follow the same trends as these cumulative heat release results (Bentz et al., 2012).
(a)
(b)
Figure 5 – Cumulative heat release for: a) plain mixture and mixtures containing Class F fly ash and b) plain
mixture and mixtures containing Class C fly ash. The vertical lines indicate the measured time for initial set
for each mixture. Results from two replicate specimens (not shown) overlap each other within the thickness of
the plotted lines.

Compressive strength
Figure 6 shows the compressive strength development for the plain mixture and mixtures containing fly
ash. In general, mixtures containing Class F fly ash presented lower strength than comparable mixtures containing
Class C fly ash. The early age compressive strengths (1 d and 3 d) were considered low for all of the mixtures where
60 % of the cement volume was replaced, independently of the fly ash used. The addition of limestone powder
recovered a portion of the loss in compressive strength at all ages, but had a larger impact on the 28 d strength than
the early age strength. The impact of limestone powder on the 28 d strength was more pronounced in the Class C fly
ash mixtures, where, for example, the strength doubled when mixture 45C15L is compared to mixture 60C. Both of
the mixtures with 30 % fly ash and 10 % limestone powder would likely meet a 28 d strength target of 27.6 MPa
(4000 psi). Conversely, for the mixtures with 60 % cement replacement, only the 45 % Class C fly ash and 15 %
limestone powder would meet a 28 d target of 20.7 MPa (3000 psi). If further strength enhancements at early ages
are required, viable strategies include a non-chloride accelerator (Cost, 2011), switching to a Type III cement (Bentz
et al., 2010), and/or reducing the mixture’s w/cm ratio (De la Varga et al., 2012), any or all of which could be
performed in combination with the fine limestone powder addition.
(a)
(b)
Figure 6 – Compressive strength development for mixtures containing: a) Class F fly ash and b) Class C fly
ash. Coefficients of variation for three replicate specimens varied from 0.67 % to 2.5 % for the various
mixtures.
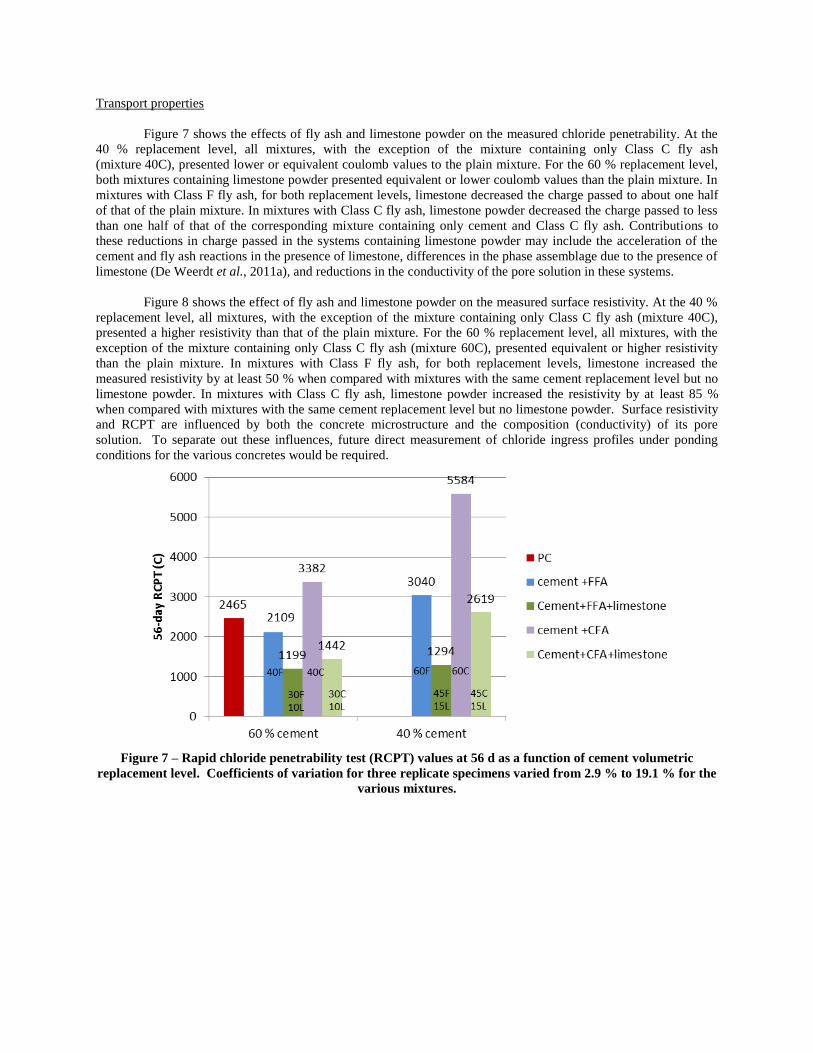
Transport properties
Figure 7 shows the effects of fly ash and limestone powder on the measured chloride penetrability. At the
40 % replacement level, all mixtures, with the exception of the mixture containing only Class C fly ash
(mixture 40C), presented lower or equivalent coulomb values to the plain mixture. For the 60 % replacement level,
both mixtures containing limestone powder presented equivalent or lower coulomb values than the plain mixture. In
mixtures with Class F fly ash, for both replacement levels, limestone decreased the charge passed to about one half
of that of the plain mixture. In mixtures with Class C fly ash, limestone powder decreased the charge passed to less
than one half of that of the corresponding mixture containing only cement and Class C fly ash. Contributions to
these reductions in charge passed in the systems containing limestone powder may include the acceleration of the
cement and fly ash reactions in the presence of limestone, differences in the phase assemblage due to the presence of
limestone (De Weerdt et al., 2011a), and reductions in the conductivity of the pore solution in these systems.
Figure 8 shows the effect of fly ash and limestone powder on the measured surface resistivity. At the 40 %
replacement level, all mixtures, with the exception of the mixture containing only Class C fly ash (mixture 40C),
presented a higher resistivity than that of the plain mixture. For the 60 % replacement level, all mixtures, with the
exception of the mixture containing only Class C fly ash (mixture 60C), presented equivalent or higher resistivity
than the plain mixture. In mixtures with Class F fly ash, for both replacement levels, limestone increased the
measured resistivity by at least 50 % when compared with mixtures with the same cement replacement level but no
limestone powder. In mixtures with Class C fly ash, limestone powder increased the resistivity by at least 85 %
when compared with mixtures with the same cement replacement level but no limestone powder. Surface resistivity
and RCPT are influenced by both the concrete microstructure and the composition (conductivity) of its pore
solution. To separate out these influences, future direct measurement of chloride ingress profiles under ponding
conditions for the various concretes would be required.
Figure 7 – Rapid chloride penetrability test (RCPT) values at 56 d as a function of cement volumetric
replacement level. Coefficients of variation for three replicate specimens varied from 2.9 % to 19.1 % for the
various mixtures.

Figure 8 – Measured surface resistivity at 56 d as a function of cement replacement level. Coefficients of
variation for three replicate specimens varied from 0.5 % to 9.9 % for the various mixtures.
CONCLUSIONS
In this study, the benefits of adding fine limestone powder to high volume fly ash concrete mixtures have
been clearly demonstrated. In agreement with past studies on pastes (Gurney et al., 2012), the 0.7 µm limestone
powder was able to mitigate the excessive setting time delays conventionally produced when high volume fractions
of cement are replaced by fly ash, which are a result of the effects of both dilution (Class C and Class F fly ash) and
retardation (Class C fly ash). Additionally, significant improvements in 28 d strength were obtained, although the
plain cement mixture still out performed the HVFA mixtures. A significant improvement of the 56 d transport
properties was also observed, as exemplified by both RCPT and surface resistivity test results. Isothermal
calorimetry has indicated that the limestone both accelerates and amplifies the early age hydration reactions in the
ternary blends, likely by providing additional surfaces for the nucleation and growth of reaction products. The fine
limestone powder may also participate in the reactions of the aluminate phases, leading to the production of
carboaluminate hydrates (as opposed to the conventional sulfoaluminates).
ACKNOWLEDGMENTS
The authors would like to acknowledge the provision of materials by BASF, Lafarge, Lehigh Cement
Corporation, OMYA, and Separation Technologies, LLC. The assistance of Max Peltz (NIST), Mihai Nicolaescu,
John Leavitt and Senaka Samaranayake (TFHRC) in helping to prepare and evaluate the concrete mixtures is greatly
appreciated. The reviews of Dr. Kenneth Snyder (NIST) and Rick Meininger (FHWA) are gratefully acknowledged.
REFERENCES
Bentz D.P., Ferraris, C.F., De la Varga, I., Peltz, M.A., and Winpigler, J., “Mixture Proportioning Options for
Improving High Volume Fly Ash Concretes,” International Journal of Pavement Research and Technology, V. 3,
No. 5, 2010, pp. 234-240.
Bentz D.P., Sato, T., De la Varga, I., and Weiss, J., “Fine Limestone Additions to Regulate Setting in High Volume
Fly Ash Mixtures,” Cement and Concrete Composites, V. 34, No. 1, 2012, pp. 11-17.
Cost, V.T., “Concrete Sustainability versus Constructability – Closing the Gap,” 2011 International Concrete
Sustainability Conference, Boston, 2011.

Cost, V.T., and Bohme, P., “Synergies of Portland-Limestone Cements and Their Potential for Concrete
Performance Enhancement,” 2012 International Concrete Sustainability Conference, Seattle, 2012.
De la Varga, I., Castro, J., Bentz, D., and Weiss, J., “Application of Internal Curing for Mixtures Containing High
Volumes of Fly Ash,” Cement and Concrete Composites, V. 34, No. 9, 2012, pp. 1001-1008.
De Weerdt, K., Kjellsen, K.O., Sellevold, E., and Justnes, H., “Synergy Between Fly Ash and Limestone Powder in
Ternary Cements,” Cement and Concrete Composites, V. 33, No. 1, 2011a, pp. 30-38.
De Weerdt, K., Haha, M.B., Le Saout, G., Kjellsen, K.O., Justnes, H., and Lothenbach, B., “Hydration Mechanisms
of Ternary Portland Cements Containing Limestone Powder and Fly Ash,” Cement and Concrete Research, Vol. 41,
No. 3, 2011b, pp. 279-291.
Gurney, L., Bentz, D.P., Sato, T., and Weiss, W.J., “Using Limestone to Reduce Set Retardation in High Volume
Fly Ash Mixtures: Improving Constructability for Sustainability,” Transportation Research Record, No. 2290,
Concrete Materials 2012, 139-146, 2012.
Kadri E.H., Aggoun, S., De Schutter, G., and Ezziane, K., “Combined Effect of Chemical Nature and Fineness of
Mineral Powders on Portland Cement Hydration,” Materials and Structures, V. 43, No. 5, 2009, pp. 665-673.
Menendez G., Bonavetti, V., and Irassar, E.F., “Strength Development of Ternary Blended Cement with Limestone
Filler and Blast-Furnace Slag,” Cement and Concrete Composites, V. 25, No. 1, 2003, pp. 61-67.
Morris, W., Moreno, E.I., and Sagüés, A.A., “Practical Evaluation of Resistivity of Concrete in Test Cylinders
Using a Wenner Array Probe,” Cement and Concrete Research, V. 26, No. 12, 1996, pp. 1779-1787.
Mounanga P., Khokhar, M.I.A., El Hachem, R., and Loukili, A., “Improvement of the Early-Age Reactivity of Fly
Ash and Blast Furnace Slag Cementitious Systems Using Limestone Filler,” Materials and Structures, V. 44, 2011,
pp. 437-453.
Tanesi, J., Ardani, A., Meininger, R., and Nicolaescu, N., “Evaluation of High-Volume Fly Ash (HVFA) Mixtures
(Paste and Mortar Components) Using a Dynamic Shear Rheometer (DSR) and Isothermal Calorimeter,” Report No.
PB2012-112546, National Technical Information Service, Springfield, VA, 2012.