enhancing students’ performance in higher …
TRANSCRIPT

ENHANCING STUDENTS’ PERFORMANCE IN HIGHER EDUCATION THROUGH
LEARNING ANALYTICS IN TODAY’S EDUCATIONAL ECOSYSTEM
*Maria Saroja.M, **Nirmala Devi.A *Research Director &Associate Professor of Biological Science, St.Ignatius College of Education
(Autonomous), Palayamkottai.
**Principal,St.Ignatius College of Education (Autonomous), Palayamkottai.
ABSTRACT
Quality education is a mammoth task that requires a close partnership between all
stakeholders, policymakers, academia, industry, and NGOs to ensure inclusive and equitable
education and promote lifelong learning opportunities for all. Learning analytics are the
collection, analyses, and reporting of data around learning. The pervasive integration of
digital technology in higher education influences both teaching and learning practices. The
main goal of learning analytics is to support institutional, operational, and financial decisions
–making process. It also helps educators to examine, understand and support students’ study
behaviors and change their learning environment. This present paper focuses on the ways to
enhance student’s performance in higher education through learning analytics in today’s
educational ecosystem.
Keywords: Learning analytics, Digital technology, Learning environment, Educational
ecosystem
ntroduction
In quality education, the general purpose is
to offer programs and experiences, which
help learners to think and learn throughout
the progress (Patwa, N., Seetharamam, A.,
Sreekumar, K., &Phani, S.2018). A key
concern of Learning Analytics is the
gathering and analysis of data as well as
the setting of appropriate interventions
to improve the learners learning
experience (Greller et al. 2014).Learning
Analytics focuses specifically on the
process of learning. It also helps students
to develop skills and knowledge in more
personalized and self-paced way
(Siemens and Long 2011). Regarding
higher education, learning analytics and
big data help to create a better-blended
learning environment, which facilitates the
student learning process by providing a
handy range of technology and media in
collaboration with the traditional face-to-
face method of teaching in class.
According to a study conducted by Wong
(2017), learning analytics can support to
improve the education process based on
the six aspects such as improving student
retention, supporting informed decision
making, increasing cost-effectiveness,
understanding students learning behavior,
arranging personalized assistance to
students and providing timely feedback
and intervention. Knight, Shum, and
Littleton (2014) considered LA as an
emerging “research field and design
discipline”, specifically, a field of the
educational research that uses
computational techniques to capture and to
analyze learning-related data. Scheffel,
Drachsler, Stoyanov, and Specht (2014)
also stipulated LA as a multi-disciplinary
research field that is built upon the use of
data mining processes, information
retrieval, technology-mediated learning
environment, and visualization. Learning
analytics is having a huge positive impact
on the performance of a student in higher
education. (Daniel.B, 2015). In higher
education, learning gets enriched by
interactions of learners with instructors or
teachers. Many teachers spend numerous
hours to design courses and curriculum to
maximize the learning from this
interaction. This paper focuses on
enhancing students’ performance in higher
education through learning analytics in
today’s educational ecosystem.
Learning Analytics in today’s
Educational Ecosystem

Today there is a huge demand for
innovative learning and professional
development, with a strong impact on both
academia and industry. This demand is
intertwined with the move towards new
modes of new ubiquitous learning
technologies. Contemporary learning
systems and their analytics are only a
subset of different kinds of learning
materials and learning tools that an
educator should take into consideration,
and most importantly they do not offer an
overview of the different learning
experiences and dynamics. In higher
education, learning analytics is gaining
more and more importance, due to the new
possibilities which are arising in the field
of data collection. Further, that will save
time and money for the institutions since
they target the right type of students and
don’t need to expand their research to find
the right students. (RubelA. &Jones, K.M,
2016). Institutions can better analyze,
whether a student is at risk, analyze their
performance and help the students in need.
That decreases the rate of dropouts and
increases the number of graduates. With
the help of analytics, we can find the root
of the most prominent problems of their
students and can use that discovery to
improve the student’s knowledge in those
courses and help them to succeed. (Dietz-
uhier, B., & Hurn, J.E, 2013).Also,
learning analytics is having a huge positive
impact on the performance of a student in
higher education. Greller and Drachsler
(2012) developed a framework that
includes six critical dimensions related to
an LA initiative. Each of the dimensions
must be addressed to institutionalize an
LA initiative successfully. Fig:1
Enhancing Educational performance
through learning analytics:
Some researchers specified that higher
education has to include the analytics tool
into the system to improve productivity. It
provides feedback to learners and teachers
about educational performances (Daniel
2016). Following are the useful methods
can be followed by the institution to
enhance student’s performance through
Learning Analytics.
1. Feedback: Learners often might fail at a
particular subject but do not know what
the reason was. It becomes valuable, even
necessary in fair educational activities
when the learner can look not just at
himself and his actions, but at other
colleagues who have had the same or
similar experience. Providing feedback to
students is an important role of teachers in
any educational setting. This process
enables students to learn from their actions
and can have a significant impact on the
motivation of the learners. Dodge et
al(2015) report that interventions through
emails to the students work best and found
External Constraints Internal Limitations
Competences Norms Conventions Acceptance
Institution
Teachers
Learners
Other
Reflection Prediction
Objectives
Sta
keh
old
ers
Learning Analytics
Technology
Algorithm
Theories
Other
Instr
um
en
ts
Open Protected
Data

that such an approach impact student
achievement. The improvement of
electronic learning modules supports the
evaluation of learners in logical, real-time
ways. To predict learner outcomes such as
dropping out, needing extra help, or being
capable of more demanding assignments,
this approach can analyze underlying
patterns.(Daud et al.2017) Pedagogic
approaches that seem most effective with
particular learners could be identified and
after that applied adequately.
2. Tracking: To understand the real
learning patterns and activities of learners
more effectively tracker devices can be
used for teachers, by allowing them to
track a learner’s experience in an e-
learning course. In observing the digital
paths learners leave overdue. Teachers can
track learners’ passage during the whole
learning experience within a particular
topic, some bigger portion of teaching
material or even during the whole course.
As Sclater et al(2016) note, after
conducting the analysis notifications were
automatically generated and send to
students and their parents on student’s
performance.
3. Efficiency: LA can save many hours of
time and effort, when applying strategies
and try to achieve various goals. This
means students can receive better support
from lecturers, and take greater control of
their learning progress.Star and
Collette(2010) report that knowing the
circumstance and understanding the
causes, the instructor can increase the
retention rate.After analyzing the students'
study results, demographics and social
data, instructors can identify who needs
assistant most to provide individual
counseling ( Karkhanis&Dumbre 2015).
4. Understanding the learning process: By using LA in e-learning, teachers can
see which parts of a course were too easy
and which parts were too difficult that the
learner has failed to solve.
5. Collaboration: Experts from many
different fields (Education, Pedagogy,
Psychology, Cognitive Sciences,
Engineering, Computer Science especially
from Artificial Intelligence and Data
Mining Fields, Instructional Design and so
on) have to come together to retain a
Learning Management System function at
its best. Recently the most important part
of educational systems and environments
is Human-Computer interaction. It should
offer a learner-friendly, highly functional
and pleasant interface to communicate
with the system and easily use teaching
material. This encourages high-level and
quality cooperation, powerful teamwork,
and an interdisciplinary and
multidisciplinary approach throughout all
educational stages and processes.
6. Personalization: LA can also be
effective in guiding teaching material
designers and designers of e-learning
systems by allowing them to personalize
courses to adjust their learners' individual
needs. This will allow developers of e-
learning systems and educational
environments to promote the standard for
effective and exceptional e-learning
courses.
Learning analytics in Institutions:
Learning Analytics in universities and
institutions is to improve inter-institutional
cooperation and the development of an
agenda for the large community of
students and teachers. Some important
features that LA offers to institutions are
listed below (Klaninja-Milicevic
,2017;Daniel, 2015; Siemens, 2011).
● Assisting in creating a common sense of
complex educational topics and content
through the combination of social,
technical, and information networks.
Algorithms can recognize and provide
insight into data and at-risk challenges.
● Innovating and transforming the college
and university system and functioning, in
addition to already existing educational
models and pedagogical approaches.
● Improving and make faster and more
efficient administrative decision-making
processes and effectiveness of
organizational resource provision.

● Helping leading institutions, educational
policymakers, and educational authorities
transition to holistic decision-making
through analyses of “what-if” scenarios.
● Exploring how different components
within a complex discipline (e.g.,
remembering learners, decreasing costs)
connects and discovers the influence of
varying essential components.
● Increasing administrative efficiency,
effectiveness, and productivity by
providing up-to-date information and
allowing fast and as much as the possible
proper reaction to challenges.
● Constant testing and evaluation of
curricula and prompt reactions if some
parts have to be changed and/or improved.
● Helping official leaders to control the
hard (e.g., research, patent) and easy (e.g.,
quality of teaching, reputation, profile,)
value created by faculty and university
activities.
● Evaluating typical and widely spread
grading techniques, instruments, and
practices (i.e., departmental and licensing
exams).
Smart Learning Analytics
Today’s role of analytics on helping
individuals to make sense of the learning
procedures, and smart environments on
providing feedback and diverse “smart”
functionalities, have drawn the interest of
many scholars and practitioners. (Daniel
B.2015). Video and multimedia
technologies are becoming more
prominent in the world of education. Most
of today’s learning environments have
video affordances. Also, advanced video
repository systems have seen enormous
growth through social software tools and
the possibilities to enhance videos on
them.
• Video learning analytics: Millions of
learners enjoy video streaming from
different platforms on a diverse number of
devices (desktop, smartphone, tablets) and
create a large volume of interactions. This
amount of learning activity might be
converted via analytics into useful
information for the benefit of all video
learners.
Learning Analytics Dashboard
Applications
Learning analytics dashboards can
be defined as a form of “personal
informatics” applications. These
applications track students’ log-files and
collect personal data about different
characteristics of behavior patterns,
interests, habits, feelings, which encourage
user self-knowledge by making available
tools for the review and analysis of their
personal history. In the field of higher
education, dashboard applications can
support learners and teachers in online and
blended learning or traditional face-to-face
teaching. Such dashboards provide
graphical representations of the current
and historical state of a learner or a course
to enable flexible decision making.
Conclusion
Learning Analytics is a definitively
promising research field, which provides
new and innovative methods, tools and
platforms that influence researchers in
Technology Enhanced Learning. Higher
education institutions are applying LA to
improve the facilities they provide for
students but also other educational
stakeholders and to improve observable
and measurable learning outcomes Smart
learning has become a new term to
describe technological and social
developments (e.g., Big and Open Data,
Internet of Things, RFID, and NFC) to
enable effective, efficient, engaging and
personalized learning. Collecting and
combining learning analytics coming from
different channels can provide valuable
information in designing and developing
smart learning. The role of learning
analytics in education helps individuals to
make sense of the learning procedures and
develop the smart learning environment.
Towards this direction research on Smart
Learning Analytics is expected to play a
critical role and shape the future of
environments and analytics for learning.

References
1. Daniel, B. (2015). Big data and
analytics in higher education:
Opportunities and challenges. British
Journal of Educational Technology,
46, 904–920.
2. Daniel, B. K. (Ed.). (2016). Big data
and learning analytics in higher
education. Current theory and
practice. Springer.
3. Daud, A., Aljohani, N. R., Abbasi, R.
A., Lytras, M. D., Abbas, F., &
Alowibdi, J. S. (2017). Predicting
student performance using advanced
learning analytics. In Proceedings of
the 26th International Conference on
World Wide Web Companion
4. Dodge, B., Whitmer, J., & Frazee, J. P.
(2015). Improving undergraduate
student achievement in large blended
courses through data-driven
interventions. In Proceedings of the
Fifth International Conference on
Learning Analytics and Knowledge
, (pp. 412-413). ACM.
5. Greller, W., Ebner, M., & Schön, M.
(2014) Learning analytics: From
theory to practice–data support for
learning and teaching. Computer
Assisted Assessment Research into E-
Assessment, Springer International
Publishing, pp 79-87.
6. Greller, W., & Drachsler, H. (2012).
Translating learning into numbers: A
generic framework for learning
analytics. Educational Technology &
Society, 15(3), 42–57.
7. Klaninja-Milicevic, A., Ivanovic, M., &
Budimac, Z. (2017). Data science in
education: Big data and learning
analytics. Computer Applications in
Engineering Education, 25(6), 1066–
1078.
8. Knight, S., Buckingham Shum, S., &
Littleton, K. (2014). Epistemology,
assessment, pedagogy: where learning
meets analytics in the middle space.
Journal of Learning Analytics, 1(2),
23-47.
9. Li, I., Dey, A., & Forlizzi, J. (2010). A
stage-based model of personal
informatics systems. In Proceedings of
CHI10: 28th International Conference
on Human Factors in Computing
Systems, (pp. 557–566), New York.
10. Long, P. (2011). LAK’11: Proceedings
of the 1st International Conference on
Learning Analytics and Knowledge,
March, 2011, Banff, Alberta, Canada,
ACM.
11. Karkhanis, S. P., & Dumbre, S. S.
(2015). A study of application of data
mining and analytics in education
domain. International Journal of
Computer Applications, 120 (22).
12. Patwa, N., Seetharaman, A.,
Sreekumar, K., & Phani, S., (2018).
Learning analytics: Enhancing the
quality of higher education. Research
Journal of Economics, 2(2), 1-7.
13. Rubel, A., & Jones, K. M. (2016).
Student privacy in learning analytics:
An information ethics perspective. The
Information Society, 32, 143-159.
14. Sclater, N. (2016). Developing a code
of practice for learning analytics.
Journal of Learning Analytics, 3(1),
16-42.
15. Scheffel, M., Niemann, K., Leony,
D., Pardo, A., Schmitz, H. C.,
Wolpers, M., & Kloos, C. D. (2012).
Key action extraction for learning
analytics. In European Conference on
Technology Enhanced Learning.
Springer Berlin Heidelberg. pp 320-
333.
16. Siemens, G., & Long, P. (2011)
Penetrating the fog: Analytics in
learning and education. EDUCAUSE
review, 46(5), 30-40
17. Star, M., & Collette, L. (2010). GPS:
Shaping student success one
conversation at a time. Educause
Quarterly, 33(4).
18. Wong, B. T. M (2017). Learning
analytics in higher education: An
analysis of case studies. Asian
Association of Open Universities
Journal, 12(1), 21-40.

AWARENESS OF INFERTILITY PROBLEMS IN RELATED TO
LIFESTYLE FACTORS AMONG STUDENT TEACHERS
*Bindhu. K.C. *Associate Professor and Head, Department of Education, Mother Teresa Women’s University,
Kodaikanal
ABSTRACT
The status of health is an important indicator reflecting social development and the quality of
human life. Since health refers to the general condition of an organism resulting from the
interaction with the environment. The environment of the individual is continuously changing
and he has to undergo a continuous process of adjustment so as to be continuously healthy.
Infertility is the most common reproductive health problems that affect a large population of
the young population. There is a great relationship between infertility and lifestyle factors.
Environmental hazards and occupational exposures have putative threats to the general and
reproductive health. The main objective of the study was to find out the awareness of
infertility problems in related to lifestyle factors among student teachers. Survey method was
adopted in this study. The sample consists of 300 student teachers from various colleges
affiliated to Tamilnadu Teachers Education University. ’t’- test and ‘r’ were used for
analyzing the data. The present study revealed that there was a significant positive correlation
between infertility and life style factors among student teachers.
Keywords: Life style factors, Infertility, Reproductive health
Introduction
An industrialized society can be
characterized as one which influences the
everyday life of its inhabitants in nearly
each and every aspect. Not only in the
division of time in the day pretty well
fixed, but also the way one spends that
time is virtually foreseeable. What to do in
the working place or at school, when to
watch TV, when to go to sleep, are
activities which are repeated every day in a
similar fashion. This is not because of the
lack of imagination, but rather because of
requirements placed in people by various
social agencies. Even holidays are spent
using organizations for mass tourism.
Much of individual responsibility for life
has been taken is by anonymous bodies,
social and state agencies. Further, health
care is one of the most basic human rights,
vital for preservation and promotion of
health (Article 25 of the universal
declaration of human rights). Women’s
health is particularly susceptible to
reproductive problems. The focus is on
“Special Sexual and Reproductive Needs”
and attention on “life cycles” instead of
“experiences” thus, there is a danger of
privileging the sexual and biological
definition of women. Women’s special
needs in health arrive out of particular
contexts of gender, race and economic
inequality. It is recognized that
reproductive health is a crucial part of
general health and is central to human
development. Infertility is a major
reproductive health problem affecting a
huge proportion worldwide. The WHO has
defined a healthy lifestyle as a series of
behaviors ensuring an individual physical
and mental health. While the physical
quality of life encompasses nutrition,
physical activity, sleep, mental quality of
life deals with inquiry and learning and
spirituality. Numerous factors have been
associated with reduced fertility problems
that cover demographics (e.g. age),
reproductive history (e.g. menstrual cycle
characteristics, history of pelvic surgery)
and current lifestyle habits (e.g. alcohol
consumption, smoking). There is an
increasing body of evidence that lifestyle
factors can impact reproductive
performance. For example, studies have
demonstrated that smoking in women
significantly decreases the chance of
conception. Lifestyle and infertility go

hand in hand. Both have become an
integral part of each other. There is a
tremendous change in the lifestyle in this
era and people seem to have lost all health
and hygienic practices.
Statement of the problem
“Awareness of Infertility Problems Related
to Lifestyle Factors among Student
Teachers. ”
Need for the study
Infertility is a global health issue, affecting
approximately 8-10 percent of couples
worldwide. The 1981 census of India
estimated infertility to be in the range of 4-
6 percent. A global review of infertility
from the world fertility survey and others
estimated similar rates of infertility in
another city in South Asia. Infertility has
been relatively neglected both as a health
problem and as a subject for Social
Science Research in South Asia, as in the
developing world more generally, the
general thrust of both programs and
research has been on the correlates of high
fertility and its regulation, rather than
understanding the context of infertility, its
causes, and consequence. It is estimated
that globally infertility affects between 50-
80 million couples at some point in their
reproductive lives, and has a variety of
biological and behavioral determinants
(UNFPA 1999). As a matter of fact, the
general changes in women’s belief and
view about their role in modern society
makes it easier for them to ask help in an
assisted reproduction center. In addition,
the entry of women in the professional
arena, the high professional competition,
and the effort to obtain a comfortable life
and financial security are important factors
that lead to delayed childbearing.
Specifically, women who have very high
career goals, often try to delay pregnancy
by using contraceptives for a very long
time, which unfortunately have negative
effects on a couple’s fertility. Finally, the
daily stress and the new high demanding
way of living have adverse effects on the
reproductive capacity. Besides the health
problems related to female anatomy,
another major factor that causes infertility
is smoking. Other causes that are likely to
cause infertility, but not explored in this
study, are diseases affecting the function
of the ovaries, dietary problems such as
excessive increase or decrease in body
weight, exposure to radiation, chemical
agents, cytotoxic drugs and psychological
causes.
Objectives of the study
• To find out the awareness of infertility
among student teachers
• To find out the lifestyle among student
teachers.
• To find out the relationship between
lifestyle and awareness of infertility
among student teachers.
Hypotheses of the study
• There is no significant difference in the
infertility awareness of student teachers
based on the type of college.
• There is no significant difference in the
infertility awareness of student teachers
based on the nature of college.
• There is no significant difference in the
infertility awareness of student teachers
based on the locality of college.
• There is no significant difference in the
infertility awareness of student teachers
based on age.
• There is no significant difference in the
lifestyle of student teachers based on the
type of college.
• There is no significant difference in the
lifestyle of student teachers based on the
nature of college.
• There is no significant difference in the
lifestyle of student teachers based on the
locality of college.
• There is no significant difference in the
lifestyle of student teachers based on age.
Title of the study
The title of the present study is framed as,
“Awareness of Infertility Problems in
Relation to Lifestyle Factors among
Student Teachers in Madurai District”
Operational definitions

Awareness – Awareness is the ability to
directly know and perceive, to feel or be
cognizant to an event
Infertility – Infertility is the inability of a
person to reproduce by natural means.
Lifestyle – Lifestyle is someone’s way of
living.
Student teachers- Student teachers are the
trainees who have enrolled for the B.Ed.,
program
Method of study: The researcher
analyzed the possibilities of various
methods of research and selected the
survey method to study the present study.
The population of the study: For the
present study the population consists of
B.Ed students from various colleges
affiliated to Tamilnadu Teachers
Education University in Madurai district.
Sample of the study
The sampling technique employed in the
present study was purposive/cluster
sampling. 300 student teachers were taken
as the sample for the study. The students
in the sample belong to various B.Ed
colleges, and the stratifications were made
based on their age, type of institution,
nature of the institution and locality of the
institution.
Research tool
Infertility Awareness Inventory And
Lifestyle Inventory were used for the
present study, this scale was developed by
Bindhu K.C(2017).
Statistical techniques used
The investigator used the descriptive
statistical measures based on the
characteristics of the sample or population
in totality. The investigator analyzes the
hypotheses based on the computation of
Mean, Standard Deviation ‘t’ test and
‘r’.Data Analysis and Interpretation
Table-1: Statistical measures and results
of test of significance of difference
between the mean scores of infertility
awareness among student teachers
based on the background variables
Back
gro
un
d
Vari
ab
les
N
Mea
n
SD
‘t’
Valu
e
Level
of
Sig
nif
ican
ce
Type
of
Coll
ege
Govt
Aided
150 139.67 10.91 1.275 NS
Private 150 138.01 11.57
Nat
ure
of
Inst
ituti
on Women 150 132.82 10.18 1.668 NS
Co-Ed 150 138.09 14.53 L
oca
lity
of
Co
lleg
e
Rural 100 139.16 11.12 0.247 NS
Urban 200 138.82 11.30
Ag
e
Below
25
243 139.66 11.01 0.650 NS
Above
25
57 137.94 11.47
The table 1 shows the infertility awareness
of the student’s teachers based on their
type of college, nature of the institution,
locality of college and based on the age.
The obtained’ values are 1.275,
1.668,0.247 and 0.650 lesser than the table
value 1.96 at 0.05 level of significance.
This shows that there is no significant
difference between the mean scores of
infertility awareness among student
teachers based on the type of college,
nature of the institution, locality of college
and based on the age.
Table-2 : Statistical measures and
results of test of significance of
difference between the mean scores of
lifestyle based on background variables.

The table 2 shows the life style of the
students teachers based on their type of
college, nature of the institution, locality of
college and based on the age. The
obtained’ values are 1.668, 1.668, 0.267
and 0.473 lesser than the table value 1.96
at 0.05 level of significance. This shows
that there is no significant difference
between the mean scores of life style
awareness among student teachers based
on type of college, nature of the institution,
locality of college and based on the age.
Table-3: Correlation between infertility
awareness and life style.
Variable N Mean ‘r’
value
Infertility
awareness
among student
teachers
300
139.91
0.948
Lifestyle
among
student
teachers
300
138.93
From the above table it is inferred that the
calculated ‘r’ value is 0.948. It imparts
that there is significant strong positive
relationship between infertility awareness
and lifestyle among student teachers. This
shows that there is a significant positive
relationship between infertility awareness
and lifestyle among student teachers.
Discussion
The present study was aimed to
study the awareness of infertility and
lifestyle of student teachers in Madurai
district. Findings of the study state that
there was no significant difference in the
infertility awareness and lifestyle of
student teachers. The study also proved
that there is a significant positive relation
between infertility awareness and lifestyle
of student teachers. This can be due to the
prevailing awareness about reproductive
health. Health education has been made as
a paper for the student teachers which
imparts them a healthy way of living.
Similarly, there is a wide range of
awareness for student teachers right from
their home to school. They learn from
what they see in and around them. There
are a lot more choices for students to learn.
Learning happens mostly in all instances.
The lifestyle of people has been influenced
a lot by globalization and westernization.
These concepts have influenced the life of
youngsters a lot and this, in turn, has
brought a huge impact on the lifestyle.
These impacts over lifestyle have brought
effects that lead to infertility. Through this
research, the researcher has found out that
infertility awareness influences lifestyle.
By being aware of infertility, one can alter
the lifestyle and live a healthy life. This
awareness is found to have been good
among student teachers. Hence they can
able to show up better with a good and
healthy lifestyle.
Conclusion
Infertility nowadays has become a
common factor experienced by most
women in society. This can be due to the
lifestyle changes that have been adopted
by people. Changes in food style act as the
major factor for infertility. An individuals
Back
gro
un
d
Vari
ab
les
N
Mea
n
Std
.
Dev
iati
on
‘t’
Valu
e
Lev
el o
f
Sig
nif
ican
ce
Type
of
Coll
ege
Govt
Aided
15
0
352.8
3
14.16 1.668 NS
Privat
e
15
0
358.0
9
10.18
Nat
ure
of
Inst
ituti
on Women 15
0
353.8
2
10.18 1.668 NS
Co-Ed 15
0
352.0
9
14.53
Loca
lity
of
Coll
ege
Rural 10
0
364.1
9
16.29 0.267 NS
Urban 20
0
364.7
8
18.59
Ag
e
Below
25
24
3
364.1
6
17.51
7
0.473 NS
Above
25
57 365.1
5
18.30
5

need to be cautious about the lifestyle
followed by him/ her. A healthy lifestyle
can be adopted to live a happy life. The
parents and teachers need to put necessary
actions in order to build a healthy lifestyle.
References
1. Aggarwal, J. C. (2008). Essentials of
educational psychology(2nd ed.).
Vikas publishing house private
limited.
2. Bhandarkar, K. M. (2007). Statistics
in education. Neelkamal publication
private limited.
3. Chandra, Shivendra, S., Sharma, &
Rajendra, K. (1991). Research in
education. Atlandic publishers.
4. Chakraworthy, K. (2006). Research
methodology. Sumit enterprises.
5. Chauhan, S. S. (2007). Advanced
educational psychology(7th ed.).
Vikas publishing house private
limited.
6. Dennis, C. (1973). Psychology and
the teacher. Holt rinehart and
Winston.
7. Eraut, M. A. (1989). The
International encyclopedia of
educational psychology. Pergamon
press.
8. Gupta, C. B. (1996). An introduction
to statistical methods. Vikas
publications house private limited.
9. Gupta, S. P. (2009). Statistical
methods. Sulthanchand and sons.
10. John, W. B. (2007). Research in
education. Prentice hall of India
private limited.
11. Kothari, C. R. (2000). Research
methodology. Wishwaprakashan
private limited.
12. Logesh, H. (2008). Methodology of
educational research. Vikas
publishing house private limited.
13. Mangal, S. K., (2010, October).
Statistics in psychology and
education(2nd ed.). PHI learning
private limited.
14. Mangal, S. K. (2007). Advanced
educational psychology(2nd ed.).
Prentice hall of India private limited.
15. Nagarajan, N. S., & KaliyaPerumal,
D. K. (2008). Research methodology.
SKM publications.
16. Panneerselvam, R. (2010). Research
methodology. PHT learning private
limited.
17. Radha Mohan. (2010). Research
methods in education. Neelkamal
publications private limited,
Educational publishers.
18. Robert, B. A. (2000). Psychology.
Prentice hall of India.
META COGNITIVE SKILLS OF HIGHER SECONDARY STUDENTS
*Balasubramanian.R, **Manivannan.M *Research Scholar, Tamil Nadu Open University, Chennai
**Prof & Head, School of Education, Tamil Nadu Open University, Chennai
ABSTRACT
Metacognitive skills prepare students for lifelong learning and those skills are developed
during childhood. Teens tend to have relatively strong metacognitive abilities compared to
young children. Just as teens are still developing cognitively, however, they are also
continuing to experience metacognitive developments. The present study investigates the
significant difference between the metacognitive skills of higher secondary students
concerning the locality of the students and the medium of instruction. The sample for the
study is chosen based on a random sampling technique using a survey method. The sample
consists of 300 higher secondary students in Thoothukudi district. Metacognitive tool
developed by the investigators. The metacognitive scale included five dimensions namely
planning, monitoring, controlling and regulating, strategy use and evaluation. The findings
were (i) there was a significant difference between rural and urban students (ii) there was a
significant difference between English and Tamil medium students in metacognitive skills
and its dimensions.
Keywords: Metacognitive abilities,Metacognitive skills, Higher secondary students

Introduction
Metacognition is thinking about thinking.
It is an increasingly useful mechanism to
enhance student learning, both for
immediate outcomes and for helping
students to understand their learning
processes. So meta cognition is a broad
concept that refers to the knowledge and
thought processes regarding one's learning.
Teachers who use meta cognitive
strategies can positively impact students
who have learning disabilities by helping
them to develop an appropriate plan for
learning information, which can be
memorized and eventually routine. As
students become aware of how they learn,
they will use these processes to efficiently
acquire new information, and
consequently, become more of an
independent thinker. A Learner begins
with goal-setting and planning, taking into
account his or her time constraints,
strengths, and weaknesses relevant to the
learning task, and motivation for learning.
Having set reasonable goals and planned
his or her learning strategies, the learner
then implements his or her plan,
monitoring the results as he or she studies.
If the chosen strategies are working well,
he or she continues; if not, he or she makes
adjustments and monitors the results until
they are in line with his or her learning
goals.
Need for the Study
Metacognition plays an important role in
numerous aspects of higher educational
learning strategies. Meta cognition can be
defined simply by thinking about thinking,
it is implied that learners who are
metacognitively aware have strategies for
knowing what to find out or what they
need to do. The implementation of meta
cognitive strategies can lead to more stable
learning and improved performance. The
improvement of education involves the
development of thinking, reasoning, and
problem-solving skills to prepare students
to participate in making and evaluating
knowledge claims, explanations, models,
and design a scientific experiment. Various
opinions that support the statement that the
Problem Based Learning (PBL) provides a
learning environment that is appropriate to
increase metacognitive learners and
scientific reasoning.
Objectives of the Study
To find out whether there is any significant
difference between rural and urban higher
secondary students in their metacognitive
skills and dimensions.
To find out whether there is any significant
difference between English and Tamil
medium students in their metacognitive
skills and its dimensions.
Methodology
The researcher adopted the survey method
to study the metacognitive skills of higher
secondary students. The population for the
present study consisted of 300 higher
secondary students in Thoothukudi district.
A random sampling method was adopted
for this study. The investigators used the
self-made tool Metacognitive Scale (MS)
(2019). The investigators used a
percentage analysis and 't’test for this
study.
Data Analysis
Table-1:The significant difference
between higher secondary students in
their metacognitive skills and its
dimensions concerning the locality of
the institution
Dim
en
sio
ns
Ca
teg
ory
Co
un
t
Mea
n
SD
‘t’
- V
alu
e
Resu
lt
Planning Rural 164 20.9573 7.68981 9.548 S
Urban 136 27.5075 3.84032
Monitoring Rural 164 31.7256 4.03562 1.651 NS
Urban 136 32.5373 4.36951
Controlling
and
Regulating
Rural 164 28.0366 3.88783 .335 NS
Urban 136 28.2090 4.80456
Strategy
Use
Rural 164 26.5244 4.42726 3.829 S
Urban 136 28.4104 4.06195
Evaluation Rural 164 19.8963 9.03885 10.121. S
Urban 136 12.3731 2.69968
(At 5% level of significance, the table
value of ‘t’ =1.96)

It is inferred from the above table
that the calculated 't' value is greater than
the table value. Therefore, there is a
significant difference between rural and
urban higher secondary students in the
dimensions of planning, strategy use and
evaluation concerning the locality of
institutions. Comparing the mean scores
urban students have more metacognitive
skills than the rural higher secondary
students in the dimension of Planning and
Strategy using. Rural students have more
metacognitive skills than urban students in
the dimension of evaluation. There is no
significant difference between urban and
rural higher secondary students in the
dimensions of monitoring, controlling and
regulating.
Table-2: The significant difference
between higher secondary students in
their metacognitive skills and its
dimensions concerning the medium of
instructions
Dim
ensi
on
s
Cate
gory
Cou
nt
Mea
n
SD
‘t’
- V
alu
e
Resu
lt
Planning English 181 21.6243 7.52716 8.515 S
Tamil 119 27.4538 4.30362
Monitoring English 181 31.7790 4.08871 1.468 NS
Tamil 119 32.5210 4.40695
Controlling and Regulating
English 181 27.7680 4.02372 1.651 NS
Tamil 119 28.6303 4.67025
Strategy
Use
English 181 26.3260 4.18978 5.272 S
Tamil 119 28.9160 4.14479
Evaluation English 181 18.5525 9.15750 6.939 S
Tamil
119 13.3277 3.51295
(At 5% level of significance, the table
value of ‘t’=1.96)
It is inferred from the above table
that the calculated 't' value is greater than
the table value. Therefore, there is a
significant difference between English and
Tamil medium higher secondary students
in the dimensions of planning, strategy use
and evaluation concerning medium of
instruction comparing the mean scores
Tamil medium students have more
metacognitive skills than the English
medium higher secondary students.
Comparing the mean scores English
medium students have more metacognitive
skills than the Tamil medium higher
secondary students in the dimension of
evaluation. There is no significant
difference between English and Tamil
medium higher secondary students in the
dimensions of monitoring, controlling and
regulating.
Educational Implications
1. Teachers can encourage the students
coming from rural backgrounds to reflect
on their learning processes and strategies.
2..Teachers can foster independent
learning by asking learners to generate
their questions and answer them to
enhance comprehension.
3..Teachers can teach appropriate
metacognitive strategies as a part of a
training course.
4. Cooperative problem solving can
enhance metacognitive strategies by
discussing possible approaches with peer
groups and learning from each other.
5. To teach learners how to think aloud
and report their thoughts while performing
a difficult task.
6. Self-explanation in writing or speaking
can help learners to improve their
comprehension of a difficult subject.
7. When learners are allowed to make
errors while in training, such as during
simulations, it stimulates reflection on the
causes of their errors.
Conclusion
The educational phenomenon is a struggle
for individuals to gain the desired
behaviors. However, many factors are
influential in the realization of education
and during the learning process of
individuals. Some of them are related to
the environment in which individuals live,
while others are associated with
themselves. Even if the same curriculum is
applied, individual differences exist in
outcomes and productivity. One of the
reasons for this is the metacognitive
thinking skill of the individuals. To
conclude, metacognition is a set of skills

that enable learners to become aware of
how they learn and to evaluate and adapt
these skills to become increasingly
effective at learning. Our results indicate
that merely exposing students to a variety
of study strategies and providing
monitoring exercises are not enough to
ensure students' application of the theories
and the effective study strategies. More
intensive intervention is needed for
students to not only understand but also
master the recommended strategies. So
meta cognitive strategies are a gift that can
last forever which provides people with a
new and improved learning experiences.
References
1. Desoete, A., Roeyers, H. & Buysse, A.
(2001). Metacognition and mathematical
problem solving in grade 3. Journal of
Learning Disabilities, 34, 435-449.
2. Desoete, A. & Ozsoy, G. (2009).
Introduction: Metacognition, more than the
lognes monster?. International Electronic
Journal of Elementary Education, 2 (1), 1-
6.
3. Flavell, J. (1979). Metacognition and
cognitive monitoring: A new area of
cognitive developmental inquiry.
American Psychologist, 34, 906-911.
4. Fleming, S. M., Dolan, R. J., & Frith,
C. D. (2012). Metacognition:
Computation, biology and function.
Philosophical Transactions of the Royal
Society of London. Series B, Biological
Sciences, 367, 1280–1286.
5. Harrison, G. M., & Vallin, L. M.
(2017). Evaluating the metacognitive
awareness inventory using empirical
factor-structure evidence. Metacognition
and Learning, Advance online publication,
4 (6), 40-52.
6. Hillsdale, N. J., Cross, D. R. & Paris,
S. G. (1988). Developmental and
instructional analyses of children’s
metacognition and reading comprehension.
Journal of Educational Psychology,
80(2), 131-142.
7. Khan, F. A., & Khan, S. A. (2013).
Metacognitive reading strategies in
relationship with scholastic achievement in
science of IX standard students of english
medium schools in Aurangabad city. MIER
Journal of Educational Studies, Trends &
Practices, 3(1), 119-129.
8. Rezvan, S., & Ahmadi, S. A., & Abedi,
M. R. (2007). The effects of metacognitive
training on the academic achievement and
happiness of Esfahan university
conditional students. Journal of
Counselling Psychology, 19(4), 415-428.

RELATIONSHIP BETWEEN SOCIAL MEDIA SUPPORT AND ORGANIZATIONAL
PERFORMANCE OF HIGH SCHOOL SCIENCE TEACHERS
*Nancy. A, ** Denisia. S.P * Ph.D., Research Scholar, Department of Education, Mother Teresa Women’s University,
Kodaikanal
** Research Supervisor, Professor and Director (Retd.), Department and Centre for Women’s Studies, Mother Teresa Women’s University, Kodaikanal
ABSTRACT
This research article focuses its attention on the social media support of high school
science teachers and its influence on their organizational performance. The
investigators used the survey method using self-constructed questionnaires for
measuring social media support and organizational performance; the data were
collected from the sample selected for the study. All the high school science teachers
in Tiruneveli district formed the population of the present study. From the
population, the investigators randomly selected 146 teachers using a simple random
sampling technique. Mean, Standard Deviation, ‘t’ test, F test and Pearson’s Product
Moment Correlation were used to analyze the data. The findings revealed that the
social media support of high school science teachers is significantly correlated with
their organizational performance.
Keywords: Social media support, Organizational performance, Science teachers.
Introduction
In this digital world, people have
been using information technology
enormously to communicate with others at
all times. Even in the hands of children,
we can find electronic gadgets. The
students are equipped with digital gadgets
because the Internet is being used
extensively at the very lowest cost and
they use it for sending SMS, reading news
and reviews, browsing for material
collection, connecting with friends,
keeping themselves updated, etc.
Nowadays, teachers are using different
social media applications like Whatsapp,
Instagram, Facebook, Twitter, etc. Social
media helps the teachers not only to
acquire knowledge from various resources
but also establishing a cordial relationship
with the students, and their parents, using
Facebook, Whatsapp, Twitter, Instagram,
etc. Using these social media sites, the
teachers can help the students to solve
problems, clarify their doubts, hosting
questions and answers (Boyd, D.M., &
Ellison, N.B., 2007). Internet is nothing
but a network of networks connected
through modems, routers, etc., and plays
an important role in the teaching-learning
process (Rather, A.R., 2014). School is a
formal institution organized by the
government departments or private parties
as an effort to equip the younger
generation by providing knowledgeable
and skilled or trained professionals with all
possible skills and talents along with the
moral characteristics. By formulating and
implementing various educational
objectives, the school authorities such as
headmasters/ principals, teachers,
administrative staff members and, the
students are involved in the general
functioning of the school (Markos,
2010). All these individuals with different
backgrounds when they unite themselves
in one premise may be called as the school
organization. Every individual within the
school organization interacts with each
other, making human relationships with
each other to create a pleasant working
environment and to make each individual
or organization member feel comfortable
and joyful in working to improve
organizational performance (Puteh et al,
2014). It helps the teachers and their
students to learn more and more from the
World Wide Web. Other than this, the
schools and education departments use the
internet for different purposes like sending
circulars, collecting relevant data, posting

common notices and other information to
one or more persons.
Need and Significance of the Study
Social media is the best way of
learning, whereas the students learn
through concentration of mind on
essentials, choosing merely those which
are useful, rejecting the rest as undesirable
because they want the short-cuts to
learning successfully, the students learn
naturally with all the senses active and
eager, receiving the perpetual stream of
ideas which comes from the heart of the
teacher, pooling the facts and knowledge
by such scattering of mental as well as
physical energy through surprises with
their ever alert attention. Still, now, there
are hesitations among the educational
thinkers to revise the curriculum based on
the latest innovations like social media.
This should be waived up and studies
should be done on the implementation of
such methods of teaching and learning to
develop the present-day curriculum, which
may also improve the overall
organizational performance of the teacher
communities. Hence, the investigators
opines that the present study may yield
various recommendations to different
personalities involved in the teaching-
learning process to adopt the novel
teaching strategies with the help of social
media support to perform well in their
teaching profession. Hence, the problem
of the study is stated as under:
Title of the Study
“Relationship between Social Media
Support and Organizational
Performance of High School Science
Teachers”.
Definition of the key terms
Social media support-By this; the
investigators refers to the usage of social
media applications for the teaching-
learning process. Here, it is the score
obtained by the high school science
teachers on the social media support
questionnaire prepared and validated by
the investigators.
High school science teachers-
By this, the investigators refers to the
teachers handling classes IX and X for the
subject - science.
Organizational Performance-By this,
organizational performance comprises the
actual output or results of an organization
as measured against its intended outputs
(or goals and objectives). Here, it is the
score obtained by the high school science
teachers on the Organizational
Performance Questionnaire prepared and
validated by the investigators.
Objectives
1. To find the level of social media
support of high school science
teachers.
2. To find the level of organizational
performance of high school science
teachers.
3. To find out the significant difference
in the social media support of high
school science teachers in terms of
background variables - gender, type of
school, locality of residence,
educational qualification and years of
experience.
4. To find out the significant difference
in the organizational performance of
high school science teachers in terms
of background variables such as
gender, type of school, locality of
residence, educational qualification
and years of experience.
5. To find out the significant correlation
between the social media support of
high school science teachers and their
organizational performance.
Null hypotheses
1. There is no significant difference in the
social media support of high school
science teachers in terms of
background variables.
2. There is no significant difference in the
organizational performance of high
school science teachers in terms of
background variables.
3. There is no significant correlation
between the social media support of

high school science teachers and their
organizational performance.
Method and Procedure:
The investigators used the survey
method of research. Using self-constructed
questionnaires for measuring social media
support and organizational performance,
the data were collected from 146 high
school science teachers using a simple
random sampling technique. Mean,
Standard Deviation, ‘t’ test, F test and
Pearson’s Product Moment Correlation
were used to analyze the data.
Analysis and Findings
1. To find the level of social media
support and organizational performance of
high school science teachers.
Table - 1: Level of social media support
and organizational performance of high
school science teachers Variable Low Moderate High
N % N % N %
Social Media
Support
36 24.66 55 37.67 55 37.67
Organizational
Performance
30 20.55 61 41.78 55 37.67
The level of social media support of high
school science teachers is average
(37.67%). The level of organizational
performance of high school science
teachers is average(41.78%). Table -2: Difference in the social media
support of high school science teachers in
terms of gender, locality of residence and
educational qualification
Vari
ab
le
N
Mea
n
SD
Calc
ula
ted
‘t’
Valu
e
Ta
ble
Va
lue
Rem
ark
Gen
der
Male 34 65.03 9.30 0.14 1.96 N
S
Female 112 64.78 8.82
Lo
cali
ty
of
Res
iden
ce Rural 115 65.23 8.69 0.96 1.96 N
S Urban 31 63.39 9.66
Ed
uca
tio
nal
Qu
alif
icat
ion
s
UG 25 63.20 9.72 0.94 1.96 N
S
PG 121 65.17 8.73
From the above table it shows that the
background variables such as gender,
locality of residence and educational
qualification of high school science
teachers do not differ significantly in their
social media support. Table-3: Difference in the organizational
performance of high school science teachers
in terms of gender, locality of residence and
educational qualification
From the above table, it is interferes that the
background variables such as gender and
educational qualification of high school
science teachers differ significantly in their
organizational performance and there is no
significant difference between the rural and
urban high school science teachers in their
organizational performance. Table–4 : Difference in the social media
support of high school science teachers in
terms of the type of school and years of
experience
Va
ria
ble
s
Mea
n
SS
b
SS
w
df
Ca
lcu
late
d
‘F’
Va
lue
Ta
ble
Va
lue
Rem
ark
Ty
pe
of
Sch
oo
l
Govt. 64.17
90
.05
11
412
.01
2,1
43
0.5
6
3.0
6
NS
Aided 65.83
Private 64.90
Yea
rs o
f
Exper
ience
Below
10
65.32
30
5.0
3
11
197
.02
2,1
43
1.9
5
3.0
6
NS
10-20 65.87
Above
20
61.00
Vari
ab
le
N
Mea
n
SD
Calc
ula
ted
‘t’
Valu
e
Ta
ble
Va
lue
Rem
ark
Gen
der
Male 34 67.03 18.39 3.75 1.96 S
Female 112 73.12 21.68
Lo
cali
ty
of
Res
iden
c
e
Rural 115 68.73 18.53 1.18 1.96 NS
Urban 31 64.29 18.53
Ed
uca
tio
nal
Qu
alif
icat
ion
s UG 25 61.20 16.60 2.13 1.96 S
PG 121 69.15 18.71

From the above table it shows that there is
no significant difference in the social
media support of high school science
teachers in terms of the type of school and
year of experience
Table-5:Difference in the organizational
performance of high school science
teachers in terms of the type of school
and years of experience
Va
ria
ble
s
Mea
n
SS
b
SS
w
df
Ca
lcu
late
d
‘t’
Va
lue
Ta
ble
Va
lue
Rem
ark
Ty
pe
of
Sch
oo
l
Govt 66.45
77
5.1
2
49
145
.30
2,1
43
1.1
3
3.0
6
NS
Aided 70.63
Private 63.40
Yea
rs o
f
Ex
per
ien
ce
Below10 69.65
20
44
.06
47
876
.36
2,1
43
3.0
5
3.0
6
NS
10-20 61.78
above 20 65.33
From the above table, it shows that the
teachers working in government schools,
aided schools and private schools do not
differ significantly in their organizational
performance. The teachers having below
10, 10-20 and above 20 years of
experience do not differ significantly in
their organizational performance.
Table-6 : Correlation between the social
media support of high school science
teachers and their organizational
performance
Vari
ab
les
N
Calc
ula
ted
‘t’
Valu
e
Tab
le
Valu
e
Rem
ark
Social Media
support vs
Organizational
Performance
146 0.361 0.163 S
The social media support of high school
science teachers are significantly
correlated with their organizational
performance
Conclusion
From the findings of the present
investigation, the authors concluded that
the high school science teachers classified
in terms of their gender, type of school,
locality of residence, educational
qualification and years of experience are
found to be equal in their social media
support. Moreover, the aided school
science teachers belonging to rural areas
with PG qualifications are found to have
better social media support. In the case of
the organizational performance of the
chosen sample, the female teachers are
found to be better in organizational
performance. The female teachers use
social media applications in the right
manner, though they are busy in many
activities. As they administer their
household activities properly, that to
reflect in their workplaces too. The reason
behind these findings may be the
professional motivations offered by the
respective managements to adopt the
social media usage for the betterment of
students as the future pillars of the nation,
and the ultimate organizational
performance. This is confirmed in the
present study through the correlation
analysis, which revealed that social media
support is significantly correlated with the
organizational performance of the high
school science teachers.
References
1. Boyd, D. M., & Ellison, N. B. (2007).
Social network sites: Definition,
history, and scholarship. Journal of
Computer-Mediated Communication,
13(1), 11. Retrieved October 9, 2008,
from
http://jcmc.indiana.edu/vol13/issue1/b
oyd.ellison.html
2. Ellison, N. B. & Boyd, D. (2013).
Sociality through SNS. In Dutton,
W.H. (Ed.), The Oxford Handbook of
Internet Studies, Oxford: Oxford
University Press, pp. 151-172.
3. Gemnafle, M., Waimuri, S. P., &
Batlolona, J. P. Organizational climate
of the school and teacher performance
improvement in the 21st century.

International Journal of Science and
Research (IJSR), 7(2), 119-126.
4. Markos, S. (2010). Employee
engagement: The key to improving
performance. International Journal of
Business and Management, 5(12), 89-
96.
5. Puteh, M., et al. (2014). An analysis of
comfortable teaching and learning
environment: Community response to
climate change in school. Procedia -
Social and Behavioral Sciences, 116,
285-290.
6. Rather, A. R. (2014). Essentials of
Instructional Technology. Discovery
publishing house.

A STUDY OF SOCIAL PERCEPTION OF HIGHER SECONDARY STUDENTS
IN RELATION TO THEIR ACHIEVEMENT
*Maria Prema.J
* Assistant Professor of Education, St. Ignatius College of Education, Palayamkottai
Introduction
The term social perception has come to
include three major types of perceptual
phenomena or activities. Firstly, it refers to
the perception of people or other persons;
secondly, it also includes processes of
distortion which are assumed to result
from socially determined factors like
values, needs, norms, attitudes, etc.
Finally, there have also been studied which
could tell us more about cognitive
phenomena and the linkage and relations
among different types of cognitive
processes like inference, judgment,
categorization, etc.
The perceptual process involves
becoming aware of stimuli and also the
interpretations of the same. It has been
shown that at both these stages, individual
and cultural variations play a determining
role thus highlighting the role of
‘motivation’ and inventions in shaping the
processes of perception. Many of the
social factors are motivational factors, are
acquired and can find satisfaction only in a
social context.
School students must be exposed to social
events and also they must be encouraged
to think about the happenings in society.
For an example; if any issue happens in the
society, the students should think and find
out the solution for the questions such as
what? How? When? Where? Why? When
the students find this kind of solution, the
perception of the students towards the
issue is very important. Because based on
this way of perception only, the students
can find the proper solution. Here the
solution for the problem lies in the
perception of the students. If the students
have the right social perception, they will
be a good achiever. So the academic
achievement of the students needs the right
social perception.
Definition of Key Terms
Social Perception “Perception is the process of obtaining
knowledge of external objects and events
by means of senses” - Stagner (p: 238).
The process through which we
attempt to know and understand the
persons around us is known as social
perception. By social perception, the
investigator means that how the individual
perceives society.
Higher Secondary Students By higher secondary students, the
investigator means that the students who
have passed their tenth standard
examination and undergoing regular
courses in the 11th and 12th standard.
Academic Achievement In this study, academic
achievement refers to the marks taken by
the higher secondary students in the
examination.
Significance
Perception is a highly
individualized psychological process that
helps an organism in organizing and
ABSTRACT
Social perception refers to the processes through which we use available information to form
impressions of other people, to assess what they like. The perception of any similar issue or
event that has either a social origin or implication constitutes social perception. The objective
of this study is to find out the level of social perception. This study adopted percentage
analysis, t-test, and F-test for analysis. The sample of this study is higher secondary students
of Thoothukudi and Ramanathapuram districts. The sample consists of 710 higher secondary
students. This study revealed that there is a significant difference between higher secondary
students in their social perception with reference to age and medium of instruction.
Keywords: Social perception, Achievement, Higher secondary students
interpreting the complex patterns of
sensory stimulation for giving them the
necessary meaning to initiate his
behavioral response.
The academic achievement of
higher secondary students will be normally
high because they have attended the 10th
public examination. Even though most of
the students have a high level of academic
achievement, some students are at low
level in their academic achievement. And
also the academic achievement is fulfilled
by social perception. Once the students
have imbibed social perception, then their
academic achievement will be much more
praiseworthy. Because of the above-
mentioned facts, the investigator is
strongly convinced that a study of the
social perception of higher secondary
students in relation to their academic
achievement is meaningful.
Objectives
1. To find out the level of social perception
of higher secondary students with
reference to background variables such as
sex, age, community, type of family, the
residence of students, locality of the
school, type of Institution, the medium of
instruction and revenue district.
2. To find out the significant difference in
social perception between higher
secondary students with reference to age,
sex, type of family, the medium of
instruction, residence, and locality of the
institution.
3. To find out the significant association
between qualification and income of
parents and social perception of higher
secondary students.
Hypotheses
1. The level of social perception and its
dimensions of higher secondary students
with reference to background variables is
average.
2. There is no significant difference in the
social perception of higher secondary
students with reference to age, sex, type of
family, the medium of instruction,
residence, and locality of the institution.
3. There is no significant association
between qualification and income of
parents and the social perception of higher
secondary students.
Literature Reviewed Jo Wyard, (2018) has conducted a study on
“Death, Emotion and Perception:
Examining the Relationship Between
Death Awareness and Emotional
Intelligence on Social Perception” The
present research collected data from two
hundred and eighty-seven participants,
aged between 17 years and 88 years of
age, were randomly assigned to a
traditional mortality salience condition, a
death reflection condition, or to a control
condition. The study examined whether the
mortality salience manipulation or the
death reflection manipulation moderated
the relationship between participant's
emotional intelligence and their cognitive
and affective reactions to an incest story.
The results showed that the mortality
salience manipulation produced a reliable
change in emotional experience. Findings
also support previous research that posits
contemplating death in a specific and
individuated way (via death reflection),
rather than in a non-specific and abstract
way (via mortality salience), can stimulate
cognitive processing that facilitates open,
authentic, and intrinsic strivings for
personal meaning, which can lead to
increased positive social perception.
Jehitha Begum, S. (2008) has conducted a
study on "The Perception of Block
Resource Teachers on Teaching of English
by the Primary Teachers of Dindugal,
Pudukkotai, Karur and Thanjavur
Districts".
This study analyses the perception of
BRT’s towards the teaching of English at
the elementary level. The BRT’s expressed
their opinion on the various dimensions of
English teaching at the elementary level.
The aim of conducting this study is to
improve the existing situation in
government schools. The objectives are (i)
to develop a tool to assess the competence
of the primary teachers in teaching English
to the students, (ii) to assess the
competence of the primary teachers in
teaching English to the students, (iii) to
know the perception of the Block Resource
Teachers on teaching English by the
primary teachers at the elementary level.
The investigator has used the survey
method to collect the data. The sample
consists of 47 Block Resource Teachers
(English) of the four Districts. An
opinionnaire tool was prepared by the
teacher educator. The investigator found
that the poor achievement of the students
is due to the multi-grade teaching in the
schools. Moreover, the students who are
studying in Government schools are
socially, culturally and financially
deprived students.
The method adopted in the Present
Study
The investigator has used the
survey method for the present study.
Tool Used Questionnaire for Social Perception of
Higher Secondary Students prepared and
validated by the investigator.
Population for the Study The population of the study consists
of the students studying in XI and XII
standard higher secondary schools located
in Thoothukudi and Ramanathapuram
Revenue Districts.
Sample for the Study For the present study, the investigator has
randomly selected 710 students who are
studying in class XI and XII in the higher
secondary schools of Thoothukudi and
Ramanathapuram Revenue Districts.
Statistics Used The statistical techniques used in this
study are given below.
1. Percentage Analysis
2.‘t’ test
3. Chi-square Analysis
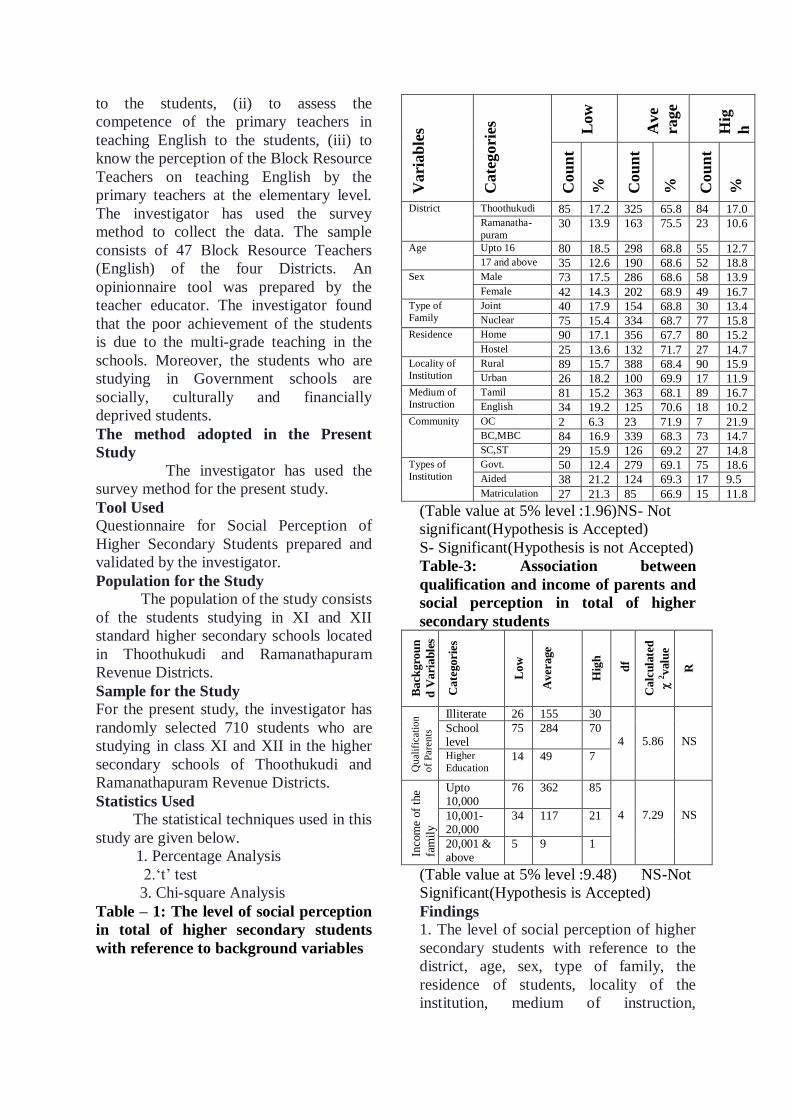
Table – 1: The level of social perception
in total of higher secondary students
with reference to background variables
Vari
ab
les
Cate
gori
es
Low
Ave
rage
Hig
h
Cou
nt
%
Cou
nt
%
Cou
nt
%
District Thoothukudi 85 17.2 325 65.8 84 17.0 Ramanatha-
puram 30 13.9 163 75.5 23 10.6
Age Upto 16 80 18.5 298 68.8 55 12.7 17 and above 35 12.6 190 68.6 52 18.8
Sex Male 73 17.5 286 68.6 58 13.9 Female 42 14.3 202 68.9 49 16.7
Type of
Family
Joint 40 17.9 154 68.8 30 13.4 Nuclear 75 15.4 334 68.7 77 15.8
Residence Home 90 17.1 356 67.7 80 15.2 Hostel 25 13.6 132 71.7 27 14.7
Locality of
Institution
Rural 89 15.7 388 68.4 90 15.9 Urban 26 18.2 100 69.9 17 11.9
Medium of
Instruction
Tamil 81 15.2 363 68.1 89 16.7 English 34 19.2 125 70.6 18 10.2
Community OC 2 6.3 23 71.9 7 21.9 BC,MBC 84 16.9 339 68.3 73 14.7 SC,ST 29 15.9 126 69.2 27 14.8
Types of
Institution
Govt. 50 12.4 279 69.1 75 18.6 Aided 38 21.2 124 69.3 17 9.5 Matriculation 27 21.3 85 66.9 15 11.8
(Table value at 5% level :1.96)NS- Not
significant(Hypothesis is Accepted)
S- Significant(Hypothesis is not Accepted)
Table-3: Association between
qualification and income of parents and
social perception in total of higher
secondary students
Back
gro
un
d V
ari
ab
les
Cate
gori
es
Low
Aver
age
Hig
h
df
Calc
ula
ted
2
valu
e
R
Qu
alif
icat
ion
of
Par
ents
Illiterate 26 155 30 4
5.86
NS
School level
75 284 70
Higher
Education 14 49 7
Inco
me
of
the
fam
ily
Upto 10,000
76 362 85 4
7.29
NS 10,001-
20,000 34 117 21
20,001 & above
5 9 1
(Table value at 5% level :9.48) NS-Not
Significant(Hypothesis is Accepted)
Findings 1. The level of social perception of higher
secondary students with reference to the
district, age, sex, type of family, the
residence of students, locality of the
institution, medium of instruction,

community, and type of institution is
average.
2. There is no significant difference in
social perception between higher
secondary students with reference to the
district, sex, type of family, residence, and
locality of the institution.
3. There is a significant difference in social
perception between higher secondary
students with reference to age and medium
of instruction.
4. There is no significant association
between the qualification of parents and
the social perception of higher secondary
students.
5. There is no significant association
between the income of parents and the
social perception of higher secondary
students.
Interpretation
Age
A significant difference exists between
higher secondary students in social
perception with reference to their age.
The mean scores of higher secondary
students belonging to the age group 17 and
above are high. The students belonging to
this age group belong to final year students
(+2 classes). Hence they are forced to
choose their future career. They have to
fulfill the expectation of the parents,
teachers, and society. They are aware of
the expectation of society. Hence, they
need to have high social perception. This
may be the reason for the students
belonging to age group 17 and above have
high mean scores in social perception.
The medium of Instruction: A significant difference exists between
higher secondary students in social
perception with reference to the medium of
instruction.
When the students learn through their
mother tongue, Tamil, they are able to
understand the concepts better and the
retention also better. They are able to
express ideas and information clearly and
thoroughly. They are able to understand
what actually happened around them. this
may be the reason for the high mean score
of higher secondary students studying in
Tamil medium sections in the social
perception.
This finding draws from the recent public
examination results. The recent results of
the Government public examination
proved that the Tamil medium students
achieve far more than the English medium
students and they are given scholarships
for higher studies by the Government and
receives so many rewards from different
groups of people both Governmental and
non-Governmental agencies. By
perceiving these facts they are highly
motivated and achieve more and more.
The above-mentioned factor may cause a
difference between higher secondary
students in social perception with
reference to the medium of instruction.
Recommendations 1. Children could be encouraged by the
parents to get participate in social
gatherings such as rally,
2. Independence Day celebration, social
works, etc.,.
3. Students could be given a lot of
opportunities to think over social issues
such as child abuse, street children,
sexual harassment, unemployment, etc.
4. School management can organize many
intensive programs related to success,
challenges, and failure of society to
provide awareness among school
students.
5. School campuses can acts as a
miniature of the society in the way of
news reading, religious reading,
displaying current information on the
notice board, conducting programs,
celebrating festivals, etc.
Conclusion
The main aim of education is to develop
all the round personality of the child to
grow as useful citizens of any society. If a
person is socially productive then he will
be useful members of society.
If anyone to be socially productive and
useful there is a need for a right perception
of society, thereby fulfills the above-

mentioned aim of education. From the
study, the investigator has realized and
proved that the social perception which has
been explained above is very much needed
for the students to achieve better.
References
1. Charles, W., & Odell. (1939). The
secondary school. The Gassard Press.
2. Elloit, A. J., & Harackiewicz. (1996).
Journal of Personality and Social Psychology.
70, 461-475.
3. Jehitha Begum, S. (2008) has conducted
a study on "The perception of block resource
teachers on teaching of english by the
primary teachers of Dindugal, Pudukkottai,
Karur and Thanjavur districts".
4. Jewell, L. N. (1989). Psychology and
effective behavior. New Delhi : West
Publishing Company.
5. John, W., & Santrock, (2006).
Adolescence. New Delhi: Tata Mc grow hill
publishing company limited.
6. Jo Wyard, (2018) has conducted a study
on “Death, emotion and perception:
examining the relationship between death
awareness and emotional intelligence on
social perception”
7. Lehto, A. T. (1997). Journal of
Personality and Social Psychology, 73, 1284-
1295.
8. Satya Prakash, (2005). Journal of All
India Association for Educational
Research. 17, (1-2), 82-83.
9. Suresh, B., & Anamika Sadena, (2005).
Advanced educational psychology. Meerat :
Lall book depot.
10. Susanne, (2006). Indian Educational
Abstracts, 6(1).
11. Tripathi, K. N., & Mishra, U. (2001).
Indian Educational Review, 37(2), 76-85