enhancing the drug metabolism activities of c3a— a human hepatocyte cell line—by tissue...
TRANSCRIPT
1357
INTRODUCTION
DRUG METABOLISM BY THE LIVER is one of the FDArequirements for new drug application (NDA). The
growing number of potential drugs in drug discovery pro-grams increases the demand for high-throughput screen-ing (HTS) methodologies for the initial screening of drug
metabolism by liver. Most programs for testing drug me-tabolism and toxicity use whole animal (in vivo model)or primary human hepatocytes (in vitro model). How-ever, testing in animals does not always predict drug me-tabolism in humans because of species differences, andit cannot serve as HTS. In vitro approaches based on hu-man primary hepatocytes require frequent cell isolations
TISSUE ENGINEERINGVolume 12, Number 5, 2006© Mary Ann Liebert, Inc.
Enhancing the Drug Metabolism Activities of C3A—A Human Hepatocyte Cell Line—By Tissue Engineering
Within Alginate Scaffolds
TSIONA ELKAYAM, Ph.D.,1 SIGALIT AMITAY-SHAPRUT, Ph.D.,1MONA DVIR-GINZBERG, Ph.D.,2 TAMAR HAREL, M.Sc.,1 and SMADAR COHEN, Ph.D.,1,2
ABSTRACT
In this study, we investigated the applicability of C3A-a human hepatocyte cell line—as a predict-ing tool for drug metabolism by applying tissue-engineering methods. Cultivation of C3A cells withinalginate scaffolds induced the formation of spheroids with enhanced drug metabolism activities com-pared to that of two-dimensional (2-D) monolayer cultures. The spheroid formation process wasdemonstrated via histology, immunohistochemistry, and transmission electron microscope (TEM)analyses. The C3A spheroids displayed multilayer cell morphology, characterized by a large num-ber of tight junctions, polar cells, and bile canaliculi, similar to spheroids of primary hepatocytes.Spheroid formation was accompanied by a reduction in P-glycoprotein (Pgp) gene expression andC3A cell proliferation was limited mainly to cells on the spheroid outskirt. The 3-D constructs main-tained a nearly constant cell number according to MTT assay. Drug metabolism by the two mostimportant cytochrome p-450 (CYP) enzymes in human liver, CYP1A2 and CYP3A4, was tested us-ing preferred drugs. With CYP1A2, 3-fold enhancement in activity per cell was seen for convertingethoxyresorufin to resorufin compared to C3A cell monolayers. The spheroids responded to the in-ducer �-naphthoflavone and to the inhibitor furafylline of CYP1A2. Enhanced metabolizing activ-ity of CYP3A4, measured by the amount 6�-testosterone formed from testosterone, and that of thephase II enzyme glucuronosyltransferases (UGT) further indicated that the tissue-engineered C3Aspheroids may provide an efficient experimental tool for predicting drug activities by these CYPs.Moreover, the maintenance of constant cell number, as well as the elevated hepatocellular functionsand drug metabolism activities, suggest that the tissue-engineered C3A may be applicable in re-placement therapies.
1Department of Biotechnology Engineering, 2Department of Biomedical Engineering, Ben-Gurion University of the Negev,Beer-Sheva, Israel.

due to the short-term viability and hepatocellular func-tions of these cells. Moreover, using primary cells can-not serve as HTS because of donor scarcity and the highcost of these cells. Thus, a human hepatocyte cell linemay be a good cell substitute for initial drug screening.
The C3A cell line, used in bioartificial liver supportsystem (BALSS) in clinical studies1,2 is a clonal deriva-tive of hepatoblastoma-based HepG2, selected for its im-proved differentiated hepatocyte phenotype. We hypoth-esized that by employing tissue-engineering methodswithin alginate scaffolds, the metabolic profile of C3Acell line would be enhanced and would enable their usein drug discovery programs. Previously, we showed thatseeding primary rat hepatocytes within alginate scaffoldsinduced their self-assembly into spheroids that possessstructural polarity and maintain hepatocellular functionsin culture to a greater extent.3–5 The alginate scaffolds,with their 90% porosity, pore sizes of �100–150 �m,and interconnecting pore structure, are weakly adhesiveto cells.5,6 This latter feature is probably the main dri-ving force for hepatocytes to maximize cell-cell interac-tions and spheroid formation. The spheroids formed insizes matching that of the scaffold pore size, 100–150�m, and in the size range wherein oxygen diffusion isnot limiting.7
We now report that C3A—a human hepatocyte cellline—forms spheroids within the alginate scaffold withenhanced drug metabolism activities compared to thoseof C3A cell monolayers. The spheroids display ultra-structural features by TEM that resemble those of spher-oids formed by primary rat hepatocytes and are absent incell monolayers.3 The results for histology, immuno-chemistry, gene expression for several differentiated he-patic functions, and albumin and urea secretions sup-ported spheroid formation, which can help explain thebetter drug metabolism activities displayed by the 3-Dcultivated C3A cells.
MATERIALS AND METHODS
Alginate scaffolds
Porous cylindrical alginate scaffolds, with a 5 mm di-ameter and 2 mm thickness, were prepared from alginatewith high guluronic acid (G) contents (MVG, 65% G;FMC Biopolymers, Drammen, Norway) by the freeze-dry technique.8 The scaffolds were 90% in porosity andhad pore sizes in the range of 100–150 �m in diameter,according to scanning electron microscopy (SEM) mea-surements.
C3A cell culture
C3A/HepG2 (CRL-10741) human hepatoblastoma cellline was purchased from American Type Culture Col-
ELKAYAM ET AL.
lection (ATCC) and cultured in MEM Eagle medium con-taining 1 mM sodium pyruvate, 10% (v/v) fetal calfserum (FCS), and 2 mM L-glutamine. For 2-D cultiva-tion, C3A cells were seeded in 96-well plates at a start-ing concentration of 1 � 105 cells per well. The cellswere cultured under standard conditions, a humidifiedatmosphere of 5% CO2 and 95% air at 37°C with dailymedium changes.
Seeding of C3A within alginate scaffold and culture
C3A cells were seeded onto the 3-D alginate scaffoldsplaced in 96-well plate, using a centrifugal packingmethod with 0.3 � 106 cells per well to yield a final celldensity of 15 � 106 cells/cm.3,4 C3A cell loading wascharacterized by determining the number of viable cellsby MTT uptake assay. The 3-D constructs were culturedunder the same standard conditions as the 2-D cultures.
Live/dead cell staining
C3A cell constructs were stained with fluorescein di-acetate (FDA), which stains viable cell cytoplasm greenand propidium iodide (PI), which emits red fluorescencewhen intercalated in nucleic acid. The scaffolds wereviewed under an inverted fluorescence microscope(Model IX70, Olympus, Hamburg, Germany) equippedwith 490 nm band-pass filter with a 510 nm cutoff filterfor FDA fluorescence emission and 517-nm band-passcutoff filter for PI emission.
Histology and immunohistochemistry
The C3A cell constructs were dehydrated in graduatedalcohols (70–100%), embedded in paraffin, and sectionedinto 5 �m thickness horizontal cross-sections. The sec-tions were stained with hematoxylin and eosin (H&E).For immunohistochemistry staining, endogenous perox-idases were blocked in 3% H2O2. The slides were reactedwith polyclonal antibodies directed against human pro-teins: rabbit anti-human albumin (A0001, Dako, Glostrup,Denmark), anti P-gp (Z 5116, Dako), proliferating cell nuclear antigen (PCNA, clone PC10, M 0879; Dako) andcytokeratin-18 (CK18, Ks18.04; Progen Biotechnik, Hei-delberg, Germany). Horseradish peroxidase-conjugatedanti-mouse served as secondary antibodies.
Transmitting electron microscope analysis
Specimen preparation for transmitting electron micro-scope (TEM) analysis used standard techniques.9 C3Acell constructs were fixed, sectioned into ultrathin sec-tions, and stained with uranyl acetate and lead citrate ac-cording to standard procedure.9 Five grids were observedfor each data point from two different experiments. Mi-crographs were taken of representative samples, using aTEM model JEM 1230 (JEOL, Tokyo, Japan).
1358
MTT uptake assay
Metabolic activity of C3A cell constructs was assessedusing (3-(4,5-dimethylthiazol-2-yl)-2,5diphenyltetrazoliumbromide (MTT) uptake assay. Each construct was rinsedand placed in the well of 96-well plate containing media,0.2mL/3 � 105 cells. 40 �L of MTT in PBS (5 mg/mL)per 3 � 105 cells was added into each well and the plateswere incubated for 3 h in a humidified atmosphere of 5%CO2 and 95% air at 37°C. The medium was aspirated andthe constructs were further incubated with 5mL SDS/ for-mamide at 37°C until the formazan crystals were dissolved(24 h). Aliquots (75 �L) were then transferred to a well in96-well plate, and the absorbance was read at 570 nm, us-ing a microplate reader (ELX 808, Bio-Tek Instruments,Burlington, VT). Blank consisted of empty scaffolds treatedin a similar way. The absorbance was directly proportionalto cell number.5
Albumin and urea secretion
Albumin secretion from C3A cell constructs was de-termined by a sandwich enzyme-linked immunosorbentassay (ELISA),5 using a human albumin ELISA kit(Bethyl Laboratories, Montgomery, TX). Human albu-min was used for establishing the standard curve. Spe-cific secretion rates were calculated from albumin levelsin a 24 h culture supernatant divided by the number ofviable cells analyzed by MTT assay.
Urea was determined by the urea-nitrogen diagnostickit (Sigma), which utilizes an urease/Berthelot quantita-tive colorimetric method.5 Urea secretion rates were cal-culated from urea levels in a 24 h culture supernatant di-vided by the number of viable cells determined by theMTT assay.
Cytochrome P-450 1A2 (CYP1A2) metabolism
CYP1A2 activity was measured using ethoxyresorufinas a substrate, according to a method described else-
DRUG METABOLISM IN C3A IN ALGINATE SCAFFOLDS
where.10 The assays were performed in serum-free cellcultures. Ethoxyresorufin, the inducer �-naphthoflavone,and the inhibitor furafylline were dissolved in DMSO andthen diluted to the appropriate concentrations in cell cul-ture medium before use. The total DMSO concentrationin assays never exceeded 0.1%. To measure CYP1A2 ac-tivity, 5 �M of the substrate ethoxyresorufin was addedto the C3A constructs or cell monolayers and incubatedat 37°C for 1 h. In experiments with inducer, the cell cul-tures were incubated with 30 �M �-naphthoflavone for72 h prior to substrate addition. In experiments with theinhibitor, the constructs were incubated for 1 h in serum-free medium supplemented with 5 �M furafylline. Themedia from two wells were combined and read on a flu-orescent plate reader, with 530 excitation filter and 590emission.
Cytochrome P-450 3A4 (CYP3A4) metabolism
Testosterone is metabolized by CYP3A4 yielding 6�-testosterone as a major metabolite. Testosterone, the in-ducer rifampicine, and the inhibitor ketoconazole weredissolved in DMSO and then diluted to the appropriateconcentrations in cell culture medium before use. The to-tal DMSO concentration in assays never exceeded 0.1%.To measure CYP3A4 activity, testosterone was added tothe culture medium of C3A constructs at a concentrationof 200 �M and incubated at 37°C for 3 h. The assay wasstopped by addition of 250 �L stop solution (Acetoni-trile) and then filtered via 0.45 �m PTFE filters. The sam-ples were kept frozen (�20°C) until LC-MS analysis. Inexperiments with induction, the C3A constructs were in-cubated with 20 �M rifampicin for 72 h prior to substrateaddition. In those with inhibition, ketoconazole wasadded 4 h prior to substrate addition.
LC-MS analysis
The LC-MS system consists of an Esquire 3000� sep-aration module, equipped with an atmospheric pressure
1359
TABLE 1. PRIMERS’ SEQUENCE USED FOR PCR
No. of PCR AnnealingGene Sequence cycles temperature (°C)
GAPDH F: TGGCGCTGAGTACGTCGTG 30 55R: ATGGCATGGACTGTGGTCAT
CYP3A4 F: CTTACACATACACACCCTTTGG 40 52R: GCTCAATGCATGTACAGAATCC
Albumin F: GATGACAACCCAAACCTCCCC 35 52(ALB) R: TTTGGCAACAGGCAGGCAGCT
�-fetoprotein F: TGCAGCCAAAGTGAAGAGGGAAGA 35 52(AFP) R: CATAGCGAGCAGCCCAAAGAAGAA
P-gp F: GCTCCTGACTATGCCAAAGC 40 52(MDR1) R: GGCAATGTTCTCAGCAATGC
ELKAYAM ET AL.1360
A
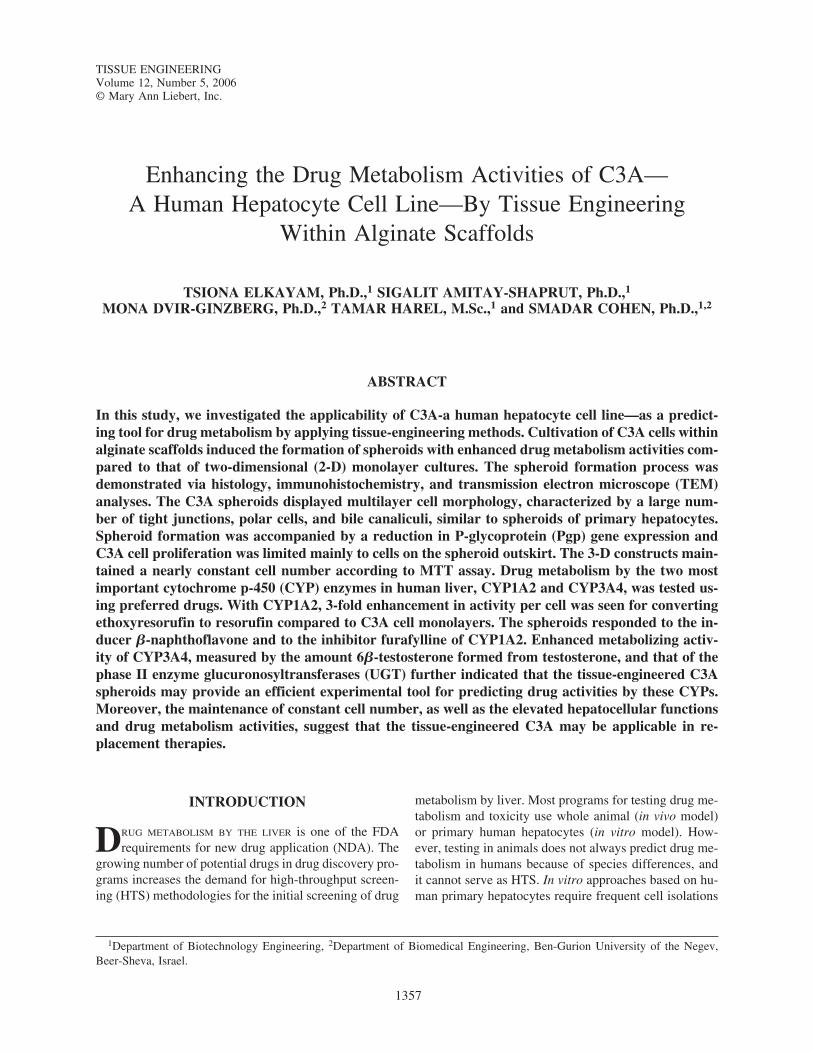
FIG. 1. Visualization of spheroid formation from C3A human hepatocyte cell line within alginate scaffolds. (A) H&E stained,thin cross-sections from the 3-D constructs at different time points post-seeding. (B) Immunostaining of the C3A spheroids fortwo hepatic differentiation markers, albumin and CK18, 14 days post-seeding. (C) Immunostaining for PCNA on days 1 and 21post seeding. (Color images are available online at www.liebertonline.com/ten).
B
C
DRUG METABOLISM IN C3A IN ALGINATE SCAFFOLDS 1361
chemical ion source (APCI, Bruker Dalton, Bermen, Ger-many) and an Agilent 1100 LC module, equipped withauto-sampler G1313A and G1312A pump (Agilent, SantaClara, California). A Kromasil C18-column (250 � 2.00mm, 5 �m; Phenomenex, Torrance, California) was usedfor chromatographic separation.11 Analyses were run ina positive mode with capillary voltage set to 2.6 kV, thetemperature of the heated capillary at 475°C, and the ni-trogen nebulizing gas flow set at 5L/min. The mobilephase consisted of a gradient of water (A) and acetoni-trile (B) from 60:40 to 40:60 (%), with a flow rate of0.3mL/min for a run time of 15 min. The apparatus wasmanaged with the Esquire software (version 5.0, Bruker).
Phase II Activity
The fluorescent reagent 7-hydroxy-4-trifluormethyl-coumarin (7-HFC) is a substrate of phase II UGT en-zymes. To measure UGT activity, 1 �M of 7-HFC wasadded to the culture medium of the C3A cell constructsand incubated at 37°C for 30 min. The plates were readon a fluorescent plate reader, with 410 excitation filter and510 emission. Glucuronidation of 7-HFC was determinedby measuring the decrease in the fluorescence of 7-HFC.12
Isolation of total RNA and reverse transcriptionPCR (RT-PCR)
Analysis of total RNA was extracted from C3A cellsand 3-D constructs using the EZ-RNA kit from Biologi-cal Industries (Kibbutz Beit Ha-Emek, Israel), accordingto the manufacturer’s recommended protocol. RNA con-centration and purity were measured using NanoDrop.For first-strand cDNA synthesis, 1 �g RNA was used for each reaction and Reverse-iT 1st standard synthesiskit (Abgene, Epsom, United Kingdom) and random de-camers as primers. For PCR experiments, Thermo-StartDNA polymerase (Abgene) was used for PCR amplifi-cation. All RNA samples were adjusted to yield equalamplification of human glyceraldehyde-3-phosphate de-hydrogenase (GAPDH) as an internal standard. Sequencespecific primers for the PCR were derived from humangenomic DNA sequences available in the gene bank andlisted in Table 1. The PCR conditions were as followed:95°C for 15 min (for hotstart activation), 94° for 1 min,annealing temperature (Table 1) for 30 s, and 72°C for 40 s. Numbers of amplification cycles for each gene areindicated in Table 1.
RESULTS
Formation of C3A spheroids within alginate scaffolds
The behavior of C3A cells within alginate scaffoldswas studied on H&E stained, thin cross-sections from the
3-D constructs and at different time points post-seeding(Figure 1A). Twenty-four hours post-seeding, the cellsappeared as individuals or small aggregates within the al-ginate pores. The small (10–20 �m) aggregates had ir-regular shapes and their constituent cells revealed a dis-tinguished intact nucleus. At day 7 post-seeding, larger(41 � 19 �m) C3A cell aggregates were seen, consistingof cuboidal shaped cells, and they appeared to be morecompacted. Larger and more compacted cell aggregateswere seen at days 14 (68 � 25) and 21 (133 � 60) post-seeding. The structures resembled the spheroids formedby primary rat hepatocytes when seeded in the alginatescaffolds.3–5 In C3A spheroids, the surface cells had elon-gated shape, while those in the center were cuboidal. Theincrease in C3A spheroid size could be due to mergingof neighboring particles, cell proliferation, or both. In thespheroids at day 21, merging of closer spheroids seems
A
B
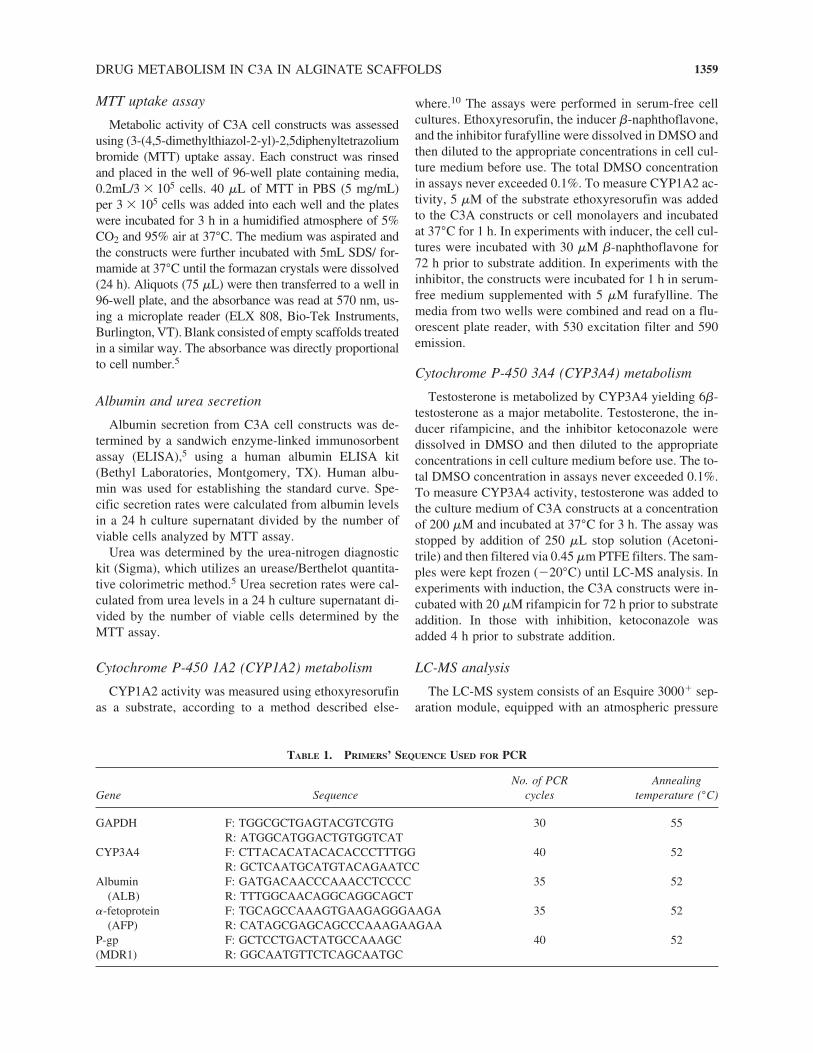
FIG. 2. Viability of the C3A spheroids. (A) Inverted phase flu-oromicrograph of FDA/PI double-stained C3A spheroids withinalginate scaffold 10 days post-seeding. The cells are stained onlyfluorescent green (magnification � 40). (B) MTT assay for mon-itoring spheroid viability. C3A cells were seeded at 0.3 � 106 cellsper scaffold. Data were converted to viable cell number per scaf-fold using a calibration curve. The results are the average of 12repetitions from two different experiments. (Color images areavailable online at www.liebertonline.com/ten).
ELKAYAM ET AL.1362
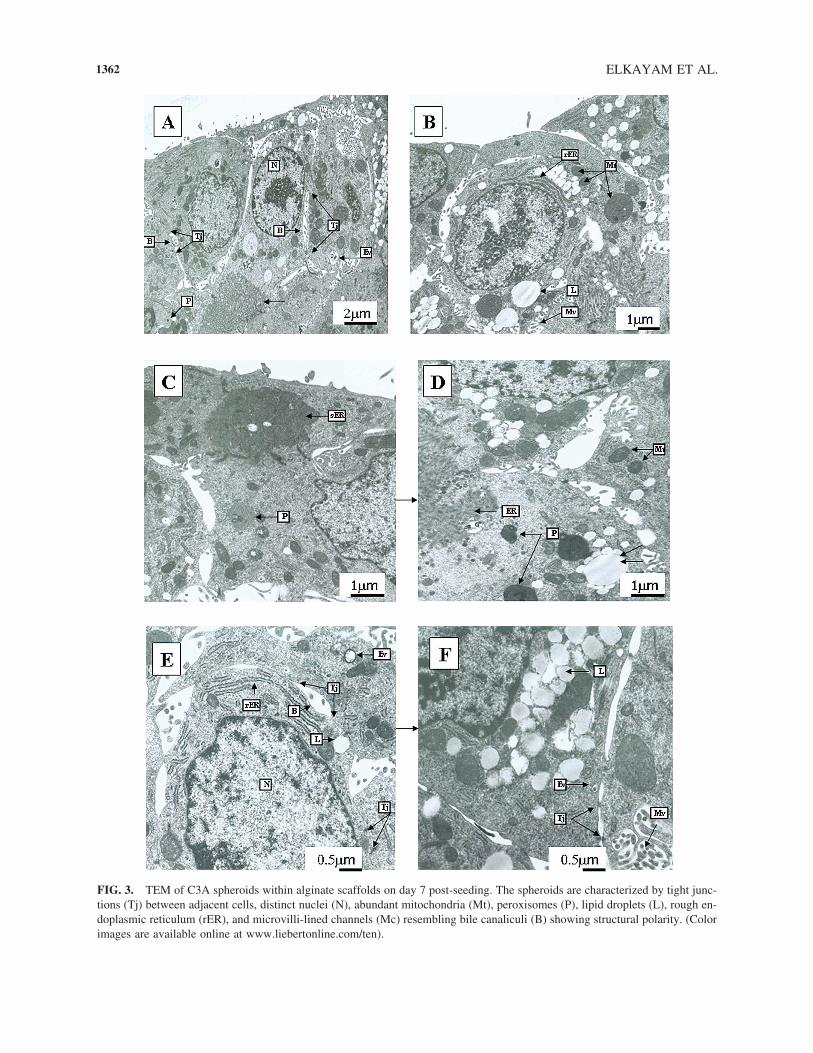
FIG. 3. TEM of C3A spheroids within alginate scaffolds on day 7 post-seeding. The spheroids are characterized by tight junc-tions (Tj) between adjacent cells, distinct nuclei (N), abundant mitochondria (Mt), peroxisomes (P), lipid droplets (L), rough en-doplasmic reticulum (rER), and microvilli-lined channels (Mc) resembling bile canaliculi (B) showing structural polarity. (Colorimages are available online at www.liebertonline.com/ten).
to be the most dominant one. The cells within the spher-oids were viable throughout the entire cultivation period.Immunohistochemistry for albumin and CK18 expressionrevealed that C3A spheroids displayed these two hepaticdifferentiated markers (Fig. 1B).
Cell proliferation within the C3A spheroids was as-sessed by immunostaining thin cross-sections from theconstructs with antibodies against the PCNA. This assayis widely used for monitoring cell proliferation.13–15 Onday 1, most cells constituting the aggregates were stainedpositive for PCNA, while at day 21 only cells on thespheroid surface were positive for PCNA (Fig. 1C). C3Acell monolayers were stained positive throughout the cul-ture (data not shown).
Cell viability within C3A spheroids was analyzed byFDA staining and MTT viability assay. A fluorescencemicrograph from day 10 post-seeding (Fig. 2A) of C3Acell constructs treated with FDA and PI showed that mostspheroids were stained only fluorescent green, indicatingviable cells. The MTT assay displayed a constant cellnumber in the C3A cell constructs for 2 weeks (Fig. 2B),suggesting that cell proliferation in spheroids is limited.
Ultrastructural features of C3A spheroids
Seven days post-seeding, the C3A spheroids formedwithin alginate scaffold were examined ultra-structurallyby TEM (Fig. 3). The spheroids displayed multi-cell layermorphology with tight junctions (Tj) between adjacentcells, emphasizing cell-cell interactions. The cells inspheroids were viable and exhibited distinct nuclei (N),
DRUG METABOLISM IN C3A IN ALGINATE SCAFFOLDS
abundant mitochondria (Mt), rough endoplasmic reticu-lum (rER), peroxisomes (P), and lipid droplets (L). Fur-thermore, the cells displayed polarity, as judged by thepresence of bile canaliculi (B) possessing microvilli(Mc), bordered by tight junctions. The same features werealso observed in spheroids formed by primary rat hepa-tocytes.3
Pgp expression in C3A spheroids
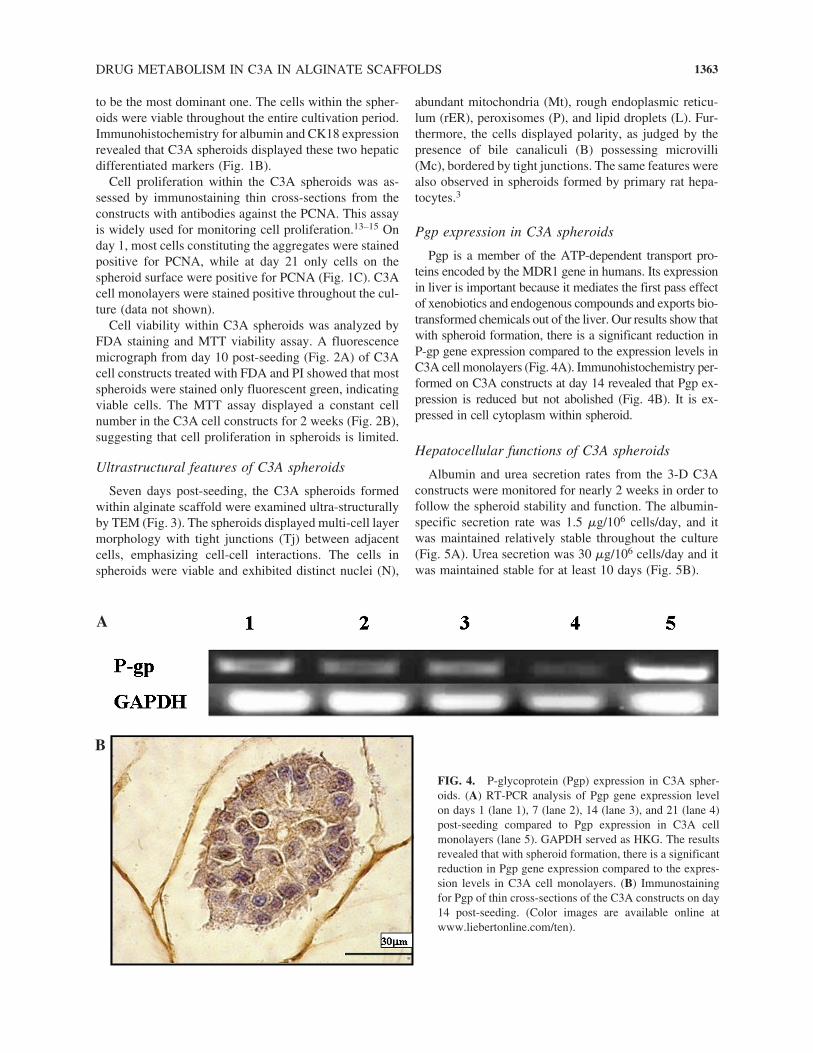
Pgp is a member of the ATP-dependent transport pro-teins encoded by the MDR1 gene in humans. Its expressionin liver is important because it mediates the first pass effectof xenobiotics and endogenous compounds and exports bio-transformed chemicals out of the liver. Our results show thatwith spheroid formation, there is a significant reduction inP-gp gene expression compared to the expression levels inC3A cell monolayers (Fig. 4A). Immunohistochemistry per-formed on C3A constructs at day 14 revealed that Pgp ex-pression is reduced but not abolished (Fig. 4B). It is ex-pressed in cell cytoplasm within spheroid.
Hepatocellular functions of C3A spheroids
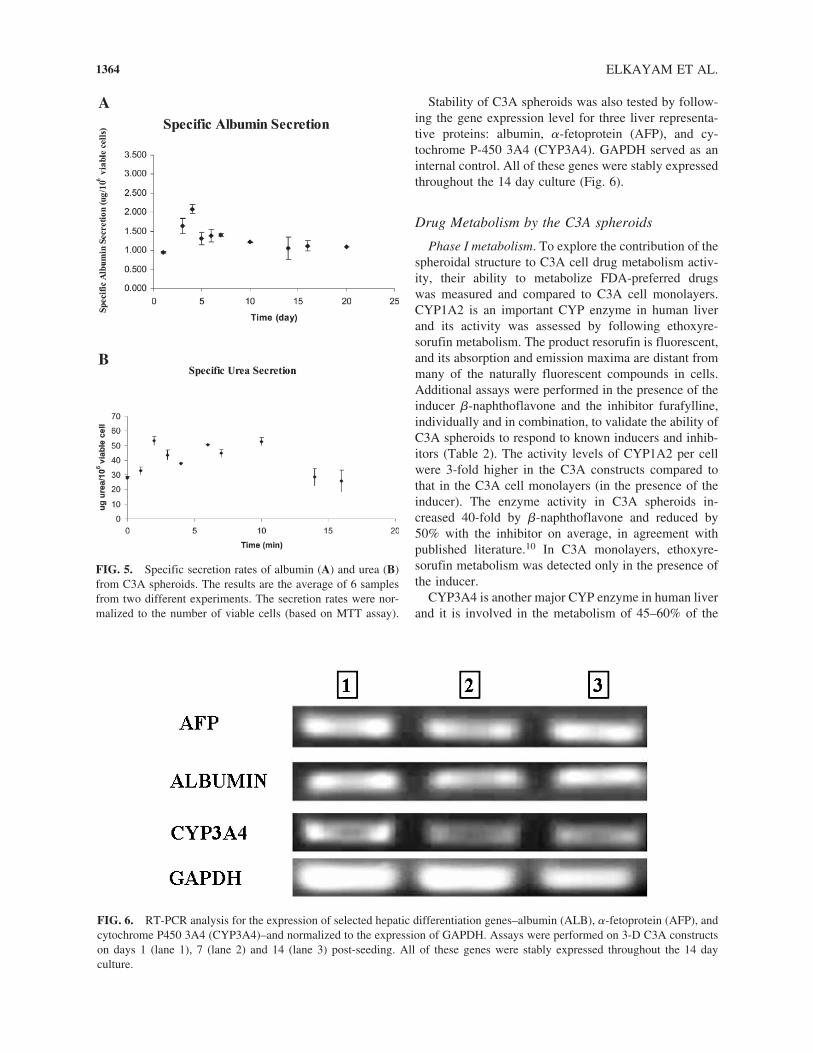
Albumin and urea secretion rates from the 3-D C3Aconstructs were monitored for nearly 2 weeks in order tofollow the spheroid stability and function. The albumin-specific secretion rate was 1.5 �g/106 cells/day, and itwas maintained relatively stable throughout the culture(Fig. 5A). Urea secretion was 30 �g/106 cells/day and itwas maintained stable for at least 10 days (Fig. 5B).
1363
B
A
FIG. 4. P-glycoprotein (Pgp) expression in C3A spher-oids. (A) RT-PCR analysis of Pgp gene expression levelon days 1 (lane 1), 7 (lane 2), 14 (lane 3), and 21 (lane 4)post-seeding compared to Pgp expression in C3A cellmonolayers (lane 5). GAPDH served as HKG. The resultsrevealed that with spheroid formation, there is a significantreduction in Pgp gene expression compared to the expres-sion levels in C3A cell monolayers. (B) Immunostainingfor Pgp of thin cross-sections of the C3A constructs on day14 post-seeding. (Color images are available online atwww.liebertonline.com/ten).
ELKAYAM ET AL.
Stability of C3A spheroids was also tested by follow-ing the gene expression level for three liver representa-tive proteins: albumin, �-fetoprotein (AFP), and cy-tochrome P-450 3A4 (CYP3A4). GAPDH served as aninternal control. All of these genes were stably expressedthroughout the 14 day culture (Fig. 6).
Drug Metabolism by the C3A spheroids
Phase I metabolism. To explore the contribution of thespheroidal structure to C3A cell drug metabolism activ-ity, their ability to metabolize FDA-preferred drugs was measured and compared to C3A cell monolayers.CYP1A2 is an important CYP enzyme in human liverand its activity was assessed by following ethoxyre-sorufin metabolism. The product resorufin is fluorescent,and its absorption and emission maxima are distant frommany of the naturally fluorescent compounds in cells.Additional assays were performed in the presence of theinducer �-naphthoflavone and the inhibitor furafylline,individually and in combination, to validate the ability ofC3A spheroids to respond to known inducers and inhib-itors (Table 2). The activity levels of CYP1A2 per cellwere 3-fold higher in the C3A constructs compared tothat in the C3A cell monolayers (in the presence of theinducer). The enzyme activity in C3A spheroids in-creased 40-fold by �-naphthoflavone and reduced by50% with the inhibitor on average, in agreement withpublished literature.10 In C3A monolayers, ethoxyre-sorufin metabolism was detected only in the presence ofthe inducer.
CYP3A4 is another major CYP enzyme in human liverand it is involved in the metabolism of 45–60% of the
1364
A
B
FIG. 5. Specific secretion rates of albumin (A) and urea (B)from C3A spheroids. The results are the average of 6 samplesfrom two different experiments. The secretion rates were nor-malized to the number of viable cells (based on MTT assay).
FIG. 6. RT-PCR analysis for the expression of selected hepatic differentiation genes–albumin (ALB), �-fetoprotein (AFP), andcytochrome P450 3A4 (CYP3A4)–and normalized to the expression of GAPDH. Assays were performed on 3-D C3A constructson days 1 (lane 1), 7 (lane 2) and 14 (lane 3) post-seeding. All of these genes were stably expressed throughout the 14 day culture.

drugs metabolized by CYPs. The most recommendedprobe substrate for monitoring CYP3A4 activity is testos-terone, which is bio-transformed to 6�-testosterone bythis enzyme. Analysis of the produced 6�-testosteronewas performed by LC-MS. With the chromatographicconditions used, the retention time for 6�-testosterone
DRUG METABOLISM IN C3A IN ALGINATE SCAFFOLDS
was 3.8 min (Fig. 7A) and 10.2 min for testosterone (datanot shown). MS analysis of the 6�-testosterone peakshowed a m/z value of 305.18 (Fig. 7A). The same con-ditions were used to monitor testosterone metabolism byC3A spheroids. A representative chromatogram (Fig. 7B)demonstrates a peak at 3.8 min with m/z value of 305.18,
1365
TABLE 2. CYP1A2 METABOLISM ACTIVITY IN C3A SPHEROIDS VS C3A CELL MONOLAYERS
nM Resorufin produced/106 cells/1 h
Treatment C3A cell monolayer C3A spheroids
Cells only 0 2 � 0.7Cells � inducer 30 � 2 80 � 20Cells � inhibitor 0 0.6 � 0.6Cells � inducer � inhibitor 10 � 2 40 � 10
Determined by measuring ethoxyresorufin conversion to the fluorescent resorufin. CYP1A2-specific inducer and inhibitor were�-naphthoflavone and furafylline, respectively.
FIG. 7. Selected chromatograms and Mass spectra of 6�-testosterone as recorded by LC-MS. (A) A peak with a 3.8 min re-tention time is observed when using 6�-testosterone (220 �M) as a marker. MS analysis of m/z for this peak reveals a value of305.18. (B) A representative chromatogram for 6�-testosterone formation by C3A spheroids. The peak at 3.8 min with m/z valueof 305.18 indicates the ability of C3A spheroids to convert testosterone via CYP3A4 to 6�-testosterone.
B
A

indicating that the C3A spheroids converted the testos-terone via CYP3A4 to 6�-testosterone. C3A spheroidsalso responded to specific CYP3A4 inducer and inhibi-tor (Table 3). The product level was increased by 1.4-fold in response to the inducer rifampicine (Table 3), andpre-incubation with the inhibitor ketoconazole resulted in63–70% reduction in the product level. These results em-phasize the ability of C3A spheroids to predict drug me-tabolism by CYP3A4 as well.
Phase II metabolism. Glucuronidation is a major phaseII metabolic pathway for inactivation and excretion ofmany drugs and it is performed by UGT. These enzymesare a superfamily of membrane-bound proteins localizedprimarily in the liver that catalyze the linkage of glu-curonic acid with chemical compounds containing hy-droxyl, amine, sulfhydryl, and carboxylic acid functionalgroups. In our study, this activity was measured by mon-itoring the reduction in 7-HFC fluorescence, the substrateof UGT. The activity was measured from day 1 post-cellseeding (Table 4). The results revealed an increase inUGT activity in the 3-D constructs during cultivation; theactivity measured 4 days post-seeding was 2.5 higher thanthe activity measured immediately after seeding.
DISCUSSION
In this paper, we demonstrate for the first time that cul-tivation of C3A human hepatocyte cell line within porousalginate scaffolds induces the formation of spheroids withenhanced drug metabolism activities. The C3A cell line,a clone derivative of the hepatoblastoma HepG2 and se-lected for its better hepatocellular activities, is used inBALSS currently in clinical studies.1,2 Previous analysesof drug metabolism activities by the C3A cell line in con-ventional cell monolayers showed that they can performmost of human CYP 450 activities, although at muchlower levels than do primary hepatocytes (http://www.amphioxus.com). We hypothesized that seeding the C3Acell line within the weakly adhesive alginate scaffolds
ELKAYAM ET AL.
would promote spheroid formation and, as a result, theenhancement of drug metabolism profile. Our hypothe-sis is based on our previous experience with rat primaryhepatocytes, which were induced to form spheroidswithin alginate scaffolds and had elevated hepatocellularfunctions and drug metabolism.3–5
The primary induction for spheroid formation by C3Acell line probably stems from their seeding within algi-nate scaffolds. The weakly adhesive nature of these scaf-folds induced the C3A cells to form and maximize cell-cell interactions over cell-matrix interactions, whicheventually lead to the formation of spheroids. The ad-vantage of using alginate scaffold versus non-adhesive 2-D cultures (e.g., plates and bioreactors) is the confinementof spheroid size to �100–150 �m, which is below thelimiting distance of oxygen diffusion. Histology and im-munohistochemistry revealed that the C3A spheroids werecharacterized by internal cuboidal cells with distinguishednuclei, and surface cells that had elongated shape andformed a continuous layer. This layer is probably the onecontributing to the smooth appearance of the spheroids,as judged by scanning electron microscope.5 The cellsconstituting the spheroids were all stained positive for al-bumin and CK18, indicating that the surface cells are alsoC3A cells, but had changed their morphology due to theirlocation in the interface. These cells were also the onesstained positive to PCNA, an indicator for cell prolifera-tion, while the internal cells in spheroids were negative.This observation provides strong evidence for the forma-tion of a true spheroid, wherein because of high cell den-sity in the center only the surface cells are proliferating.
The morphological and ultrastructural features of theC3A spheroids resembled those reported by us for spher-oids formed from primary rat hepatocyte.3 TEM analysisdemonstrated the presence of bile canaliculi possessing mi-crovilli and cell polarity, which are characteristics of thenative parenchymatic liver tissue. Pgp expression resultssupported the finding of cell polarity in C3A spheroids. Itwas found that Pgp gene expression is decreasing at a ratecorrelating to spheroid formation, although it is not en-tirely abolished as judged by immunohistochemistry. In
1366
TABLE 3. CYP3A4 METABOLISM ACTIVITY IN C3ASPHEROIDS BY MEASURING ABILITY TO CONVERT
TESTOSTERONE VIA CYP3A4 TO 6�-TESTOSTERONE
Treatment 6�-testosterone (IU)
Cells only 1.41 � 106
Cells � inducer 30 � 22 � 106
Cells � inhibitor 5.32 � 105
Cells � inducer � inhibitor 6 � 105
The amount conversion was analyzed by LC-MS and the results are represented as peak intensity. CYP3A4-specific andinhibitor were rifampicine and ketoconazole, respectively.
TABLE 4. PHASE II UGT METABOLISM
ACTIVITY IN C3A SPHEROIDS
7-HFC glucuronidation (mM)Days post-seeding by C3A spheroids
0 8.211 9.354 20.67
Measured by following the reduction in 7-HFC fluorescenceafter its glucuronidation. The activity was followed from day 1 toshow the correlation between activity and spheroid formation.
contrast, high Pgp levels were maintained in C3A mono-layers during cultivation. The high Pgp levels in C3A cellline may be related to their being a clone derivative of he-patoblastoma HepG2, but also to the fact that they do notregain a proper polarity when cultured as monolayers. Thecorrelation between Pgp levels and cell polarity has beenimplicated before for primary hepatocytes. The hepato-cytes in liver possess structural polarity,16 but immediatelyafter dissociation from liver they loss this property.17 Oneof the consequences is Pgp overexpression by freshly iso-lated hepatocytes.18 In normal hepatocytes, the high Pgplevel after cell isolation decreases to a lower, stable levelwhen the cells regain polarity and established cell-cell con-tacts, as seen, for example, after culturing within the sand-wiched collagen gel.19 The decrease in Pgp expressionwhen spheroids are formed, as seen in our work, indicatesthat C3A gained polarity in these structures. In contrast,the C3A in monolayers maintained high levels of Pgp, asexpected of a clone derivative of hepatoblastoma HepG2.Pgp is a member of the ATP-dependent transport proteinsencoded by the MDR1 gene in humans. Overexpressionof the MDR1 gene products has been implicated in tumordrug resistance, especially in tumor arising from tissuesthat normally express Pgp (e.g., liver, kidney, intestine,and blood-brain barrier20). Thus, the decrease in Pgp ex-pression in C3A spheroids probably indicates that the cellline lost one of its characteristics as a hepatoblastoma-de-rived cell line. This conclusion may have implication ontheir use, for example, in cell therapy.
Another important feature of the C3A spheroids is theirmaintenance of a stable cell number throughout cultiva-tion, as well as their functional stability as judged by thenearly constant specific rates of albumin and urea secre-tions or the sustained gene expression levels of albumin,AFP, and CYP3A4. This advantageous feature of theC3A spheroids indicates, to some extent, a superiorityover primary hepatocyte spheroids, which deterioratewith time and develop a necrotic center with only one vi-able cell layer on the spheroid outskirt.3 The C3A spher-oids appear also to have advantages even over their cellprecursor, the HepG2. Wilkening et al. have shown sig-nificant changes in the expression of drug-metabolizingenzymes in HepG2 cultures over time.21 The finding thatC3A spheroids maintain culture stability is important fortheir future use as a predictive tool for drug metabolism,where reliable and reproducible results are the essence.
The most profound finding of our work is that spher-oid formation contributed to elevated activities ofCYP1A2, one of the major drug metabolizing enzymesin human liver. This result was obtained using the FDA-preferred drug ethoxyresorufin and by following its con-version to resorufin. The C3A spheroids were 3-fold moreactive than the C3A cell monolayers were ,and they re-sponded to the CYP1A2-specific inducer and inhibitor,further proving that the measured metabolism is due to
DRUG METABOLISM IN C3A IN ALGINATE SCAFFOLDS
CYP1A2 activity. Similar results were observed when us-ing another FDA-preferred drug, testosterone, as a markerfor CYP3A4 activity; the C3A responded well to induc-tion/inhibition by specific agents to this enzyme. An ad-ditional interesting phenomenon was that the activity ofphase II metabolism UGT enzyme increased with timeand in correlation to spheroid formation. This finding fur-ther proves the superiority of the spheroid structure overC3A cell monolayers in drug metabolism and specificallyin Phase II conjugation activity.
Collectively, our study strongly suggests an importantrole for cell-cell interactions in C3A cell line cultivation,which affect their hepatocellular function and drug me-tabolism activity. Future study of the activity of other im-portant CYP enzymes in human liver is needed to enablethe use of C3A spheroids in drug discovery programs.Yet, the considerable progress made in this study puts usone step further along.
ACKNOWLEDGMENTS
The research in this study was supported by the IsraeliConsortium Pharmalogica, Ministry of Trade and Indus-try, Israel. We thank Ms. Iris Gamlieli-Bonshtein and Ms.Parvin Zerin for their technical help.
REFERENCES
1. Ellis, A.J., Hughes, R.D., Wendon, J.A., Dunne, J., Lang-ley, P.G., Kelly, J.H., Gislason, G.T., Sussman, N.L., andWilliams, R. Pilot-controlled trial of the extracorporealliver assist device in acute liver failure. Hepatology 24,1446, 1996.
2. Hughes, R.D., Nicolaou, N., Langley, P.G., Ellis, A.J.,Wendon, J.A., and Williams, R. Plasma cytokine levels andcoagulation and complement activation during use of theextracorporeal liver assist device in acute liver failure. Ar-tif. Organs 22, 854, 1998.
3. Dvir-Ginzberg, M., Elkayam, T., Aflalo, E.D., Agbaria, R.,and Cohen, S. Ultrastructural and functional investigationsof adult hepatocyte spheroids during in vitro cultivation.Tissue Eng. 10, 1806, 2004.
4. Dvir-Ginzberg, M., Gamlieli-Bonshtein, I., Agbaria, R.,and Cohen, S. Liver tissue engineering within alginate scaf-folds: effects of cell-seeding density on hepatocyte viabil-ity, morphology, and function. Tissue Eng. 9, 757, 2003.
5. Glicklis, R., Shapiro, L., Agbaria, R., Merchuk, J.C., and Co-hen, S. Hepatocyte behavior within three-dimensionalporous alginate scaffolds. Biotechnol. Bioeng. 67, 344, 2000.
6. Zmora, S., Glicklis, R., and Cohen, S. Tailoring the porearchitecture in 3-D alginate scaffolds by controlling thefreezing regime during fabrication. Biomaterials 23, 4087,2002.
7. Glicklis, R., Merchuk, J.C., and Cohen, S. Modeling masstransfer in hepatocyte spheroids via cell viability, spheroid
1367
size, and hepatocellular functions. Biotechnol. Bioeng. 86,672, 2004.
8. Shapiro, L., and Cohen, S. Novel alginate sponges for cellculture and transplantation. Biomaterials 18, 583, 1997.
9. Neuman, M.G., Shear, N.H., Cameron, R.G., Katz, G., andTiribelli, C. Ethanol-induced apoptosis in vitro. Clin.Biochem. 32, 547, 1999.
10. Kelly, J.H., and Sussman, N.L. A fluorescent cell-based as-say for cytochrome P-450 isozyme 1A2 induction and in-hibition. J. Biomol. Screen 5, 249, 2000.
11. Arellano, C., Philibert, C., Lacombe, O., Woodley, J., andHouin, G. Liquid chromatographic-mass spectrometricmethod to assess cytochrome P450-mediated metabolismof testosterone by rat everted gut sacs. J. Chromatogr. B.Anal. Technol. Biomed. Life Sci. 807, 263, 2004.
12. Heterologous expression of human UDP glucuronosyltransferase. Available at http://gentest.com.
13. Delhaye, M., Louise, H., Degraef, C., LeMoine, O., De-viere, J., Gulbis, B., Jacobovitz, D., Alder, M., and Galand,P. Relationship between hepatocyte proliferative activityand liver functional reserve in human cirrhosis. Hepatol-ogy 23, 1003, 1996.
14. Eldrige, S.R., Butterworth, B.E., and Goldsworthy, T.L.Proliferating cell nuclear antigen: a marker for hepatocel-lular proliferation in rodents. Environ. Health Perspect.101, Suppl 5, 211, 1993.
15. Theocharis, S.E., Skopelitou, A.S., Margeli, A.P., Pavlaki,K.J., and Kittas, C. Proliferating cell nuclear antigen(PCNA) expression in regenerating rat liver after partialhepatectomy. Dig. Dis. Sci. 39, 245, 1994.
16. Hubbard, A.L., Barr, V.A., and Scott, L.J. Hepatocyte sur-face polarity. In: Arias, I.M., Boyer, J.L., Fausto, N.,Jakoby, W.B., Schachter, D., and Shafritz, D.A., eds., The
ELKAYAM ET AL.
Liver: Biology and Pathobiology. New York: Raven Press,1994.
17. Maurice, M., Rogier, E., Cassio, D., and Feldmann, G. For-mation of plasma membrane domains in rat hepatocytesand hepatoma cell lines in culture. J. Cell Sci. 90 (Pt 1),79, 1988.
18. Fardel, O., Ratanasavanh, D., Loyer, P., Ketterer, B., andGuillouzo, A. Overexpression of the multidrug resistancegene product in adult rat hepatocytes during primary cul-ture. Eur. J. Biochem. 205, 847, 1992.
19. Hoffmaster, K.A., Turncliff, R.Z., LeCluyse, E.L., Kim,R.B., Meier, P., and Brouwer, K.L. P-glycoprotein expres-sion, localization, and function in sandwich-cultured pri-mary rat and human hepatocytes: relevance to the hepato-biliary disposition of a model opioid peptide. Pharm. Res.21, 1294, 2004.
20. Sukhai, M., and Piquette-Miller, M. Regulation of the mul-tidrug resistance genes by stress signals. J. Pharm. Sci. 3,268, 2000.
21. Wilkening, S., and Bader, A. Influence of culture time onthe expression of drug-metabolizing enzymes in primaryhuman hepatocytes and hepatoma cell line HepG2. J.Biochem. Mol. Toxicol. 17, 207, 2003.
Address reprint requests to:Smadar Cohen, Ph.D.
Department of Biotechnology EngineeringBldg. 39, Room 222
Ben-Gurion University of the NegevBeer Sheva, Israel 84105
E-mail: [email protected]
1368