enhancing the resolution of cohesin dynamics in meiosis
TRANSCRIPT

Enhancing the Resolution of Cohesin
Dynamics in Meiosis
Dissertation der Fakultät für Biologie
der Ludwig-Maximilians-Universität München
Peter Andreas Graf
Mai 2018


Diese Dissertation wurde angefertigt
unter der Leitung von Dr. Wolfgang Zachariae
in der Arbeitsgruppe Chromosomenbiologie
am Max-Planck-Institut für Biochemie in Martinsried, Deutschland.
1. Gutachter: Prof. Dr. Marc Bramkamp
2. Gutachter: Prof. Dr. Peter Becker
3. Gutachter: Prof. Dr. Christof Osman
4. Gutachter: Prof. Dr. Barbara Conradt
5. Gutachter: Prof. Dr. Nicolas Gompel
6. Gutachter: Prof. Dr. Michael Boshart
Tag der Abgabe: 15.05.2018
Tag der mündlichen Prüfung: 27.09.2018
ERKLÄRUNG
Ich versichere hiermit an Eides statt, dass meine Dissertation selbständig und ohne
unerlaubte Hilfsmittel angefertigt worden ist.
Die vorliegende Dissertation wurde weder ganz, noch teilweise bei einer anderen
Prüfungskommission vorgelegt.
Ich habe noch zu keinem früheren Zeitpunkt versucht, eine Dissertation einzureichen
oder an einer Doktorprüfung teilzunehmen.
München, den 15. Mai 2018
Peter Andreas Graf


Für Gabi und Maja.


Publications
Argüello-Miranda, O., Zagoriy, I., Mengoli, V., Rojas, J., Jonak, K., Oz, T., Graf, P., and
Zachariae, W. (2017). Casein Kinase 1 Coordinates Cohesin Cleavage, Gametogenesis,
and Exit from M Phase in Meiosis II. Developmental Cell 40, 37–52.
Jonak, K., Zagoriy, I., Oz, T., Graf, P., Rojas, J., Mengoli, V., and Zachariae, W. (2017).
APC/C-Cdc20 mediates deprotection of centromeric cohesin at meiosis II in yeast. Cell
Cycle 16, 1145–1152.
Figure 46 of this thesis was published in this paper.


Abstract
Meiosis is a specialized form of cell division in which one diploid mother cell is converted
into four haploid daughter cells. Cohesin is a multi-protein complex, providing cohesion
to replicated chromosomes. During meiosis, cohesin is removed from chromosomes in
two steps. First, it is proteolytically cleaved from chromosome arms in anaphase I,
whereas cohesin in the vicinity of the centromere is protected from cleavage. This
pericentromeric cohesin is then removed in anaphase II. This stepwise loss of cohesin is
part of the current model of meiotic chromosome segregation. Evidence for this kind of
cohesin dynamics came originally from immunofluorescence experiments with very
limited spatial resolution.
A new workflow was established by combining a novel synchronization system for
budding yeast meiosis with a calibrated and optimized ChIP-Seq protocol. This workflow
allows resolving the cohesin dynamics in the course of the two meiotic divisions with
unprecedented temporal and spatial resolution.
With this new experimental system, we confirmed the existence of two cohesin fractions
on chromosomes, a protected and an unprotected fraction. Contrary to the current model,
we detected both fractions in the region around the centromere. This indicates that the
distinction between arm cohesin and pericentromeric cohesin is not identical to the
classification into unprotected cohesin and protected cohesin. These results suggest that
the mechanism of protection is not only determined by the localization of the cohesin
protein complex. Additionally, we discovered significant differences in the cohesin
protection activity among individual chromosomes.
The protein Sgo1 is required for the centromeric protection of cohesin. Sgo1 was analyzed
directly with the new workflow, and we generated novel insights into the loading of the
protection machinery onto chromosomes and the establishment of centromeric protection
in meiosis. The protection machinery is loaded onto chromosomes in a cohesin-dependent
mechanism, and a novel model of a dynamic three-step loading mechanism of the
protection machinery is presented. This model explains how the cells are able to provide
a robust and reliable protection to cohesin located in very diverse patterns on different
chromosomes. Moreover, the model suggests a new function of the protein Sgo1 in
centromeric protection.
A last result is that the polo-like kinase of budding yeast, Cdc5, is involved in regulating
the levels of the protection machinery, which are loaded onto chromosomes.


Table of Contents
11
Table of Contents
Table of Contents ........................................................................................................... 11
1. Introduction ................................................................................................................ 14
Meiosis ........................................................................................................................ 14
Cohesin ....................................................................................................................... 16
Meiotic cohesin ....................................................................................................... 17
Topological binding of cohesin ............................................................................... 19
Cohesin loading and sliding .................................................................................... 20
Centromeric protection ............................................................................................... 22
Establishment of centromeric protection................................................................. 24
Regulation of centromeric protection ...................................................................... 26
Aim of the study ......................................................................................................... 27
2. Results ........................................................................................................................ 28
Establishment of ChIP-qPCR for meiosis .................................................................. 28
ChIP-qPCR of meiotic cohesin ................................................................................... 38
Application of a ChIP calibration system for meiosis ................................................ 42
Establishment of calibrated ChIP-qPCR for meiosis .............................................. 42
Establishment of calibrated ChIP-Seq for meiosis .................................................. 45
Calibrated ChIP-Seq of a meiotic arrest/release time course...................................... 49
Two-step cohesin cleavage in meiosis ........................................................................ 53
Quantification of calibrated ChIP-Seq data ................................................................ 60
Quantification of samples from a prolonged metaphase I arrest ................................ 65
Centromeric protection ............................................................................................... 66
Establishment of centromeric protection................................................................. 66
Regulation of centromeric protection ...................................................................... 80
3. Discussion ................................................................................................................... 89
Experimental workflow .............................................................................................. 89

Table of Contents
12
Characterization of meiotic cohesin ........................................................................... 90
Recruitment of the protection machinery ................................................................... 95
Regulation of centromeric protection ....................................................................... 100
4. Material and Methods ............................................................................................... 103
Yeast strains .............................................................................................................. 103
Plasmid construction ................................................................................................. 104
C. glabrata tagging plasmid .................................................................................. 104
Yeast transformation ................................................................................................. 104
S. cerevisiae transformation .................................................................................. 104
C. glabrata transformation .................................................................................... 105
Culture media ............................................................................................................ 105
Induction of meiosis .................................................................................................. 106
Fixed-cell immunofluorescence ................................................................................ 107
Live-cell imaging ...................................................................................................... 107
Western blotting ........................................................................................................ 108
Chromatin immunoprecipitation ............................................................................... 109
qPCR ......................................................................................................................... 110
Next-generation sequencing ..................................................................................... 112
Bioinformatics .......................................................................................................... 112
Short-read mapping ............................................................................................... 112
Calibration of ChIP-Seq profiles ........................................................................... 113
calChIP-Seq quantification ................................................................................... 113
Antibodies ................................................................................................................. 113
List of strains ............................................................................................................ 114
5. Contributions ............................................................................................................ 117
6. Acknowledgements .................................................................................................. 118
7. References ................................................................................................................ 119

13
8. Appendix .................................................................................................................. 131

1. Introduction
14
1. Introduction
Meiosis
Meiosis is a specialized form of cell division in which two rounds of chromosome
segregation follow one round of DNA replication. By duplicating the genome once and
thereafter splitting it twice, one diploid mother cell is converted into four haploid daughter
cells (Figure 1). This type of cell division can be found in almost all eukaryotic species.
In unicellular eukaryotes, like Baker’s yeast (Saccharomyces cerevisiae), meiosis allows
forming haploid spores. These spores package the DNA in a tightly sealed environment
and shield it from unfavorable environmental conditions and allow later mating of the
haploid cells under more favorable conditions. In higher organisms like mammals,
meiosis gives rise to gametes, i.e., sperm and egg cells. From Baker’s yeast to mammals,
many of the genes, which are relevant for meiosis, are conserved. Due to the ease of
inducing meiosis and the number of available experimental tools, Baker’s yeast is an ideal
model organism to study meiosis on the cellular and molecular level and to provide
hypothesis about meiotic mechanisms in higher organisms.
In yeast, meiosis is induced as a response to nitrogen and carbon starvation. It starts with
pre-meiotic S phase during which a meiosis-specific form of cohesin, containing the
subunit Rec8 instead of Scc1, is loaded onto chromosomes (Klein et al., 1999; Watanabe
and Nurse, 1999). After this, the DNA is replicated. Cohesin is a multi-subunit protein
complex, which provides cohesion to replicated chromosomes by connecting sister
chromatids (Nasmyth and Haering, 2009). Subsequently, recombination between non-
Figure 1: Meiosis consists of two consecutive rounds of chromosome segregation after one round of DNA
replication. Adapted from and modified: d’Erfurth, I., Jolivet, S., Froger, N., Catrice, O., Novatchkova, M., and
Mercier, R. (2009). PLOS Biology 7, e1000124.

1. Introduction
15
sister chromatids takes place, linking homologs together by the formation of chiasmata.
After completion of recombination and satisfaction of the recombination checkpoint, the
meiosis-specific transcription factor Ndt80 drives the cells into metaphase I by
upregulating, among others, the genes for the polo-like kinase Cdc5 and the Cdk1-
activating, B-type cyclins Clb1 and Clb4 (Chu et al., 1998). Upregulation of the kinases
Cdc5 and Cdk1 shifts the cells into a high-kinase state, which triggers the formation of
the meiotic spindle, the separation of spindle pole bodies (SPBs), and the attachment of
sister kinetochores to microtubules originating from the same pole (mono-orientation).
This process depends on the multi-protein complex monopolin, including the casein
kinase 1δ/ε (CK1δ/ε) (Hrr25 in budding yeast) (Tóth et al., 2000; Rabitsch et al., 2003;
Petronczki et al., 2006). The anaphase-promoting complex/cyclosome (APC/C) together
with its activator/substrate-recognition factor Cdc20 triggers the metaphase-to-anaphase
transition. APC/CCdc20 activates the cysteine protease separase/Esp1 by marking the
separase-inhibitor Pds1 for degradation by the proteasome (reviewed in Zachariae, 2004).
Activated separase cleaves the Rec8 subunit of cohesin along chromosome arms, thereby
allowing the separation of homologs (Buonomo et al., 2000). Sister chromatids remain
attached to each other during anaphase I because cohesin at centromeres is protected from
cleavage by separase. This protection is possible because Rec8 needs to be
phosphorylated so that separase can efficiently recognize it as a substrate. The
phosphorylation of Rec8 is performed by Hrr25 and Dbf4-dependent Cdc7 kinase (DDK)
(Katis et al., 2010). At the centromeres, this phosphorylation is removed by the
phosphatase PP2A, thus protecting centromeric Rec8 from cleavage by separase
(Kitajima et al., 2006; Riedel et al., 2006). Concomitantly with the onset of anaphase I,
the phosphatase Cdc14 is released from the nucleolus. The release is mediated by a non-
proteolytic function of separase and the Cdc fourteen early anaphase release (FEAR)
network (Buonomo et al., 2003; Marston et al., 2003). Cdc14 counteracts Cdk1 activity,
bringing the cells back to a low-kinase state, which is a prerequisite for disassembly of
the meiosis I spindle. After a very short prophase II, Cdk1 activity rises again, shifting
the cells back to the high-kinase state, and metaphase II starts. The spindle pole bodies
re-duplicate and meiosis II spindles are assembled. The sister kinetochores now attach to
microtubules emanating from opposite poles (biorientation). As in meiosis I, APC/CCdc20
activates separase but now the centromeric Rec8 is cleaved, and the spindle apparatus
pulls the sister chromatids to opposite poles (Figure 2).

1. Introduction
16
Cohesin
The cohesin protein complex is a multi-protein complex that is named after its most
prominent function, which is to provide cohesion to newly replicated sister chromatids
(Guacci et al., 1997; Michaelis et al., 1997). In budding yeast, it consists of five core
subunits, and additional regulatory subunits bind to it (reviewed in Haering and Gruber,
2016). The five core subunits in budding yeast are named Smc1, Smc3, α-kleisin, Scc3,
and Pds5, with a total molecular weight of 626 kDa (Figure 3). Smc1 and Smc3 each
consist of a large coiled-coil domain with a globular hinge domain at the outer ends, and
both proteins form a heterodimer in the cohesin complex (Melby et al., 1998). Smc1 and
Smc3 are bridged by the α-kleisin subunit, which binds to the globular hinge domains of
the Smc proteins (Haering et al., 2002).
Figure 2: In meiosis I, the reductional division seperates the homologs, in meiosis II, the equational division
seperates the sister chromatids. The first division in anaphase I is elicited by cleavage of arm cohesin. The second
division in anaphase II is elicited by cleavage of centromeric cohesin. Taken from: Petronczki, M., Siomos, M.F., and
Nasmyth, K. (2003). Un Ménage à Quatre: The Molecular Biology of Chromosome Segregation in Meiosis. Cell 112,
423–440.

1. Introduction
17
Meiotic cohesin
In mitosis, the cohesin complex provides cohesion of sister chromatids, until their
segregation in anaphase. Meiosis, by contrast, consists of two consecutive rounds of
chromosome segregation. In anaphase I of meiosis, homologs are segregated, in anaphase
II sister chromatids are segregated. Hence, in meiosis, cohesion is lost in two steps. First,
the cohesion of homologs is released in anaphase I, but the cohesion of sister chromatids
is retained until meiosis II and is released in anaphase II. Therefore, it was unclear for a
long time if two different mechanisms provide cohesion to homologs and sister
chromatids or if the same mechanism is responsible for both (reviewed in Miyazaki and
Orr-Weaver, 1994).
In meiosis, the protein Rec8 is required for chromosome cohesion (Molnar et al., 1995).
Rec8 constitutes a meiosis-specific variant of the cohesin protein complex (Klein et al.,
1999; Watanabe and Nurse, 1999), which provides cohesion to homologs and sister
chromatids. Consequently, the same mechanism is responsible for both functions. Rec8,
which is absent in mitosis, is the meiosis-specific version of the α-kleisin subunit of the
cohesin complex. The other four subunits of the cohesin complex are expressed in mitosis
and meiosis. The mitotic version of the α-kleisin subunit (Scc1 in S. cerevisiae), on the
other hand, can also be found at low levels in meiotic cells (Klein et al., 1999), but several
lines of evidence suggest that cohesion of chromosomes during meiosis occurs
exclusively through Rec8 cohesin (Rankin, 2015). Moreover, various meiosis-specific
functions, like the formation of axial elements, recombination during meiotic prophase or
Figure 3: Schematic representation of the cohesin protein complex from budding yeast. Adapted from and modified:
Nasmyth, K. (2011). Cohesin: a catenase with separate entry and exit gates? Nature Cell Biology 13, ncb2349.

1. Introduction
18
centromeric protection at anaphase I require the meiosis-specific cohesin subunit Rec8.
Whereas Scc1 cannot provide these functions (Petronczki et al., 2003). Thus, both
paralogs deviate strongly concerning their function and regulation. The degree of
sequence homology between the two proteins also reflects this difference. Both proteins
are not identifiable as homologs by a standard BLAST search; only remote homology
recognition techniques reveal their relationship. Crucial sites for regulation, like the
separase cleavage site, are at very different positions in both proteins (Sullivan et al.,
2004).
Rec8 co-localizes with chromosomes during meiotic prophase and disappears from
chromosome arms in anaphase I, whereas a small fraction of Rec8 persists in the vicinity
of the centromere until anaphase II (Klein et al., 1999; Watanabe and Nurse, 1999)
(Figure 4). From these observations, which are based on immunofluorescence techniques,
the current model of meiosis emerged. According to this model, cohesin comprises two
fractions, one fraction on the chromosome arms and one fraction in the vicinity of the
centromere. Cohesin on the chromosome arms provides cohesion to homologs and is
cleaved in meiosis I, cohesin in the vicinity of the centromere provides cohesion to sister
chromatids and is cleaved in meiosis II (Orr-Weaver, 1999; Brar et al., 2006). A later
study quantified the size of the region around the centromere in which cohesin is
preserved in meiosis II indirectly, by correlating the position of Rec8 with chromatin
Figure 4: Immunofluoresence staining of spindles and the meiosis-specific cohesin subunit Rec8 at representative
meiotic stages. The DNA was visualized by DAPI staining. Adapted from and modified: Klein, F., Mahr, P., Galova,
M., Buonomo, S.B.C., Michaelis, C., Nairz, K., and Nasmyth, K. (1999). A Central Role for Cohesins in Sister
Chromatid Cohesion, Formation of Axial Elements, and Recombination during Yeast Meiosis. Cell 98, 91–103.

1. Introduction
19
immunoprecipitation on a chip (ChIP-Chip) data of the cohesin protection machinery
(Kiburz et al., 2005). This study estimated the size of the protected region, to be 50 kbp
around the centromere for every chromosome.
In budding yeast mitosis, cohesin is removed from chromosomes at the metaphase-to-
anaphase transition via the proteolytic activity of separase (Uhlmann et al., 1999;
Uhlmann et al., 2000). For vertebrate mitosis, by contrast, it was shown that cohesin is
removed from chromosomes in two steps, first by a separase-independent mechanism in
prophase, followed by a separase-dependent step at the metaphase-to-anaphase transition
(Darwiche et al., 1999; Sumara et al., 2000; Waizenegger et al., 2000). The separase-
independent prophase pathway of cohesin removal is controlled by the Polo-like kinase
(Sumara et al., 2002) and mediated by Wapl (Dobie et al., 2001; Gandhi et al., 2006). For
budding yeast mitosis, no prophase-pathway of cohesin removal has been described to
date (Lopez-Serra et al., 2013). For budding yeast meiosis, however, it was demonstrated
using chromosome spreads that the overall cohesin levels are lower in metaphase I than
in prophase, suggesting a prophase pathway-like mechanism might be in place in budding
yeast meiosis (Yu and Koshland, 2005).
Topological binding of cohesin
The protease separase is required for removing cohesin from chromosomes in anaphase.
This dependency suggests that the cohesin complex needs to be proteolytically cleaved
for its removal from chromosomes. The requirement for proteolytic cleavage was
demonstrated in mitosis, where the mitotic α-kleisin subunit Scc1 of cohesin needs to be
cleaved by separase to allow chromosome segregation at anaphase (Uhlmann et al., 1999).
For meiosis, the same mechanism was confirmed by showing that proteolytic cleavage of
the meiosis-specific α-kleisin subunit Rec8 is required for faithful chromosome
segregation in anaphase I (Buonomo et al., 2000). Structural studies revealed that
individual Smc subunits of the cohesin complex form rod-like structures, with interaction
sites at their outer ends, which could easily be assembled into a proteinaceous loop, able
to entrap a DNA molecule. It was shown that the rod-like cohesin subunits Smc1 and
Smc3 directly interact at their out tips, whereas their other end is connected via the α-
kleisin subunit (Haering et al., 2002). Therefore, it was speculated that the cohesin protein
complex might interact with DNA topologically. According to this model, the cohesin
complex does not just interact with DNA, but it embraces the DNA molecule in a closed

1. Introduction
20
ring-like structure (Figure 5). Over the course of several years, many studies have
supported this model and collected evidence for its validity. By artificially cleaving the
Smc3 subunit of the cohesin complex, it was demonstrated that not only cleavage of the
α-kleisin subunit, like it physiologically occurs in the cells, but cleavage of any cohesin
subunit is sufficient to remove cohesin from chromatin (Gruber et al., 2003). This result
is consistent with the ring model, according to which cohesin can only bind to DNA if
the ring is intact, but cohesin would detach if any link in the ring were lost as it occurs
upon cleavage of Smc3. Moreover, it was demonstrated that it is feasible to generate
stable SDS-resistant protein-DNA complexes by cysteine-crosslinking of the cohesin
subunits Smc1, Smc3 and Scc1 (Haering et al., 2008). This result is consistent with the
ring model because it shows that it is possible to establish a robust cohesin-DNA
interaction just by cross-linking the cohesin subunits with each other, without cross-
linking any cohesin subunit directly to DNA or another chromatin factor.
Cohesin loading and sliding
In S. cerevisiae, loading of the cohesin complex onto chromosomes occurs in G1 and
depends on the loader complex, comprising the subunits Scc2 and Scc4 (Ciosk et al.,
2000). A conserved patch on the surface of Scc4 recruits the Scc2/Scc4 cohesin loader
Figure 5: Structure of the cohesin protein complex according to the ring model. Smc1, Smc3 and the kleisin subunit
form a closed ring, embracing two strands of DNA. The kleisin subunit is cleaved by the protease separase, which
triggers chromosome segregation at the metaphase-to-anaphase transition. Accessory proteins like Scc3, depicted in
yellow, bind to the cohesin complex. Adapted from and modified: Haering, C.H., Löwe, J., Hochwagen, A., and
Nasmyth, K. (2002). Molecular Architecture of SMC Proteins and the Yeast Cohesin Complex. Molecular Cell 9, 773–
788.

1. Introduction
21
complex to chromatin (Hinshaw et al., 2015). A mutation in this conserved patch (scc4-
m35) eliminates the centromeric localization of the loader complex. The recruitment of
the cohesin loader to chromosomes involves phosphorylation of the kinetochore protein
complex Ctf19 by DDK, phosphorylated Ctf19 is in turn recognized by Scc2/Scc4 (Ciosk
et al., 2000; Hinshaw et al., 2017; Hu et al., 2011; Natsume et al., 2013). Another
conserved function of DDK is to phosphorylate several subunits of the Mcm helicase
complex, and thus, DDK is involved in the initiation of replication (reviewed in Rossbach
and Sclafani, 2016). Hence, a DDK-dependent Scc2/Scc4 cohesin loader recruitment
couples the licensing of DNA replication to the initiation of cohesin loading (Gillepsie et
al., 2004; Hinshaw et al., 2017). However, the cohesin loader complex does not detach
from chromatin after S phase, as it can still be detected on chromatin in metaphase (Kogut
et al., 2009). Maintenance of sister chromatid cohesion after S phase, on the other hand,
is not dependent on the loader complex. The reason for this is that cohesin loading and
establishment of cohesion are different functions, which are performed by different
effectors. Once cohesin is loaded onto chromosomes, the establishment of cohesion
occurs concomitant with replication and is mediated by replication fork-associated
factors, independent of the Scc2/Scc4 loader complex (Lengronne et al., 2006).
The pioneering works about cohesin localization in mitosis show that cohesin localizes
to several sites along the whole chromosome axis. It displays a higher concentration
around the centromere than on the chromosome arm. On chromosome arm sites, it
preferentially enriches at AT-rich regions in intervals of approximately 15 kbp (Blat and
Kleckner, 1999; Tanaka et al., 1999). The localization sites of cohesin along the
chromosome axis are well defined, and the pattern of cohesin peaks is very reproducible.
However, it is not known what defines these sites of cohesin localization. Interestingly,
the Scc2/Scc4 cohesin loader binding sites only poorly co-localize with the cohesin
binding sites in S. cerevisiae (Hu et al., 2011; Lengronne et al., 2004; Lopez-Serra et al.,
2014). The same was demonstrated for human cells (Zuin et al., 2014). Hence, the current
hypothesis is that two consecutive functions define the cohesin localization. First, the
Scc2/Scc4 cohesin loader recruits cohesin to chromosomes topologically, followed by
cohesin translocation to its sites of permanent residence. Some reports exist that oppose
this model of loading and subsequent translocation. One study claims that in S. cerevisiae
only the Scc2/Scc4 cohesin loader determines the distribution of cohesin along the
chromosome (Kogut et al., 2009). However, the data presented in this study shows that

1. Introduction
22
the ratio of Scc2/Scc4 and cohesin deviates significantly, depending on the chromosomal
locus, rendering the interpretation of the data highly speculative. For Drosophila, it was
shown that the cohesin loader co-localizes with cohesin, raising the possibility that the
localization of cohesin is solely defined by the binding sites of the cohesin loader in this
organism (Misulovin et al., 2008). Hence, it is conceivable that different mechanisms
control cohesin’s localization in different species.
Concerning the mechanism that translocates cohesin from the sites of loading, it was
demonstrated that cohesin preferentially enriches at intergenic regions between
convergently transcribed genes, giving rise to the possibility that the transcription
machinery is responsible for cohesin repositioning (Lengronne et al., 2004). Another
study on this topic confirmed that cohesin responds to transcriptional activity and that
transcript elongation into cohesin association sites results in the local disassociation of
cohesin (Bausch et al., 2007). However, the precise translocation mechanism remained
ambiguous, and two different models emerged. The relocation model proposes that
cohesin might dissociate from sites of initial Scc2–Scc4 binding, presumably by
transcriptional activity and then be newly reloaded further downstream. The sliding
model proposes that cohesin relocates from its initial binding sites on chromosomes by
sliding along chromatin while remaining bound topologically (reviewed in Ocampo-
Hafalla and Uhlmann, 2011). Recent studies collected compelling evidence for the
validity of the sliding model. It was confirmed, using single-molecule imaging, that in
vitro individual molecules of cohesin form topologically bound complexes that diffuse
on DNA, showing high mobility and a long association time (Stigler et al., 2016). Another
study demonstrated by using chromatin immunoprecipitation (ChIP) that pre-existing
cohesin is pushed downstream along the DNA in response to transcriptional gene
activation, apparently without the need for intermittent dissociation or reloading
(Ocampo-Hafalla et al., 2016). A third study further strengthened the sliding model by
showing that mobilized cohesin complexes continue to provide cohesion, excluding their
dissociation from chromosomes (Borrie et al., 2017).
Centromeric protection
In the course of the two meiotic divisions, the cells remove cohesin from chromosomes
in a step-wise manner. First, the cells remove arm cohesin in meiosis I, followed by

1. Introduction
23
cohesin around the centromere in meiosis II. This step-wise loss of cohesin is possible
because cohesin around the centromere is protected from cleavage in meiosis I (Brar et
al., 2006; Orr-Weaver, 1999; Klein et al., 1999; Watanabe and Nurse, 1999). This
protection is directly mediated by protein phosphatase 2A (PP2A), bound to its B’ subunit
(Rts1 in S.cerevisiae). Inactivation of PP2A leads to a premature loss of centromeric Rec8
in anaphase I (Kitajima et al., 2006; Riedel et al., 2006). PP2A fulfills its protective
function by dephosphorylating the meiosis-specific cohesin subunit Rec8.
Phosphorylation of Rec8 at multiple sites by DDK and CK1δ/ε is a prerequisite for
cleavage by separase (Ishiguro et al., 2010; Katis et al., 2010). The mutation of 24
phosphosites into alanine residues on Rec8 prevents its cleavage by separase in anaphase
I. Conversely, the phosphomimetic substitutions of 14 residues within the N-terminus of
Rec8 caused the precocious separation of sister centromeres. (Katis et al., 2010).
In addition to PP2A-B’, it was shown that the protein Shugoshin (Sgo1 in S.cerevisiae)
is required for protection of centromeric cohesin in meiosis I (Katis et al., 2004;
Kerrebrock et al., 1995; Kitajima et al., 2004; Marston et al., 2004; Rabitsch et al., 2004).
Sgo1’s function is to recruit the phosphatase PP2A-B’ to chromatin (Kitajima et al., 2006;
Riedel et al., 2006). The stoichiometry of Sgo1 and PP2A is 2:1 (Xu et al., 2009). This
function of Sgo1 is illustrated in Figure 6. Shugoshin exists as two paralogs, Sgo1 and
Sgo2 in most organisms. Both paralogs have different functions and are regulated
differently. In mammals, the protection of centromeric cohesin in meiosis via the
recruitment of PP2A is carried out exclusively by Sgo2 (Lee et al., 2008). Sgo1, on the
other hand, is required for maintaining sister chromatid cohesion in prophase of
mammalian mitosis and does not counteract separase (Salic et al., 2004; Tang et al.,
Figure 6: Function of Shugoshin in centromeric protection of meiotic cohesin. Taken from: Clift, D., and Marston,
A.L. (2011). The Role of Shugoshin in Meiotic Chromosome Segregation. Cytogenet Genome Res 133, 234–242.
1. Introduction
24
2004). The degree of homology between Sgo1 and Sgo2 is very low (Yao and Dai, 2012).
Together with Drosophila, budding yeast is an exception in this respect, as it only has one
Shugoshin version (Sgo1), which fulfills all mitotic and meiotic functions.
Establishment of centromeric protection
While it is well established that Shugoshin is required for centromeric protection and that
it fulfills this role by recruiting PP2A-B’ to chromatin, it is much less clear how the
binding of Shugoshin to chromatin is regulated and which are the relevant binding
partners. It was demonstrated that Sgo1’s localization to chromatin depends on the kinase
Bub1. Bub1 was originally described as a spindle assembly checkpoint kinase (Roberts
et al., 1994). However, it was shown that it fulfills an additional function of regulating
the recruitment of Shugoshin to chromatin. The centromeric localization of Shugoshin in
yeast cells and mammalian cells depends on the presence of Bub1 (Kiburz et al., 2005;
Kitajima et al., 2004; Kitajima et al., 2005; Tang et al., 2004). The relevant substrate for
Bub1 phosphorylation is the histone H2A. Again, this substrate is conserved from yeast
to humans. In human cells, hSgo1 is removed from chromosomes after treatment with
hBub1 small interfering RNA. In yeast, mutation of the corresponding serine/threonine
residues to alanine results in a complete loss of Shugoshin-chromatin interaction
(Kawashima et al., 2010). Human and fission yeast Sgo1 additionally depend on the
heterochromatin protein HP1 for their localization to chromosomes (Yamagishi et al.,
2008). Budding yeast, by contrast, does not have pericentromeric heterochromatin.
Nevertheless, it was reported that the budding yeast kinetochore proteins Iml3 and Chl4
contribute to the localization of Sgo1 (Kiburz et al., 2005). Iml3 and Chl4 are both
subunits of the Ctf19 complex, which is required for the recruitment of the cohesin loader
Scc2/Scc4 (Ciosk et al., 2000; Hinshaw et al., 2017; Hu et al., 2011; Natsume et al., 2013).
Controversial reports exist about the role of cohesin in the recruitment of Shugoshin.
Performing a ChIP analysis of yeast cells, Kitajima (2004) reported that they “found that
Rec8 localization is not dependent on Sgo1 and vice versa […]. This independence of
localization ensures that the mechanism protects Rec8 only at centromeres and not along
chromosome arm regions.” If Sgo1 were recruited to chromosome arm sites, it would
have catastrophic consequences, as it would protect arm cohesin from cleavage in meiosis
I, thus, preventing the first meiotic division (Kitajima et al., 2006; Riedel et al., 2006). A
similar result was reported for Drosophila. Lee et al. (2004) analyzed the recruitment of

1. Introduction
25
the Shugoshin-homolog MEI-S332 to chromosomes, using immunofluorescence analysis
of cells in which cohesin was depleted and reported that their “results demonstrate that
the localization of MEI-S332 is independent of cohesin”. Using immunofluorescence
analysis of mouse spermatocytes, Gómez et al. (2007) found that SGO2 and REC8 only
weakly co-localize in metaphase I of meiosis (Figure 7). In this study, REC8 displayed
an X-shaped pattern, whereas SGO2 displayed a triangular pattern. The sole area of co-
localization was at the center of the SGO2 triangular, which overlapped with the outer
ends of the REC8 X-pattern. Concerning a possible loading mechanism of SGO2 onto
chromosomes, one would not consider REC8 to be a strong candidate for a loading factor,
taking into account the weak co-localization of the two proteins.
On the other hand, using immunofluorescence analysis of mouse oocytes, Lister et al.
(2010) showed that the localization of SGO2 depends on the presence of functional
cohesin complexes. In oocytes of mice, in which the meiosis-specific cohesin subunit
Smc1β was knocked-out, SGO2 failed to accumulate on chromosomes. Also in maize,
recruitment of Sgo1 is Rec8-dependent (Hamant et al., 2005). Similarly, in budding yeast,
Sgo1 is absent from chromosomes, if Rec8 is deleted (Kiburz et al., 2005). Finally, in
humans, cohesin mediates the centromere localization of Sgo1 (Liu et al., 2013a; Liu et
al., 2013b).
Figure 7: Immunofluoresence images of SGO2 and REC8 in mouse spermatocytes. Both proteins were imaged in
metaphase I and show a different distribution. The area of overlap is small. Taken from and modified: Gómez, R.,
Valdeolmillos, A., Parra, M.T., Viera, A., Carreiro, C., Roncal, F., Rufas, J.S., Barbero, J.L., and Suja, J.A. (2007).
Mammalian SGO2 appears at the inner centromere domain and redistributes depending on tension across centromeres
during meiosis II and mitosis. EMBO Rep 8, 173–180.

1. Introduction
26
Regulation of centromeric protection
If Sgo1 and with it PP2A were recruited to chromosome arm sites, it would have
catastrophic consequences, as it would protect arm cohesin from cleavage in meiosis I,
thus, preventing the first meiotic division (Kitajima et al., 2006; Riedel et al., 2006).
Consequently, the most important question concerning the regulation of the recruitment
of the centromeric protection machinery is how to exclude Sgo1 from chromosome arms.
One effector reported to regulate Shugosin’s recruitment to chromatin is the
Chromosomal Passenger Complex (CPC). The CPC is a conserved protein complex,
consisting of four subunits, called AuroraB/Ipl1, INCENP/Sli15, Survivin/Bir1, and
Borealin/Nbl1 (Nakajima et al., 2009). It has been connected to various functions of the
mitotic cell-cycle, including chromosome-microtubule interactions, sister chromatid
cohesion and cytokinesis (Ruchaud et al., 2007). In fission yeast, Drosophila and humans,
it was shown that inhibition of single components of the CPC leads to a loss of
centromeric localization of Shugoshin (Resnick et al., 2006; Huang et al., 2007;
Kawashima et al., 2007). However, it is unclear whether this function of the CPC is also
conserved in S. cerevisiae. Another protein that was demonstrated to regulate the
recruitment of Shugoshin to chromosomes is the polo-like kinase (Cdc5 in S. cerevisiae).
For Drosophila, it was shown that the Shugosin-homolog MEI-S332 carries POLO
binding sites and associates with this kinase in vivo (Clarke et al., 2005). POLO was
further described in this paper as a major regulator and antagonizer of MEI-S332 function.
In human mitosis, only the Shugoshin paralog SGO1 is expressed, but not the meiosis-
specific SGO2. For the mitotic Shugoshin, it was shown that depletion of Plk1, the human
polo homolog, stimulates the recruitment of Sgo1 to chromosomes, supporting a possibly
antagonizing function of the polo-like kinase (Tang et al., 2006). A third reported
regulator of Shugosin’s recruitment to chromosomes is the phosphatase complex PP2A,
which is known to mediate centromeric protection by dephosphorylating Rec8. By using
chromosome spreads, Tang et al. (2006) found that in mammalian mitosis the Sgo1–PP2A
interaction is required for centromeric localization of Sgo1.
Another important question concerning the regulation of centromeric protection is the
inactivation of the centromeric protection machinery after meiosis I so that centromeric
cohesin can be cleaved in meiosis II. This inactivation is also called “deprotection” of
centromeric cohesin. Without deprotection, it would not be possible to segregate sister
chromatids and thus, the cells would arrest in meiosis II. Several mechanisms for

1. Introduction
27
deprotection have been proposed in the literature (Arguello et al., 2017; Clift and Marston
2011; Gómez et al., 2007; Kitajima et al., 2004; Lee et al., 2008). Recently, it was reported
that in mice, deprotection occurs via an inhibitor of PP2A’s enzymatic function. This
inhibition of PP2A is mediated by the conserved histone chaperone SET/TAF-1b
(Chambon et al., 2013). However, it is not known whether the same mechanism
deprotects centromeric cohesin in yeast.
Aim of the study
During meiosis, cohesin is first removed from chromosome arms in anaphase I, followed
by removal of pericentromeric cohesin in anaphase II. This stepwise loss of cohesin is
part of the current model of meiotic chromosome segregation. Evidence for this kind of
cohesin dynamics came originally from immunofluorescence experiments with very
limited temporal and spatial resolution (Klein et al., 1999; Watanabe and Nurse, 1999).
These dynamics were later confirmed by live-cell imaging (Katis et al., 2010). Even
though live-cell imaging provides an excellent temporal resolution of cellular events, its
spatial resolution is very limited, especially in small yeast cells.
This study aims to overcome this limitation by combining a novel synchronization system
for budding yeast meiosis with an optimized and calibrated chromatin
immunoprecipitation followed by sequencing (ChIP-Seq) protocol to establish an assay
with a yet unprecedented temporal and spatial resolution.
With this assay, we aim to analyze the behavior of meiotic cohesin in the course of the
two meiotic divisions. Moreover, we aim to analyze the protein Sgo1, which is required
to recruit the protection machinery to chromosomes to generate novel insights into the
temporal-spatial dynamics of cohesin and its protector.

2. Results
28
2. Results
Several critical steps of meiosis require the cohesin protein complex, like cohesion of
sister chromatids after replication, DNA damage repair, recombination in prophase, and
chromosome segregation. Cohesin interacts with DNA topologically, and it shows a
meiosis-specific two-step cleavage behavior during the two meiotic divisions. However,
most of what we know about the in vivo dynamics of meiotic cohesin comes from
immunofluorescence experiments with limited spatial resolution. We therefore aimed to
analyze the behavior of meiotic cohesin with almost single-nucleotide precision, using a
biochemical ChIP assay. Biochemical methods analyze samples comprising from
thousands to billions of individual cells. The measured signal thus represents an average
of those cells. To study a physiological process in time, using a biochemical method, it is
therefore crucial that the analyzed samples genuinely represent specific stages of this
process. To achieve an enrichment of cells of a specific physiological stage in samples of
a yeast meiotic time course, our lab has developed a new synchronization system, which
allows generating highly synchronous meiotic cultures. This system was named CDC20-
meiotic-arrest/release (CDC20-mAR) and is based on depletion of the APC/C
activator/substrate-recognition factor Cdc20, which arrests the cells in metaphase I,
followed by induction of Cdc20, which is controlled by the copper-inducible CUP1
promoter (Arguello et al., 2017). Hence, by adding CuSO4 to a culture of metaphase I-
arrested cells, the cells are released from the arrest and synchronously undergo the two
meiotic divisions. Having this system available, it is now possible to use biochemical
methods like ChIP to analyze those samples with a sufficiently high temporal resolution.
Establishment of ChIP-qPCR for meiosis
Our first attempts to analyze meiotic samples from S. cerevisiae cultures using existing
ChIP protocols did not yield meaningful results. Therefore, we decided to establish a ChIP
assay by systematically adjusting the experimental steps and thus, optimize the protocol
specifically for our meiotic experimental conditions. ChIP is a method to determine the
in vivo binding sites of a protein of interest on DNA (Park, 2009). The method comprises
several consecutive experimental steps (Figure 8). It starts with treating a cell suspension
with a cross-linking agent, to chemically stabilize the protein-DNA interactions at the

2. Results
29
time of sampling. Subsequently, the cells are lysed, and the chromatin is fragmented and
solubilized. The chromatin fragmentation can be performed via physical, enzymatic or
chemical methods (Head et al., 2014). Then, the protein of interest is enriched together
with its cross-linked chromatin interactors by immunoprecipitation. Next, the obtained
samples are purified to separate the DNA from all other cellular components like, e.g.
proteins and RNA. Finally, the purified DNA samples are analyzed by either qPCR, to
measure the concentration of specific DNA fragments or by next-generation sequencing
(NGS) technologies, to generate a comprehensive, genome-wide map of protein-DNA
interaction sites.
Thus, ChIP is a complex multi-step biochemical method. Adapting existing protocols to
a new experimental setting is therefore not trivial, because of a large number of
parameters that could be changed and might potentially influence the result. The problem
becomes even more complicated, due to possible second or higher order effects between
parameters: The optimal setting for one parameter might be dependent on the settings of
other parameters. A systematic approach to addressing such a multi-parameter problem
is statistical experiment planning a method known as design of experiments (DOE)
Figure 8: ChIP workflow. Taken from: Barski, A., and Zhao, K. (2009). Genomic location analysis by ChIP-Seq. J.
Cell. Biochem. 107, 11–18.
2. Results
30
(Tanco et al., 2007). The concept of DOE is to design an experiment in such a way that it
allows to vary multiple input factors (parameters) in one single experiment and still
generate meaningful results (Grömping, 2014). The outcome of the experiment will be an
estimate of the effect of each input factor on the result of the ChIP experiment, making it
possible to identify the critical parameters. Manipulating several input factors in one
experiment allows identifying the critical factors in a fast and efficient way. For the task
of establishing a ChIP-qPCR workflow for S. cerevisiae meiosis, we defined two critical
output parameters for optimization of the workflow. First, the center of mass of the
chromatin fragment size distribution after sonication and second, the intensity of the
ChIP-qPCR signal. Analyzing the DNA in the purified samples at the end of the ChIP
workflow is a random sampling process. Therefore, efficient fragmentation is essential to
allow an unbiased random sampling of DNA fragments, genuinely representing the
distribution of in vivo protein binding sites. Too large chromatin fragments can negatively
influence the data quality (O’Geen et al., 2011). It is recommended to aim for a chromatin
fragment size not larger than 600 bp (Park, 2009). Evaluating the literature on chromatin
fragmentation conditions shows that optimal conditions for chromatin fragmentation vary
strongly, depending on the used cell type, the physiological conditions and the technical
equipment for sonication. Bortz and Wamhoff (2011) recommend chromatin shearing by
sonication for 30 minutes, for example, whereas Kugou and Ohta (2009) established 2
minutes of sonication in their protocol. Another problem in adapting published ChIP
protocols arises from the fact that sonicators for chromatin shearing are available from
different manufacturers and the settings of those machines cannot be compared directly,
due to lack of technical standardization. Hence, it was unclear, which are the optimal
chromatin shearing conditions for our meiotic experimental setting. We chose the ChIP-
qPCR signal as a second output parameter, as we hypothesized that a high qPCR signal
would allow detecting also small physiological changes in the cells, without losing those
differences in the technical noise. Hence, we aimed to generate the highest possible ChIP-
qPCR signal from our samples. The input factors we wanted to screen for their effect on
those two output factors using DOE, were: Fixation time, time of chromatin shearing, cell
density, shearing power, chromatin shearing duty factor, the concentration of fixative,
cycles/burst during chromatin shearing and the shearing buffer type. We fixed the cells
in an aqueous formaldehyde solution. The chromatin was sheared using an S220 Covaris
water bath sonicator. Duty factor is the percentage of active treatment during the total run

2. Results
31
time. Cycles/burst denote the number of acoustic oscillations in each burst; it is identical
to the audio frequency. As shearing buffers, we tested the commercially available Covaris
truChIP Chromatin Shearing Reagent Kit against a self-mixed buffer according to the
Figure 9: Measured values of the output factors “ChIP-qPCR” and “Shearing” after realization of the fractional
factorial design, comprising 16 runs and two sets of duplicates. (A) ChIP-qPCR values for 20 samples. For each
sample the values of two different loci were measured in duplicates. The y-axis denotes the enrichment in the
immunoprecipitation samples (IP) over the whole cell extract samples (WCE). Samples 1 to 16 are the experimental
runs with changing input parameter values. Samples 17 and 18 are duplicates and define the center points for buffer
1, sample 19 and 20 are duplicates and define the center points for buffer 2. (B) Bioanalyzer profiles of the same 20
samples show the chromatin fragment size distributions after shearing on a Covaris water bath sonicator. The
horizontal axis on the small diagrams denotes the fragment size in base pairs.

2. Results
32
protocol of Kugou and Ohta (2009). The experimental plan was calculated using the R
Package FrF2 (Grömping, 2014). The chosen design was a two-level fractional factorial
with resolution IV. Two level means that each input factor was represented by two values
in the experiment. Resolution IV implies that the design allows estimating the main effect
of each input factor in a linear regression model and allows to test its statistical
significance. A fractional factorial design to examine eight input factors at resolution IV
requires 16 experimental runs and two sets of replicates to define center points (Appendix
A1). The final result comprises a total of 20 values (16 runs and two sets of duplicates)
for each output factor (Figure 9 A and B). We transformed the 20 values into a data vector
and used the lm function of R to fit a linear model to these data (Table 1).
For the output factor “ChIP-qPCR”, the p-value of the input factor “shearing buffer type”
is 0.00329, indicating that it is highly statistically significant. The coefficient for this input
factor is 0.024734, meaning that on average of all samples, the selection of the shearing
buffer affects the ChIP-qPCR signal by 2.47 ChIP%. For ChIP-qPCR, an enrichment of
2.47 ChIP% is quite high, suggesting that the shearing buffer composition is a very critical
factor. In this experiment, only the input factor “shearing buffer type” was identified to
Table 1 Effect of eight different input factors on the two output factors ChIP-qPCR and shearing, estimated in a
linear model. The first column lists the eight input factors. The columns labeled “coefficient estimate” contain the
quantified effect on the output factors. Std Error denotes the standard deviation of the coefficient estimate and
measures how precisely the unknown coefficient is modeled. The t-value is calculated dividing the coefficient
estimate by the std. error, it allows calculating the p-value. The p-value indicates whether an input factor has a
significant effect on the output factor
ChIP-qPCR Shearing
Coeffcient
estimate
Std.
Error
t value Pr(>|t|) Coefficien
t estimate
Std.
Error
t value Pr(>|t|)
tFix 0.002568 0.005665 0.453 0.66407 0.001257 0.009656 0.130 0.90008
tShear -0.003030 0.005665 -0.535 0.60932 0.001973 0.009656 0.204 0.84391
density -0.001653 0.005665 -0.292 0.77888 0.016280 0.009656 1.686 0.13565
power -0.007883 0.005665 -1.392 0.20669 0.010817 0.009656 -1.120 0.29957
duty -0.008597 0.005665 -1.518 0.17292 -0.010449 0.009656 -1.082 0.31505
cFix 0.005086 0.005665 0.898 0.39919 -0.006972 0.009656 -0.722 0.49369
cycles 0.007387 0.005665 1.304 0.23349 0.021365 0.009656 2.213 0.06255
buffer -0.024734 0.005665 -4.366 0.00329 ** -0.040481 0.009656 -4.193 0.00407
**

2. Results
33
be statistically significant because its effect on the ChIP-qPCR signal and the shearing is
so dominant that it masks the potential effect of all other input factors. With an experiment
comprising of 16 runs, it is not possible to detect smaller effects of different input factors
if one input factor is very dominant.
Due to these results, we asked which are the critical components of the shearing buffer.
To address this, we compared the composition of the Covaris truChIP shearing buffer to
the buffer according to Kugou and Ohta (2009) and systematically tested the different
components: Buffer system, salt concentration and type and concentration of detergents.
We found that the salt concentration in the shearing buffer particularly affected the
chromatin shearing pattern (Appendix A4). We conclude that no extra salt should be
added to the shearing buffer. To investigate the effect of the buffer system, we performed
Figure 10: Effect of the buffer system on ChIP-qPCR and the chromatin shearing. Tris-HCl-based shearing buffer
(pH 7.5) was compared to Hepes-KOH-based shearing buffer (pH 7.5) under otherwise identical conditions. (A) ChIP-
qPCR of duplicates for each buffer. For each sample the values of two different loci were measured. The y-axis denotes
the enrichment in the immunoprecipitation samples (IP) over the whole cell extract samples (WCE). (B) Chromatin
fragment size distribution after sonication of the same samples like in A. The horizontal axis on the small Bioanalyzer
diagrams denotes the fragment size in base pairs.

2. Results
34
chromatin shearing in a buffer consisting of 10mM Tris-HCl (pH 7.5), 0.1 % Na-
Deoxycholate, 1 % Triton X-100, 1mM EDTA versus a buffer consisting of 10mM
Hepes-KOH (pH 7.5), 0.1 % Na-Deoxycholate, 1 % Triton X-100, 1mM EDTA. We
found that the buffer system had a moderate, but reproducible effect on the ChIP-qPCR
signal (Figure 10 A) and the chromatin shearing pattern (Figure 10 B). Shearing the
samples in the Hepes-based buffer, generated a qPCR signal, which was on average 0.7
ChIP% higher, compared to shearing in the Tris-based buffer. We conclude that a
shearing buffer should be composed of a Hepes-KOH-based buffer system.
Finally, we elucidated the effect of the detergent type and detergent concentration on the
ChIP-qPCR signal (Figure 11 A) and the chromatin fragment size distribution after
sonication (Figure 11 B). We sonicated samples in shearing buffers containing either 1 %
Triton X-100, or 0.05 % SDS or none of the two detergents, respectively. Strikingly, the
ChIP-qPCR signal of the Triton X-100 samples was almost 10-fold higher than that of
the SDS samples (Figure 11 A). This difference of nearly one order of magnitude
demonstrates that the most critical component in the shearing buffer is the detergent type
Figure 11: Effect of different detergents on the qPCR signal and the chromatin shearing pattern. (A) ChIP-qPCR
of three different loci, each bar represents the mean of four samples. Control samples were sheared without detergent,
In SDS+Dia samples SDS was dialyzed-out after the shearing and prior to the IP. (B) Size distribution of chromatin
fragments after sonication. The horizontal axis on the small Bioanalyzer diagrams denotes the fragment size in base
pairs., the vertical axis shows an arbitrary unit, correlated to the amount of input material. Detergents improve the
chromatin shearing.

2. Results
35
and concentration. We concluded that SDS should not be used as a shearing buffer
component if a high qPCR signal is the goal. Instead, Triton X-100 is the preferred
detergent.
Using the same optimized shearing buffer for all samples, we conducted a second
fractional factorial experiment. The design and resolution were identical to the first one,
only the input factor “shearing buffer” was substituted by the input factor “protease
inhibitors”. This new input factor tested a standard protease inhibitor cocktail against a
combination of two protease inhibitor cocktails and PMSF. Again, the ChIP-qPCR signal
of two loci and the size distribution of the chromatin fragments after sonication were
measured for every sample and used as output factors. Like in the previous factorial
experiment, the results were converted into a data vector, and a linear model was fitted to
those data using R (Table 2). By using the same shearing buffer for all samples, we
identified two additional input factors as having a statistically significant effect on the
ChIP-qPCR signal: The time of fixation and the time of shearing. The other input factors
had minor or no impact.
Table 2: Effect of eight different input factors on the two output factors ChIP-qPCR and shearing, estimated in a
linear model. The first column lists the eight input factors. The columns labeled “coefficient estimate” contain the
quantified effect on the output factors. Std Error denotes the standard deviation of the coefficient estimate and
measures how precisely the unknown coefficient is modeled. The t-value is calculated dividing the coefficient estimate
by the std. error, it allows calculating the p-value. The p-value indicates whether an input factor has a significant
effect on the output factor.
ChIP-qPCR Shearing
Coeffcient
estimate
t value Pr(>|t|) Coeffcient
estimate
t value Pr(>|t|)
protInhib 0.0008924 0.309 0.76665 -0.0079294 -1.515 0.1735
tShear -0.0075651 -2.616 0.03464 * -0.0105199 -2.010 0.0843
density 0.0016922 0.585 0.57688 0.0076618 1.464 0.1866
power -0.0002973 -0.103 0.92101 0.0003505 0.067 0.9485
duty -0.0053879 -1.863 0.10478 -0.0110394 -2.109 0.0729
cFix -0.0011303 -0.391 0.70759 0.0033991 0.650 0.5367
cycles -0.0031364 -1.084 0.31413 0.0013369 0.255 0.8057
tFix 0.0119425 4.129 0.00441 ** 0.0146945 2.808 0.0262 *

2. Results
36
Having identified the time of fixation as a significant determinant out of our initial set of
input factors suggests that the fixation conditions, in general, are likely to have a
substantial effect on the results of a ChIP experiment. Reports in the literature indicate
that apart from the time of fixation, the pH at which the fixation reaction takes place is a
crucial factor for the reaction kinetics of a formaldehyde fixation reaction (Berod et al.,
1981). To address this issue, we performed an experiment to test the formaldehyde
fixation of meiotic yeast samples in different fixation solutions at different pH. To induce
meiosis, we transferred the yeast cells into sporulation (SPO) medium, which only
contains water and salts. Hence, no additional components, which are reactive towards
formaldehyde are present in a meiotic yeast culture medium. This lack of competitive
reaction partners makes it possible to perform the fixation directly in the meiotic culture
medium. We tested this option against fixation in two different buffered fixation
solutions. We buffered one solution to a pH of 8.0 using Hepes-KOH and the other
solution to a pH of 9.0 using a carbonate buffer system. Subsequently, we subjected the
samples from all three fixation conditions to the same downstream ChIP protocol, with
Figure 12: Effect of the fixation conditions on the qPCR signal and the chromatin shearing pattern. S. cerevisiae
samples were fixed in different fixation solutions. Control samples were fixed in SPO culture medium without
addition of buffer. Hepes and Carbonate samples were fixed in a buffered fixation solution at the indicated pH. (A)
qPCR signal of three different loci for each condition. Each bar represents the mean of two samples. (B) The
corresponding chromatin fragment size distributions after sonication of the same samples. The horizontal axis on
the small Bioanalyzer diagrams denotes the fragment size in base pairs.

2. Results
37
qPCR and a Bioanalyzer measurement as the final readout. We observed that the samples,
which we fixed directly in the meiotic culture SPO medium, generated the highest qPCR
signal. In contrast to the samples, which we fixed in one of the buffered fixation solutions,
for which we measured a reduced qPCR signal (Figure 12 A). Moreover, fixation in one
of the buffered solutions shifts the Bioanalyzer curves slightly to the left, towards a
smaller fragment size (Figure 12 B). The reduced fragment size in those samples suggests
that the fixation reaction was less intense, as the shearing conditions were the same for
all samples. Thus, we established that for a meiotic ChIP experiment, direct fixation in
the meiotic culture medium is strongly favored.
Next, we performed a full factorial experiment with a reduced number of input factors to
confirm all of the above findings and to reveal potential second-order effects between the
input factors. The salt concentration of the IP reaction was included as an additional input
factor in this factorial run and tested for its impact on the output factors. The shearing
buffer was the same for all samples (Appendix A2). This experiment confirmed that the
time of fixation and the time of shearing have both a statistically significant effect on the
ChIP-qPCR signal and the shearing result. The other two tested factors had no significant
Table 3: Effect of four different input factors on the two output factors ChIP-qPCR and shearing, estimated in a
linear model. The first column lists the four input factors, as well as possible combinations of two-factor
interactions. The columns labeled “coefficient estimate” contain the quantified effect on the output factors. Std
Error denotes the standard deviation of the coefficient estimate and measures how precisely the unknown coefficient
is modeled. The t-value is calculated dividing the coefficient estimate by the std. error, it allows calculating the p-
value. The p-value indicates whether an input factor has a significant effect on the output factor.
ChIP-qPCR Shearing
Coeffcient
estimate
t value Pr(>|t|) Coeffcient
estimate
t value Pr(>|t|)
tShear -0.008178 -2.941 0.01343 * -0.076928 -9.297 1.52e-06 ***
NaCl 0.003037 1.092 0.29810 -0.008491 -1.026 0.3269
protInhib -0.001930 -0.694 0.50199 0.004714 0.570 0.5803
tFix 0.009421 3.388 0.00606 ** 0.018627 2.251 0.0458 *
tShear:NaCl -0.0044626 -1.894 0.116783 -0.008479 -1.510 0.1914
tShear:protInhib 0.0028812 1.223 0.275920 0.009863 1.757 0.1393
tShear:tFix -0.0034168 -1.450 0.206747 0.007412 1.320 0.2440
NaCl:protInhib -0.0039956 -1.696 0.150719 -0.013592 -2.421 0.0601
NaCl:tFix 0.0011862 0.503 0.636073 -0.007736 -1.378 0.2267
protInhib:tFix -0.0002085 -0.088 0.932917 0.011260 2.005 0.1012

2. Results
38
effect. Moreover, no second-order effects could be detected among the input factors,
implying that all input factors act independently on the output factors, regardless of the
value of the other tested input factors (Table 3). The estimated coefficients for the
shearing time and fixation time are -0.82 and 0.94, respectively, indicating that a reduced
shearing time and an increased fixation time result in an increase of the ChIP-qPCR signal
by approximately 1.76 ChIP% for the tested genomic locus.
Taken together, we show that the composition of the shearing buffer, the time of shearing
and the time of fixation are the primary determinants of the chromatin shearing pattern
and the qPCR signal in a meiotic ChIP experiment. No second-order effects exist among
those factors, implying that they act independently on the results and that they can be
modified and optimized separately. We identified the shearing buffer as the most crucial
component for the result of a ChIP experiment, and particular care should be taken to
optimize this often neglected factor. The buffer system, the salt concentration and in
particular the detergents of the shearing buffer all affect the result. Of these components,
the detergent type is the most important one. Concerning the fixation conditions, we
established that for meiotic experiments, the fixation of the cells should be performed
directly in the culture medium without using a special buffer.
For our meiotic ChIP-qPCR experiments, we established the following conditions: 40
min fixation at a final concentration of 3 % formaldehyde, which is added directly to the
meiotic culture. 22 min sonication in a shearing buffer consisting of 10 mM Hepes-KOH
(pH 7.5), 0.1 % Na-Deoxycholate, 1 % Triton X-100, 1mM EDTA.
ChIP-qPCR of meiotic cohesin
Having established the optimal conditions for ChIP-qPCR in meiosis, we performed a
meiotic time course experiment, using CDC20-mAR strains, in which the meiosis-specific
cohesin subunit Rec8 was Ha3-tagged. Two S. cerevisiae cultures were induced to enter
meiosis and arrested in metaphase I after eight hours. Then, we released one of the two
cultures from the arrest by addition of CuSO4, which subsequently underwent the two
meiotic divisions synchronously. The other culture was kept in a prolonged arrest.
Starting from the time of release, we took samples every 20 minutes over a time of 2.5
hours, fixed them in formaldehyde, washed and stored them at -80°C. To assure that the
two cultures arrested in metaphase I and that the release was highly synchronous, we first

2. Results
39
subjected the samples to immunofluorescence analysis to assess the meiotic stage of the
cells (Figure 13 A). For this purpose, we stained the meiotic spindles. The spindles can
be used as meiotic stage markers. For each sample this meiotic stage marker and the
nuclear division was assessed in 100 cells. In both cultures, the majority of cells arrested
in metaphase I after eight hours. 40 minutes after the release, only a tiny fraction of the
cells in the released culture still exhibited metaphase I spindles, contrary to the arrested
culture, in which the fraction of metaphase I cells stays almost constant. Concomitant,
most of the cells in the released culture displayed two nuclei (2 N) after 40 minutes. The
peak of anaphase I spindles occurs approximately 40 minutes after the release, the
Figure 13: ChIP analysis of the cohesin subunit Rec8-ha3 in a meiotic yeast culture synchronized by the CDC20-
mAR system. The culture was arrested in metaphase I and synchronously released from the arrest at 0 minutes (right
diagram) or kept in a prolonged metaphase I arrest (left diagram). (A) Immunofluoresence countings of meiotic
spindles and nuclear division to assess the meiotic stage of individual time point samples. Spindles were visualized by
staining of tubulin with a specific antibody. Nuclei were visualized by DAPI staining of DNA. (B) ChIP-qPCR of the
same meiotic samples. Three different loci on chromosome VI. were analyzed.

2. Results
40
maximum of metaphase II spindles after 60 minutes and that of anaphase II spindles after
80 minutes. 120 minutes after the release, the majority of cells in the released culture
showed four nuclei (4 N), indicating completion of the two meiotic divisions. In the
arrested culture, nearly three-quarter of cells still displayed intact undivided nuclei at this
time point.
To analyze the behavior of meiotic cohesin during the two divisions, we subjected all the
samples of this time course to our optimized ChIP-qPCR protocol (Figure 13 B). In the
IP reaction, we enriched for the ha-tagged meiosis-specific Rec8 cohesin subunit. After
purification of the ChIP samples, we analyzed the obtained DNA samples using qPCR
primers specific for three different loci on chromosome VI. Each locus representing a
distinct “class” of cohesin: The first locus is at the chromosome arm, with a very low
enrichment of cohesin in a wildtype cell (“arm cohesin low”), as was determined by others
(Lengronne et al., 2004). The second locus represents a cohesin peak region on the
chromosome arm (“arm cohesin peak”). The third locus represents a cohesin peak region
in the protected region close to the centromere (“pericentromeric cohesin”). As expected,
in metaphase I (0 min), the qPCR signal at the cohesin peak sites at the chromosome arm
and around the centromere are much higher than that of the arm site with low cohesin
enrichment. 40 minutes after the release from the arrest, when most of the cells are in
anaphase I, the qPCR signal of the “arm cohesin peak” site is almost as low as the signal
of the “arm cohesin low” site, indicating the complete removal of arm cohesin. The qPCR
signal of the “pericentromeric cohesin” site, on the other hand, is still at approximately
50 % of its initial level at this time. 100 minutes after the release, when most cells are
post-anaphase II and completed the two meiotic divisions, the signal of all three loci
collapse at a low level.
The qPCR signals of the arrested culture, on the other hand, display a slow decline over
time, with no abrupt change between time points. This difference between the two
cultures demonstrates that the qPCR pattern of the released culture is indeed a
consequence of the release from the metaphase I arrest and reflects the behavior of
cohesin during the two meiotic divisions.
To demonstrate the robustness of our approach and to show that the measured cohesin
dynamics in the released culture is reproducible, we performed two additional
experiments with several weeks in between. Again, we measured the qPCR signal of the
same three loci as in the first experiment and calculated the mean for each time point and

2. Results
41
each locus independently. We then plotted the calculated means as time course series. To
assess the variation between the three experiments, we calculated the standard deviation
and plotted one standard deviation as error bar for every data point (Figure 14 A). To
correct for variations due to different amounts of input material or different IP
efficiencies, we normalized the qPCR signals of individual time courses to the highest
signal in the respective time course, which is the initial arm peak signal, before calculation
of the mean. This transformation equals the starting level of each time course’s signal.
Thus, this transformation allows focussing solely on variations that reflect different
temporal dynamics of the three investigated loci. However, it excludes variations that
arise from different starting levels of the qPCR signal, demonstrating the robustness and
reproducibility of our approach (Figure 14 B). Forty minutes after the release from the
metaphase I arrest, the signal at the “arm cohesin peak” locus almost collapses with the
“arm cohesin low” signal, indicating completion of arm cohesin removal. At this time,
the pericentromeric signal is still at approximately 50 % of its initial level. It takes 80
minutes after the release for the pericentromeric signal to fall to the same low level and
almost collapse with the “arm cohesin low” signal.
Figure 14: Mean of three independent biological replicates of a ChIP-qPCR analysis of the meiosis-specific cohesin
subunit Rec8-ha3 in CDC20-mAR strains. The measurement starts when the cells were released from the metaphase
I arrest at 0 minutes. (A) Mean of the qPCR signal of three independent biological replicates. The error bars indicate
one standard deviation. (B) Mean of the normalized qPCR signal of the same three biological replicates. The error bar
again indicates one standard deviation. The vertical axis is the qPCR signal, relative to the arm cohesin peak signal.

2. Results
42
Collectively, we show that once APCCdc20 is activated by addition of CuS04, cohesin is
removed from the chromosome arm as well as the pericentromeric region. However, the
rate of reduction is different between the investigated loci. At the chromosome arm, the
qPCR signal is reduced very abruptly, and most of the signal is lost within the first 40
minutes after the release. In the pericentromeric region, on the other hand, the rate of
reduction is slower, and it takes more than 80 minutes for the signal to be reduced to the
same level like at the other two loci.
Application of a ChIP calibration system for meiosis
To resolve a physiological process in time, one needs to compare samples of the same
experiment relative to each other. Therefore, the measured signals need to be quantitative.
The prerequisite of a quantitative signal is a conceptual problem when using ChIP-Seq
because only ChIP-qPCR generates quantitative data, whereas conventional ChIP-Seq
does not. Recently, a method called Calibrated ChIP (calChIP) was developed that allows
generating quantitative genome-wide data from mitotic cells (Hu et al., 2015). This
calibration technique depends on the presence of a second yeast genome in the samples
and is a bioinformatic method that uses the counts and statistics of short read mapping to
convert conventional ChIP-Seq profiles into genuinely quantitative profiles. This
genome-wide quantitative measurement makes it possible to not only determine the sites
of protein binding but also changes in protein concentration over time.
Establishment of calibrated ChIP-qPCR for meiosis
As described by Hu et al. (2015) we used Candida glabrata as our calibration strain. C.
glabrata is a yeast species with a genome size of 12 million base pairs, organized in 13
chromosomes, which is very similar to the S. cerevisiae genome, consisting of 12 million
base pairs, organized in 16 chromosomes. The phylogenetic distance between both
species is not very high, indicating similar physiological characteristics. This similarity
in physiology is essential because the cells from both strains need to react in a similar
way to the treatment by the ChIP protocol. However, the phylogenetic distance is far
enough for a sufficiently high genomic sequence diversity between both strains. This
diversity is important, so that sequencing reads can be assigned to one of the genomes
based on the DNA sequence. For the calibration system to work it must be possible to

2. Results
43
enrich for a chromatin-bound protein by IP with the same antibody in both strains. In our
experimental setting, we use an anti-ha-antibody to precipitate our protein of interest.
Consequently, a suitable calibration strain for our ChIP workflow needs to express an ha-
tagged chromatin-bound protein as well. However, C. glabrata is a haploid yeast species.
No reports about diploid cells exist to date. Hence, it is not known if this species
undergoes meiosis at all. Therefore, as described in the paper by Hu et al. (2015), we used
the mitosis-specific cohesin subunit Scc1 as our IP target and aimed to ha3-tag Scc1 on
the C-terminus. For this purpose, we designed a tagging plasmid, harboring the C-
terminal part of the C. glabrata SCC1 gene, followed by the Ha3 epitope tag, a marker
cassette conferring resistance to Nourseothricin (NatMX6), and the terminator of the
CgSCC1 gene (Figure 15). Using this tagging plasmid, a C. glabrata wild-type strain,
Figure 15: C. glabrata taggin plasmid map. The construct for tagging consists of a C-terminal CgSCC1 fragment, the
epitope tag, a marker cassette and a CgSCC1 terminator fragment. Additionally, the vector backbone harbors a
resistance cassette and ORI for propagation in E. coli.

2. Results
44
obtained from the National Collection of Yeast Cultures (NCYC), was transformed
according to the protocol described in the materials and methods section. To validate the
expression of the epitope-tagged SCC1 cohesin subunit, we performed a western blot of
TCA samples prepared from a standard mitotic culture of the transformed C. glabrata
strain. Using an anti-ha antibody, we detected a distinct band in the expected size range,
whereas we detected no signal in the negative control, confirming successful epitope
tagging.
To produce calibrated ChIP samples, one needs to mix cells from the experimental strain
and the calibration strain and subjected this mixture to the same downstream treatment.
Subsequently, the DNA amount of both genomic fractions needs to be measured
separately in the obtained, purified DNA samples. This separate measurement is possible
because the degree of sequence homology between both genomes is low. One possibility
is to use genome-specific primers and perform a qPCR measurement for both genomes
separately. The other option is to sequence the samples using NGS technology and assign
individual reads to one of the two genomes based on sequence similarity. In both cases,
the calibration is done by first calculating the IP efficiency of the calibration genome in
every sample, followed by using this value to calibrate the signal from the experimental
genome. We tested the calibration system by first performing a ChIP-qPCR experiment
on two sets of triplicates, comparing the conventional ChIP enrichment
Figure 16: Comparison of conventional ChIP-qPCR signals with calibrated ChIP-qPCR (calChIP-qPCR) signals
of the same samples. The left vertical axis shows the conventional ChIP-qPCR enrichment: IP signal divided by the
corresponding WCE signal. The right vertical axis shows the dimensionless calChIP signal. Two sets of triplicates,
the sample set A and sample set B, were measured with both methods. Variation can be observed between the
replicates of the same sample set, using conventional ChIP enrichment as readout, whereas the calChIP signal of
the same replicates is almost free of variation.

2. Results
45
immunoprecipitated fraction / whole cell extract (IP/WCE) to the calibrated ChIP signal
(Figure 16). Each set of triplicates was generated by pooling samples of different time
points of a meiotic time course and aliquoting them into equal volumes. The average ChIP
enrichment (IP/WCE) of the sample A triplicate is 1.24 %, of the sample B triplicate 1.62
%. However, a substantial variation can be observed between the three replicates of one
sample set. The calChIP signal of the same samples, on the other hand, is 10.9 and 12.6,
confirming a slightly higher enrichment in sample set B. But the variation between the
three replicates of one sample set is much lower. The calChIP signal is dimensionless
because it is calculated by dividing the enrichment of the experimental genome by the
enrichment of the calibration genome. (IP/WCE)exp / (IP/WCE)cal. The coefficient of
variation (CV) of the conventional ChIP enrichment is 24 for sample set A and 52 for
sample set B, compared to 4 for both calChIP signals, demonstrating the striking ability
of the calibration system to correct for most of the technical variation in a meiotic
experimental setting.
Taken together, we demonstrate that the calibration system is successfully established for
ChIP-qPCR experiments, using meiotic samples. We further show that the calibration
system is potent in reducing technical variation and hence, is not only useful for ChIP-
Seq, but also for ChIP-qPCR experiments.
Establishment of calibrated ChIP-Seq for meiosis
To test whether the ChIP samples produced by our calChIP-qPCR protocol were suitable
for generating ChIP-Seq profiles, we subjected those samples to a NGS platform and
mapped the obtained reads to the S. cerevisiae genome. Doing this, we realized that the
DNA amount in our samples was close to the lower limit for preparation of a sequencing
library. Nevertheless, the ChIP-Seq profile of the metaphase I-arrest experimental sample
displayed several Rec8 cohesin peaks, distributed all along the chromosome, consistent
with previously published results (Lengronne et al., 2004). The control sample, on the
other hand, displayed one single central peak around the centromere region (Figure 17).
We hypothesized that this central spike could be an artifact, generated by non-specific
binding of the antibody during the IP enrichment step. Thus, analyzing a sample set with
ChIP-Seq for the first time, revealed that the conditions for optimal ChIP-qPCR samples
do not generate optimal ChIP-Seq samples. Consequently, we had to adapt the protocol
for ChIP-Seq with respect to two parameters. First, we aimed to reduce the artefactual

2. Results
46
enrichment in the centromere region. Second, we sought to increase the DNA amount in
the ChIP samples, to ensure successful sequencing library preparation also for samples
with low protein occupancy.
Antibody titration
As the most likely source of artefactual enrichment of signal is the IP step in the ChIP
protocol, we optimized the antibody concentration in the IP reaction by performing a
titration series (Figure 18 A). The ChIP enrichment of Rec8-ha3 at the centromere, as
measured by ChIP-qPCR, increases with increasing antibody concentrations. Also, the
DNA amount in the samples increased with increasing antibody concentrations. However,
the curve depicting the relationship between the antibody concentration and DNA amount
exhibits a declining slope, indicating that very high amounts of antibody only generate
small amounts of additional DNA (Figure 18 C). Using a set of untagged samples as
control revealed that with increasing antibody concentrations a ChIP signal also appeared
in these samples. Therefore, we calculated the signal/noise ratio by diving the signal of
the tagged sample by the signal of the untagged sample and determined an antibody
amount of 7 µg/sample as optimal (Figure 18 B), because it maximizes the signal/noise
ratio and still pulls-down enough DNA. In an attempt to identify the experimental
conditions, which minimize the non-specific background in our experiments, we tested
the 3F10 α-Ha antibody against the previously used 12CA5 α-Ha antibody. The
Figure 17: Calibrated ChIP-Seq profiles of the occupancy of the meiosis-specific cohesin subunit Rec8 on
chromosome I of S. cerevisiae. The vertical axis shows dimensionless units and represents the quantitative calChIP
signal.

2. Results
47
signal/noise ratio of 7 µg 12CA5 ChIP samples was on average 17. Strikingly, the
signal/noise ratio of 7 µg 3F10 samples was on average 3995, with comparable levels of
signal in the tagged samples. Thus, the 3F10 antibody generates extremely clean,
background-free ChIP samples and is by more than two orders of magnitude superior over
the widely used 12CA5 antibody. Consequently, we established the 3F10 antibody as our
standard ChIP antibody.
Input DNA
To increase the DNA amount in the ChIP samples, we increased the amount of input
material and measured how the ChIP signal reacts to this change. We found that the
calChIP-qPCR signal is almost invariant towards different amounts of DNA in the
Figure 18: Anti-ha antibody titration series. (A) Enrichment of signal measured by ChIP-qPCR in the tagged and
untagged samples. (B) The signal / noise ratio, calculated by dividing the ChIP-qPCR signal of the tagged sample by
the corresponding value of the untagged sample. (C) DNA amount in the tagged samples.

2. Results
48
samples (Figure 19 A). This insensitivity towards the input DNA concentration makes it
possible to increase the amount of input material, without biasing the calChIP-qPCR
results, but allowing for a more efficient sequencing library preparation, due to higher
amounts of DNA in the samples. The technical problem is that measuring the DNA
concentration of the samples is only possible at the end of the ChIP workflow, when the
samples underwent the final purification, making it difficult to directly use the DNA
concentration as a measure for the correct amount of input material in the samples. The
protein concentration in the samples, on the other hand, can easily be measured in the
crude extract after sonication, by using, for example, a colorimetric Bio-Rad Protein
Assay. Correlating the protein concentration of the samples with their DNA content after
purification revealed an almost exact linear relationship between those parameters (Figure
19 B), establishing the protein concentration as a reasonable estimate for the final DNA
concentration. Consequently, from this time one, we measured the protein concentration
during every ChIP experiment, to ensure sufficiently high amounts of input material in
the ChIP samples.
Fragment size
One problem arising from increasing the amount of input material was that the size
distribution of chromatin fragments shifted to the right, indicating a less intense
Figure 19: Titration of the input material in a calChIP-qPCR experiment. The horizontal axis in both diagrams
denotes the amount of DNA in the samples. On the left side the calChIP-qPCR signal for three different DNA
concentrations is shown. On the right side the DNA amount in the samples was correlated to the protein concentration
in the whole cell extract before purification of the DNA.
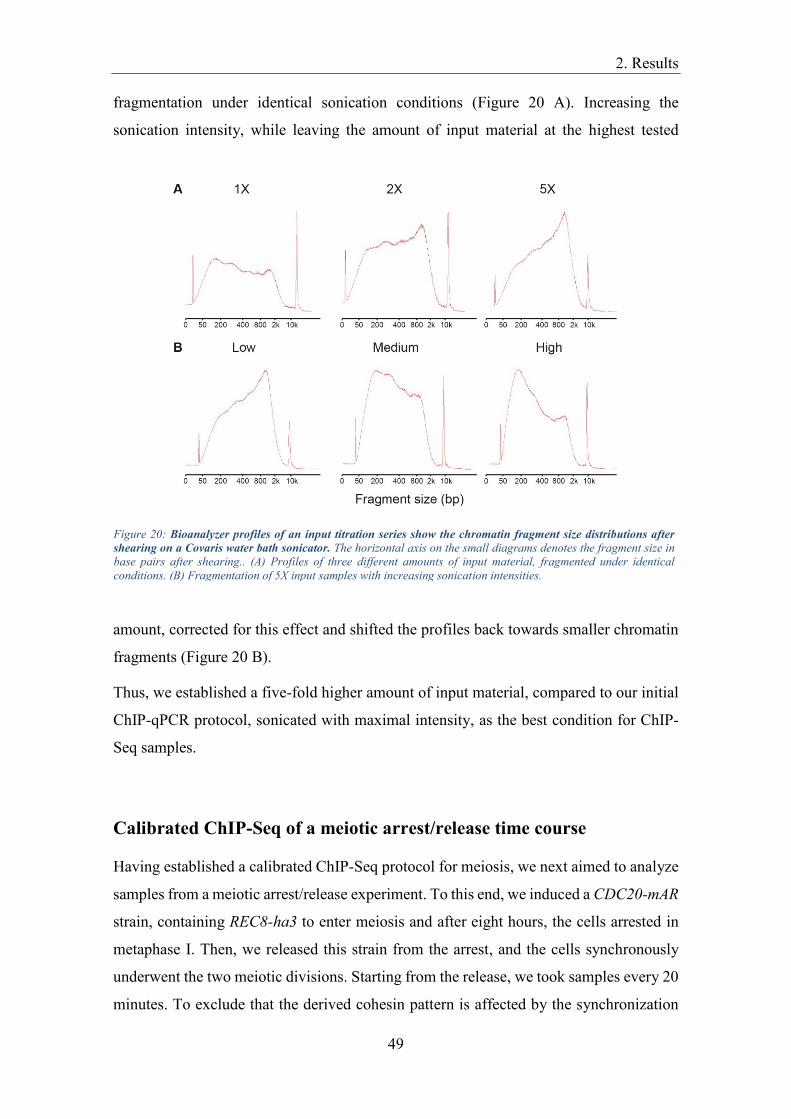
2. Results
49
fragmentation under identical sonication conditions (Figure 20 A). Increasing the
sonication intensity, while leaving the amount of input material at the highest tested
amount, corrected for this effect and shifted the profiles back towards smaller chromatin
fragments (Figure 20 B).
Thus, we established a five-fold higher amount of input material, compared to our initial
ChIP-qPCR protocol, sonicated with maximal intensity, as the best condition for ChIP-
Seq samples.
Calibrated ChIP-Seq of a meiotic arrest/release time course
Having established a calibrated ChIP-Seq protocol for meiosis, we next aimed to analyze
samples from a meiotic arrest/release experiment. To this end, we induced a CDC20-mAR
strain, containing REC8-ha3 to enter meiosis and after eight hours, the cells arrested in
metaphase I. Then, we released this strain from the arrest, and the cells synchronously
underwent the two meiotic divisions. Starting from the release, we took samples every 20
minutes. To exclude that the derived cohesin pattern is affected by the synchronization
Figure 20: Bioanalyzer profiles of an input titration series show the chromatin fragment size distributions after
shearing on a Covaris water bath sonicator. The horizontal axis on the small diagrams denotes the fragment size in
base pairs after shearing.. (A) Profiles of three different amounts of input material, fragmented under identical
conditions. (B) Fragmentation of 5X input samples with increasing sonication intensities.

2. Results
50
procedure we kept the cells in a prolonged metaphase I arrest in another experiment and
assessed whether the cohesin pattern changed under these conditions. To achieve this, we
again used CDC20-mAR REC8-ha3 cells, in which the cells arrested in metaphase I, but
contrary to the first experiments, we never released them into anaphase I.
Immunofluorescence analysis revealed that both cultures stably arrested in metaphase I
with the majority of cells displaying a metaphase I spindle after 8 hours (Figure 21). The
released culture reached the peak of anaphase I spindles after 40 minutes, proceeded
through the second meiotic division and showed four equal masses of DNA in most of
the cells at the end of the time course, indicating completion of meiosis. These
immunofluorescence kinetics were comparable to previously established kinetics (Figure
13 A). The arrested culture, by contrast, displayed metaphase I spindles throughout the
whole time course.
We continued by subjecting these samples to library preparation, NGS, mapping and
calibration to generate calChIP-Seq profiles for a genome-wide data analysis. We started
by comparing the metaphase I Rec8 profiles of all 16 chromosomes. Projecting all profiles
on the same scale visualized the different sizes of the chromosomes comprising the S.
cerevisiae genome, ranging from 230 kb to 1,5 Mb (Figure 22). Similar to previous results
Figure 21: Immunofluoresence countings of meiotic spindles and nuclear division of meiotic time course samples
of CDC20-mAR REC8-ha3 strains. Spindles were visualized by staining of tubulin with a specific antibody. Nuclei
were visualized by DAPI staining of DNA.

2. Results
51
(Kiburz et al., 2005), independently of their size, all chromosomes displayed an almost
Figure 22: Calibrated ChIP-Seq profiles of Rec8 in metaphase I of all 16 chromosomes of S. cerevisiae. The
horizontal axis denotes the chromosomal position in base pairs, on the same scale for all chromosomes. The
quantitative calChIP signal makes the intensities of individual chromosomes directly comparable to each other. The
dark blue arrow indicates the position of the centromere. The signal accumulation near the center of chr XII. is an
artefact from repetitive rDNA loci.

2. Results
52
equal accumulation of cohesin in the pericentromeric region and showed unevenly spaced
cohesin peaks on the chromosomes arms in metaphase I. We observed a high degree of
variation concerning the position of the centromere. Whereas the centromere was
localized almost in the center for some of the chromosomes, it was localized
acrocentrically for others.
Figure 23: Calibrated ChIP-Seq profiles of chromosome I of CDC20-mAR REC8-ha3 strains. The vertical axis
measures the calibrated signal intensity of Rec8-ha3. The time scale denotes minutes after the release from the
metaphase I arrest. Upper profile: The culture was kept in a prolonged arrest. Lower profile: The cells were released
from the arrest 8 hours after transfer to SPO.

2. Results
53
Next, we analyzed individual time points of the arrest/release experiment, displayed as
time series of calChIP-Seq profiles (Figure 23). These profiles showed that 40 minutes
after the release, the peaks on the chromosome arms were almost entirely reduced (Figure
23 B). At this time point, the released culture reached the peak of anaphase I (Figure 21).
Thus, the calChIP-Seq histogram at 40 minutes visualized the state of cohesin at the time
of the first meiotic division: Arm cohesin is cleaved, allowing the spindle microtubules
to pull to opposite spindle poles the maternal and paternal sister chromatid pairs, which
are still held together by the fraction of protected pericentromeric cohesin. Interestingly,
the cohesin peaks in the pericentromeric region also became smaller after 40 minutes,
confirming the previous qPCR results that pericentromeric cohesin is already cleaved in
meiosis I (Figure 14) and only a small fraction of the initial metaphase I cohesin is
protected. After 80 minutes, also the peaks in the pericentromeric region are almost
undetectable, indicating completion of the second meiotic division. Cleaving the
pericentromeric cohesin enables the meiosis II spindle to pull the two sister chromatids
to opposite poles, resulting in four equal masses of DNA. In the arrested culture, the Rec8-
ha3 peaks became slightly broader in this time frame (Figure 23 A). However, no drastic
changes could be observed, demonstrating that cohesin is stably bound to chromosomes
over a long time in a metaphase I arrest. Hence, by arresting the cells in metaphase I, we
did not generate unphysiological loading or loss of cohesin over time. The total amount
of cohesin was constant for more than 9,5 hours, and the localization of the cohesin peaks
did not change.
Taken together these results demonstrate that the obtained profiles reflect very well the
physiological situation in wild-type cells and our synchronization system does not
interfere with the physiological cohesin pattern. Moreover, these results demonstrate that
it is possible to increase the temporal and spatial resolution of cohesin dynamics by
combining a biochemical calibrated ChIP-Seq assay with the novel CDC20-mAR
synchronization system.
Two-step cohesin cleavage in meiosis
Having demonstrated that our experimental set-up is working and that the cohesin
fraction, which is localized around at the centromere in metaphase I, is not identical to
the protected cohesin fraction, we now aimed to analyze and characterize the protected

2. Results
54
cohesin fraction with high spatial resolution on all chromosomes. Previously, our lab
showed that the casein kinase 1δ from budding yeast (called Hrr25) is involved in
regulating the stepwise loss of cohesin during the two meiotic divisions (Arguello et al.,
2017). By inactivating the analog-sensitive mutant of Hrr25 (called hrr25-as1) after the
cells underwent the metaphase I-to-anaphase I transition, it is possible to arrest the cells
in a meiosis II-like state. This arrest makes it feasible to preserve the protected
centromeric cohesin fraction, as it physiologically occurs during the short phase of
Figure 24: Meiotic time course samples of CDC20-mAR REC8-ha3 HRR25 (control) and CDC20-mAR REC8-ha3
hrr25-as1 (experimental) strains. The cells were released from the metaphase I arrest at 0 minutes. After 40 minutes,
the hrr25-as1 inhibitor NM-PP1 was added. (A) Immunofluorescence counting of meiotic spindles and nuclear division
to assess the meiotic stage of individual time point samples. Spindles were visualized by staining of tubulin with a
specific antibody. Nuclei were visualized by DAPI staining of DNA. (B) Calibrated ChIP-qPCR of the same meiotic
samples. Three different loci on chromosome VI. were analyzed.

2. Results
55
metaphase II, for a prolonged time. For this experiment, we used CDC20-mAR REC8-
ha3 hrr25-as1 experimental strains and CDC20-mAR REC8-ha3 HRR25 control strains.
Both strains were induced to undergo meiosis and arrested in metaphase I, followed by a
synchronous release into anaphase I. Starting from the release, we took samples in 10 or
20 minutes intervals, respectively. 40 minutes after the release, we inhibited the activity
of the hrr25-as1 protein. Immunofluorescence analysis revealed that both cultures stably
arrested in metaphase I with the majority of cells displaying a metaphase I spindle after 8
hours (Figure 24 A). After the release, both cultures underwent the metaphase-to-
anaphase transition with comparable synchrony. 40 minutes after the release both cultures
reached the peak of anaphase I spindles. The control strain proceeded through the second
meiotic division, completed meiosis and showed four equal masses of DNA in most of
the cells at the end of the time course. The experimental strain, on the other hand, formed
meiosis II spindles but failed to undergo the second nuclear division and was unable to
disassemble meiosis II spindles during the time course, as shown previously (Arguello et
al., 2017). Analyzing those samples using calChIP-qPCR (Figure 24 B), revealed an
abrupt loss of arm cohesin in both strains, once we released the cells from the metaphase
I arrest. Also, pericentromeric cohesin was lost in both strains, starting from the release,
but at a lower rate. Whereas the arm cohesin signal collapsed with the “arm cohesin low”
signal approximately 50 minutes after the induction of Cdc20 in both strains, the
pericentromeric curve was still above the other two curves at this time point, reflecting
partial protection of the initial pericentromeric cohesin. 80 minutes after the release all
three cohesin signals collapsed to the same low level in the HRR25 strain. In the hrr25-
as1 samples, by contrast, a small pericentromeric qPCR signal was retained and
reproducibly detectable in all consecutive time points, giving the first insight into the
amount of the protected meiosis II-specific cohesin fraction. Because the cells of the
experimental strain failed to divide their nuclei a second time, but instead mostly
remained with two equal masses of DNA, one could conclude that the remaining cohesin
provides enough cohesion to resist the pulling spindle forces.
We continued by subjecting these samples to library preparation, NGS, mapping and
calibration to generate calChIP-Seq profiles for a genome-wide data analysis (Figure 25).
These profiles showed that consistent with the qPCR measurement, 30 minutes after the
release, the peaks on the chromosome arms were almost entirely reduced in both strains.
The peaks in the pericentromeric region, by contrast, became smaller after 30 minutes,

2. Results
56
again confirming previous results that pericentromeric cohesin is already cleaved in
meiosis I. In the HRR25 strain, after 80 minutes, the curves of all three qPCR loci
collapsed to the same low level, which is consistent with the calChIP-Seq profile, in
which the peaks are almost utterly absent after 80 minutes. Thus, the cohesin dynamics
we measure by using calChIP-qPCR match the calChIP-Seq results. In the hrr25-as1
Figure 25: Calibrated ChIP-Seq profiles of Rec8-ha3 on chromosome I. from samples of CDC20-mAR REC8-ha3
HRR25 and CDC20-mAR REC8-ha3 hrr25-as1 strains. The vertical axis measures the calibrated signal intensity
of Rec8-ha3. The time scale denotes minutes after the release from the metaphase I arrest. 40 minutes after the release
the hrr25-as1 inhibitor NM-PP1 was added to inactivate the enzyme.

2. Results
57
strain, on the other hand, a small pericentromeric cohesin fraction was preserved until the
end of the time course. We observed an identical pattern on other chromosomes. Hence,
these results confirm that the low amount of cohesin we observe in the vicinity of the
centromere in the wild-type after 30 minutes, indeed represents the meiosis II cohesin
pattern. Moreover, these findings are consistent with our qPCR measurements and
confirm that the amount of pericentromeric cohesin, which provides cohesion in meiosis
II is very little.
Figure 26: Differential calibrated ChIP-Seq profiles of Rec8-ha3. The profiles depict the difference between two
conventional calibrated ChIP-Seq profiles. The vertical axis measures the differential calibrated signal intensity of
Rec8-ha3. Negative values indicate a loss of Rec8-ha3 between two time points. The time scale denotes minutes after
the release from the metaphase I arrest. 40 minutes after the release the hrr25-as1 inhibitor NM-PP1 was added to
inactivate the enzymatic activity.

2. Results
58
Having available quantitative calibrated ChIP-Seq profiles with a very reduced noise
level allowed generating differential calChIP-Seq profiles (Figure 26). These differential
profiles were generated by subtraction of one profile from the profile of the previous time
point, visualizing the dynamic changes during the time course. Consequently, these
profiles did not show protein occupancy at a specific time point, but the difference in
occupancy between two time points, resulting in negative values. This approach allowed
visualizing the meiotic two-step cohesin cleavage with very high resolution in the HRR25
control strain. In this strain, most of the cohesin is cleaved from chromosomes between
20 and 30 minutes after the release. The second wave of cleavage occurs between 50 and
60 minutes and removes the protected pericentromeric cohesin in meiosis II. In the hrr25-
as1 experimental strain, by contrast, only the first wave of cleavage between 20 and 30
minutes could be detected, whereas no second wave of cleavage occurred.
Previous work estimated the size of the protected pericentromeric region indirectly by
correlating metaphase I Rec8 and Sgo1 profiles (Kiburz et al., 2005). Arresting the cells
in a meiosis II-like state using the hrr25-as1 allele, allowed us for the first time to directly
Figure 27: Calibrated ChIP-Seq profiles of Rec8-ha3 on chromosome I (upper profiles) and chromosome VII (lower
profiles). of S. cerevisiae. The vertical axis denotes the quantitative calChIP signal. The size of the protected region is
approximately 50.000 bp and this size is very similar between chromosomes, regardless of the total chromosome length.

2. Results
59
visualize the meiosis II cohesin in S. cerevisiae (Figure 27). We used this approach to
Figure 28: Profiles of the meiosis-specific cohesin subunit Rec8-ha3 in meiosis II. CDC20-mAR REC8-ha3 hrr25-
as1 strains were induced to enter meiosis and arrested in metaphase I. 40 minutes after the release from the arrest,
hrr25-as1 was inhibited, keeping the cells in a meiosis II-like state. The profiles of all chromosomes were aligned at
the position of the centromere. The size of the region with Rec8-ha3 occupancy was measured graphically.

2. Results
60
measure the size of the protected pericentromeric region by measuring the size of the
region of meiosis II cohesin occupancy individually for each chromosome (Figure 28).
On average of all 16 chromosomes, Rec8-ha3 is localized to a region of 51 kb around the
centromere in meiosis II. However, we observed differences in the size of this between
chromosomes. Interestingly, the size of this protected pericentromeric region does not
statistically correlate with the total length of the chromosome.
Quantification of calibrated ChIP-Seq data
Having established that the qualitative description of the cohesin dynamics during the two
meiotic divisions is the same using qPCR data or calibrated sequencing data, we wanted
to know whether this holds true for the quantitative analysis. For this purpose, we
composed a time course series of calibrated ChIP-Seq profiles of chromosome VI., which
harbored the binding sites of the qPCR primers (Figure 29). We now quantified the
calibrated ChIP-Seq profiles by correcting the signal for each base pair with the respective
signal from the untagged control, followed by summing-up the corrected signals for all
base pairs between the qPCR primer binding sites. To make the data comparable, we
normalized the qPCR and ChIP-Seq data to the highest signal in the respective data set,
which is the metaphase I signal of the MET10-SMC2 “arm cohesin peak” site (Figure 30).
Both quantification methods measured a residual amount of 16 % and 18 %, respectively,
for the “arm cohesin peak” region 30 minutes after the release, followed by 7 % for both
methods, 40 minutes after the release. These almost identical numbers demonstrated that
both approaches measured very similar changes in occupancy for the chromosome arm
site. The initial amount at the RPN11-SAD1 “pericentromeric cohesin” site was at 44 %,
when measured with calChIP-qPCR, compared to 38 %, when measured with calChIP-
Seq. 40 minutes after the release the pericentromeric signal was at 18 % and 16 %,
respectively. These percentages again demonstrated that both methods lead to very
similar results, with slightly lower values for the calChIP-Seq quantification.
Collectively, this shows that it is possible to quantify dynamics of protein occupancy over
time, using calibrated ChIP-Seq data, yielding results which are comparable to
quantification by qPCR. The advantage of quantification by calibrated ChIP-Seq data is
that it is possible now to quantify chromosomal regions of any size, up to the whole
chromosome. This quantification of any chromosomal locus, regardless of its length,

2. Results
61
would not be possible using qPCR because here the length of the loci is limited by the
distance of the two qPCR primer binding sites, which are typically around 200 bp apart.
Concerning meiosis, the protected pericentromeric region is of particular interest. This
region is approximately 51 kb large (Figure 28). Hence, for the first time, it is now
possible to accurately quantify the cohesin amount in this protected region during the two
Figure 29: Calibrated ChIP-Seq profiles of Rec8-ha3 on chromosome VI. from samples of CDC20-mAR REC8-ha3
HRR25 and CDC20-mAR REC8-ha3 hrr25-as1 strains. The vertical axis measures the calibrated signal intensity of
Rec8-ha3. The time scale denotes minutes after the release from the metaphase I arrest. 40 minutes after the release
the hrr25-as1 inhibitor NM-PP1 was added to inactivate the enzyme. The light blue arrow indicates the binding site of
the “pericentromeric” RPN11-SAD1 qPCR primers. The green arrows indicate the binding site of the “arm cohesin
peak” MET10-SMC2 qPCR primers. The white arrows indicate the binding site of the “arm cohesin low” HXT10
qPCR primers.

2. Results
62
meiotic divisions. Therefore, we quantified the amount of cohesin in the protected region
in metaphase I and meiosis II, individually for each chromosome (Table 4). We found
that on average of all chromosomes 41 % of the metaphase I cohesin in the
pericentromeric region was protected from cleavage in meiosis I and preserved until
meiosis II. This number implied that on average 59 % of the metaphase I cohesin in the
pericentromeric region was cleaved already in meiosis I. Interestingly, we found
substantial differences between chromosomes. Some chromosomes protected a higher
percentage of their metaphase I cohesin, some a lower percentage. Strikingly, we found
that this fraction of protected cohesin correlated very well with the length of the
chromosome (Figure 31 B). This correlation with the chromosome length suggests that
Figure 30: Quantification of Rec8 cohesin at three different loci on chromosome VI., using either calChIP-qPCR
or calibrated ChIP-Seq data. Quantification is relative to the initial Rec8 level at the “arm cohesin peak” site, to make
both methods comparable. The time scale denotes minutes after the release from the metaphase I arrest. Both
quantification methods yield comparable results.
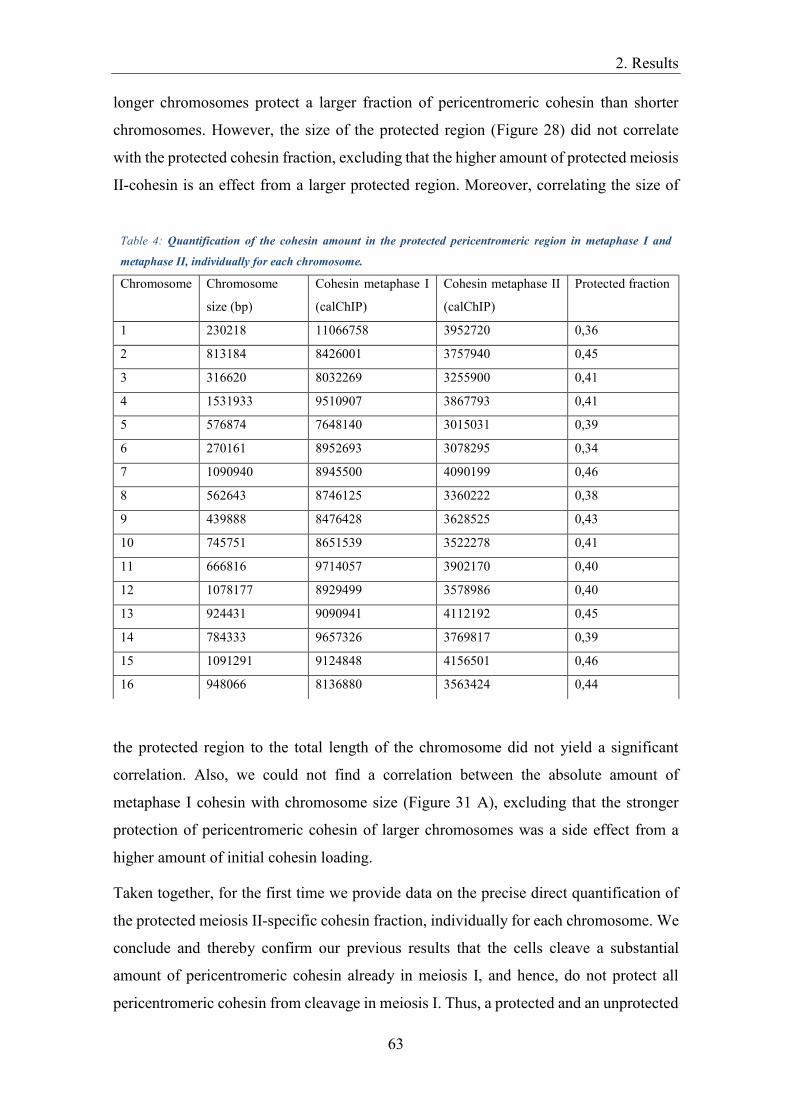
2. Results
63
longer chromosomes protect a larger fraction of pericentromeric cohesin than shorter
chromosomes. However, the size of the protected region (Figure 28) did not correlate
with the protected cohesin fraction, excluding that the higher amount of protected meiosis
II-cohesin is an effect from a larger protected region. Moreover, correlating the size of
the protected region to the total length of the chromosome did not yield a significant
correlation. Also, we could not find a correlation between the absolute amount of
metaphase I cohesin with chromosome size (Figure 31 A), excluding that the stronger
protection of pericentromeric cohesin of larger chromosomes was a side effect from a
higher amount of initial cohesin loading.
Taken together, for the first time we provide data on the precise direct quantification of
the protected meiosis II-specific cohesin fraction, individually for each chromosome. We
conclude and thereby confirm our previous results that the cells cleave a substantial
amount of pericentromeric cohesin already in meiosis I, and hence, do not protect all
pericentromeric cohesin from cleavage in meiosis I. Thus, a protected and an unprotected
Table 4: Quantification of the cohesin amount in the protected pericentromeric region in metaphase I and
metaphase II, individually for each chromosome.
Chromosome Chromosome
size (bp)
Cohesin metaphase I
(calChIP)
Cohesin metaphase II
(calChIP)
Protected fraction
1 230218 11066758 3952720 0,36
2 813184 8426001 3757940 0,45
3 316620 8032269 3255900 0,41
4 1531933 9510907 3867793 0,41
5 576874 7648140 3015031 0,39
6 270161 8952693 3078295 0,34
7 1090940 8945500 4090199 0,46
8 562643 8746125 3360222 0,38
9 439888 8476428 3628525 0,43
10 745751 8651539 3522278 0,41
11 666816 9714057 3902170 0,40
12 1078177 8929499 3578986 0,40
13 924431 9090941 4112192 0,45
14 784333 9657326 3769817 0,39
15 1091291 9124848 4156501 0,46
16 948066 8136880 3563424 0,44

2. Results
64
cohesin fraction is present in the region around the centromere, indicating that the
distinction between arm cohesin and pericentromeric cohesin is not identical to the
classification into unprotected cohesin and protected cohesin. This suggests that the
mechanism of protection not be only determined by localization of the cohesin protein
complex. Consequently, the amount of cohesin that is left in meiosis II and that is
sufficient to link sister chromatids in meiosis II, is very small, compared to initial cohesin
levels. Strikingly, we found that the fraction of protected cohesin correlates with
chromosome size, suggesting that a stronger protection mechanism is working for larger
chromosomes.
Figure 31: Statistical analysis. (A) Relationship between the amount of metaphase I cohesin in the protected region
and the chromosome size. The vertical axis denotes the amount of metaphase I cohesin in the protected region,
quantified using calibrated ChIP-Seq data. Each data point represents one chromosome. No statistically significant
relationship can be established between the chromosome size and the amount of metaphase I cohesin.(B) Relationship
between the fraction of protected pericentromeric cohesin and the chromosome size. The Spearman's rank correlation
coefficient is 0.66, with a p value of 0.005, indicating a statistically highly significant relationship (α = 0.05).

2. Results
65
Quantification of samples from a prolonged metaphase I arrest
In previous experiments, we found that the ChIP-qPCR signal of Rec8 was continuously
dropping at all loci, if we did not release the cells from the metaphase I arrest but kept the
cells in a prolonged arrest (Figure 13 B). Quantification of the calChIP-Seq data in the
binding regions of the qPCR primers of the experiment presented in Figure 21 to Figure
23, confirmed that the signals continuously dropped over the duration of the time course
in a prolonged metaphase I arrest. The “arm cohesin peak” signal, for example, fell to a
level of less than 50 % after two hours (Figure 32).
The corresponding calChIP-Seq profiles of the metaphase I arrested culture, by contrast,
did not display substantial changes in protein occupancy (Figure 23 A). Quantifying the
total amount of cohesin over the full length of chromosome VI. in those samples
confirmed that the amount of total cohesin was almost constant and no loss of signal could
be detected (Figure 32). The same was valid for the average of all 16 chromosomes. Total
cohesin only started to decrease at the last time point of a prolonged metaphase I arrest.
These two, at first glance contradictory results, could be reconciled by a close inspection
Figure 32: Quantification of Rec8 cohesin at the three qPCR loci on chromosome VI., and along the total length of
chromosome VI., using calChIP-Seq data of CDC20-arrest REC8-ha3 strains, which were kept in a prolonged
metaphase I arrest. Quantification is relative to the Rec8 level at the MET10-SMC2 locus. The signal at all three loci
steadily declines over time, whereas the total cohesin amount stays almost constant, indicating distal spreading of
cohesin.

2. Results
66
of the ChIP-Seq profiles (Figure 23 A). In the first samples, cohesin formed sharp and
high peaks at distinct chromosomal loci. Over time, the cohesin peaks became broader,
while their height was reduced, indicating spreading of cohesin into the formerly distal
regions of the peaks. Analyzing only a small region, like it is done using qPCR, lead to
the notion that the cohesin signal was decreasing, suggesting a loss of cohesin. However,
evaluating the ChIP-Seq profiles and quantifying the cohesin occupancy along the full
length of the chromosomes, revealed that cohesin was not lost from chromosomes, but
moved out of the analyzed region, thereby reducing the measured qPCR signal. Taken
together, this example clearly demonstrates the advantage of the quantification using
calibrated ChIP-Seq data, compared to the conventional method of using qPCR data for
quantification. In this particular case, the quantification by qPCR data generates
misleading results, resulting in an incorrect biological interpretation of the experimental
data.
Centromeric protection
Next, we used our calibrated ChIP-Seq workflow to analyze the cohesin protector
Shugoshin in meiotic samples of S. cerevisiae. For this purpose, we used the same
experimental setup we used for the analysis of Rec8, with the only difference that the
strains harbored an Ha3-tagged version of Sgo1, instead of Rec8.
Establishment of centromeric protection
We started by analyzing the metaphase I occupancy of Sgo1-ha3 and compared the
obtained profile (Figure 33 A) to the previously generated Rec8-ha3 profiles (Figure 33
B). Strikingly, we found a precise co-localization in metaphase I between Sgo1 and Rec8
in the protected, pericentromeric region. On arm sites, by contrast, no Sgo1 peaks were
detected, even though Rec8 peaks were present there. Comparing the metaphase II profile
of Rec8 with the Sgo1 profile revealed that in metaphase II, Rec8 could only be found at
loci, at which Sgo1 was already bound in metaphase I, consistent with Sgo1’s function as
protector of meiosis I cohesin.
As we were struck by the precise colocalization of Rec8 and Sgo1, we inspected the
binding profiles of both proteins in more detail. Therefore, we zoomed-in to the protected
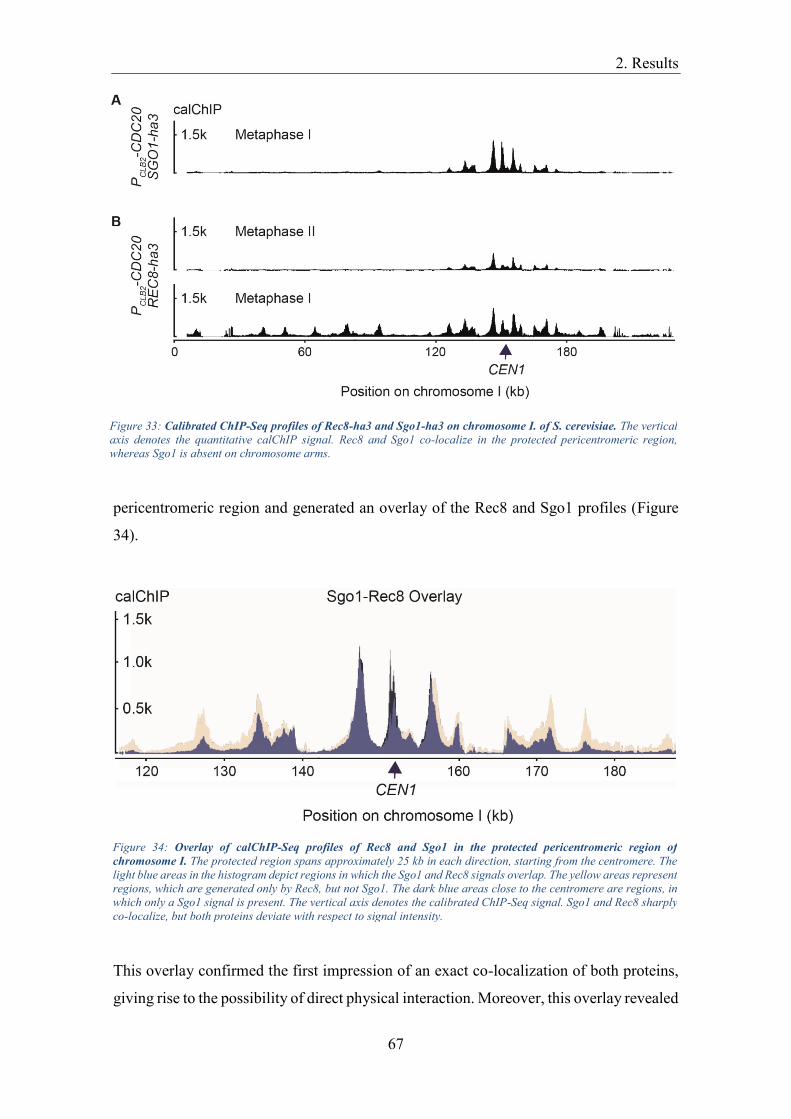
2. Results
67
pericentromeric region and generated an overlay of the Rec8 and Sgo1 profiles (Figure
34).
This overlay confirmed the first impression of an exact co-localization of both proteins,
giving rise to the possibility of direct physical interaction. Moreover, this overlay revealed
Figure 33: Calibrated ChIP-Seq profiles of Rec8-ha3 and Sgo1-ha3 on chromosome I. of S. cerevisiae. The vertical
axis denotes the quantitative calChIP signal. Rec8 and Sgo1 co-localize in the protected pericentromeric region,
whereas Sgo1 is absent on chromosome arms.
Figure 34: Overlay of calChIP-Seq profiles of Rec8 and Sgo1 in the protected pericentromeric region of
chromosome I. The protected region spans approximately 25 kb in each direction, starting from the centromere. The
light blue areas in the histogram depict regions in which the Sgo1 and Rec8 signals overlap. The yellow areas represent
regions, which are generated only by Rec8, but not Sgo1. The dark blue areas close to the centromere are regions, in
which only a Sgo1 signal is present. The vertical axis denotes the calibrated ChIP-Seq signal. Sgo1 and Rec8 sharply
co-localize, but both proteins deviate with respect to signal intensity.

2. Results
68
that even though we detected both proteins at the same chromosomal positions, the two
proteins deviated concerning their signal intensities. At the centromere, the Sgo1 signal
was higher than the Rec8 signal, indicating an excess of Sgo1. At positions approximately
10 kb left and right of the centromere, where the next peaks were located, both proteins
displayed the same signal height. Distal to those two peaks, the Sgo1 signal became lower
than the Rec8 signal. At the outer end of the protected pericentromeric region, we found
only Rec8 peaks, whereas the Sgo1 signal was reduced to a basal level. Thus, Sgo1
seemed to follow a gradient, with its highest point directly at the centromere. To assess
the possibility of a direct physical interaction between Rec8 and Sgo1, we aimed to
immunoprecipitated (IP) Rec8 from a native cell extract and checked whether Sgo1 co-
precipitated with it. In the IP fraction, we observed strong bands for Rec8-ha3 and Sgo1-
myc9, demonstrating that Sgo1-myc9 coprecipitated with Rec8-ha3 (Dr. Wei Ma,
Zachariae Lab, unpublished).
Collectively, these results demonstrate that Sgo1 and Rec8 bind to the same chromosomal
loci and both proteins directly physically interact with each other.
Next, we wanted to know if the localization of Rec8 in meiosis depends on Sgo1.
Therefore, we aimed to generate calibrated ChIP-Seq profiles of Rec8-ha3 in the absence
of Sgo1. Thus, we constructed CDC20-mAR REC8-ha3 sgo1-depletion experimental
strains and CDC20-mAR REC8-ha3 SGO1 control strains. Both strains were induced to
enter meiosis and arrested in metaphase I, as was assessed by immunofluorescence
counting (Figure 35 A). Eight hours after transfer into SPO medium, in the control and
the experimental strain, more than 60 % of all cells displayed metaphase I spindles,
indicating an entry into metaphase I. Subsequently, both strains were synchronously
released into anaphase I. Thereupon, the SGO1 strain progressed normally through both
meiotic divisions and accumulated anaphase I spindles, followed by metaphase II spindles
and finally, anaphase II spindles. The sgo1-depletion strain, by contrast, accumulated
anaphase I spindles, followed by anaphase II spindles, whereas hardly any metaphase II
spindles could be observed. This phenotype is consistent with a failure in the protection
of centromeric cohesin. Without the protection machinery, which is recruited to
chromosomes via Sgo1, all cohesin is cleaved in anaphase I and the spindles are not able
to generate stable attachments to kinetochores in meiosis II, immediately resulting in
elongated anaphase II-like spindles. Thus, the immunofluorescence analysis confirms the
successful depletion of SGO1 in the experimental strain. Next, we subjected the samples

2. Results
69
to our calibrated ChIP-Seq protocol. The calChIP-qPCR profile revealed that the SGO1
strained displayed cohesin dynamics, comparable to previous experiments. In the sgo1-
depletion strain, by contrast, the pericentromeric signal was lost prematurely, again
indicating impaired centromeric protection (Figure 35 B). Analyzing the Rec8-ha3
calChIP-Seq metaphase I profiles (Figure 36) revealed that Rec8-ha3 recruited normally
to chromosomes in both strains, excluding the possibility that Sgo1 is required for
recruitment of Rec8.
Figure 35: Meiotic time course samples of CDC20-mAR REC8-ha3 SGO1 (control) and CDC20-mAR REC8-
ha3 sgo1-depletion strains. (A) Immunofluorescence counting of meiotic spindles and nuclear division to assess
the meiotic stage of individual time point samples. Spindles were visualized by staining of tubulin with a specific
antibody. Nuclei were visualized by DAPI staining of DNA. (B) calChIP-qPCR of the same meiotic samples.
Three different loci on chromosome VI. were analyzed.

2. Results
70
Next, we wanted to know if the localization of Sgo1 in meiosis depends on Rec8.
Therefore, we aimed to generate calibrated ChIP-Seq profiles of Sgo1-ha3 in the absence
of Rec8. Strains in which REC8 was deleted are fully viable, as the cells express REC8
only in meiosis and the mitotic proliferation is not affected. However, for meiosis,
deletion of REC8 has severe consequences, as the cells arrest in prophase due to the
recombination checkpoint, because Rec8 is required for completion of meiotic
recombination (Klein et al., 1999). This problem can be circumvented, by the additional
deletion of the SPO11 gene. Spo11 is a topoisomerase-like enyzme, which initiates
meiotic recombination by the formation of double-strand breaks in DNA (Bergerat et al.,
1997; Keeney et al., 1997). Thus, we constructed CDC20-arrest SGO1-ha3 spo11Δ rec8Δ
experimental strains and CDC20-arrest SGO1-ha3 spo11Δ REC8 control strains. A
CDC20-arrest SGO1 spo11Δ REC8 strain served as untagged control. The CDC20-arrest
spo11Δ rec8Δ double mutant enters meiosis, skips meiotic recombination and arrests in
metaphase I, as was assessed by immunofluorescence counting (Figure 37 A). Eight hours
after transfer into SPO medium, in the control and the experimental strain, nearly 80 %
of all cells display two spindle pole bodies, indicating an entry into metaphase I and in
both strains the cells accumulated Sgo1-ha3 in the nucleus. After four and eight hours,
samples from all strains were taken and subjected to our calibrated ChIP protocol (Figure
37 B). Analyzing the obtained calChIP-Seq profiles, we found that four hours after
transfer to SPO medium, when the general Sgo1 protein levels are still low in the cells
(Figure 42 A), only very little Sgo1 was recruited to chromosomes (Figure 38, lower two
profiles). After eight hours, by contrast, a high occupancy of Sgo1-ha3 was measured in
the metaphase control sample (Figure 38, second profile from the top). Strikingly, in the
Figure 36: Calibrated ChIP-Seq profiles of Rec8-ha3 on chromosome I of samples from CDC20-mAR REC8-ha3
SGO1 (control) and CDC20-mAR REC8-ha3 sgo1-depletion strains. Samples were taken 8 hours after inoculation in
SPO, before the cells were released from the metaphase I arrest. The vertical axis measures the calibrated signal
intensity of Rec8. The localization of Rec8 does not depend on Sgo1.

2. Results
71
metaphase sample of the rec8Δ strain, the Sgo1-ha3 pattern was drastically altered. We
observed a sharp peak at the centromere, but it lacked all pericentromeric Sgo1 peaks.
This result shows that Rec8 is required for the pericentromeric localization of Sgo1, but
not for its centromeric recruitment.
Figure 37: Meiotic time course samples of CDC20-arrest spo11Δ SGO1-ha3 strains containing REC8 or rec8Δ. (A)
Immunofluorescence counting of spindle pole bodies, nuclear accumulation of Sgo1-ha3 and nuclear division to assess
the meiotic stage of individual samples. Spindle pole bodies were visualized by staining of Tub4 with a specific
antibody. Nuclei were visualized by DAPI staining of DNA. The black arrows indicate the time of sampling. (B)
Calibrated ChIP-qPCR of the samples taken at 4 hours (prophase) or 8 hours (metaphase I). The bar graphs show
Sgo1-ha3 enrichment. Three different loci on chromosome VI. were analyzed. The vertical axis displays the calibrated
ChIP signal. The localization of Sgo1 does depend on Rec8.

2. Results
72
Having demonstrated that Rec8 is required for the recruitment of Sgo1 to chromosomes,
we wanted to know if the amount of chromosome-bound Rec8 is correlated with the
amount of chromosome-bound Sgo1. To address this question, we quantified the amount
of Rec8 and Sgo1 in the protected region, individually for each chromosome, as described
Figure 38: Calibrated ChIP-Seq profiles of Sgo1-ha3 on chromosome I in samples from a meiotic time course of
CDC20-arrest spo11Δ SGO1-ha3 strains containing REC8 or rec8Δ. The vertical axis measures the calibrated signal
intensity of Sgo1-ha3. Prophase samples were taken 4 hours after inoculation in SPO medium, metaphase I samples
were taken 8 hours after inoculation in SPO medium. Rec8 is required for pericentromeric localization of Sgo1, but
not for centromeric localization.
Figure 39: Relationship between the amount of metaphase I cohesin in the protected region and metaphase I Sgo1
in the protected region. The amount of both proteins was measured by quantification of the respective calibrated ChIP-
Seq data. Each data point represents one chromosome. The Spearman's rank correlation coefficient is 0.56, with a p
value of 0.02, indicating a statistically significant relationship (α = 0.05).

2. Results
73
in previous chapters (Table 4). Subsequently, we tested if those two variables are
correlated and found a statistically significant relationship (Figure 39). This result further
strengthens the notion of a function of Rec8 in the recruitment of Sgo1.
During meiosis, only Rec8-containing cohesin complexes provide cohesion (Rankin,
2015). Thus, by deleting the cohesin subunit Rec8, the chromatin structure is severely
Figure 40: Meiotic time course samples from CDC20-arrest spo11Δ SGO1-ha3 strains containing SCC4 or scc4-
m35. (A) Immunofluorescence counting of spindle pole bodies, nuclear accumulation of Sgo1-ha3 and nuclear division
to assess the meiotic stage of individual samples. Spindle pole bodies were visualized by staining of Tub4 with a specific
antibody. Nuclei were visualized by DAPI staining of DNA. The horizontal axis shows hours after transfer into SPO
medium. (B) Calibrated ChIP-qPCR of the samples taken at 8 hours (metaphase I). The bar graphs show Sgo1-ha3
enrichment. Three different loci on chromosome VI. were analyzed. The vertical axis displays the calibrated ChIP
signal. (C) Western-blot of the corresponding samples to demonstrate depletion of Cdc5.

2. Results
74
altered. Therefore, it is conceivable that the partial loss of Sgo1 signal in a rec8Δ strain is
an unspecific effect of a perturbed chromatin structure. To address this issue, we went on
to analyze the Sgo1 binding to chromatin in a strain harboring a mutant allele of the
cohesin loader subunit SCC4, while expressing wildtype levels of REC8. It was shown
that by inserting mutations into a conserved patch of Scc4 (scc4-m35), the cohesin loader
is not recruited anymore to chromatin, thus, drastically reducing the levels of
topologically loaded cohesin (Hinshaw et al., 2015). However, cohesin is not entirely
absent from chromosomes in these strains, thus, preserving a basic level of cohesion. To
this end, we constructed CDC20-arrest spo11Δ SGO1-ha3 strains containing either SCC4
or scc4-m35. These strains, together with an untagged control, were induced to enter
meiosis. Eight hours after transfer to SPO medium, approximately 60 % of the cells in
each strain displayed two spindle pole bodies, indicating an arrest in metaphase I (Figure
40 A). At this time, we took samples, which were fixed in formaldehyde and subjected to
our ChIP protocol (Figure 40 B). The calibrated ChIP-Seq profile of the SCC4 control
strain exhibited an accumulation of Sgo1 in the pericentromeric region, consistently with
the previous experiments. The scc4-m35 experimental strain, on the other hand, displayed
one single Sgo1 peak right at the centromere proper, whereas no pericentromeric
accumulation of Sgo1 could be detected (Figure 41).
Figure 41: Calibrated ChIP-Seq profiles of Sgo1-ha3 on chromosome I in samples from a meiotic time course of
CDC20-arrest spo11Δ SGO1-ha3 strains containing SCC4 or scc4-m35. The vertical axis measures the calibrated
signal intensity of Sgo1. Samples were taken 8 hours after inoculation in SPO medium. A functional Scc2/Scc4 cohesin
loader complex is required for pericentromeric localization of Sgo1.

2. Results
75
These profiles demonstrate that Rec8-containing cohesin, which is topologically loaded
Figure 42: Auxin-induced degradation of Rec8 in meiosis. Meiotic time course samples of CDC20-arrest spo11Δ
REC8-AID-myc9 SGO1-ha3 strains. The experimental strain, additionally harbors a copper-inducible OsTIR1 allele
for induction of the AID-mediated Rec8 degradation. All cultures entered meiosis and arrested at metaphase I after
480 min (8 hours). Subsequently, copper and auxin were added to induce degradation of Rec8. Left side:
Immunofluorescence counting of spindle pole bodies, nuclear accumulation of Sgo1-ha3 and nuclear division to assess
the meiotic stage of individual samples. Spindle pole bodies were visualized by staining of Tub4 with a specific
antibody. Nuclei were visualized by DAPI staining of DNA. The horizontal axis shows minutes after transfer into SPO
medium. Right side: Immunoblot analysis of the same samples. Dbf4 is a meiosis I marker. Pgk1 serves as loading
control. (A) Control strain. (B) Experimental strain. (C) Untagged control strain.

2. Results
76
onto chromosomes by the cohesin loader complex, is required for the pericentromeric
localization of Sgo1. Without topologically loaded cohesin, Sgo1 is recruited only at the
centromere.
By using a rec8Δ mutant and a scc4-m35 cohesin loader mutant, we have demonstrated
that cohesin is required for recruiting Sgo1 to chromatin. However, we do not know if
cohesin is only required for the loading of Sgo1 onto chromatin or if it is permanently
anchoring it at chromosomes.
We, therefore, asked what happens to Sgo1, if we allow the cells to establish Sgo1 on
chromosomes, and only subsequently, after Sgo1 is loaded onto chromosomes, artificially
remove cohesin. To this end, we used the auxin-inducible degron (AID) system. This
system was initially described by Nishimura et al. (2009) and has been used successfully
in various organisms since then (Holland et al., 2012; Kanke et al., 2011; Zhang et al.,
2015). It uses genes of the auxin response pathway of plants to conditionally inactivate
proteins. To use this system in yeast, the target protein has to be tagged with an AID
recognition sequence, and the strain needs to express the plant ubiquitin-ligase subunit
TIR1, which mediates the response to auxin. The so transformed yeast strain can then be
grown under standard conditions, but once auxin is added to the culture medium, the
target protein is degraded within 30 minutes. We constructed strains harboring a REC8-
AID-myc9 allele in the previously used CDC20-arrest spo11Δ SGO1-ha3 background.
The experimental strain, additionally, harbored the Myc-tagged TIR1 allele from rice (O.
sativa), named OsTIR1, under a copper-inducible promoter.
Like in previous experiments, we induced meiosis in the control, experimental and
untagged strains. All strains successfully entered meiosis and arrested in meiosis I, as can
be judged by expression of the meiosis I marker gene DBF4 on a western-blot (Figure
42). Moreover, the AID-myc9-tagged version of REC8 was successfully expressed in all
strains. Eight hours (480 minutes) after transfer to SPO medium, in the control and
experimental culture, more than 60 % of all cells displayed two spindle pole bodies,
indicating an arrest in metaphase I (Figure 42). At this time, we added copper sulfate to
induce the OsTIR1 allele, followed by addition of auxin to trigger degradation of the
Rec8-AID-myc9 protein. 20 minutes later, at time point 500 minutes, a distinct band
could be observed for the OsTir1-myc9 protein in the experimental strain. Concomitant,
the western-blot signal for the Rec8-AID-myc9 protein was drastically reduced,
indicating successful degradation. Additionally, we took samples for ChIP in 60 minutes

2. Results
77
intervals, starting at the time of induction of the AID system at eight hours (480 minutes).
We subjected these samples to our calibrated ChIP-Seq protocol, but this time we split
the samples and enriched for Rec8-AID-myc in one batch and Sgo1-ha3 in the other.
Thus, we could compare the ChIP signal of both proteins in the same samples.
The calChIP-Seq profiles for Rec8-AID-myc9 revealed that the control and experimental
strains successfully loaded cohesin to comparable levels at 480 minutes (Figure 43). At
540 minutes, the control strain still displayed an identical profile for Rec8, whereas in the
experimental strain, the ChIP signals were almost absent. Thus, the calChIP-Seq profiles
confirmed the western-blot results and demonstrated successful degradation of Rec8. The
Figure 43: Auxin-induced degradation of Rec8 in meiosis. Calibrated ChIP-Seq profiles of Rec8 and Sgo1 on
chromosome I from CDC20-arrest spo11Δ REC8-AID-myc9 SGO1-ha3 strains. The experimental strain, additionally
harbors an copper-inducible OsTIR1 allele for induction of the AID-mediated Rec8 degradation. All cultures entered
meiosis and arrested at metaphase I after 480 min (8 hours). Subsequently, copper and auxin were added to induce
degradation of Rec8. At this time the first ChIP samples were taken. The upper profiles show the occupancy of Rec8.
The lower profiles show the occupancy of Sgo1 in the same samples. The vertical axis in all profiles denotes the
quantitative calibrated ChIP signal. The pericentromeric localization of Sgo1 is lost upon degradation of Rec8.

2. Results
78
Figure 44: Meiotic time course samples from CDC20-arrest spo11Δ SGO1-ha3 strains containing either REC8
BUB1 (control), REC8 bub1Δ, rec8Δ BUB1 or rec8Δ bub1Δ. (A) Immunofluorescence counting of spindle pole bodies,
nuclear accumulation of Sgo1-ha3 and nuclear division to assess the meiotic stage of individual samples. Spindle pole
bodies were visualized by staining of Tub4 with a specific antibody. Nuclei were visualized by DAPI staining of DNA.
(B) Calibrated ChIP-qPCR of the samples taken at 10 hours (metaphase I arrest). The bar graphs show Sgo1-ha3
enrichment. Three different loci on chromosome VI. were analyzed. The vertical axis displays the calibrated ChIP
signal.

2. Results
79
calChIP-Seq profile for Sgo1-ha3 revealed that both strains also loaded Sgo1-ha3 to
comparable levels at 480 minutes. The control strain kept a similar profile for Sgo1-ha3
in the consecutive time points, indicating stable recruitment of Sgo1. The experimental
strain, by contrast, lost the pericentromeric signal of Sgo1-ha3 in the consecutive time
points and only retained a sharp peak at the centromere.
This pattern confirms our previous results that cohesin is required for pericentromeric
localization of Sgo1, but not its centromeric binding. Moreover, this result demonstrates
that cohesin is not only required for the pericentromeric loading of Sgo1, but also for its
persistence in the pericentromeric region.
Having established that the cells require cohesin for loading and permanent localization
of Sgo1 in the pericentromeric region, we next asked how cohesin relates to the Bub1-
dependent loading mechanism of Sgo1 that has been extensively described in the
literature. Therefore, we aimed to analyze the binding of Sgo1 in strains, which do not
express BUB1 or do not express BUB1 and the cohesin subunit REC8. Like in all previous
experiments, we induced the strains to undergo meiosis and assessed the meiotic
progression, using immunofluorescence counting (Figure 44 A). All strains entered
Figure 45: Calibrated ChIP-Seq profiles of Sgo1-ha3 on chromosome I in samples from a meiotic time course of
CDC20-arrest spo11Δ SGO1-ha3 strains containing either REC8 BUB1 (control), REC8 bub1Δ, rec8Δ BUB1 or
rec8Δ bub1Δ. The vertical axis measures the calibrated signal intensity of Sgo1. Samples were taken 10 hours after
inoculation in SPO medium. Bub1 is required for the chromosomal localization of Sgo1. Rec8 is required for the
pericentromeric localization of Sgo1.

2. Results
80
meiosis and separated their spindle pole bodies, indicating entry into metaphase I.
Consistent with previous experiments, in the control and rec8Δ strain, more than 60 % of
all cells displayed two spindle pole bodies after eight hours in SPO medium. Due to a
reduced vitality of bub1Δ cells, the bub1Δ-containing strains progressed more slowly.
However, after ten hours in SPO medium, also in these strains, approximately 40 % of all
cells displayed two spindle pole bodies, making it possible to harvest enough material for
ChIP analysis. Ten hours after transfer to SPO medium, we took samples from all strains
and subjected them to our calibrated ChIP protocol (Figure 44 B).
The obtained profiles confirmed our previous results that in rec8Δ strains, Sgo1 cannot
recruit to the pericentromeric region, but binds to a small region right at the centromere
proper, giving rise to profiles with one single large peak (Figure 45). Interestingly, neither
for the bub1Δ single mutant nor the bub1Δ rec8Δ double-mutant, any Sgo1-ha3 signal
could be detected at all.
Taken together, these findings confirm previous reports about the requirement of Bub1
for the recruitment of Sgo1 to chromosomes. Without Bub1, Sgo1 does not recruit to
chromosomes at all. Moreover, these findings demonstrate that the single large peak, we
observe in profiles of cohesin mutants is Bub1-dependent.
Regulation of centromeric protection
For mice, it was reported that deprotection of centromeric cohesin in meiosis II occurs
via the conserved histone chaperone SET/TAF-1b, which acts as an inhibitor of PP2A’s
enzymatic function (Chambon et al., 2013). To test whether the same mechanism is
working in S. cerevisiae, we deleted both yeast homologs of SET, called NAP1 and
VPS75, and thus, generate a nap1Δ vps75Δ double deletion mutant. If any of the two SET
homologs acts as an inhibitor of centromeric deprotection in budding yeast, the double
deletion strain should not be able to deprotect pericentromeric cohesin in meiosis II.
Without deprotection in meiosis II, the cells would not be able to segregate sister
chromatids in meiosis II. We decided to use live-cell imaging to analyze the behavior of
sister chromatids in the course of the two meiotic divisions. To this end, we generated
strains harboring a GFP-tagged version of tubulin to visualize the spindles, which allows
the staging of individual cells. The sister chromatids of chromosome V were labelled by
a system comprising the tet repressor (TetR) protein, labeled with a red fluorescent
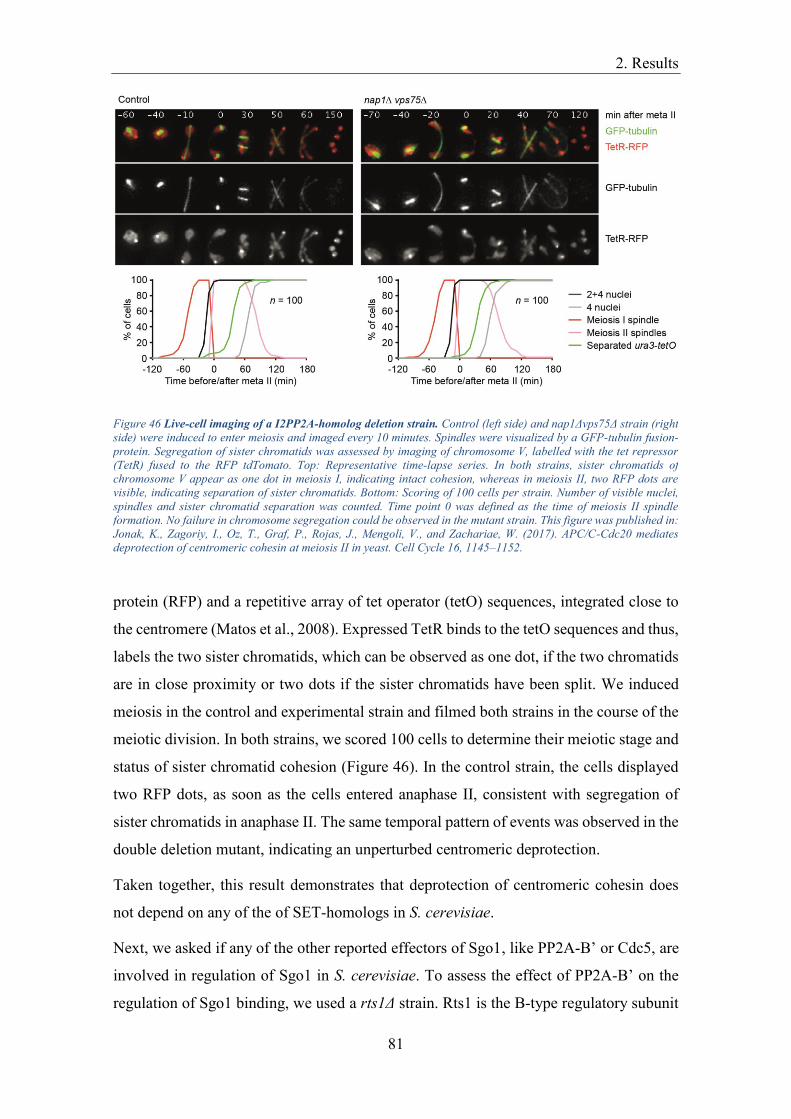
2. Results
81
protein (RFP) and a repetitive array of tet operator (tetO) sequences, integrated close to
the centromere (Matos et al., 2008). Expressed TetR binds to the tetO sequences and thus,
labels the two sister chromatids, which can be observed as one dot, if the two chromatids
are in close proximity or two dots if the sister chromatids have been split. We induced
meiosis in the control and experimental strain and filmed both strains in the course of the
meiotic division. In both strains, we scored 100 cells to determine their meiotic stage and
status of sister chromatid cohesion (Figure 46). In the control strain, the cells displayed
two RFP dots, as soon as the cells entered anaphase II, consistent with segregation of
sister chromatids in anaphase II. The same temporal pattern of events was observed in the
double deletion mutant, indicating an unperturbed centromeric deprotection.
Taken together, this result demonstrates that deprotection of centromeric cohesin does
not depend on any of the of SET-homologs in S. cerevisiae.
Next, we asked if any of the other reported effectors of Sgo1, like PP2A-B’ or Cdc5, are
involved in regulation of Sgo1 in S. cerevisiae. To assess the effect of PP2A-B’ on the
regulation of Sgo1 binding, we used a rts1Δ strain. Rts1 is the B-type regulatory subunit
Figure 46 Live-cell imaging of a I2PP2A-homolog deletion strain. Control (left side) and nap1Δvps75Δ strain (right
side) were induced to enter meiosis and imaged every 10 minutes. Spindles were visualized by a GFP-tubulin fusion-
protein. Segregation of sister chromatids was assessed by imaging of chromosome V, labelled with the tet repressor
(TetR) fused to the RFP tdTomato. Top: Representative time-lapse series. In both strains, sister chromatids of
chromosome V appear as one dot in meiosis I, indicating intact cohesion, whereas in meiosis II, two RFP dots are
visible, indicating separation of sister chromatids. Bottom: Scoring of 100 cells per strain. Number of visible nuclei,
spindles and sister chromatid separation was counted. Time point 0 was defined as the time of meiosis II spindle
formation. No failure in chromosome segregation could be observed in the mutant strain. This figure was published in:
Jonak, K., Zagoriy, I., Oz, T., Graf, P., Rojas, J., Mengoli, V., and Zachariae, W. (2017). APC/C-Cdc20 mediates
deprotection of centromeric cohesin at meiosis II in yeast. Cell Cycle 16, 1145–1152.

2. Results
82
of PP2A in S. cerevisiae. To analyze the effect of Cdc5, we used a previously described
cdc5-depletion allele (Matos et al., 2008). Both alleles were crossed into the previously
Figure 47: Meiotic time course samples from CDC20-arrest SGO1-ha3 strains containing either CDC5 RTS1
(control), cdc5-depletion RTS1, CDC5 rts1Δ or cdc5-depletion rts1Δ. (A) Immunofluorescence counting of spindles,
nuclear accumulation of Sgo1-ha3 and nuclear division to assess the meiotic stage of individual samples. Spindles were
visualized by staining of Tub1 with a specific antibody. Nuclei were visualized by DAPI staining of DNA. (B) Calibrated
ChIP-qPCR of the samples taken at 7 hours. The bar graphs show Sgo1-ha3 enrichment. Three different loci on
chromosome VI. were analyzed. The vertical axis displays the calibrated ChIP signal. The amount of chromosome-
bound Sgo1 increases upon depletion of Cdc5.

2. Results
83
used CDC20-arrest SGO1-ha3 background. The control strain was wildtype for RTS1
and CDC5. We induced all strains to undergo meiosis and assessed their meiotic
progression by immunofluorescence counting. All strains entered meiosis and
accumulated meiosis I spindles and Sgo1-ha3 to sufficiently high levels for a ChIP
Figure 49: Calibrated ChIP-Seq profiles of Sgo1-ha3 on chromosome I in samples from a meiotic time course of
CDC20-arrest SGO1-ha3 strains, containing either RTS1 or rts1Δ. The vertical axis measures the calibrated signal
intensity of Sgo1. Samples were taken 7 hours after inoculation in SPO medium. Deletion of RTS1 has no effect on the
Sgo1 levels on chromatin.
Figure 48: Immunoblot analysis of cell extracts from meiotic cells, used for ChIP analysis. Cdc5 and Tub2 were
stained, using specific antibodies. Cdc5 was efficiently depleted in RTS1 and rts1Δ strains.
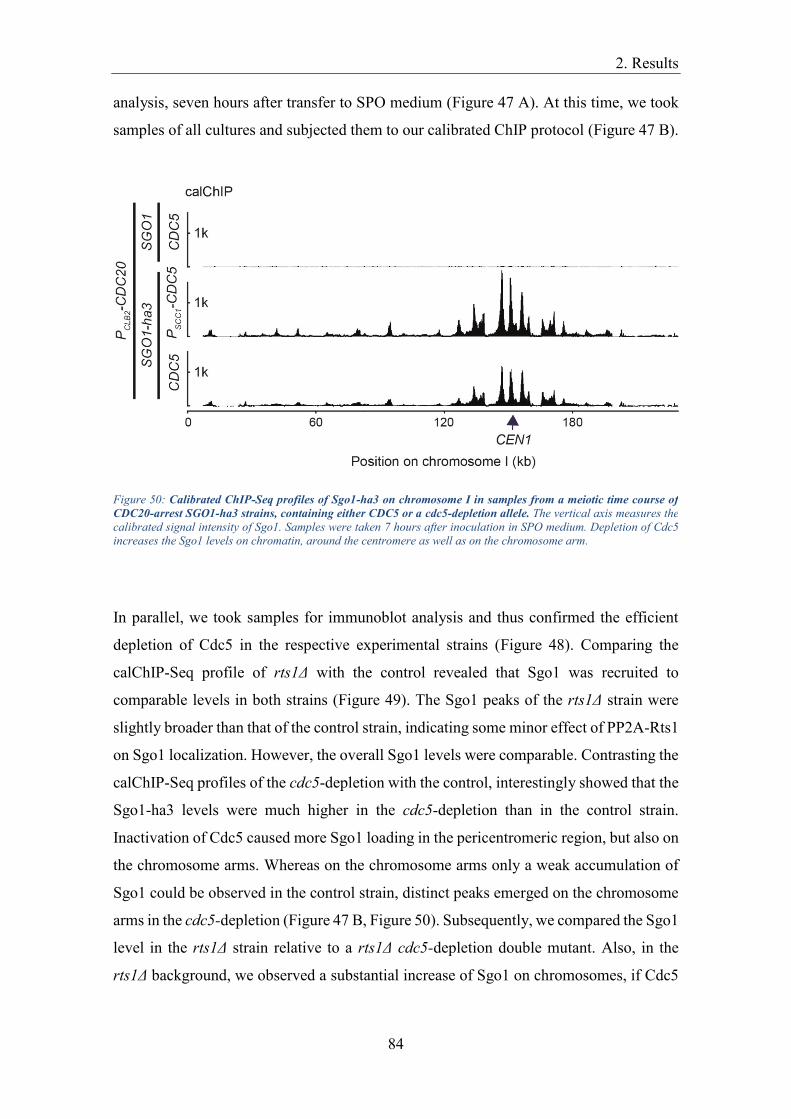
2. Results
84
analysis, seven hours after transfer to SPO medium (Figure 47 A). At this time, we took
samples of all cultures and subjected them to our calibrated ChIP protocol (Figure 47 B).
In parallel, we took samples for immunoblot analysis and thus confirmed the efficient
depletion of Cdc5 in the respective experimental strains (Figure 48). Comparing the
calChIP-Seq profile of rts1Δ with the control revealed that Sgo1 was recruited to
comparable levels in both strains (Figure 49). The Sgo1 peaks of the rts1Δ strain were
slightly broader than that of the control strain, indicating some minor effect of PP2A-Rts1
on Sgo1 localization. However, the overall Sgo1 levels were comparable. Contrasting the
calChIP-Seq profiles of the cdc5-depletion with the control, interestingly showed that the
Sgo1-ha3 levels were much higher in the cdc5-depletion than in the control strain.
Inactivation of Cdc5 caused more Sgo1 loading in the pericentromeric region, but also on
the chromosome arms. Whereas on the chromosome arms only a weak accumulation of
Sgo1 could be observed in the control strain, distinct peaks emerged on the chromosome
arms in the cdc5-depletion (Figure 47 B, Figure 50). Subsequently, we compared the Sgo1
level in the rts1Δ strain relative to a rts1Δ cdc5-depletion double mutant. Also, in the
rts1Δ background, we observed a substantial increase of Sgo1 on chromosomes, if Cdc5
Figure 50: Calibrated ChIP-Seq profiles of Sgo1-ha3 on chromosome I in samples from a meiotic time course of
CDC20-arrest SGO1-ha3 strains, containing either CDC5 or a cdc5-depletion allele. The vertical axis measures the
calibrated signal intensity of Sgo1. Samples were taken 7 hours after inoculation in SPO medium. Depletion of Cdc5
increases the Sgo1 levels on chromatin, around the centromere as well as on the chromosome arm.

2. Results
85
was inactivated by depletion, confirming the previous observation (Figure 47 B, Figure
51).
Taken together, Cdc5 is involved in regulating the binding of Sgo1 to chromosomes in S.
cerevisiae. Active Cdc5 substantially reduces the Sgo1 levels in the pericentromeric
region, but more importantly, also in on the chromosome arms. Thus, Cdc5 antagonizes
the Sgo1 recruitment and keeps the chromosome arm regions free of Sgo1.
Having demonstrated previously that it is possible to accurately quantify the amount of
chromosome-bound protein using calibrated ChIP-Seq data (Figure 30), we aimed to
quantify the effect of Cdc5 on Sgo1 recruitment. To this end, we quantified the amount
of chromosome-associated Sgo1 by correcting the signal for each base pair with the
respective signal in the untagged control, followed by summing-up the untagged-
corrected signals for all base pairs over the full length of all chromosomes. Subsequently,
we calculated the average of all 16 chromosomes (Figure 52). Thus, we could show that
by inactivating Cdc5, the chromosome-bound Sgo1 levels on average increased by more
than 50 %. This result was precisely reproduced, quantifying the amount of chromosome-
bound Sgo1 in the rts1Δ background.
Figure 51: Calibrated ChIP-Seq profiles of Sgo1-ha3 on chromosome I in samples from a meiotic time course of
CDC20-arrest SGO1-ha3 strains, containing either CDC5 rts1Δ or cdc5-depletion rts1Δ. The vertical axis measures
the calibrated signal intensity of Sgo1. Samples were taken 7 hours after inoculation in SPO medium. Depletion of
Cdc5 increases the Sgo1 levels on chromatin in a rts1Δ background, especially on the chromosome arm.

2. Results
86
Having demonstrated that one function of Cdc5 is to regulate the Sgo1 levels in
metaphase I of budding yeast meiosis, we next asked if we could see a similar effect,
measuring cohesin levels in a cdc5-depletion. As we have shown previously that Sgo1 is
loaded onto chromosomes via a cohesin-dependent mechanism, it seemed conceivable
that the altered Sgo1 levels could be explained by an altered cohesin regulation.
Therefore, we constructed CDC20-arrest REC8-ha3 strains, harboring either a cdc5-
depletion or CDC5 allele. Together with an untagged control, all strains were induced to
enter meiosis. The control and experimental strain arrested in metaphase I, as was
assessed by immunofluorescence counting (Figure 53 A). Cdc5 was efficiently depleted,
as was determined by immunoblotting (Figure 53 C). Eight hours after transfer into SPO
medium, we took samples from all three strains and subjected them to our ChIP protocol
and analyzed those samples using qPCR (Figure 53 B) and NGS. The calChIP-Seq
profiles revealed that inactivation of Cdc5 causes a substantial increase of Rec8-ha3
levels (Figure 54). Interestingly, this increase of Rec8 occurred only at chromosome arm
Figure 52: Quantification of calibrated ChIP-Seq data. The amount of Sgo1 along the whole chromosome axis was
quantified in different genetic backgrounds, individually for each chromosome. The bar graphs represent the average
of all 16 chromosomes. The values are relative to the Sgo1 amount in the CDC5 RTS1 control strain. Depletion of Cdc5
increases the amount of chromatin-bound Sgo1 by approximately 50 % in RTS1 and rts1Δ cells.

2. Results
87
sites. In the pericentromeric region, by contrast, the Rec8 levels were very comparable in
the control and experimental strain.
Collectively, this shows that Cdc5 selectively controls the cohesin levels on chromosome
arms in budding yeast meiosis and confirms our previous finding of a cohesin-dependent
loading mechanism for Sgo1.
Figure 53: Meiotic time course samples from CDC20-arrest REC8-ha3 (control) and CDC20-arrest REC8-ha3 cdc5-
depletion strains. (A) Immunofluorescence counting of spindle pole bodies and nuclear division to assess the meiotic
stage of individual samples. Spindles were visualized by staining of Tub1 with a specific antibody. Nuclei were
visualized by DAPI staining of DNA. (B) Calibrated ChIP-qPCR of the samples taken at 8 hours. The bar graphs shows
Rec8-ha3 enrichment. Three different loci on chromosome VI. were analyzed. The vertical axis displays the calibrated
ChIP signal. (C) Immunoblotting of Cdc5 and Tub2 to demonstrate effective depletion of Cdc5 in the strains used in
this time course.

2. Results
88
Figure 54: Calibrated ChIP-Seq profiles of Rec8-ha3 on chromosome I in samples from CDC20-arrest REC8-ha3
strains, containing either CDC5 or a cdc5-depletion allele. The vertical axis measures the calibrated signal intensity
of Sgo1. Samples were taken 8 hours after inoculation in SPO medium. Depletion of Cdc5 increases the Rec8 levels
on chromatin, especially on the chromosome arm.

3. Discussion
89
3. Discussion
Experimental workflow
To enhance the resolution of cohesin dynamics in meiosis, we established a novel
experimental workflow by combining a calibrated and optimized ChIP-Seq assay with a
new synchronization system for budding yeast meiosis. Some methods, like for example
live-cell imaging, provide an excellent temporal resolution of cellular events Other
methods, like conventional ChIP-Seq, provide an excellent spatial resolution. But
currently no method offers at the same time such a high temporal-spatial resolution like
our novel experimental workflow. Collectively, our successfully established
experimental workflow combines four key advantages. First, our synchronization system
generates highly synchronous meiotic cultures. Second, due to the calibration, the
technical noise in the data is very low. Third, quantitative ChIP-Seq data allow the
temporal resolution of biological processes. Fourth, quantitative genome-wide data allow
the quantification of protein-DNA interactions in large genomic regions, compared to
small regions, using only ChIP-qPCR.
To establish this experimental workflow, we first optimized a standard ChIP-Seq
protocol, specifically for the conditions of a meiotic time course experiment. We
optimized the protocol by employing DOE, a method which is typically used for industrial
processes planning (Tanco et al., 2007). Using DOE, we demonstrate that the composition
of the shearing buffer is the most crucial single factor for the outcome of a ChIP
experiment and particular care should be taken to first optimize its chemical composition,
before testing other experimental settings. The relevance of the buffer composition is an
important finding, as usually physical or technical parameters, like incubation times or
treatment intensities, are optimized first when a new method is established. The second
most essential parameters for the outcome of a ChIP experiment are the physical
parameters of time of fixation and time of shearing. However, no statistically detectable
two-factor interaction exists between these factors, making it possible to optimize those
two factors independently.
Having optimized the ChIP-Seq protocol, we continued by combing this protocol with a
recently published, novel calibration system for ChIP-Seq (Hu et al., 2015). It is important
to note that this method is not based on spiking-in the same amount of DNA into all the

3. Discussion
90
experimental samples and then using the signal from the spiked-in DNA to normalize the
signal of the experimental samples. Instead, this calibration method is much more
powerful and would also work if different amounts of calibration material had been added
to the experimental samples. This calibration method uses the ChIP enrichment of the
calibration genome (IP/WCE) to normalize the experimental signal. It is, therefore,
crucial to measure the calibration signal in both, the IP samples and the WCE samples.
This method is based on the assumption that samples from the same cell population
generate identical ChIP enrichment signals. If the ChIP enrichment of samples from the
same cell population deviate, it must be due to technical variation. The calibration strain
population is the same in all aliquots, thus, the ChIP enrichment of the calibration strain
should be the same in all samples and can be used to calibrate the experimental signal.
The calibrated ChIP method was described as a method to estimate changes of protein
occupancy between samples, using ChIP-Seq. By using this system in our lab extensively,
we realized that this system has two additional major advantages over conventional ChIP
workflows that were not yet described explicitly in the literature. First, apart from making
ChIP-Seq profiles quantitative, this system reduces most of the technical variation
between samples, making it a potent tool, also for ChIP-qPCR experiments, because it
increases the sensitivity of qPCR measurements. Second, by eliminating most of the
technical noise, it allows for very intense shearing of the samples, which would otherwise
reduce the signal-to-noise ratio to such an extent that it would not be possible anymore to
detect biologically meaningful signals. Allowing for a very intense shearing of the
chromatin enables to generate samples, in which the peak of the size distribution of
chromatin fragments is close to the optimal length for sequencing library preparation at
around 150 to 200 bp. This, in turn, makes the sequencing library preparation very
efficient, which is advantageous, especially for low-abundant proteins.
Characterization of meiotic cohesin
By using immunofluorescence assays, it was shown that cohesin around the centromere
is protected from cleavage by separase in meiosis I and is only cleaved in meiosis II.
(Klein et al., 1999; Watanabe and Nurse, 1999; Buonomo et al., 2000). From these
observations, a model was conceptualized, in which chromosomal cohesin consists of two
fractions. One fraction is located at the chromosome arms and is susceptible to cleavage

3. Discussion
91
by separase in meiosis I. A second fraction is located around the centromere and is
protected from cleavage by separase in meiosis I and only becomes susceptible to
cleavage by separase in meiosis II. In this binary model, arm cohesin is completely
removed from chromosomes in meiosis I and centromeric cohesin stays intact until
meiosis II. Consequently, in this model, the localization of a cohesin complex defines to
which fractions it belongs and what properties it has.
Contrary to this model, we demonstrate that once APCCdc20 is activated and hence, the
cells start to undergo the metaphase-to-anaphase transition, cohesin is removed from all
chromosomal loci, the arm region as well as the pericentromeric region. The difference
between the arm region and the pericentromeric region is that in the pericentromeric
region, additionally a small cohesin pool exists, which persists until meiosis II (Figure
14, Figure 23 B). Consequently, in the pericentromeric region two different cohesin
fractions exist next to each other, a protected and an unprotected fraction. The
consequence is that it is not sufficient for a particular cohesin complex to localize to the
pericentromeric region to become protected in meiosis I and hence, the localization of a
cohesin complex is not sufficient to define to which fraction is belongs and whether it
becomes protected.
Cohesin has many physiological functions. One function is to provide cohesion between
sister chromatids. The cohesion between sister chromatids in meiosis II is provided solely
by the protected cohesin fraction, as the unprotected fraction is removed in meiosis I.
Because the protected fraction is much smaller than the total amount of pericentromeric
cohesin at the beginning of meiosis, the question arises what the function of the
unprotected cohesin around the centromere is. For fission yeast, it was shown that cohesin
is involved in the termination of transcription (Gullerova and Proudfoot, 2008). For
metazoans, it was demonstrated that cohesin is involved in the genome-wide regulation
of transcription, with significant alterations in gene expression upon cohesin impairment
(Horsfield et al., 2007; Pauli et al., 2010). Moreover, cohesin was shown to be required
for DNA repair (Sjögren and Nasmyth 2001) and chromosome condensation (Guacci et
al., 1997). Consequently, the additional cohesin in the pericentromeric region in meiosis
I might serve regulatory functions concerning transcriptional regulation, DNA repair or
chromosome condensation, instead of providing cohesion.
Kiburz et al. (2005) quantified the size of the region in which cohesin is protected in
meiosis I indirectly, by correlating the position of Rec8 in metaphase I with ChIP-Chip

3. Discussion
92
data of the protection machinery and estimated its size to be 50 kb. Stabilizing Rec8 in
meiosis II, using the hrr25-as1 mutant, we were able to directly visualize the meiosis II-
Rec8 fraction in a calChIP-Seq profile (Figure 28), thereby confirming that the size of the
protected region on average of all chromosomes is 51 kb in S. cerevisiae. However, we
observe differences in the size of this protected pericentromeric region between
chromosomes, which do not correlate to the total length of the chromosome. Interestingly,
the meiosis II cohesin pattern displays strong variation between chromosomes. This
variation raises the question how the protection machinery is recruited reliably and
robustly, to provide sufficient protection to cohesin which is distributed in such diverse
spatial patterns. One mechanistic solution could be to recruit the protection machinery in
a cohesin-dependent manner. A mechanism, which is in fact in place, as we found and
will show in the chapter about the recruitment of the protection machinery.
Furthermore, we demonstrate that larger chromosomes preserve a higher percentage of
their pericentromeric cohesin in meiosis II than smaller ones (Figure 31 B). Moreover,
we show that this is not an effect from different sizes of the protected region, or different
amounts of initial metaphase I cohesin (Figure 31 A). Thus, our data suggest that the
activity of the protection machinery depends on the size of the chromosome and a more
active protection machinery seems to be in place at larger chromosomes. This finding
provides a possible explanation why the frequencies with which each chromosome is
found in aneuploidy events are different. In human cells, significantly fewer of the large
chromosomes and significantly more of the small chromosomes are lost in aneuploidy
events (Martin and Rademaker 1990). Our data provide a possible mechanistic
explanation for this observation, as we show that larger chromosomes preserve a higher
percentage of their pericentromeric cohesin in meiosis II than smaller ones, presumably
resulting in stronger cohesion. The quantitative difference of the protected cohesin
fraction between the chromosomes is not exceptionally large, but the difference is
nevertheless statistically significant, and it matches the cytological observation of a more
stable propagation of larger chromosomes from the mother cell to the daughter cells.
This finding might also be relevant concerning reproduction-related disabilities in
humans. Here, the risk for infertility and congenital disabilities is correlated with age.
Moreover, often these problems result from chromosome missegregation defects in
oocytes, which underlying molecular mechanisms are not yet understood. Kuliev et al.
(2005) found that “more than half of the human oocytes obtained from IVF patients of

3. Discussion
93
advanced reproductive age are aneuploid, due to meiosis I and meiosis II errors”. Cohesin
might be a key player in these kinds of defects, as it provides cohesion and is involved in
the regulation of chromosome segregation (Herbert et al., 2015). For mice, it was shown
that Rec8 levels on chromosomes are severely reduced in oocytes from old mice, and the
resulting weakened centromere cohesion explains most MI chromosome segregation
defects in those cells (Chiang et al., 2010). Hence, it is conceivable that in the future
oocytes are assessed for the risk of reproduction-related disabilities by examining in vivo
the cohesin concentration before fertilization, at least in clinical setups. For a medical risk
assessment, it would be necessary to know what amount of cohesin is minimally required
in oocytes for a faithful chromosome segregation. Our data might provide first useful
insights into this question. One conclusion from our results is that the required amount of
cohesin seems to be chromosome-specific. Consequently, for a reliable medical risk
assessment, it would be necessary to quantify and assess all chromosomes individually
and not only the total cohesin amount in the cell. Based on our data, no final answer can
be given to the question what minimal cohesin amount provides sufficient cohesion for a
faithful, error-free chromosome segregation. However, some helpful conclusions can be
drawn from our data concerning this question: If larger chromosomes protect a higher
fraction of their cohesin than smaller ones, there seems to be some evolutionary pressure
on the cells to provide a more active centromeric protection for larger chromosomes. If
the amount of cohesin on these large chromosomes would be more than sufficient to
provide cohesion, in other words, if they did comprise a redundant backup, there would
be no evolutionary pressure, because they would also segregate reliably with lower
cohesin amounts. The fact that larger chromosomes protect more of their initial cohesin,
in turn, means that it is likely that the cohesin amount we measure in meiosis II is in fact
at the lower limit of what the cells need for a faithful segregation. Thus, our data provide
the first insight, at least for S. cerevisiae, into how much cohesin is minimally required
for providing sufficient cohesion to ensure faithful, error-free chromosome segregation.
Keeping the cells in a prolonged metaphase I arrest, we demonstrate that the arrest is
reliable, robust and of high quality because no artificial accumulation of cohesin or
premature loss of cohesin was detected (Figure 23 A). However, in the ChIP-Seq profiles
of a prolonged metaphase I arrest, we observe that the cohesin peaks become slightly
broader over time, while their height is reduced. The most likely mechanistic explanation
for this is a distal diffusion of cohesin away from the original center of the peaks. This

3. Discussion
94
distal diffusion could occur in all cells in a similar manner or to a different extent in
different cells, resulting in an increase of heterogeneity in the culture. Using a gel-based
assay, followed by western blotting and southern blotting it was shown that it is possible
to generate stable, SDS-resistant cohesin-DNA complexes, just by cross-linking the
cohesin subunit to each other, without cross-linking them to DNA or another chromatin
subunit (Haering et al., 2008). This ability to generate stable cohesin-DNA complexes
demonstrates the topological interaction between cohesin and chromatin. Our
observations can be directly explained, using this topological model: A topological
interaction would allow cohesin to move along the direction of the chromosome axis,
resulting in potential distal diffusion over time, without dissociation of cohesin from
chromosomes. Consistent with this notion, we observe an reduction of qPCR signals in a
prolonged metaphase I arrest (Figure 13). This reduction can be explained by cohesin
diffusing out of the analyzed small qPCR locus, spanning less than 200 bp. However, we
did not measure a loss of total cohesin when we quantified the DNA-bound cohesin in a
prolonged metaphase I arrest (Figure 32), confirming that cohesin is stably bound to
DNA.
The alternative model of a direct interaction between cohesin and DNA via
complementary interaction sites would lock individual cohesin molecules at their
localization sites, making it difficult to explain our observations of a constant and slow
preak broadening. An objection to this interpretation might be that proteins like
transcription factors are also able to slide along DNA, without interacting topologically
and that, consequently, a topological interaction is not a prerequisite for a movement
along the direction of the chromosome axis. However, the sliding movement of non-
topologically interacting proteins is a controlled, energy-dependent process. Without the
actively controlled energy consumption, no sliding would occur. We observe a slow peak
broadening over time, which is unlikely to be a controlled process, thus our observation
supports the validity of the topological model.
Our results have another interesting implication. While it is widely accepted that cohesin
interacts topologically with chromatin, two models have emerged to explain cohesin
translocation on chromosomes. The sliding model proposes a movement of cohesin by
transcriptional activity, while cohesin stays bound to chromatin. The relocation model,
by contrast, proposes translocation by dissociation and association of cohesin at different
sites (Ocampo-Hafalla and Uhlmann, 2011). We observe that cohesin peaks become
3. Discussion
95
broader, once the majority of cells reach metaphase I and that this broadening increases
in a prolonged arrest. According to the relocation model, the interaction of cohesin and
chromatin is dynamic, with a constant dissociation and association of cohesin. In this
model, to generate sharp cohesin peaks, the association event must occur at a specific site,
which determines the center of the cohesin peak. If such a peak becomes broader over
time, then the association region must expand, which would be an actively controlled
process, whose function would be enigmatic. According to the sliding model, by contrast,
our findings could be easily explained. In this model, cohesin is not dynamically
associating and dissociating but stays bound to chromatin. The transcription machinery
provides the translocation force, and peak formation occurs via an accumulation of
cohesin molecules at this site. If the cells reach metaphase, the transcriptional activity
decreases and hence, it is conceivable that without the pushing force of the transcription
machinery the topologically bound cohesin would start to passively diffuse away from
the peak site over time, resulting in a continuous broadening of the peak, as we observe
it. Thus, our results strongly favor the sliding model over the relocation model.
Recruitment of the protection machinery
While it is well established that Shugoshin is required for centromeric protection and that
it fulfills this role by recruiting PP2A-B’ to chromatin, it is much less clear how the
binding of Shugoshin to chromatin is regulated and which are the relevant binding
partners.
Using our novel experimental workflow, we demonstrate that in budding yeast, cohesin
is involved in the recruitment of Sgo1 to chromosomes. Moreover, our data give the first
insight into the specific mechanism of cohesin in Sgo1 localization, which is to
translocate Sgo1 from its initial site of loading at the centromere to its site of permanent
residence in the pericentromeric region. We will discuss a mechanistic model, for which
we hypothesize that apart from being a recruitment platform for PP2A, an additional
function of Sgo1 in centromeric protection might be to provide a physical link between
PP2A and its substrate phospho-Rec8. Moreover, this model can explain how very diverse
spatial patterns of cohesin can be robustly and reliably protected from cleavage in meiosis
I. Finally, we provide the first evidence, suggesting that one function of the topologically
bound cohesin might be to act as a transport factor along the chromosome axis.

3. Discussion
96
Using calibrated ChIP-Seq of Rec8 and Sgo1, we detected a co-localization of Sgo1 and
Rec8 in the region around the centromere (Figure 33). Our findings confirm previous
results of Kiburz et al. (2005), who compared the ChIP-Chip profiles of WT Rec8 and
Sgo1 and showed a co-localization of both proteins in this region. Due to the very low
noise and the quantitative nature of our data, we were able to resolve additional
characteristics of the relationship between these two proteins. We observe that Sgo1
follows a gradient relative to the Rec8 occupancy, which is highest at the centromere and
steadily declines in the regions distal to the centromere (Figure 34). One possibility is that
Sgo1 is loaded at the centromere and spreads from here into the pericentromeric region,
raising the possibility that Sgo1 is not just recruited from the nucleoplasm to the
chromosomes, but that this recruitment follows a specific path, which starts at the
centromere.
Kiburz et al. (2005) further compared the ChIP-Chip profiles of Rec8 and Sgo1 in a
spo11Δ rec8Δ strain and found that the Sgo1 signal is absent in this mutant. Our calibrated
ChIP-Seq data also confirms this result (Figure 37, Figure 38). However, these
experiments do not address the problem that by deleting the cohesin subunit REC8, the
chromatin structure is severely altered because, during meiosis, only Rec8-containing
cohesin complexes provide cohesion (Rankin, 2015). Moreover, some reports in the
literature explicitly exclude the involvement of cohesin in Sgo1 localization in fission
yeast and Drosophila, respectively (Kitajima et al., 2004; Lee et al., 2004). Due to these
concerns, we also tested the Sgo1 localization in a scc4-m35 cohesin loader mutant
background, in which the cohesin levels on chromosomes are drastically reduced, but
cohesin is not entirely absent from chromosomes (Hinshaw et al., 2015). Thus, the cells
in the scc4-m35 mutant deviate from the cells of the rec8Δ strain in two critical respects:
First, in the scc4-m35 mutant, wildtype-levels of REC8 are expressed, restoring the
presence of soluble Rec8-cohesin complexes in the nucleoplasm, excluding unintended
side-effects from the lack of soluble cohesin complexes. Apart from providing cohesion,
cohesin complexes have other regulatory functions, which might be re-established in this
background. Second, low levels of functional cohesin are recruited to chromosomes, also
in the absence of the cohesin loader, resulting in a low basal level of cohesion (Hinshaw
et al., 2015). Consequently, the main difference between the SCC4 control strain and the
scc4-m35 mutant strain is the amoount of cohesin complexes, which are topologically
loaded onto chromosomes, because this function is provided by the cohesin loader

3. Discussion
97
complex. This specific difference between the strains demonstrates that not just the
presence of cohesin complexes in the nucleoplasm, but the topological loading of Rec8-
cohesin onto chromosomes is required for the pericentromeric recruitment of Sgo1,
indicating a specific function of topologically loaded Rec8 for the pericentromeric
localization of Sgo1 (Figure 40, Figure 41). In a third experiment, by using the AID
system, we artificially removed Rec8 from chromosomes in metaphase I, after the cells
have already fully established cohesion and after the cells finished loading of Sgo1 onto
chromosomes. With this experiment, we confirm that after cohesion of sister chromatids
has been established and after the cells have loaded Sgo1 onto chromosomes, Sgo1 is lost
from chromosomes, if Rec8 is artificially removed (Figure 43). Furthermore, this
experiment demonstrates that the kinetics with which Sgo1 and Rec8 are lost from
chromosomes deviate from one another. Upon cleavage of Rec8 from chromosomes, the
corresponding calChIP-Seq signal for Rec8 is lost within 60 minutes after induction of
the AID system. The pericentromeric Sgo1 signal, by contrast, is still partially retained
after 60 minutes and only lost after 120 minutes. The centromeric signal of Sgo1 is
entirely unaffected by the removal of Rec8. This confirms that the pericentromeric
localization of Sgo1 requires cohesin, but not the centromeric recruitment. The
experiment further demonstrates that once Sgo1 is recruited to the pericentromeric region,
it can reside there for a prolonged time, even in the absence of cohesin, suggesting the
presence of another pericentromeric receptor for Sgo1. It is very likely that this
heterochromatin receptor consists of the proteins Iml3 and Chl4, as it was demonstrated
that the inactivation of those proteins results in reduced chromosomal Sgo1 levels (Kiburz
et al., 2005). Thus, we demonstrate that cohesin acts as a transport and loading factor for
Sgo1 into the protected pericentromeric region, where it is subsequently transferred to its
heterochromatin receptor.
By using bub1Δ and bub1Δ rec8Δ strains, we demonstrate that additionally Bub1 is
required for recruiting Sgo1 to chromosomes (Figure 44, Figure 45). This result confirms
several reports in the literature about a Bub1-dependent Sgo1 loading mechanism (Kiburz
et al., 2005; Kitajima et al., 2004; Kitajima et al., 2005; Tang et al., 2004). Moreover, our
results give insights into the relationship between Bub1 and cohesin concerning the
loading of Sgo1. Our findings suggest that Bub1 acts upstream of Rec8 in the recruitment
of Sgo1 because without Bub1, Sgo1 cannot localize to chromosomes at all. Without
Rec8, by contrast, Sgo1 cannot recruit to the pericentromeric region, but can still bind to

3. Discussion
98
a small region at the centromere. This binding at the centromere, in turn, must be Bub1-
dependent, as we observe it in strains expressing BUB1, but not the cohesin subunit REC8.
Taken together, we have confirmed that Sgo1 and Rec8 precisely co-localize in the region
surrounding the centromere (Figure 33). We have demonstrated that Sgo1 follows a
gradient, which is highest at the centromere and declines continuously distal to the
centromere (Figure 34). By using an IP-WB assay, we have shown that cohesin and Sgo1
physically interact (Dr. Wei Ma, Zachariae Lab, unpublished). We have demonstrated
that the pericentromeric localization of Sgo1 depends on topologically loaded Rec8
(Figure 41), whereas the localization of Rec8 does not depend on Sgo1 (Figure 36). We
have confirmed that additionally, Bub1 is required for loading of Sgo1 on chromatin and
we have demonstrated that the Bub1-mediated loading results in a sharp peak right at the
centromere in calibrated ChIP-Seq profiles, whereas Sgo1 is not recruited to the
pericentromeric region without topologically-bound cohesin (Figure 45).
Therefore, we propose a new three-step loading model for Sgo1, in which cohesin acts as
a transport factor for Sgo1 along the chromosome axis. According to this model, Sgo1
and cohesin are both loaded onto chromosomes at the centromere by independent
mechanisms. The loading of Sgo1 is Bub1-dependent and involves phosphorylation of
histone H2A (Kitajima et al., 2004; Kawashima et al., 2010; Tang et al., 2004). The
loading of cohesin is Scc2/Scc4-dependent and involves phosphorylation of Ctf 19 by
DDK (Ciosk et al., 2000; Hinshaw et al., 2017). As both proteins are loaded at the
centromere, they come in close vicinity and interact physically. Subsequently, the
topologically bound cohesin is transported away from its site of loading into the
pericentromeric region by a sliding movement, triggered by the transcription machinery
(Lengronne et al., 2004; Bausch et al., 2007; Stigler et al., 2016). Cohesin takes the
physically bound Sgo1 away with it and transports it into the pericentromeric region,
where it interacts with its heterochromatin receptor, which comprises the proteins Iml3
and Chl4 (Kiburz et al., 2005). Thus, cohesin acts as a transport factor for Sgo1 in the
pericentromeric region and thereby ensures the correct localization of the protection
machinery relative to its substrate cohesin.
An alternative model is that cohesin is loaded at the centromere, translocated to its sites
of permanent residence in the pericentromeric region and soluble Sgo1 subsequently
binds cohesin. However, we favor the first model because the second model cannot
explain the requirement of Bub1 for Sgo1’s recruitment to chromatin. Several groups

3. Discussion
99
showed, and we have confirmed these results, that Bub1 is required for the recruitment
of Sgo1 to chromatin. (Kiburz et al., 2005; Kitajima et al., 2004; Kitajima et al., 2005;
Tang et al., 2004). Cells without functional Bub1 are not able to recruit Sgo1 at all.
Furthermore, we have shown that in meiotic cells, which do not topologically load
cohesin but have active Bub1, Sgo1 is still recruited at the centromere in a Bub1-
dependent manner (Figure 38, Figure 41). Thus, the function of Bub1 is to recruit cohesin
into the region close to the centromere. However, contrary to cells, which co-load cohesin
at the centromere, the translocation of Sgo1 into the pericentromeric region distal to the
centromere does not occur in those cells. These findings demonstrate that the function of
Bub1 is to load Sgo1 at the centromere, but Bub1 is not sufficient for its pericentromeric
spreading. Thus, we strongly favor a model in which cohesin is initially loaded at
centromeres in a Bub1-dependent way and then translocated into the pericentromeric
region in a cohesin-dependent way.
Additionally, according to our three-step loading model, Sgo1 fulfills a new, second
function for centromeric protection of cohesin. It is well established that Sgo1 is required
for centromeric protection and that its function is to recruit PP2A-B’ to chromosomes
(Katis et al., 2004; Kerrebrock et al., 1995; Kitajima et al., 2004; Kitajima et al., 2006
Marston et al., 2004; Rabitsch et al., 2004; Riedel et al., 2006). According to our model,
Sgo1 additionally binds to cohesin and thus, links the phosphatase PP2A-B’ physically
to its substrate, which is the phosphorylated Rec8. Bringing an enzyme and its substrate
into proximity increases the “effective concentration” of the substrate, thus, drastically
increases the enzymatic activity. This high activity of the phosphatase, in turn, ensures a
tight protection mechanism, which is necessary for an error-free and reliable meiotic
division. Consequently, for the first time, we propose that Sgo1 might have a second
function in centromeric protection, which is to link the phosphate PP2A-B’ to its substrate
phospho-Rec8.
Moreover, our new three-step loading model allows us to reconcile an apparent
controversy in the literature, related to the function of cohesin in Sgo1 recruitment. If the
cells load Sgo1 in a three-step process, inactivation of cohesin does not remove all Sgo1
from chromosomes, because of the first, Bub1-dependent step, which still recruits some
Sgo1 at the centromere. If the used experimental method does not provide enough
resolution to distinguish the centromeric from the pericentromeric region, like it is the
case for many immuno-staining-based methods, the obtained data might be misleading.

3. Discussion
100
One might get the impression that removal of cohesin only mildly reduces the Sgo1 levels,
leading to the conclusion that cohesin is not crucial for the recruitment of Sgo1. However,
we cannot exclude the possibility that cohesin might not be involved in the localization
of Shugoshins in organisms other than budding yeast.
Regulation of centromeric protection
If Sgo1 and with it PP2A were recruited to chromosome arm sites, it would have
catastrophic consequences, as it would protect arm cohesin from cleavage in meiosis I,
thus, preventing the first meiotic division (Kitajima et al., 2006; Riedel et al., 2006).
Consequently, one important question concerning the regulation of the recruitment of the
centromeric protection machinery is how to exclude Sgo1 from chromosome arms.
Tang et al. (2006) showed that in human cells, PP2A is required for the chromosomal
localization of Sgo1 in mitosis. Even though Sgo2 is responsible for the protection of
centromeric cohesin in human meiosis, and not Sgo1, this finding nevertheless raises the
possibility that PP2A might also be involved in the recruitment of Sgo1 in budding yeast
meiosis. We demonstrate that the Sgo1-ha3 levels are comparable in an RTS1 and rts1Δ
strain, excluding the possibility that PP2A-Rts1 controls its own recruitment to
chromosomes in budding yeast meiosis (Figure 49). However, the Sgo1-ha3 calChIP-Seq
pattern of the rts1Δ strain looks broader and more diffuse than that of the RTS1 control
strain. PP2A-Rts1 binds Sgo1 in a 1:2 stoichiometry, meaning that one PP2A-Rts1
complex binds two Sgo1 monomers (Xu et al., 2009). The binding site of PP2A-Rts1 is a
coiled-coil domain, which is formed by homodimerization of two Sgo1 proteins. One
could speculate that each Sgo1 monomer might bind to a different cohesin moiety, thus,
physically linking two spatially distant cohesin complexes. Hence, it is conceivable that
without the binding force of PP2A-Rts1 cohesin drags apart the dimerized Sgo1
monomers, resulting in a more spread-out Sgo1 pattern.
Using immunostaining of Drosophila cells, Clarke et al. (2005) showed that in mitosis,
the POLO kinase is required for removing the Shugosin-homolog MEI-S332 from
chromosomes at the metaphase-to-anaphase transition. Using immunostaining of
chromosome spreads from human cells, Tang et al. (2006) demonstrated that depletion of
Plk1, the human POLO kinase-homolog, restores the chromosomal localization of Sgo1
in cells, which were co-depleted of PP2A. These studies demonstrate that the POLO

3. Discussion
101
kinase exhibits a Shugoshin-antagonizing function in mitosis of Drosophila and humans.
It is unknown whether this Shughoshin antagonizing function is a conserved property of
the POLO kinase or if it is specific to mitosis in the investigated organisms. Using our
novel experimental workflow, we demonstrate that Cdc5 regulates the binding of Sgo1
to chromosomes also in meiosis of S. cerevisiae (Figure 47, Figure 50, Figure 51). Active
Cdc5 substantially reduces the Sgo1 levels in the pericentromeric region, and also on the
chromosome arms (Figure 50). Thus, Cdc5 antagonizes the Sgo1 recruitment and keeps
the chromosome arm regions free of Sgo1. However, contrary to our results, Clarke et al.
(2005) only reported about the persistence of MEI-S332 at the centromeres, but not about
a change on chromosomes arm sites, possibly due to lack of spatial resolution and
sensitivity of the used immuno-staining method. Therefore, for the first time, we
demonstrate that the activity of Cdc5 is required for controlling Sgo1 levels on
chromosomes in S. cerevisiae meiosis. Moreover, we show that without Cdc5, Sgo1 also
recruits to chromosome arms sites.
One concern with respect to our findings might be that depletion of Cdc5 results in a very
tight metaphase I arrest and thus, the calChIP-Seq pattern might reflect a tightly arrested
culture, without any escaping cells, resulting in an apparently higher chromosomal
loading of Sgo1. However, as we have demonstrated previously (Figure 23), the arrest by
depletion of Cdc20 by expression of CDC20 from the CLB2 promoter is tight and robust,
and no cohesin is removed from chromosomes over a time frame of almost two hours.
Therefore, the pattern in the CDC20-arrested control strain shows a tightly arrested
culture, excluding that the additional accumulation of Sgo1 in the cdc5-depletion is a
side-effect of a tighter arrest in a cdc20 cdc5 double depletion background.
Additionally, we demonstrate that Cdc5 also controls the levels of chromosome-bound
cohesin in meiosis (Figure 54). Depletion of Cdc5 results in increased levels of Rec8 at
chromosome arm sites. Previously it was shown that the overall cohesin level in meiotic
prophase cells is higher than in meiotic metaphase I cells and that this reduction of cohesin
from prophase to metaphase I is regulated by Cdc5 (Yu and Koshland, 2005). Our results
confirm that cohesin is reduced by a Cdc5-dependent mechanism. Moreover, due to the
high spatial resolution of our assay, we can contribute additional information and show
that cohesin is specifically removed from chromosome arm sites in a Cdc5-dependent
manner in budding yeast meiosis. Hence, for the first time, we provide robust evidence
for a prophase-pathway-like removal of cohesin in budding yeast.

3. Discussion
102
Furthermore, our finding that Cdc5 controls the levels of chromosome-bound cohesin in
meiosis supports our model of a cohesin-dependent Sgo1 loading mechanism. If a
cohesin-dependent mechanism loads Sgo1 onto chromosomes, one would expect that a
higher amount of chromosome-bound cohesin recruits a higher amount of chromosome-
bound Sgo1. We observe precisely this. Inactivation of Cdc5 causes an increase of
chromosome-bound cohesin and consequently of Sgo1 (Figure 50, Figure 54).
Inactivation of Cdc5 leads to an upregulation of cohesin, specifically on chromosome
arms. Concomitant, we observe recruitment of Sgo1 to chromosome arms, which is
something we never observed in any CDC5 strain.

4. Material and Methods
103
4. Material and Methods
Yeast strains
All experiments were performed with the laboratory strain SK1 of S. cerevisiae. All
strains were auxotrophic for histidine, leucine, tryptophan, and uracil, making it possible
to use the respective auxotrophy-complementing genes as selective markers. The
genotype of all strains was ho∷LYS2 his3∷hisG leu2∷hisG trp1∷hisG ura3. All diploid
strains were homozygous for their respective alleles unless stated otherwise.
Construction of new strains was performed by the mating of the appropriate haploid
strains, followed by sporulation, dissection of tetrads and selection on appropriate
selection plates. Alternatively, new strains were obtained by transformation and selection
for genomic integration of the transformed DNA.
The allele to deplete Cdc20 by expression of CDC20 from the CLB2 promoter was
obtained from the Angelika Amon Lab, Massachusetts Institute of Technology, USA via
the strain A5567. The allele to deplete Sgo1 by expression of SGO1 from the SCC1
promoter was obtained from the Kim Nasmyth Lab, Oxford University, UK via the strain
K12298. The deletion allele of RTS1 (rts1Δ) was obtained from the Kim Nasmyth Lab,
Oxford University, UK via the strain K13088. The allele to deplete Cdc5 by expression
of CDC5 from the SCC1 promoter was obtained from the Kim Nasmyth Lab, Oxford
University, UK via the strain K10834 and it was previously described in Matos et al.
(2008). The mutated allele of the SCC4 cohesin loader subunit (scc4-m35) was obtained
from the Kim Nasmyth Lab, Oxford University, UK via the strain K25036 and it was
previously described in Hinshaw et al. (2015). The REC8-AID system was obtained from
the Neil Hunter Lab, University of California, Davis, USA via the strains NHY6683 and
NHY7649.
The C. glabrata wild-type strain was obtained from the National Collection of Yeast
Cultures (NCYC), Norwich, UK, with the accession number NCYC 388, deposited by
IFO, Japan, 1953.

4. Material and Methods
104
Plasmid construction
C. glabrata tagging plasmid
We designed a series of tagging plasmids in silico, harboring the C-terminal part of the
C. glabrata SCC1 gene, followed by a NheI-flanked epitope tag (Ha3, Myc9 or Pk9), a
marker cassette conferring resistance to Nourseothricin (Goldstein and McCusker, 1999),
and the terminator of the CgSCC1 gene. The gene in the Nourseothricin resistance
cassette is under control of the translation elongation factor 1 alpha (TEF) promoter,
which is a constitutively active promoter, able to control gene expression in yeast. This
whole tagging cassette is flanked by a XmnI site and MfeI site, respectively. Both
restriction sites are unique in the tagging plasmid. As both restriction enzymes work well
under identical reaction conditions, it is possible to separate the tagging construct from
the vector backbone by a simple double digest reaction. Releasing the tagging construct
from its vector backbone generates a linear fragment of 2949 bp, which is homologous to
the C-terminal part of the C. glabrata SCC1 ORF and the SCC1 terminator, allowing for
genomic integration at this specific locus. The construct was synthesized and ligated into
a pMA-RQ vector backbone by Thermo Fisher Scientific GENEART, Regensburg,
Germany.
Yeast transformation
For transformation, approximately 2 μg transforming DNA, purified on a Qiagen PCR
purification column or via sodium acetate/ethanol precipitation was used.
S. cerevisiae transformation
The protocol was modified after the method by Ito et al. (1982). An overnight yeast
culture was grown to OD 0.6-0.8. Cells were harvested by centrifugation at 4000 rpm for
5 min, washed twice with 0.5 volumes of 1 M LiAc-Sorbitol (D-Sorbitol, ≥ 98 %, Sigma-
Aldrich, Merck, Darmstadt, Germany; Lithium acetate dihydrate 98 %, Sigma-Aldrich,
Merck, Darmstadt, Germany) solution and resuspended in the rest of the LiAc-Sorbitol
solution after discarding the supernatant. The transformation mixture comprises up to 20
μl of DNA, 15 μl of Salmon sperm DNA (Salmon Sperm DNA, sheared (Ambion,
Thermofisher Scientific, Waltham, USA), which was heated to 95 °C and cooled in water-
ice shortly before use, 100 μl of cell suspension and 280 μl of PEG 4000 solution (Carl

4. Material and Methods
105
Roth GmbH, Karlsruhe, Germany). The transformation mixture was incubated at room
temperature for 60 min, before addition of 40 μl of DMSO (Sigma-Aldrich, Darmstadt,
Germany) and another round of incubation for 15 min at 42 °C. After this, 1 ml of YPD
was added. The cell suspension was spun down, the supernatant was discarded, and cells
were plated on respective selection plates. For dominant markers, cells were incubated at
25 °C for 5 hours in YPD medium before plating on selection plates.
C. glabrata transformation
A protocol modified after Gietz et al. (1992) was used. An overnight yeast culture was
grown to OD 0.6-0.8. Cells were harvested by centrifugation at 4000 rpm for 5 min,
washed once with an equal volume of sterile water. The cells were resuspended in 1/100
volume of 100 mM LiAc (pH 7.5). The transformation mixture comprises 50 μL of cell
suspension, 240 μL of 50% PEG (3500), 36 μL of 1 M LiAc, 50 μg of heat-denatured
salmon sperm DNA and transforming DNA. The transformation mixture was then
incubated at 30 °C for 30 min, followed by addition of 45 μL DMSO and incubation at
42 °C for 15 min. The cell suspension was spun down, the supernatant was discarded, and
cells were plated on respective selection plates. For dominant markers, cells were
incubated at 25 °C for 5 hours in YPD medium before plating on selection plates.
Culture media
The basis of most culture media is a mixture of 1 % yeast extract and 2 % bacto peptone
(YP), as described in Sherman (1991). For a mitotic yeast culture, YP medium containing
2 % D-Glucose and 0,005 % Adenine (YPD) was used. For induction of meiosis, YP
medium containing 2 % potassium acetate (YEPA) was used. Sporulation medium (SPO)
contains 100 mM sodium acetate, 25 mM potassium chloride, 3 mM magnesium sulfate
and 20 mM sodium chloride (all from VWR Chemicals, Leuven, Belgium). For the
corresponding culture plates, the media were additionally supplemented with 2 % bacto
agar. For selection plates for dominant marker cassettes kanMX, natMX or hphMX
(Goldstein and McCusker, 1999; Wach et al., 1994), YPD plates were supplemented with
100 µg/ml G418 (Kan), 200 µg/ml CLONAT (Nat) or 500 µg/ml hygromycin B (Hph),
respectively. Media and all described buffers were mixed, using purified water from a

4. Material and Methods
106
Milli-Q Advantage A10 machine (Merck, Darmstadt, Germany). For all media and
buffers, the pH was measured with a Mettler Toledo Seven Compact machine.
Induction of meiosis
Meiosis was induced as described previously (Oelschlaegel et al., 2005). Briefly, haploid
cells were grown on a YPG plate, to enrich for cells with functional mitochondria. On the
second day, haploids were mated and grown o/n. On the third day, the mating mixture
was streaked to single colonies on a YPG plate and grown for 48 h at 25 °C. On day five,
single-colonies were picked and streaked into a patch on a YPD plate and grown for
another 23 h. On day six, diploid cells were repeatedly spread to a YPD plate until the
cells formed a cellular monolayer. Subsequently, the cells were grown for 23 h to produce
an even lawn. This step results in a physiological synchronization of the cells. On day
seven, cells were inoculated in liquid YPG medium at an OD of 0.3 and grown for 12 h
at 30 °C. This leads to a transient G1 arrest. On day eight, the cells were washed with
SPO medium and inoculated to liquid SPO medium at a final OD600 of 6.0. The cell
density was measured with a spectrophotometer, after sonication of the samples with a
Sonoplus sonicator. For a metaphase arrest, samples were grown for 8 h after inoculation
to liquid SPO (unless stated otherwise). For a synchronous meiotic time course, using the
CDC20-mAR system, samples were taken every 20 minutes or every 10 minutes after the
release into anaphase I. For expression of CDC20 to release the cells into anaphase I in
the CDC20-mAR system, 10 µM CuSO4 (Merck, Darmstadt, Germany)were added.
For inhibition of analog-sensitive kinases, the PP1 analog NM-PP1 (Cayman Chemical,
Michigan, USA) was used (Bishop et al., 2000) at a final concentration of 5 µM.
For targeted protein degradation by the auxin-inducible degron system (Nishimura et al.,
2009), 10 µM CuSO4 was used to induce the OsTir1 SCF ligase subunit, followed by
addition of a final concentration of 2 mM indole acetic acid (IAA) (Tokio Chemical
Industry, Tokyo, Japan) dissolved in DMSO 30 minutes later.

4. Material and Methods
107
Fixed-cell immunofluorescence
Microscopy samples were prepared as described in Salah and Nasmyth (2000). Briefly,
cells were fixed in formaldehyde (final concentration 3 % (v/v)) overnight and washed
three times with KPi buffer (0.1 M potassium phosphate [Potassium dihydrogen
phosphate and dipotassium hydrogen phosphate, Carl Roth GmbH, Karlsruhe, Germany]
pH 6.4) and once with spheroplasting buffer (0.1 M KPi pH 7.4, 1.2 M sorbitol, 0.5 mM
MgCl2 [Magnesium chloride hexahydrate, Merck, Darmstadt, Germany]) the next
morning. The yeast cell wall was digested by addition of 6 µl 1 M DTT (Thermo
Scientific, Waltham, USA) and 20 µl of Zymolyase (1 mg/ml) (Zymolyase T100, AMS
Biotechnology, Abingdon, UK). Time of incubation was determined by regular visual
inspection of the cells under a DIC light microscope. Spheroplasts were loaded on a
microscope glass slide, which was pre-treated by 0.1 % Poly-L-Lysine solution (Merck,
Darmstadt, Germany), to adhere them to the glass surface. Samples were then blocked by
addition of 5 µl PBS-BSA (0.04 M K2HPO4 (Carl Roth GmbH, Karlsruhe, Germany),
0.01 M KH2PO4 (Carl Roth GmbH, Karlsruhe, Germany), 0.15 M NaCl, 0.1 % NaN3, 1
% BSA [Jackson ImmunoResearch, West Grove, USA]) per sample for 30 minutes.
Following this, the samples were stained with the respective primary antibodies, which
were incubated for 1 hour, followed by 3 washing steps with PBS-BSA and subsequent
staining with the corresponding secondary antibody, followed by another four washing
steps. Finally, the samples were submerged in a DAPI containing solution (100 mg p-
phenylenediamine [Merck, Darmstadt, Germany] + 10 ml PBS, pH 8.0 were added to 90
ml of glycerol [VWR Chemicals, Leuven, Belgium] and DAPI [(Molecular Probes,
Eugene, USA)] at 0.05 μg/ml) and slides were sealed by a coverslip and nail polish.
Samples were analyzed on a fluorescence microscope Axioskop 2 (Carl Zeiss AG,
Oberkochen, Germany).
Live-cell imaging
Live-cell imaging of meiotic cells was performed as described previously (Okaz et al.,
2012). Briefly, cells were induced to enter meiosis and diluted to OD600 using SPO
medium. Aliquots of 300 µl were loaded into 8-well Lab-Tek chamber slides (Nunc,
155409) coated with Concanavalin A (Sigma C5275, 0.5 mg/ml in PBS). The imaging
system was a DeltaVision Elite system controlled by the SoftWoRx software, version 5.0

4. Material and Methods
108
and equipped with an environmental chamber for temperature control. Optical
components comprised a microscope (Olympus IX71), InsightSSI solid-state illumination
system, objective (Olympus UPlanSApo 100X/1.4 NA), and a CCD camera
(Photometrics CoolSnap HQ2). Imaging acquisition was performed every 10 minutes
over a total time frame of 12 hours. The red and green channel was used for imaging. The
filter was a 12 % neutral density filter (TrueLight Additional ND filter, ND090-37 12
%T, Lumencor). Exposure times were 50-300 ms, depending on the fluorescence
intensity of the samples. For each time point, 8 optical sections in the z-direction with a
distance of 1 μm were acquired, deconvolved, and projected to a single 2D-image. Post-
acquisition data processing was performed using the ImageJ software (Rasband, W.S.,
ImageJ, U.S. National Institutes of Health, Bethesda, MD, http://imagej.nih.gov/ij/). For
quantification, 100 cells were followed individually through meiosis, and the optical
markers were scored. Finally, representative cells were selected, and images were
assembled by merging data from different optical channels, using the ImageJ Stack
Combiner plugin.
Western blotting
Proteins were analyzed by dissolving 5 to 10 ml of meiotic yeast culture at a final
concentration of 10 % in trichloroacetic acid (TCA) (Merck, Darmstadt, Germany). The
cell extracts were spun-down, resuspended again in 10 % TCA and broken, using glass
beads on a vibrax machine. The cell extract was resuspended in 0.2 ml 1 X Laemmli
sample buffer and 0.1 ml Tris (Merck, Darmstadt, Germany) was added. After boiling the
samples for 10 min, the protein concentration was determined using a Bradford assay
(Protein Assay Dye Reagent Concentrate, Bio-Rad, Munich, Germany) and 50-200 μg
protein were loaded on an 8 % SDS polyacrylamide gel and the gel was run o/n at a low
voltage. For the preparation of the western blot, a PVDF membrane, which is very
hydrophobic, was treated with methanol (Fisher Scientific, Leics, UK) for a few minutes.
Subsequently, the membrane was washed with water and transferred to blotting buffer (3
g Tris base, 14,4 g glycine and 1 ml of 20 % SDS [Serva, Heidelberg, Germany] per 1
liter). The western-blot was assembled by putting the PAGE gel between 4 sheets of
blotting paper on both sides. The blot was run for 2-3 hours at 0.8 mA per square cm.
Subsequently, the blot was stained using appropriate antibodies.

4. Material and Methods
109
Chromatin immunoprecipitation
A standard meiotic time course was performed, as described under “Induction of
meiosis”. Sampling volume was 10 ml to 60 ml, depending on the ChIP target. Samples
were fixed in formaldehyde (formaldehyde 16 % (w/v), methanol-free, Thermo
Scientific, Waltham, USA) at a final concentration of 3 % (v/v) for 22 minutes and
washed twice, using ice-cold KPi buffer (0.1 M potassium phosphate pH 6.4), followed
by a final wash in spheroplasting buffer (0.1 M KPi pH 7.4, 1.2 M sorbitol, 0.5 mM
MgCl2). The supernatant was removed and samples stored at -80 °C. The sample was
thawed on ice and resuspended in 1 ml spheroplasting buffer containing 1 mM PMSF
(AppliChem, Darmstadt, Germany). Pre-fixed C. glabrata samples were added to the S.
cerevisiae samples. 25 μl 1M DTT was added and samples were incubated for 15 min/25
°C, followed by addition of 90 ul zymolyase (1 mg/ml) and incubation for 10 min/35 °C.
Samples were washed once in spheroplasting buffer containing 1 mM PMSF and 5 mM
EDTA (Sigma-Aldrich, Merck, Darmstadt, Germany) to remove DTT and zymolyase and
stored on ice. Subsequently, samples were washed once in rinsing buffer (10mM Hepes-
KOH (pH 7.55) [Acros Organics, New Jersey, USA]) and resuspended in shearing buffer
(10 mM Hepes-KOH pH 7.5, 1 mM EDTA, 1 % Triton X-100 [Serva, Heidelberg,
Germany], 0.1 % Na Deoxycholate [Merck, Darmstadt, Germany]), containing 1X
cOmplete Protease inhibitor cocktail tablets (Roche Diagnostics, Mannheim, Germany)
and 1X Halt Protease Inhibitor Cocktail (Halt Thermofisher Scientific, Waltham, USA).
Following this, samples were loaded into a Covaris Millitube (Millitube, 1 ml, Covaris,
Woburn, USA) and sonicated on a Covaris E220 for 30 minutes/140 watts/17 % duty
factor. Water temperature limits were set to 3 °C-8 °C; the water level was 5. 10X
Shearing-to-IP buffer (410 mM Hepes-KOH pH 7.5, 1 mM EDTA, 1 % Triton X-100,
0.1 % Na Deoxycholate, 1.4 M NaCl) was added to the samples to a final concentration
of 1X. Samples were cleaned from cell debris and emulsified components by spinning-
down at 14000 rpm/5 min/4 °C and transfer of the clean middle part of the supernatant to
a new tube. The protein concentration in the samples was determined by a Bradford assay,
measured on a spectrophotometer. Samples were adjusted to the same protein
concentration using IP buffer (50 mM Hepes-KOH pH 7.5, 1 mM EDTA, 1 % Triton X-
100, 0.1 % Na Deoxycholate, 140 mM NaCl) containing 1X cOmplete Protease inhibitor
cocktail tablets and 1X Halt Protease Inhibitor Cocktail. The samples were pre-cleared
by incubation with 300 μl washed dynabeads Protein A (Novex, Life Technologies, Oslo,

4. Material and Methods
110
Norway) for 1 h/4 °C. 50 μl of the pre-cleared samples were transferred to a fresh tube
and stored as Whole cell extract sample at 4 °C. The respective amount of affinity purified
antibody (7 μg 3F10) was added to the remaining samples for 2 h/4 °C.
Immunoprecipitation was performed by addition of 100 μl dynabeads protein A, which
were blocked for 30 minutes using IP buffer containing BSA (10 mg/ml), and incubation
overnight at 4 °C. The next day, samples were washed once with a series of buffers: 1) IP
buffer, 2) IP buffer containing 500 mM NaCl, 3) washing buffer (10 mM Tris-HCl pH
8.0, 0.5 % Na Deoxycholate, 1 mM EDTA, 250 mM LiCl [VWR Chemicals, Leuven,
Belgium]), 4) TE buffer (10 mM Tris-HCl pH 8.0, 1 mM EDTA), 5) TES buffer (50 mM
Tris-HCl pH 8.0, 10 mM EDTA, 1 % SDS) and incubated at 65 °C/8h-o/n to reverse the
crosslinks. For purification, 6 μl of RNase A (RNase A from bovine pancreas, Merck,
Darmstadt, Germany) (10 mg/ml) was added 1h/37 °C, followed by 15 μl of Proteinase
K (Merck, Darmstadt, Germany) (20 mg/ml) 2 h/65 °C. After this, 10 μl Na Acetate
(Merck, Darmstadt, Germany, 3M, pH 5.2) was added, and samples were loaded onto a
PCR purification column (QIAquick PCR Purification Kit, Qiagen, Hilden, Germany).
Samples were washed with the kit’s washing buffer and eluted with the kit’s elution buffer
in a final volume of 50 μl. Samples were stored at -80 °C. Sample concentrations were
determined fluorometrically (Qubit 3.0, Thermofisher Scientific, Waltham, USA).
qPCR
IP samples were diluted 1:50 in sterile, PCR-grade water. WCE samples were diluted
1:250. For the primer-master mix, qPCR primers were added at a final concentration of
1.7 μM to the 2X SYBR green master mix (2X Power SYBR Green PCR Master Mix,
Life Technologies, Warrington, UK), which was added at a final concentration of 1X. 15
μl of the primer-master mix was added to 10 μl of IP or WCE sample per well of a 96-
well reaction plate (MicroAmp Fast Optical 96-Well Reaction Plate, Applied Biosystems,
Thermofisher Scientific, Waltham, USA). A non-template control water sample was
added to the plate. For each measurement a 1:4 dilution series was included as a standard
for quantification of the result. Every measurement was carried out in duplicates, so each
sample was loaded twice on the plate. For each sample, the mean of the two duplicates
was calculated. All pipetting was performed using sterile tips. After loading of the
samples, the reaction plate was sealed with an optical adhesive film, briefly spun-down

4. Material and Methods
111
and mixed by using a plate mixer. The qPCR reaction was carried out on a StepOne Plus
real-time PCR system (Applied Biosystems, Thermofisher Scientific, Waltham, USA).
For quality control of each run, a melt curve analysis was performed afterward. Additional
quality control parameters were the coefficient of determination of the linear regression
of the standard curve and the efficiency of the PCR reaction. Measurements with an
efficiency < 95 % or > 105 % were discarded.
Table 4: qPCR primers.
Name Primer
type
Primer sequence Chr Chromoso
mal region
Organism Ref
Arm cohesin
low
Forward GCCAAATCAAAC
AAGGTCAC
VI HXT10 S. cerevisiae
Reverse TTGCAGTGACTGG
ATAACGA
S. cerevisiae
Arm cohesin
peak
Forward CGTAACGCAGGG
TTTAGAGG
VI MET10-
SMC2
S. cerevisiae Gruber et
al.,
(2006)
Reverse ATACATAGGCGC
TGGTCGAA
S. cerevisiae Gruber et
al.,
(2006)
Pericentromeric
cohesin
Forward GTAGGCAAGATC
CAAAGAAGCAC
VI RPN11-
SAD1
S. cerevisiae
Reverse TTAATTGCCACTG
AATTAACACCCG
S. cerevisiae
Centromeric
cohesin
Forward ACGAACTTAAGG
CCGCAGTA
VI CEN6 S. cerevisiae Gruber et
al.,
(2006)
Reverse CTTCGACAGGTTC
CATAACG
S. cerevisiae Gruber et
al.,
(2006)
Scc1 site Forward CTCAACAAAGTT
GCCTAACTCG
I CEN0a+13
kbp
C. glabrata
Reverse CCGATCATGAAA
GCAGAGTG
I C. glabrata
After passing the quality control, the IP / WCE enrichment was calculated by correcting
the mean of the measured duplicates for the dilution factor and the volume of the IP or
WCE sample, respectively, and calculation of the ratio. qPCR primes for a new locus

4. Material and Methods
112
were established by testing a minimum of 4 primer combinations, using a standard
dilution series with seven different concentrations. To be considered a suitable primer
pair for qPCR the following criteria had to be met: PCR efficiency > 95 % and < 105 %,
R2 >99 %. The melt curve must show only one distinct peak. No amplification must occur
in the NTC, which could otherwise indicate self-priming.
Next-generation sequencing
The sequencing library preparation was performed, using the Ovation Ultralow Library
Systems Kit, NuGEN, San Carlos, USA. Sequencing was performed either on an Illumina
HiSeq3000 platform, generating eight million reads per sample, with a read length of 150
bp, using a single-end protocol or on an Ion Proton System. Library preparation and
sequencing was performed by the Max Planck Genome Center Cologne or by the Kim
Nasmyth Group, Department of Biochemistry, Oxford University.
Bioinformatics
Short-read mapping
Mapping of short reads obtained by sequencing of the ChIP-Seq libraries was performed
using the web-based platform Galaxy (https://usegalaxy.org/). First, the quality control
was performed, using the module FastQC. Subsequently, the alignment of the reads to the
reference genomes was performed using the short-read aligner module Bowtie2. The C.
glabrata genome was retrieved using the Candida genome database
(http://www.candidagenome.org/). Mapping was performed in two rounds. First, all reads
were mapped against the calibration and the experimental genome, whereas all
unassigned reads were saved in a separate file. These unaligned reads were mapped in a
second round against the other genome, generating a set of mapped reads, which are
unique for the respective genome. The statistics of these mapping procedures were used
to subsequently calibrated the obtained profiles. The retrieved SAM files were converted
to Bam files using the module SAMTools. The ChIP-Seq profiles were visualized using
the Integrated Genome Browser (IGB) (http://bioviz.org/igb/) (Freese et al., 2016).

4. Material and Methods
113
Calibration of ChIP-Seq profiles
The calibration of ChIP-Seq profiles was performed as described in Hu et al. (2015).
Briefly, the occupancy ratio (ORi) is calculated as ORi = (WCi * IPXi ) / (WXi * IPCi),
whereas WCi denotes the number of reads unique to the calibration genome in sample i,
WXi denotes the number of reads unique to the experimental genome in sample i, IPXi
denotes the number of reads assigned to the experimental genome in the IP fraction of
sample i and IPCi denotes the number of reads assigned to the calibration genome in the
IP fraction of sample i. ORi is dimensionless and can be used to calculate the coefficient
for calibration of the ChIP-Seq profiles. The coefficient is calculated by dividing the ORi
by the number of unique reads assigned to the experimental genome of sample i, followed
by multiplication with the density data associated with each base.
calChIP-Seq quantification
For quantification, we converted the calibrated ChIP-Seq data into text files containing
the signal intensity for each base pair. We did this for all samples and all chromosomes.
We then summed-up the signal intensity of all base pairs comprising the region of interest
in the respective control sample, experimental sample, and untagged sample. This step is
identical to integrating the ChIP-Seq profiles over the region of interest. Next, the signal
sum of the region of interest of the control and experimental samples were subtracted
from the signal sum of the same region in the untagged sample, to correct for artificial
signal enrichment. Finally, we normalized the signal sum of each data point (each region
of interest in each time point and each chromosome) to the highest signal value in the
respective data set, to make the data comparable to other experimental data.
Antibodies
Table 5: Antibodies.
Indirect-immunofluorescence
Primary antibodies
Anti-Tub1, rat, monoclonal, MCA78S (spindles) Bio-Rad AbD Serotec, Munich, Germany
Anti-Tub4-C-6, rabbit, polyclonal (spindle pole
bodies) (Matos et al., 2008)
Zachariae Lab

4. Material and Methods
114
Anti-Human influenza hemagglutinin (HA),
mouse, monoclonal, 12CA5
Zachariae Lab
Anti-c-myc, mouse, monoclonal, 9E10 Zachariae Lab
Secondary antibodies
Alexa-Fluor 488 donkey anti-rat IgG, 2 mg/ml Life technologies, Eugene, USA
Alexa-Fluor 488 goat anti-rabbit IgG, 2 mg/ml Life technologies, Eugene, USA
Goat pAb to Ms IgG Cy3, 0.5 mg/ml Abcam, Cambridge, UK
Goat pAb to Ms IgG Cy5, 0.5 mg/ml Abcam, Cambridge, UK
ChIP
Anti-Human influenza hemagglutinin (HA), rat,
monoclonal, 3F10
Roche Diagnostics, Mannheim, Germany
Anti-Human influenza hemagglutinin (HA),
mouse, monoclonal, 12CA5
Zachariae Lab
Anti-c-myc, mouse, monoclonal, 9E11 Zachariae Lab
Anti V5-Tag, mouse, monoclonal, MCA1360G Bio-Rad AbD Serotec, Munich, Germany
Western blotting
Anti-Rec8 serum, rabbit polyclonal, rabbit SA
4958 (Petronczki et al., 2006)
Zachariae Lab
Anti-Pgk1 mouse monoclonal, 1 mg/ml Invitrogen, Carlsbad, USA
Anti-Dbf4-C rabbit polyclonal, rabbit C92C
(Matos et al., 2008)
Zachariae Lab
List of strains
Strain Relevant genotype
21931 MATa/MATalpha nap1::KanMx4 vps75::KanMx4 his3::HIS3p-GFP-TUB1-
HIS3 leu2::URA3p-tetR-tdTomato::LEU2 ura3/ura3::tetOx224-URA3
21937 MATa/MATalpha his3::HIS3p-GFP-TUB1-HIS3 leu2::URA3p-tetR-
tdTomato::LEU2 ura3/ura3::tetOx224-URA3
25601 MATa/MATalpha cdc20::CLB2p-CDC20::HphMX4 ura3:CUP1p-CDC20-
URA3 HRR25-HIS3::hrr25-KanMX4 REC8ha3-LEU2::rec8::KanMX4
29040 MATa/MATalpha cdc20::CLB2p-CDC20::HphMX6 trp1::CUP1p-CDC20-
TRP1 REC8ha3-URA3

4. Material and Methods
115
29041 MATa/MATalpha cdc20::CLB2p-CDC20::HphMX6 trp1::CUP1p-CDC20-
TRP1 sgo1::SCC1p-SGO1-KanMX4 REC8ha3-URA3
29042 MATa/MATalpha cdc20::CLB2p-CDC20::HphMX6 trp1::CUP1p-CDC20-
TRP1
29398 MATa/MATalpha cdc20::CLB2p-CDC20::HphMX6 trp1::CUP1p-CDC20-
TRP1 REC8ha3-URA3
29399 MATa/MATalpha cdc20::CLB2p-CDC20::HphMX6 trp1::CUP1p-CDC20-
TRP1
29565 MATa/MATalpha SGO1ha3::KlTRP1 cdc20::CLB2p-CDC20::HphMX4
trp1::CUP1p-CDC20-TRP1
30038 MATa/MATalpha spo11::HIS3MX6 SGO1ha3::KlTRP1 cdc20::CLB2p-
CDC20::HphMX4
30040 MATa/MATalpha rec8::KanMX4 spo11::HIS3MX6 SGO1ha3::KlTRP1
cdc20::CLB2p-CDC20::HphMX4
30041 MATa/MATalpha rec8::KanMX4 spo11::HIS3MX6 cdc20::CLB2p-
CDC20::HphMX4
30268 MATa/MATalpha SGO1ha3::KlTRP1 cdc20::CLB2p-CDC20::HphMX4
30270 MATa/MATalpha SGO1ha3::KlTRP1 cdc5::SCC1p-CDC5-KanMX4
cdc20::CLB2p-CDC20::HphMX4
30274 MATa/MATalpha cdc20::CLB2p-CDC20::HphMX4
30275 MATa/MATalpha SGO1ha3::KlTRP1 rts1::NatMX4 cdc20::CLB2p-
CDC20::HphMX4
30276 MATa/MATalpha SGO1ha3::KlTRP1 cdc5::SCC1p-CDC5-KanMX4
rts1::NatMX4 cdc20::CLB2p-CDC20::HphMX4
30543 MATa/MATalpha cdc20::CLB2p-CDC20::HphMX4 ura3:CUP1p-CDC20-
URA3 Hrr25-HIS3::hrr25-KanMX4 REC8ha3-LEU2::rec8::KanMX4
30544 MATa/MATalpha cdc20::CLB2p-CDC20::HphMX4 ura3:CUP1p-CDC20-
URA3 hrr25-as-HIS3::hrr25-KanMX4 REC8ha3-LEU2::rec8::KanMX4

4. Material and Methods
116
30545 MATa/MATalpha cdc20::CLB2p-CDC20::HphMX4 ura3:CUP1p-CDC20-
URA3 HRR25-HIS3::hrr25-KanMX4
30904 MATa/MATalpha SGO1ha3::KlTRP1 cdc20::CLB2p-CDC20::HphMX4
30905 MATa/MATalpha spo11::HIS3MX6 SGO1ha3::KlTRP1 cdc20::CLB2p-
CDC20::HphMX4
30906 MATa/MATalpha SGO1ha3::KlTRP1 bub1Δ::KIURA3 cdc20::CLB2p-
CDC20::HphMX4
30909 MATa/MATalpha SGO1ha3::KlTRP1 bub1Δ::KIURA3 cdc20::CLB2p-
CDC20::HphMX4 rec8::KanMX4 spo11::HIS3MX6
30910 MATa/MATalpha cdc20::CLB2p-CDC20::HphMX4
31309 MATa/MATalpha cdc20::CLB2p-CDC20::KanMX6 REC8ha3-URA3
31311 MATa/MATalpha REC8ha3-URA3 cdc20::CLB2p-CDC20::KanMX6
cdc5::SCC1p-CDC5-KanMX4
31313 MATa/MATalpha spo11::HIS3MX6 SGO1ha3::KlTRP1 cdc20::CLB2p-
CDC20::HphMX4
31314 MATa/MATalpha spo11::HIS3MX6 SGO1ha3::KlTRP1 cdc20::CLB2p-
CDC20::HphMX4 scc4m35-HIS3
31316 MATa/MATalpha spo11::HIS3MX6 cdc20::CLB2p-CDC20::HphMX4
32338 MATa/MATslpha Rec8-AID-9myc::HygroNT cdc20::CLB2p-
CDC20::KanMX6 spo11::HIS3MX6 SGO1ha3::KlTRP1
32339 MATa/MATalpha pCUP1-1-OsTIR1-9Myc-URA3 Rec8-AID-9myc::HygroNT
cdc20::CLB2p-CDC20::KanMX6 spo11::HIS3MX6 SGO1ha3::KlTRP1
32340 MATa/MATalpha Rec8-AID-9myc::HygroNT cdc20::CLB2p-
CDC20::KanMX6 spo11::HIS3MX6

5. Contributions
117
5. Contributions
Several experiments presented in this thesis were performed with the help of other
members of the Zachariae lab or in collaboration with the Kim Nasmyth Lab, Oxford
University, UK. I would like to thank all the people involved and list their contributions.
Oleksi Lysak, Zachariae Lab, MPI of Biochemistry, Martinsried helped to perform the
experiment shown in Figure 42, by preparing TCA extracts and running the western-blot.
Dr. Naomi Petela, Kim Nasmyth Lab, Oxford University, UK, performed the sequencing
library preparation, operated the sequencer and mapped the obtained reads for the
experiments presented in .Figure 17, Figure 23, Figure 36, Figure 45, Figure 49, Figure
50, Figure 51.

6. Acknowledgements
118
6. Acknowledgements
Many thanks to my supervisor, Dr. Wolfgang Zachariae, for accepting me as PhD Student
in his lab and for supervising my work.
I would like to thank Prof. Dr. Marc Bramkamp for taking the effort of being the first
referee and Prof. Dr. Peter Becker for being the co-referee of this work.
I would like to express my sincere gratitude to Prof. Dr. Marc Bramkamp, Prof. Dr.
Stephan Gruber and Dr. Franz Herzog for being members of my Thesis Advisory
Committee and for their advice and guidance.
Thanks to all other members of the Zachariae lab and all collaborators. My special thanks
go to Dr. Naomi Petela, Kim Nasmyth Lab, Oxford University.
Many thanks to Dr. Assa Yeroslaviz of the MPI Core Facility, who was indispensable for
setting-up the calibrated ChIP-Seq workflow.
Last but not least, I would like to express my special gratitude to Isabella Mathes, our lab
technician, who was always very helpful and very dedicated to her work.

7. References
119
7. References
Bausch, C., Noone, S., Henry, J.M., Gaudenz, K., Sanderson, B., Seidel, C., and Gerton,
J.L. (2007). Transcription Alters Chromosomal Locations of Cohesin in Saccharomyces
cerevisiae. Mol. Cell. Biol. 27, 8522–8532.
Bergerat, A., Massy, B. de, Gadelle, D., Varoutas, P.-C., Nicolas, A., and Forterre, P.
(1997). An atypical topoisomerase II from archaea with implications for meiotic
recombination. Nature 386, 414.
Berod, A., Hartman, B.K., and Pujol, J.F. (1981). Importance of fixation in
immunohistochemistry: use of formaldehyde solutions at variable pH for the localization
of tyrosine hydroxylase. J. Histochem. Cytochem. 29, 844–850.
Bishop, A.C., Ubersax, J.A., Petsch, D.T., Matheos, D.P., Gray, N.S., Blethrow, J.,
Shimizu, E., Tsien, J.Z., Schultz, P.G., Rose, M.D., et al. (2000). A chemical switch for
inhibitor-sensitive alleles of any protein kinase. Nature 407, 395–401.
Blat, Y., and Kleckner, N. (1999). Cohesins Bind to Preferential Sites along Yeast
Chromosome III, with Differential Regulation along Arms versus the Centric Region.
Cell 98, 249–259.
Borrie, M.S., Campor, J.S., Joshi, H., and Gartenberg, M.R. (2017). Binding, sliding, and
function of cohesin during transcriptional activation. PNAS 114, E1062–E1071.
Bortz, P.D.S., and Wamhoff, B.R. (2011). Chromatin Immunoprecipitation (ChIP):
Revisiting the Efficacy of Sample Preparation, Sonication, Quantification of Sheared
DNA, and Analysis via PCR. PLOS ONE 6, e26015.
Brar, G.A., Kiburz, B.M., Zhang, Y., Kim, J.-E., White, F., and Amon, A. (2006). Rec8
phosphorylation and recombination promote the step-wise loss of cohesins in meiosis.
Nature 441, nature04794.
Buonomo, S.B.C., Clyne, R.K., Fuchs, J., Loidl, J., Uhlmann, F., and Nasmyth, K. (2000).
Disjunction of Homologous Chromosomes in Meiosis I Depends on Proteolytic Cleavage
of the Meiotic Cohesin Rec8 by Separin. Cell 103, 387–398.
Buonomo, S.B.C., Rabitsch, K.P., Fuchs, J., Gruber, S., Sullivan, M., Uhlmann, F.,
Petronczki, M., Tóth, A., and Nasmyth, K. (2003). Division of the Nucleolus and Its

7. References
120
Release of CDC14 during Anaphase of Meiosis I Depends on Separase, SPO12, and
SLK19. Developmental Cell 4, 727–739.
Chambon, J.-P., Touati, S.A., Berneau, S., Cladière, D., Hebras, C., Groeme, R.,
McDougall, A., and Wassmann, K. (2013). The PP2A Inhibitor I2PP2A Is Essential for
Sister Chromatid Segregation in Oocyte Meiosis II. Current Biology 23, 485–490.
Chiang, T., Duncan, F.E., Schindler, K., Schultz, R.M., and Lampson, M.A. (2010).
Evidence that Weakened Centromere Cohesion Is a Leading Cause of Age-Related
Aneuploidy in Oocytes. Current Biology 20, 1522–1528.
Chu, S., DeRisi, J., Eisen, M., Mulholland, J., Botstein, D., Brown, P.O., and Herskowitz,
I. (1998). The transcriptional program of sporulation in budding yeast. Science 282, 699–
705.
Ciosk, R., Shirayama, M., Shevchenko, A., Tanaka, T., Toth, A., Shevchenko, A., and
Nasmyth, K. (2000). Cohesin’s Binding to Chromosomes Depends on a Separate
Complex Consisting of Scc2 and Scc4 Proteins. Molecular Cell 5, 243–254.
Clarke, A.S., Tang, T.T.-L., Ooi, D.L.-Y., and Orr-Weaver, T.L. (2005). POLO Kinase
Regulates the Drosophila Centromere Cohesion Protein MEI-S332. Developmental Cell
8, 53–64.
Clift, D., and Marston, A.L. (2011). The Role of Shugoshin in Meiotic Chromosome
Segregation. Cytogenet Genome Res 133, 234–242.
Darwiche, N., Freeman, L.A., and Strunnikov, A. (1999). Characterization of the
components of the putative mammalian sister chromatid cohesion complex. Gene 233,
39–47.
Dobie, K.W., Kennedy, C.D., Velasco, V.M., McGrath, T.L., Weko, J., Patterson, R.W.,
and Karpen, G.H. (2001). Identification of Chromosome Inheritance Modifiers in
Drosophila melanogaster. Genetics 157, 1623–1637.
Freese, N.H., Norris, D.C., and Loraine, A.E. (2016). Integrated genome browser: visual
analytics platform for genomics. Bioinformatics 32, 2089–2095.
Gandhi, R., Gillespie, P.J., and Hirano, T. (2006). Human Wapl Is a Cohesin-Binding
Protein that Promotes Sister-Chromatid Resolution in Mitotic Prophase. Current Biology
16, 2406–2417.

7. References
121
Gietz, D., St Jean, A., Woods, R.A., and Schiestl, R.H. (1992). Improved method for high
efficiency transformation of intact yeast cells. Nucleic Acids Res 20, 1425.
Gillespie, P.J., and Hirano, T. (2004). Scc2 Couples Replication Licensing to Sister
Chromatid Cohesion in Xenopus Egg Extracts. Current Biology 14, 1598–1603.
Goldstein, A.L., and McCusker, J.H. (1999). Three new dominant drug resistance
cassettes for gene disruption in Saccharomyces cerevisiae. Yeast 15, 1541–1553.
Gómez, R., Valdeolmillos, A., Parra, M.T., Viera, A., Carreiro, C., Roncal, F., Rufas,
J.S., Barbero, J.L., and Suja, J.A. (2007). Mammalian SGO2 appears at the inner
centromere domain and redistributes depending on tension across centromeres during
meiosis II and mitosis. EMBO Rep 8, 173–180.
Grömping, U. (2014). R Package FrF2 for Creating and Analyzing Fractional Factorial
2-Level Designs. Journal of Statistical Software; Vol 56 (2014).
Gruber, S., Haering, C.H., and Nasmyth, K. (2003). Chromosomal Cohesin Forms a Ring.
Cell 112, 765–777.
Gruber, S., Arumugam, P., Katou, Y., Kuglitsch, D., Helmhart, W., Shirahige, K., and
Nasmyth, K. (2006). Evidence that Loading of Cohesin Onto Chromosomes Involves
Opening of Its SMC Hinge. Cell 127, 523–537.
Guacci, V., Koshland, D., and Strunnikov, A. (1997). A Direct Link between Sister
Chromatid Cohesion and Chromosome Condensation Revealed through the Analysis of
MCD1 in S. cerevisiae. Cell 91, 47–57.
Gullerova, M., and Proudfoot, N.J. (2008). Cohesin Complex Promotes Transcriptional
Termination between Convergent Genes in S. pombe. Cell 132, 983–995.
Haering, C.H., and Gruber, S. (2016). SnapShot: SMC Protein Complexes Part I. Cell
164, 326-326.e1.
Haering, C.H., Löwe, J., Hochwagen, A., and Nasmyth, K. (2002). Molecular
Architecture of SMC Proteins and the Yeast Cohesin Complex. Molecular Cell 9, 773–
788.
Haering, C.H., Farcas, A.-M., Arumugam, P., Metson, J., and Nasmyth, K. (2008). The
cohesin ring concatenates sister DNA molecules. Nature 454, nature07098.

7. References
122
Hamant, O., Golubovskaya, I., Meeley, R., Fiume, E., Timofejeva, L., Schleiffer, A.,
Nasmyth, K., and Cande, W.Z. (2005). A REC8-Dependent Plant Shugoshin Is Required
for Maintenance of Centromeric Cohesion during Meiosis and Has No Mitotic Functions.
Current Biology 15, 948–954.
Head, S.R., Komori, H.K., LaMere, S.A., Whisenant, T., Van Nieuwerburgh, F.,
Salomon, D.R., and Ordoukhanian, P. (2014). Library construction for next-generation
sequencing: Overviews and challenges. Biotechniques 56, 61-passim.
Herbert, M., Kalleas, D., Cooney, D., Lamb, M., and Lister, L. (2015). Meiosis and
Maternal Aging: Insights from Aneuploid Oocytes and Trisomy Births. Cold Spring Harb
Perspect Biol 7.
Hinshaw, S.M., Makrantoni, V., Kerr, A., Marston, A.L., and Harrison, S.C. (2015).
Structural evidence for Scc4-dependent localization of cohesin loading. ELife 4, e06057.
Hinshaw, S.M., Makrantoni, V., Harrison, S.C., and Marston, A.L. (2017). The
Kinetochore Receptor for the Cohesin Loading Complex. Cell 171, 72-84.e13.
Holland, A.J., Fachinetti, D., Han, J.S., and Cleveland, D.W. (2012). Inducible, reversible
system for the rapid and complete degradation of proteins in mammalian cells. PNAS
109, E3350–E3357.
Horsfield, J.A., Anagnostou, S.H., Hu, J.K.-H., Cho, K.H.Y., Geisler, R., Lieschke, G.,
Crosier, K.E., and Crosier, P.S. (2007). Cohesin-dependent regulation of Runx genes.
Development 134, 2639–2649.
Hu, B., Itoh, T., Mishra, A., Katoh, Y., Chan, K.-L., Upcher, W., Godlee, C., Roig, M.B.,
Shirahige, K., and Nasmyth, K. (2011). ATP Hydrolysis Is Required for Relocating
Cohesin from Sites Occupied by Its Scc2/4 Loading Complex. Curr Biol 21, 12–24.
Hu, B., Petela, N., Kurze, A., Chan, K.-L., Chapard, C., and Nasmyth, K. (2015).
Biological chromodynamics: a general method for measuring protein occupancy across
the genome by calibrating ChIP-seq. Nucleic Acids Res 43, e132.
Huang, H., Feng, J., Famulski, J., Rattner, J.B., Liu, S.T., Kao, G.D., Muschel, R., Chan,
G.K.T., and Yen, T.J. (2007). Tripin/hSgo2 recruits MCAK to the inner centromere to
correct defective kinetochore attachments. J Cell Biol 177, 413–424.

7. References
123
Ishiguro, T., Tanaka, K., Sakuno, T., and Watanabe, Y. (2010). Shugoshin–PP2A
counteracts casein-kinase-1-dependent cleavage of Rec8 by separase. Nature Cell
Biology 12, 500–506.
Ito, H., Fukuda, Y., Murata, K., and Kimura, A. (1983). Transformation of intact yeast
cells treated with alkali cations. J. Bacteriol. 153, 163–168.
Kanke, M., Nishimura, K., Kanemaki, M., Kakimoto, T., Takahashi, T.S., Nakagawa, T.,
and Masukata, H. (2011). Auxin-inducible protein depletion system in fission yeast. BMC
Cell Biology 12, 8.
Katis, V.L., Galova, M., Rabitsch, K.P., Gregan, J., and Nasmyth, K. (2004).
Maintenance of Cohesin at Centromeres after Meiosis I in Budding Yeast Requires a
Kinetochore-Associated Protein Related to MEI-S332. Current Biology 14, 560–572.
Katis, V.L., Lipp, J.J., Imre, R., Bogdanova, A., Okaz, E., Habermann, B., Mechtler, K.,
Nasmyth, K., and Zachariae, W. (2010). Rec8 Phosphorylation by Casein Kinase 1 and
Cdc7-Dbf4 Kinase Regulates Cohesin Cleavage by Separase during Meiosis.
Developmental Cell 18, 397–409.
Kawashima, S.A., Tsukahara, T., Langegger, M., Hauf, S., Kitajima, T.S., and Watanabe,
Y. (2007). Shugoshin enables tension-generating attachment of kinetochores by loading
Aurora to centromeres. Genes Dev. 21, 420–435.
Kawashima, S.A., Yamagishi, Y., Honda, T., Ishiguro, K., and Watanabe, Y. (2010).
Phosphorylation of H2A by Bub1 Prevents Chromosomal Instability Through Localizing
Shugoshin. Science 327, 172–177.
Keeney, S., Giroux, C.N., and Kleckner, N. (1997). Meiosis-Specific DNA Double-
Strand Breaks Are Catalyzed by Spo11, a Member of a Widely Conserved Protein Family.
Cell 88, 375–384.
Kerrebrock, A.W., Moore, D.P., Wu, J.S., and Orr-Weaver, T.L. (1995). Mei-S332, a
drosophila protein required for sister-chromatid cohesion, can localize to meiotic
centromere regions. Cell 83, 247–256.
Kiburz, B.M., Reynolds, D.B., Megee, P.C., Marston, A.L., Lee, B.H., Lee, T.I., Levine,
S.S., Young, R.A., and Amon, A. (2005). The core centromere and Sgo1 establish a 50-
kb cohesin-protected domain around centromeres during meiosis I. Genes Dev 19, 3017–
3030.

7. References
124
Kitajima, T.S., Kawashima, S.A., and Watanabe, Y. (2004). The conserved kinetochore
protein shugoshin protects centromeric cohesion during meiosis. Nature 427, 510–517.
Kitajima, T.S., Hauf, S., Ohsugi, M., Yamamoto, T., and Watanabe, Y. (2005). Human
Bub1 Defines the Persistent Cohesion Site along the Mitotic Chromosome by Affecting
Shugoshin Localization. Current Biology 15, 353–359.
Kitajima, T.S., Sakuno, T., Ishiguro, K., Iemura, S., Natsume, T., Kawashima, S.A., and
Watanabe, Y. (2006). Shugoshin collaborates with protein phosphatase 2A to protect
cohesin. Nature 441, 46–52.
Klein, F., Mahr, P., Galova, M., Buonomo, S.B.C., Michaelis, C., Nairz, K., and Nasmyth,
K. (1999). A Central Role for Cohesins in Sister Chromatid Cohesion, Formation of Axial
Elements, and Recombination during Yeast Meiosis. Cell 98, 91–103.
Kogut, I., Wang, J., Guacci, V., Mistry, R.K., and Megee, P.C. (2009). The Scc2/Scc4
cohesin loader determines the distribution of cohesin on budding yeast chromosomes.
Genes Dev 23, 2345–2357.
Kugou, K., and Ohta, K. (2009). Genome-Wide High-Resolution Chromatin
Immunoprecipitation of Meiotic Chromosomal Proteins in Saccharomyces cerevisiae. In
Meiosis, (Humana Press), pp. 285–304.
Kuliev, A., Cieslak, J., and Verlinsky, Y. (2005). Frequency and distribution of
chromosome abnormalities in human oocytes. CGR 111, 193–198.
Lee, J., Kitajima, T.S., Tanno, Y., Yoshida, K., Morita, T., Miyano, T., Miyake, M., and
Watanabe, Y. (2008). Unified mode of centromeric protection by shugoshin in
mammalian oocytes and somatic cells. Nat. Cell Biol. 10, 42–52.
Lee, J.Y., Dej, K.J., Lopez, J.M., and Orr-Weaver, T.L. (2004). Control of Centromere
Localization of the MEI-S332 Cohesion Protection Protein. Current Biology 14, 1277–
1283.
Lengronne, A., Katou, Y., Mori, S., Yokobayashi, S., Kelly, G.P., Itoh, T., Watanabe, Y.,
Shirahige, K., and Uhlmann, F. (2004). Cohesin relocation from sites of chromosomal
loading to places of convergent transcription. Nature 430, 573–578.
Lengronne, A., McIntyre, J., Katou, Y., Kanoh, Y., Hopfner, K.-P., Shirahige, K., and
Uhlmann, F. (2006). Establishment of Sister Chromatid Cohesion at the S. cerevisiae
Replication Fork. Molecular Cell 23, 787–799.

7. References
125
Lister, L.M., Kouznetsova, A., Hyslop, L.A., Kalleas, D., Pace, S.L., Barel, J.C., Nathan,
A., Floros, V., Adelfalk, C., Watanabe, Y., et al. (2010). Age-Related Meiotic
Segregation Errors in Mammalian Oocytes Are Preceded by Depletion of Cohesin and
Sgo2. Current Biology 20, 1511–1521.
Liu, H., Jia, L., and Yu, H. (2013a). Phospho-H2A and Cohesin Specify Distinct Tension-
Regulated Sgo1 Pools at Kinetochores and Inner Centromeres. Current Biology 23, 1927–
1933.
Liu, H., Rankin, S., and Yu, H. (2013b). Phosphorylation-enabled binding of SGO1–
PP2A to cohesin protects sororin and centromeric cohesion during mitosis. Nature Cell
Biology 15, 40–49.
Lopez-Serra, L., Lengronne, A., Borges, V., Kelly, G., and Uhlmann, F. (2013). Budding
Yeast Wapl Controls Sister Chromatid Cohesion Maintenance and Chromosome
Condensation. Current Biology 23, 64–69.
Lopez-Serra, L., Kelly, G., Patel, H., Stewart, A., and Uhlmann, F. (2014). The Scc2–
Scc4 complex acts in sister chromatid cohesion and transcriptional regulation by
maintaining nucleosome-free regions. Nature Genetics 46, 1147.
Marston, A.L., Lee, B.H., and Amon, A. (2003). The Cdc14 Phosphatase and the FEAR
Network Control Meiotic Spindle Disassembly and Chromosome Segregation.
Developmental Cell 4, 711–726.
Marston, A.L., Tham, W.-H., Shah, H., and Amon, A. (2004). A Genome-Wide Screen
Identifies Genes Required for Centromeric Cohesion. Science 303, 1367–1370.
Martin, R.H., and Rademaker, A. (1990). The frequency of aneuploidy among individual
chromosomes in 6,821 human sperm chromosome complements. Cytogenet. Cell Genet.
53, 103–107.
Matos, J., Lipp, J.J., Bogdanova, A., Guillot, S., Okaz, E., Junqueira, M., Shevchenko,
A., and Zachariae, W. (2008). Dbf4-Dependent Cdc7 Kinase Links DNA Replication to
the Segregation of Homologous Chromosomes in Meiosis I. Cell 135, 662–678.
Melby, T.E., Ciampaglio, C.N., Briscoe, G., and Erickson, H.P. (1998). The Symmetrical
Structure of Structural Maintenance of Chromosomes (SMC) and MukB Proteins: Long,
Antiparallel Coiled Coils, Folded at a Flexible Hinge. The Journal of Cell Biology 142,
1595–1604.

7. References
126
Michaelis, C., Ciosk, R., and Nasmyth, K. (1997). Cohesins: Chromosomal Proteins that
Prevent Premature Separation of Sister Chromatids. Cell 91, 35–45.
Misulovin, Z., Schwartz, Y.B., Li, X.-Y., Kahn, T.G., Gause, M., MacArthur, S., Fay,
J.C., Eisen, M.B., Pirrotta, V., Biggin, M.D., et al. (2008). Association of cohesin and
Nipped-B with transcriptionally active regions of the Drosophila melanogaster genome.
Chromosoma 117, 89–102.
Molnar, M., Bähler, J., Sipiczki, M., and Kohli, J. (1995). The rec8 gene of
Schizosaccharomyces pombe is involved in linear element formation, chromosome
pairing and sister-chromatid cohesion during meiosis. Genetics 141, 61–73.
Nakajima, Y., Tyers, R.G., Wong, C.C.L., Yates, J.R., Drubin, D.G., and Barnes, G.
(2009). Nbl1p: A Borealin/Dasra/CSC-1-like Protein Essential for Aurora/Ipl1 Complex
Function and Integrity in Saccharomyces cerevisiae. Mol. Biol. Cell 20, 1772–1784.
Nasmyth, K., and Haering, C.H. (2009). Cohesin: Its Roles and Mechanisms. Annual
Review of Genetics 43, 525–558.
Natsume, T., Müller, C.A., Katou, Y., Retkute, R., Gierliński, M., Araki, H., Blow, J.J.,
Shirahige, K., Nieduszynski, C.A., and Tanaka, T.U. (2013). Kinetochores Coordinate
Pericentromeric Cohesion and Early DNA Replication by Cdc7-Dbf4 Kinase
Recruitment. Molecular Cell 50, 661–674.
Nishimura, K., Fukagawa, T., Takisawa, H., Kakimoto, T., and Kanemaki, M. (2009). An
auxin-based degron system for the rapid depletion of proteins in nonplant cells. Nat Meth
6, 917–922.
Ocampo-Hafalla, M.T., and Uhlmann, F. (2011). Cohesin loading and sliding. J Cell Sci
124, 685–691.
Ocampo-Hafalla, M., Muñoz, S., Samora, C.P., and Uhlmann, F. (2016). Evidence for
cohesin sliding along budding yeast chromosomes. Open Biology 6, 150178.
Oelschlaegel, T., Schwickart, M., Matos, J., Bogdanova, A., Camasses, A., Havlis, J.,
Shevchenko, A., and Zachariae, W. (2005). The Yeast APC/C Subunit Mnd2 Prevents
Premature Sister Chromatid Separation Triggered by the Meiosis-Specific APC/C-Ama1.
Cell 120, 773–788.

7. References
127
O’Geen, H., Echipare, L., and Farnham, P.J. (2011). Using ChIP-Seq Technology to
Generate High-Resolution Profiles of Histone Modifications. In Epigenetics Protocols,
(Humana Press), pp. 265–286.
Okaz, E., Argüello-Miranda, O., Bogdanova, A., Vinod, P.K., Lipp, J.J., Markova, Z.,
Zagoriy, I., Novak, B., and Zachariae, W. (2012). Meiotic Prophase Requires Proteolysis
of M Phase Regulators Mediated by the Meiosis-Specific APC/CAma1. Cell 151, 603–
618.
Orr-Weaver, T.L. (1999). The Ties that Bind: Localization of the Sister-Chromatid
Cohesin Complex on Yeast Chromosomes. Cell 99, 1–4.
Park, P.J. (2009). ChIP–seq: advantages and challenges of a maturing technology. Nat
Rev Genet 10, 669–680.
Pauli, A., van Bemmel, J.G., Oliveira, R.A., Itoh, T., Shirahige, K., van Steensel, B., and
Nasmyth, K. (2010). A Direct Role for Cohesin in Gene Regulation and Ecdysone
Response in Drosophila Salivary Glands. Current Biology 20, 1787–1798.
Petronczki, M., Siomos, M.F., and Nasmyth, K. (2003). Un Ménage à Quatre: The
Molecular Biology of Chromosome Segregation in Meiosis. Cell 112, 423–440.
Petronczki, M., Matos, J., Mori, S., Gregan, J., Bogdanova, A., Schwickart, M., Mechtler,
K., Shirahige, K., Zachariae, W., and Nasmyth, K. (2006). Monopolar Attachment of
Sister Kinetochores at Meiosis I Requires Casein Kinase 1. Cell 126, 1049–1064.
Rabitsch, K.P., Petronczki, M., Javerzat, J.-P., Genier, S., Chwalla, B., Schleiffer, A.,
Tanaka, T.U., and Nasmyth, K. (2003). Kinetochore Recruitment of Two Nucleolar
Proteins Is Required for Homolog Segregation in Meiosis I. Developmental Cell 4, 535–
548.
Rabitsch, K.P., Gregan, J., Schleiffer, A., Javerzat, J.-P., Eisenhaber, F., and Nasmyth, K.
(2004). Two Fission Yeast Homologs of Drosophila Mei-S332 Are Required for
Chromosome Segregation during Meiosis I and II. Current Biology 14, 287–301.
Rankin, S. (2015). Complex elaboration: making sense of meiotic cohesin dynamics.
FEBS J 282, 2426–2443.
Resnick, T.D., Satinover, D.L., MacIsaac, F., Stukenberg, P.T., Earnshaw, W.C., Orr-
Weaver, T.L., and Carmena, M. (2006). INCENP and Aurora B Promote Meiotic Sister

7. References
128
Chromatid Cohesion through Localization of the Shugoshin MEI-S332 in Drosophila.
Developmental Cell 11, 57–68.
Riedel, C.G., Katis, V.L., Katou, Y., Mori, S., Itoh, T., Helmhart, W., Gálová, M.,
Petronczki, M., Gregan, J., Cetin, B., et al. (2006). Protein phosphatase 2A protects
centromeric sister chromatid cohesion during meiosis I. Nature 441, 53–61.
Roberts, B.T., Farr, K.A., and Hoyt, M.A. (1994). The Saccharomyces cerevisiae
checkpoint gene BUB1 encodes a novel protein kinase. Mol. Cell. Biol. 14, 8282–8291.
Rossbach, D., and Sclafani, R.A. (2016). Role of DDK in Replication Initiation. In The
Initiation of DNA Replication in Eukaryotes, (Springer, Cham), pp. 279–296.
Ruchaud, S., Carmena, M., and Earnshaw, W.C. (2007). Chromosomal passengers:
conducting cell division. Nat Rev Mol Cell Biol 8, 798–812.
Salah, S.M., and Nasmyth, K. (2000). Destruction of the securin Pds1p occurs at the onset
of anaphase during both meiotic divisions in yeast. Chromosoma 109, 27–34.
Salic, A., Waters, J.C., and Mitchison, T.J. (2004). Vertebrate Shugoshin Links Sister
Centromere Cohesion and Kinetochore Microtubule Stability in Mitosis. Cell 118, 567–
578.
Sherman, F. (1991). Getting started with yeast. Methods Enzymol. 194, 3–21.
Sjögren, C., and Nasmyth, K. (2001). Sister chromatid cohesion is required for
postreplicative double-strand break repair in Saccharomyces cerevisiae. Current Biology
11, 991–995.
Stigler, J., Çamdere, G.Ö., Koshland, D.E., and Greene, E.C. (2016). Single-Molecule
Imaging Reveals a Collapsed Conformational State for DNA-Bound Cohesin. Cell
Reports 15, 988–998.
Sullivan, M., Hornig, N.C.D., Porstmann, T., and Uhlmann, F. (2004). Studies on
Substrate Recognition by the Budding Yeast Separase. J. Biol. Chem. 279, 1191–1196.
Sumara, I., Vorlaufer, E., Gieffers, C., Peters, B.H., and Peters, J.-M. (2000).
Characterization of Vertebrate Cohesin Complexes and Their Regulation in Prophase.
The Journal of Cell Biology 151, 749–762.

7. References
129
Sumara, I., Vorlaufer, E., Stukenberg, P.T., Kelm, O., Redemann, N., Nigg, E.A., and
Peters, J.-M. (2002). The dissociation of cohesin from chromosomes in prophase is
regulated by Polo-like kinase. Mol. Cell 9, 515–525.
Tanaka, T., Cosma, M.P., Wirth, K., and Nasmyth, K. (1999). Identification of Cohesin
Association Sites at Centromeres and along Chromosome Arms. Cell 98, 847–858.
Tanco, M., Viles, E., Ilzarbe, L., and Álvarez, M.J. (2007). Manufacturing Industries
Need Design of Experiments (DoE). Proceedings of the World Congress on Engineering.
WCE , July 2 - 4, 2007, London, U.K. Vol II.
Tang, Z., Sun, Y., Harley, S.E., Zou, H., and Yu, H. (2004). Human Bub1 protects
centromeric sister-chromatid cohesion through Shugoshin during mitosis. PNAS 101,
18012–18017.
Tang, Z., Shu, H., Qi, W., Mahmood, N.A., Mumby, M.C., and Yu, H. (2006). PP2A Is
Required for Centromeric Localization of Sgo1 and Proper Chromosome Segregation.
Developmental Cell 10, 575–585.
Tóth, A., Rabitsch, K.P., Gálová, M., Schleiffer, A., Buonomo, S.B.C., and Nasmyth, K.
(2000). Functional Genomics Identifies Monopolin: A Kinetochore Protein Required for
Segregation of Homologs during Meiosis I. Cell 103, 1155–1168.
Uhlmann, F., Lottspeich, F., and Nasmyth, K. (1999). Sister-chromatid separation at
anaphase onset is promoted by cleavage of the cohesin subunit Scc1. Nature 400, 21831.
Uhlmann, F., Wernic, D., Poupart, M.-A., Koonin, E.V., and Nasmyth, K. (2000).
Cleavage of Cohesin by the CD Clan Protease Separin Triggers Anaphase in Yeast. Cell
103, 375–386.
W Y Miyazaki, and Orr-Weaver, and T.L. (1994). Sister-Chromatid Cohesion in Mitosis
and Meiosis. Annual Review of Genetics 28, 167–187.
Wach, A., Brachat, A., Pöhlmann, R., and Philippsen, P. (1994). New heterologous
modules for classical or PCR-based gene disruptions in Saccharomyces cerevisiae. Yeast
10, 1793–1808.
Waizenegger, I.C., Hauf, S., Meinke, A., and Peters, J.-M. (2000). Two Distinct Pathways
Remove Mammalian Cohesin from Chromosome Arms in Prophase and from
Centromeres in Anaphase. Cell 103, 399–410.

7. References
130
Watanabe, Y., and Nurse, P. (1999). Cohesin Rec8 is required for reductional
chromosome segregation at meiosis. Nature 400, 461–464.
Xu, Z., Cetin, B., Anger, M., Cho, U.S., Helmhart, W., Nasmyth, K., and Xu, W. (2009).
Structure and Function of the PP2A-Shugoshin Interaction. Molecular Cell 35, 426–441.
Yamagishi, Y., Sakuno, T., Shimura, M., and Watanabe, Y. (2008). Heterochromatin
links to centromeric protection by recruiting shugoshin. Nature 455, 251–255.
Yao, Y., and Dai, W. (2012). Shugoshins function as a guardian for chromosomal stability
in nuclear division. Cell Cycle 11, 2631–2642.
Yu, H.-G., and Koshland, D. (2005). Chromosome Morphogenesis: Condensin-
Dependent Cohesin Removal during Meiosis. Cell 123, 397–407.
Zachariae, W. (2004). Destruction with a Box: Substrate Recognition by the Anaphase-
Promoting Complex. Molecular Cell 13, 2–3.
Zhang, L., Ward, J.D., Cheng, Z., and Dernburg, A.F. (2015). The auxin-inducible
degradation (AID) system enables versatile conditional protein depletion in C. elegans.
Development 142, 4374–4384.
Zuin, J., Franke, V., IJcken, W.F.J. van, Sloot, A. van der, Krantz, I.D., Reijden, M.I.J.A.
van der, Nakato, R., Lenhard, B., and Wendt, K.S. (2014). A Cohesin-Independent Role
for NIPBL at Promoters Provides Insights in CdLS. PLOS Genetics 10, e1004153.

8. Appendix
131
8. Appendix
- + Center point
tFix (min) 8 20 14
tShear (min) 20 40 30
Cell density (%) 33% 100% 67%
Power (Watts) 100 200 150
Duty factor (%) 5 15 10
cFix (%) 2 4 3
Cycles/burst 133 266 200
Buffer self-mixed TrueChIP
Sample # tFix tShear Density Power Duty cFix Cycles Buffer
1 8 20 33% 100 5 2 133 self-mixed
2 20 20 33% 100 15 4 266 self-mixed
3 8 40 33% 100 15 4 133 TrueChIP
4 20 40 33% 100 5 2 266 TrueChIP
5 8 20 100% 100 15 2 266 TrueChIP
6 20 20 100% 100 5 4 133 TrueChIP
7 8 40 100% 100 5 4 266 self-mixed
8 20 40 100% 100 15 2 133 self-mixed
9 8 20 33% 200 5 4 266 TrueChIP
10 20 20 33% 200 15 2 133 TrueChIP
11 8 40 33% 200 15 2 266 self-mixed
12 20 40 33% 200 5 4 133 self-mixed
13 8 20 100% 200 15 4 133 self-mixed
14 20 20 100% 200 5 2 266 self-mixed
15 8 40 100% 200 5 2 133 TrueChIP
16 20 40 100% 200 15 4 266 TrueChIP
17 14 30 67% 150 10 3 200 self-mixed
18 14 30 67% 150 10 3 200 self-mixed
19 14 30 67% 150 10 3 200 TrueChIP
20 14 30 67% 150 10 3 200 TrueChIP
Appendix Figure A 1: Experimental plan for a 2-level fractional factorial design with resolution IV. Upper table
shows the two values for each of the eight input factors. The lower table shows the combination of the input factor
values for each of the 16 runs and the two center points in such a way that the design matrix is orthogonal.

8. Appendix
132
Appendix Figure A 2: Experimental plan for a 2-level full factorial design. The upper table shows the two values for
each of the input factors. For this design, only four input factors were altered. The lower table shows the combination
of the input factor values for each of the 16 runs and the two center points in such a way that the design matrix is
orthogonal.
- + Center point
tShear (min) 10 30 20
c(NaCl) for IP 80 200 140
Protease inhibs 100X 100X, Comp, Pepstat
tFix (min) 5 35 20
Power (Watts ) 100 100 100
Cell density (%) 50 50 50
Cycles/burst 200 200 200
cFix (%) 3 3 3
Duty factor (%) 10 10 10
Sample # tShear c(NaCl) for IP Protease inhibs tFix
1 10 80 100X 5
2 30 80 100X 5
3 10 200 100X 5
4 30 200 100X 5
5 10 80 100X, Comp, Pepstat 5
6 30 80 100X, Comp, Pepstat 5
7 10 200 100X, Comp, Pepstat 5
8 30 200 100X, Comp, Pepstat 5
9 10 80 100X 35
10 30 80 100X 35
11 10 200 100X 35
12 30 200 100X 35
13 10 80 100X, Comp, Pepstat 35
14 30 80 100X, Comp, Pepstat 35
15 10 200 100X, Comp, Pepstat 35
16 30 200 100X, Comp, Pepstat 35
17 20 140 100X 20
18 20 140 100X 20
19 20 140 100X 20
20 20 140 100X, Comp, Pepstat 20
21 20 140 100X, Comp, Pepstat 20
22 20 140 100X, Comp, Pepstat 20

8. Appendix
133
Appendix Figure A 3: Measured values of the output factors “ChIP-qPCR” and “Shearing” after realization of the
full factorial design, comprising 16 runs and two sets of triplicates. (A) ChIP-qPCR values for 22 samples. For each
sample the values of two different loci were measured in duplicates. The y-axis denotes the enrichment in the
immunoprecipitation samples (IP) over the whole cell extract samples (WCE). Samples 1 to 16 are the experimental
runs with changing input parameter values. Samples 17 to 22 define the center points. (B) Bioanalyzer profiles of the
same 22 samples show the chromatin fragment size distributions after shearing on a Covaris water bath sonicator. The
horizontal axis on the small diagrams denotes the fragment size in base pairs.

8. Appendix
134
Appendix Figure A 4: Effect of the shearing buffer salt concentration on the chromatin fragment size distribution
after sonication. The horizontal axis on the small Bioanalyzer diagrams denotes the fragment size in base pairs.

8. Appendix
135