enhancing urban governance through public private
TRANSCRIPT

1
Enhancing Urban Governance through Public Private Partnership:A Study of Solid Waste Management in Dhaka
City
A Dissertation By
Asma Ara Begum Student ID-0827020
Submitted
to Institute of Governance Studies
BRAC University Dhaka
In Partial Fulfillment of the Requirement for the Degree of Master of Arts in Governance and Development (MAGD)
Institute of Governance Studies BRAC University, Dhaka, Bangladesh
November 2009
brought to you by COREView metadata, citation and similar papers at core.ac.uk
provided by BRAC University Institutional Repository

2
Statement of the Candidate
I hereby declare that I am the sole author of this thesis
I authorize the Institute of Governance Studies and BRAC University to lend this thesis to other Institutions or individuals for the purpose of scholarly research
I further authorize the Institute of Governance Studies and BRAC University to reproduce this thesis by photocopying or by other means, in total or in part, at the request of other Institutions for the
purpose of scholarly research.
Asma Ara Begum Student ID-0827020

3
Acknowledgement “Praise be to Allah, the Cherisher and Sustainer of the Worlds” (Al Quran, Chapter 1:2),Who have
given me the strength and ability to put and end to this difficult task, as He promised, “Verily with
every difficulty there is a relief” (Al Quran, Chapter 94:6).
I sincerely express my continuing indebtedness to Professor Dr. Rizwan Khair, my supervisor, for
his persistence in questioning and challenging me that finally shaped my ideas. His depth of
knowledge , stimulating suggestions, encouragement and affection always inspired me to my work.
Apart from the above, in several phases of my study and also during the process of writing this
thesis, I have incurred numerous debts of support. It is my pleasant responsibility here to
acknowledge indebtedness to Professor Dr. Emdadul Haque, for his administrative support and
cooperation to overcome the challenges to be faced in writing thesis.
I am grateful to my respondents for the time, patience, and attention they gave to my work.
I am extremely grateful to Dr. Tariq Bin Yousuf, Project Director ,Matuail Landfield Sanitation
Project,DCC for the time, attention, and guidance he gave to me during my field research My
sincere gratitude to my family members for their support and encouragement throughout the study.
Special acknowledgement is for my husband for his persistent but sympathetic encouragement and
emotional support for the completion of this study.
I owe a great deal to many individuals and institutions, the remaining errors and lack of judgement,
are, however, my own responsibility.

4
Table of contents
Serial Number Topic Chapter-1 Introduction
Chapter-2 Concepts, Issues. Models of SWM
Chapter-3 The Global and local Scenario of SWM
Chapter-4 SWM in Dhaka City
Chapter-5 Analysis and Conclusion

5
List of acronyms/ Abbreviations used
SWM Solid Waste Management
JICA Japan International Cooperation Agency
DCC Dhaka City Corporation
CBO Community Based Organization
PPP Public Private Partnership
WHO World Health Organization
MSW Municipal Solid waste
ISO International Standard Organization
UNEP United National Environmental Programme
LDAC Least Development Asian Countries
NGO Non Government Organization
TMG Tokoy Metropolitan Government
ASEAN Asian South East Asian Nations
CDM Clean Development Mechanism
HCE Health Center Establishment
HIV Human Immune Virus
$ United States Dollar

6
Abstract An escalating quality of life and high rates of resources consumption patterns have had an
unintended and negative impact on the urban environment generation of wastes far beyond the
handling capacities of urban govt. and agencies. Cities are now grappling with the problems of high
volumes of waste, the cost involved, the disposal technology and the impact of wastes on the local
and government environment. Therefore, at this moment it is very much needed to make a proper
plan for waste management and disposal system it has also been observed that waste can be another
source for earning money. So, keeping this objective in mind, this study attempts to develop a
proposed marketing model for waste management system in Dhaka city. It can also be considered as
a preventive waste management approach, which is focused on changes in lifestyles and in
production and consumption patterns. This article also tries to find out the commercial value of
waste. Last but not least it is a proposal rather than a conclusive study. It needs a more pragmatic test
for its reliability study.

7
Enhancing Urban Governance through Public Private Partnership: A Study of Solid Waste Management in Dhaka City
CHAPTER-1
Dhaka, once upon a time, “It was a beautiful city , sometimes easily mistaken for a village” Bartly Bart wrote in his “Romance of an eastern city”
INTRODUCTION
Dhaka is one of the mega and one of the dirtiest cities in the world. It has a population near 12
million with a population growth of nine percent urbanization, while growth rate is ten percent
and per capita income is US$476 (Huda 2008:245). In Dhaka City Corporation (DCC) area sixty
percent houses belong to people of low income, thirty seven percent middle income and the rest
three percent constitutes high-income houses. The old part of Dhaka is more densely populated than
the new part of Dhaka. There are over 1,000 small and large industries including 149 tanneries, about
500 clinics and hospitals located within the boundaries of the city. These factors leads the city to
generate around 4000 to 5000 tons solid waste everyday, which require to be disposed to enable the
the city to be habitable for citizens living within it.
Dhaka City Corporation is the only formal organization responsible for management of waste,
estimated to be around 4000 to 5000 tons everyday. According to a report of JICA2005, it may
assume a mid-figure about 4,000 tons of solid waste generation within the DCC area everyday.
These wastes are deposited together in the same primary handling depots from where about 45
percent is finally disposed of either by the DCC or Community Based Organizations (CBOs) in the
open landfill sites situated at Matuail near Jatrabari, Beribadhin Mirpur, Savar and in Uttara(.JICA
2005:25)

8
Out of 4000-5000 tons of waste produced, about 40-50 percent is disposed in the landfills and the
rest left unattended and locally dumped. It is estimated that between 14 -17 percent of the total
municipal budget is used for solid waste management which is approximately Tk. 26/- (0.5 US$) per
capita per year ( Yousuf 2000:202) . Around 7,500 cleaners are engaged in street sweeping and waste
collection activities in Dhaka city. The number of cleaners per thousand population in Dhaka is
nearly one (JICA 2005:37). It is to be noted that waste densities (350 to 450 kg/Cu.M) and moisture
contents (50 percent to 70 percent by wt.) are much higher than the wastes in developed countries, as
it generally contains a high organic (50 percent to 70 percent) and low combustible
matter.(www.dcc.org)
.
It shows prospects as well as throws multifarious challenges to a developing country like
Bangladesh. The prospects exist in the sense that organic portion of solid waste is sixty to seventy
percent, is excellent for converting it into fertilizer to be used in food production. It is challenging as
it contains high moisture content which requires high level of heat for incineration which is not cost
effective and viable for a developing country like Bangladesh. What can be done then? This study
tries to come up some answers.
A Brief Glance of Waste Management in Dhaka City
The Solid Waste Management of DCC is operated in following 4 phases :
• Primary Collection & Accumulation:
Normally the households bring their refuse to the nearby communal bins/containers located on the
street side, while in some specific areas community has arranged house to house collection of
garbage with their own initiatives and efforts. The household, commercial, institutional & medical
wastes are deposited in the same waste collection bins located on the streets. Street sweeping is done
manually and debris are loaded from the kerb-side into the handcarts and delivered into the
collection bins However, still most of the domestic, commercial & Industrial Solid Wastes are being
accumulated into the dustbins/containers by the concerned households/owners themselves.

9
Transportation :
The wastes are transported by fleet of open (flat bedded) or closed vehicles (with vertically sliding
shutter on both sides) from the city - where the roads and the lanes in the older part of the city are
narrow. In the new part, de-mountable container system (hydraulically operated) is working. Every
vehicle has got specified areas and route through which they move to collect wastes. Presently, 370
Nos. of trucks (Both open & covered) and container carriers are engaged in transporting the Solid
Wastes from the dustbins/containers to the disposal sites. For loading they uses cane basket &
"Belcha"(Shovel) (www.dcc.org)
Final Disposal :
Garbage Trucks & Carriers’ bring the collected Solid Wastes to the selected Dumping Sites. City
Wastes are only being used for filling low-lying lands. Some heavy equipment like Bull-Dodger,
Tire Dodger, Pay-Loader Excavators are being used for dressing & compaction of the dumping site.
The waste is presently being disposed off mainly on a lowland (Matuail) about 3 kilometer from the
corporation area and a number of minor sites which are operated in an uncontrolled manner without
any proper earth cover and compaction. The uncollected wastes are dumped in open spaces, streets,
clogs drainage system creating serious environmental degradation & health risks.
In Dhaka city, residential and commercial sources produce most of the total municipal waste. A
JICA study in 2005 shows 63 percent (2120 tons/d) of the total waste (3,340) is from residential
sources while another project of the Dhaka City Corporation(DCC) estimated that it is 49.08 percent.
Other sources, for example commercial and industrial waste volume is not specified clearly in
JICA’s “Clean Dhaka Master Plan” study but according to DCC and some other recent studies,
commercial waste generation is no less than 20 percent of the total (Bhuiyan & Hossain 2002:39).

10
Statement of the Problem DCC incomes are classified into three categories: 1) Revenue Income, 2) Government Grant, and 3)
Government and Foreign Agencies/Donors Support. DCC has as many as 19 regular revenue income
items. Among these items, only 5 items contribute around 83 percent to total revenue incomes and
they are: 1) Holding Tax, 2) Market Rent, 3) Market Salami, 4) Trade License, and 5) Property
Transfer Fee. . Holding (property) taxes are 63 percent of DCC revenue earning(JICA 2005:24).
Holding Tax is composed of Property Tax seven percent, Conservancy Rate two percent and
Lighting Rate three percent and imposed on annual value of property that a taxpayer owns. Most of
the revenue expenditure (fifty five percent is incurred for salaries and wages. According to
Islam,2005”The own source income for the year 2001-2002 was Tk. 1557.2 million and other source
(Government) was Tk. 540.5 million. The subsidy from Government for last five years is from 25.77
percent to 38.43 percent The expenditure incurred for the development only ranges from 51.17
percent to 64.25 percent during last five years. DCC charges conservancy tax of two percent based
on property’s annual rental value. There is always negative correlation between income and
expenditure. The expenditure of SWM is 52.87 percent more than the income.” The per capita
expenditure for SWM in Dhaka is very low (Tk. 53.00) compared to other Asian cities such as
Bombay Tk.304.00, Manila Tk. 192.00 and Bangkok Tk. 84.00 (Enayetullah 1995:65). DCC spent
15.42 percent of the total annual expenditure for SWM (Yousuf 96:38). The solid waste management
cost of DCC is Tk. 313.12 /cubic meter of which collection cost is Tk. 120.54(32.75 percent,
transportation cost is Tk. 150.09(47.90 percent) and disposal cost is Tk. 60.60(19.37 percent) per
cubic meter (Salam 2001:23).
Dhaka City Corporation is functioning on the basis of "Dhaka Municipal Corporation Ordinance XL
1983". The ordinance has no specific clause or section for industrial hazardous or clinical waste
storage, handling, collection, transportation and disposal either by DCC or privately. Necessary by-
laws have not yet been introduced on “Standard” of refuse quality and details of punishment of any
offence detected by DCC mobile court.
Dhaka City Corporation is yet to have any Solid Waste re-cycling project. However, wastes which
have market value are being reclaimed or salvaged for recycling. Recycling contributes to resource
conservation as well as environmental protection. A major part of the solid waste of the DCC
remains uncollected. This uncollected waste mostly remains in bins, temporary roadside depots, and
open spaces or street sides causing a number of problems. These are hazardous items like broken

11
glass, razor blades and explosive containers may pose health risks especially on that population who
partially live off the waste disposal sites.
Large quantities of solid waste remain on the street everyday in the residential, commercial and
industrial areas. This causes bad odor, which is very uncomfortable for pedestrians and local people.
Uncollected waste spreads vermins and pollute the surrounding environment, not only that
commercial solid waste and waste water released on the Buriganga, Sityalakma and other rivers
adjacent to Dhaka contaminate river water badly and contributes to overall environmental pollution.
Unsanitary dumping also causes ground and surface water contamination. .In this context, DCC
landfill sites are open, with no gas collection system or leachate treatment technology( except
Matuail) The Beri Bund landfill is very close to the Buriganga River and leads to pollution of the
river. In Matuail, the major landfill site is located within 1 km of residential areas (for example
Jatrabari, Jurain). Actually, most of the abandoned landfill sites are also close to residential areas.
Matuail receives 65 percent of the total disposal volume, Beri Bund and Uttara receive 30 percent
and 5 percent, respectively JICA study team,2005. In fact, only about 44 percent of the total
generated waste (3,340 tons/day) is disposed at 3 landfill sites and the remaining forty six percent
remains uncollected and contributes to unhealthy, and environmentally degrading condition.
.
The DCC is still quite unable to keep up its utility services due to its budget constraints and lack of
other resources. It lacks institutional capacity also comparing to other city management in
developing countries. The conservancy tax., DCC charges, 2 percent based on property’s annual
rental value revenue of the DCC is lower than its expenditure, which is the main reason behind
inadequate solid waste collection and management. It was found that the DCC spent 476 million taka
in 2002-03 for solid waste management, while the conservancy tax revenue was only 146 million
Taka(JICA,2005). Expenditure on SWM has increased in last few years but the gap between
expenditure and tax revenue remains high.
There are a number of laws and policies, for example, the Dhaka City Municipal Ordinance, 1983;
National Environmental Management Action Plan (NEMAP, 1995-2005); Urban Management
Policy Statement, 1998; National Policy for Water Supply and Sanitation, 1998. Above the
legislations there is no specific guideline regarding sold waste management. Besides these, no
independent legislation is there regarding solid waste management

12
Objectives This study will therefore try to :
Get an overall picture of present solid waste management in DCC.
Relate public private partnership with solid waste management .
Suggest ways to develop institutional capacity of DCC for solid waste management.
Rationale of the Study : Dhaka, the Capital City of Bangladesh, is expanding rapidly turning into a mega city with an
enormous growth of population at a rate of around 9 percent a year. Solid wastes are being generated
at a faster pace, posing a serious management as well as environmental threat. Rapid growth of
industries, lack of financial resources, inadequate trained manpower, inappropriate technology and
lack of awareness of the community are the major constraints of solid waste management for the fast
growing metropolis of Dhaka. A healthy life, cleaner city and better environment are the logical
demands for the city dwellers as the municipality is traditionally funded for solid waste services from
municipal tax system for waste collection and disposal. Due to limited finances and organizational
capacity, it has been really difficult for the DCC to ensure efficient and appropriate delivery of solid
waste collection and disposal services to the entire population
The uncontrolled disposal of solid waste has led to many environmental problems including
localized flooding through clogging of drains. One study thus remarks that despite high demand for
all forms of recyclable material in Bangladesh and a large number of people involved collecting and
recycling industrial commercial and kitchen refuge, solid waste is one of the most visible form of
pollutants found in city streets, open areas, unused public and private lands, ditches and water
bodies. Thus this study will try to shed light on the overall conditions and try to come up policy
options and strategies to tackle the issue.

13
Methodology
In this study I intend to explore why public private partnership is necessary for enhancing urban
governance and tried to show how PPP helps to reduce cost and improve service delivery. In this
respect, both qualitative and quantitative data have been used. Nevertheless, qualitative methods are
considered the dominant design for the study. This study therefore used the
.Case study as the researcher I talked with various stake holders of DCC and sometimes observed
their activities , sometimes mixed with them as a member of their group. I interviewed different
officials and workers of Public and private organizations. Have also been inteviewed. Using open
and closed end questionnaires
Limitations: The major problem that I encountered at the initial stage of my fieldwork was to make
the term public private partnership and urban governance understand to my
respondents. Because it is relatively a new term used in development research and little
work has so far been done in Bangladesh using PPP as an analytical tool. In order to
overcome the problem, I had to define PPP and Urban governance and discussed the
major analytical aspects. For my respondents, I used suitable local words (i.e. moila/
abarjana ) for expressing the inherent meaning of solid waste .
At the time of doing the interviews, in some cases, I was not allowed to make a face-
to-face interaction with the Head of the private organization because of the so called
bureaucracy. In some cases I asked questions to the staff and he /she answered in favor
of the organization.
It was a difficult task to reach with the Head of the private organization than to the
civil servants for holding interviews with them, as their tendency was to escape in th
name of their ‘busyness’. In spite of all the hurdles, I managed to talk to them and
received some documents related to my work. This has been quite frustating as thi
type of behaviour is expected from private sector.

14
CHAPTER OUTLINE :
This study will have the following overall structure Chapter-1 –Introduction Chapter-2- Concepts, Issues. Models of SWM . Chapter-3 The Global and local Scenario of SWM . Chapter-4 Solid Waste Management in Dhaka City Chapter-5 Analysis and Conclusion

15
Chapter – 2 Concepts, Issues. Models of SWM
Introduction: This chapter is focused on good governance and good urban governance
initiatives. Principles of good governance and good urban governance are also discussed and
tries to relate between this two issues. Then it broadly focuses on solid waste management that
means what it is,some definitions and some conceptual issues regarding solid waste
management. The discussion also encompasses Urbanization and focuses on it in the light of
global and local perspective. It also relates urbanization with solid waste management. Lastly
focus is also given on public private partnershipwith some relevant theories
Before discussing solid waste management linked with urban governance, it would be logical to
focus on the concept of ‘governance’ which is a crucial ingredient of urban authority. What exactly
is governance? The term 'Governance' is derived from the Greek word 'kybernan' and 'kybernetes'. It
means 'to steer and to pilot or be at the helm of things. The concept of governance is complex and
controversial. There are some common points of departure, however, first, governance is not
government. Governance as a concept recognizes that power exists inside and outside the formal
authority and institutions of government. Second, governance emphasizes ‘process’. It recognizes
that decisions are made based on complex relationships between many actors with different
priorities. However, to grasp the full understanding of governance issues we should first differentiate
between government and governance.
While, Government is described as the repository of confidence and power of the people delegated
by them for a fixed period of time for the express purpose of identifying, mobilizing, organizing,
guiding and directing all available resources, human and other, to facilitate planned and participaton
transformation of their society towards enhanced well-being of its people, via just enjoyment of all
its needs, rights, aspirations and sustainable peace (www.unescap.org).
Governments are necessarily political regimes pursuing a course of development action that they
consider as most suited within the construct and form of their society and its constitution.
Government comprises the constitution & laws, institutions & structures, management mechanisms
& administrative processes. These are devolutionary instruments that make a government
participatory and responsive to common citizens.

16
Governance, on the other hand, is the sum of cumulative practice of behavior and attitude of the
government as seen in the manner they create and use the said devolutionary instruments. Form,
style, systems, methods, and procedures of government generally reflect the pattern of governance in
a nation or city. The quality and effectiveness of governance depend mostly on how judiciously the
government uses the said instruments to help people achieve the ultimate goal of their progress -
justice, equity and peace.(www.unescap.org).
Good Governance Initiatives Since the early Nineties, the United Nations has pointed out that member countries of the UN need
to pay greater attention to the way their government systems and procedures have been operating in
order to ensure that there exists good governance. They introduced the term 'governance' in the
development vocabulary and made a conscious effort to popularize the concept of good governance.
Their policy papers on Governance were explicit and inviting. Today, the concept has gained
currency in many development arenas and agencies and nations have begun to work on improving
their governance(www.unescap.org).
Some noteworthy definitions of 'governance' come from the World Bank, UNDP,OECD and The
Commission of Global Governance. 'The World Bank has identified three distinct aspects of
governance: (i) the form of political regime; (ii) the process by which the authority is exercised in the
management of a country's economic and social resources for development; and (iii) the capacity of
governments to design, formulate and implement policies and discharge functions.' (World Bank
1999:95)
'Governance is viewed as the exercise of economic, political and administrative authority to manage
a country's affairs at all levels. It comprises mechanisms, processes, an institutions through which
citizens and groups of articulate their interests, exercise their legal rights, meet their obligations, and
mediate their differences.' (UNDP 1997:1)
'The concept of governance denotes the use of political authority and exercise of control in a society
in relation to the management of its resources for social and economic development. This broad
definition encompasses the role of public authorities in establishing the environment in which

17
economic operators function and in determining the distribution of benefits as the nature of
relationship between the ruler and the ruled. (OECD 1995:45).
According to the Commission on Global Governance. 'Governance is the sum of the many ways
individuals and institutions, public and private, manage their common affairs. It is a continuing
process through which conflicting or diverse interests may be accommodated and co-operative action
may be taken. It includes formal institutions and regimes empowered to enforce compliance, as well
as informal arrangements that people and institutions either have agreed to or perceive to be in their
interest' (Commission on Global Governance 1995:12).
From the above definitions ,it can be summarised that good governance is both a goal and a process.
And it can help us find solutions to poverty, inequality and insecurity. It creates an environment in
which civil organizations, business community, private citizens and other institutions can assume
ownership of the city development process and the management of their communities. There are
three main actors involved in good governance. They are (1) .the State, ( 2) .the Civil Society and ().
the Private Sector.
.The State provides the foundation of Justice, Equity and Peace, creating conducive political and
legal environs for human progress. The Civil Society provides the foundation of Liberty, Equality,
Responsibility & Self-expression. The Private Corporate Sector provides the foundations of
economic growth and development. The three regimes carry out these responsibilities by performing
multifarious tasks (www.unescap.org).
So it can be concluded that Governance is the cumulative result of the interactions among the three
regimes in society's political, economic and administrative domains.

18
Good Urban Governance The idea of good urban governance came from UNDP's The Urban Governance Initiative (TUGI)
and UNCHS' Urban Observatory Project. More recently, the latter has also launched a Global
Campaign for Good Urban Governance. The UN-HABITAT proposes the following definition of
urban governance:
Urban governance is the sum of the many ways individuals and institutions ,public and private, plan
and manage the common affairs of the city. It is a continuing process through which conflicting or
diverse interests may be accommodated and cooperative action can be taken. It includes formal
institutions as well as informal arrangements and the social capital of citizens. Thus, UN-
HABITAT's operational experience confirms that it is not just money, or technology, or even
expertise, but also good governance that means the difference between a well-managed and Inclusive
City and one that is poorly managed and exclusive(www.unhabitat.org) .
:
Urban governance is inextricably linked to the welfare of the citizenry. Good urban governance must
enable women and men to access the benefits of urban citizenship. As it is based on the principle of
urban citizenship, it affirms that no man, woman or child can be denied access to the necessities of
urban life, including adequate shelter, security of tenure, safe water, sanitation, a clean environment,
health, education and nutrition, employment and public safety and mobility of resources.
Principles of Good Urban Governance
The UN Habitat Campaign proposes that good urban governance is characterized by sustainability,
subsidiarity, equity,efficiency, transparency and accountability, civic engagement and citizenship,
and security(www.unhabitat.org) and that these norms are interdependent and mutually reinforcing.
Sustainability should be there in all dimensions of urban development. Subsidiarity of authority and
resources to the closest appropriate level. Responsibility for service provision should be allocated on
the basis of the principle of subsidiarity, that is, at the closest appropriate level consistent with
efficient and cost effective delivery of services.

19
Equity of access to decision-making processes, provision of services and the basic necessities of
urban life. The sharing of power leads to equity in the access to and use of resources. Women and
men must participate as equals in all urban decision-making, priority-setting and resource allocation
processes.
Efficiency must be there in the delivery of public services and in promoting local economic
development. There should be transparency and accountability of decision-makers and all
stakeholders in their actions and decisions. It must be stressed here that the accountability of local
authorities to their citizens is a fundamental tenet of good governance.
The Habitat also stresses for civic engagement and citizenship as people are the principal resources
of cities; they are both the object and the means of sustainable human development. Therefore, their
rights as citizens and their continuous engagement in processes and policies affecting their lives
must be ensured. Lastly, security of individuals and their living environment. Every individual has
the inalienable right to life, liberty and the security of person. Security also implies freedom from
persecution, forced evictions and provides for security of tenure. Cities should also work with social
mediation and conflict reduction agencies and encourage the cooperation between enforcement
agencies and other social service providers (health, education and housing).
The Urban Governance Index:
The Urban Governance Index is an advocacy and capacity-building tool to assist cities and countries
in monitoring the quality of urban governance(www.unhabitat.org). Envisaged to be a measure of
good governance and inclusiveness in cities, the Index has been field tested in 24 cities across the
world.
The Index is being adapted and applied in several countries, including Somalia, Sri Lanka,Zimbabwe
and Mongolia. It provides the description of 25 short-listed indicators, which also include the 18 core
set of indicators. The indicators are grouped in sub-indices covering the core urban governance
principles of Effectiveness, Equity, Participation and Accountability. The figure no.1 below gives an
idea about the Index.

20
Figure:1
source: www.unescap.org
The different characteristics of the Index are discussed below:
Effectiveness
1. Local government revenue per capita
It has been defined as the total local government revenue (income annually collected, both capital
and recurrent for the metropolitan area, in US dollars) per capita (3 year average).
2Ratio of actual recurrent and capital budget
It is the assessment of the distribution of local government budget sources. Ratio of income derived
on a regular basis (e.g. through taxes and user charges) and that obtained from allocation of funds
from internal or external sources.

21
3.Local government revenue transfers
It means the percentage of local government revenue originating from higher levels of government.
This includes formula driven payments (such as repatriation of income tax), other grant donations
from higher government levels including national or state governments and other types of transfers.
4.Ratio of mandated to actual tax collection
Ratio of mandated tax collected to the actual tax collected. Tax collection is one of the sources of
income for the local government.
5.Predictability of transfers in local government budget
It indicates whether the local authority know well in advance (2-3 years) about the amount of budget
and level of consistency/regularity in receiving transfer from higher government?
6.Published performance delivery standards:
Presence or absence of a formal publication by the local government of performance standards for
key services delivered by the local authority.
7.Consumer Satisfaction Survey
Existence and frequency of a survey on consumers’ satisfaction with the local authority's services.
8.Existence of a vision statement:
This means the measure of local authorities commitment in articulating a vision for the city’s
progress. Does the local authority articulate a vision for the city’s future through a participatory
process?
Equity
9.Citizens’ Charter: right of access to basic services:
Presence or absence of a signed, published statement (charter) from the local authority which
acknowledges citizens’ right of access to basic services.
10. Percentage of women councillors in local authorities:
10. Women councillors as a percentage of the total number of councillors in a local authority (in the
last election).. Percentage of women councillors in key positions

22
11. Pro-poor pricing policies for water
Presence or absence of a pricing policy for water which takes into account the needs of the poor
households, which are then translated into lower rates for them compared to other groups and prices
applied to business/industrial consumption.
12. Incentives for informal businesses
1a.Presence of particular areas in the central retail areas of the city where small scale (informal)
street vending is not allowed (or submitted to particular restrictions).
1b. Also measures the existence of incentives for informal businesses e.g. street vending, informal
public markets, and municipal fairs.
Participation
13. Elected council:
The indicator measures whether the local governing council is elected through a democratic process
or not.
14. Selection of Mayor
The indicator measures how the Mayor is selected, whether directly elected, elected from amongst
the councilors or directly appointed.
15. Voter turnout
Total voter turnout (both male and female) in percentage in the last election
16. Public forum
The public forum could include people's council, city consultation, neighbourhood advisory
committees, town hall meetings etc.
17. Civic Associations per 10,000 population
Measured as the number of civic associations (registered) per 10,000 people within the local
authority's jurisdiction.

23
18.Accountability
Formal publication (contracts and tenders; budgets and accounts):
Existence of a formal publication (to be accessible) by the local government that consists of
contracts, tenders and budgets and accounts.
19.Control by higher levels of government
Measures the control of the higher levels of government (National, State /provincial) for closing the
local government and removing councilors from office.
20.Codes of Conduct:
Existence of a signed published statement of the standards of conduct that citizens are entitled to
from their elected officials and local government staff.
21.Facility for citizen complaints
The existence of a facility established within the local authority to respond to complaints and a local
facility to receive complaints and information on corruption.
22.Anti-corruption Commission
Existence of a local agency to investigate and report cases of corruption.
23.Disclosure of Income/Assets
Are locally elected officials required to publicly disclose their income and assets (and those of their
immediate family) prior to taking office?
24.Independent audit
Is there a regular independent audit of municipal accounts, the results of which are widely
disseminated?

24
Management of Solid Waste:
The term Solid waste is applied to unwanted or discarded waste material from houses, street
sweeping, commercial, industrial and agricultural operations, arising from human being’s activities.
In urban area it is called refuse; in the countryside it is called littering and in general, it is called solid
waste. It is a conglomeration of dust, ash, vegetables and putrescible matter, paper and packing of all
kinds, rags and other fabrics, glass and much other combustible and non-combustible debris. It is
non-liquid, non-soluble materials ranging from municipal garbage to industrial wastes that contain
complex and sometimes hazardous substances. Solid wastes also include sewage sludge, agricultural
refuse, demolition wastes, and mining residues. Technically, solid waste also refers to liquids and
gases in containers (www.njhazwaste.com/glossary.htm).
According to World Health Organization(WHO),” solid waste is defined as useless, unwanted or
discarded materials and is not free flowing. Solid waste is the term now used internationally to
describe non-liquid waste materials arising from domestic trade, commercial, industrial, and
agricultural as well as from public sector.
In case of urban areas Municipal Solid Waste (MSW) can be defined using Chapter 21.3 of Agenda
21 of United Nations Conference on Environment and Development of 19921
Solid wastes…include all domestic refuse and non-hazardous wastes such as commercial and institutional wastes, street sweepings and construction debris. In some countries the solid wastes management system also handles human wastes such as night-soil, ashes from incinerators, septic tank sludge and sludge from sewage treatment plants. If these wastesmanifest hazardous characteristics they should be treated as hazardous wastes. (www.unep.org)
Municipal solid waste (MSW), also called urban solid waste, is a waste type that includes
predominantly household waste (domestic waste) with sometimes the addition of commercial wastes
collected by a municipality within a given area. They are in either solid or semi-solid form and
generally exclude industrial hazardous wastes. The term residual waste relates to waste left from
household sources containing materials that have not been separated out or sent for reprocessing..
1 United Nations Conference on Environment and Development, Rio de Janeiro, June 14, 1992 Chapter 21 "Environmentally Sound Management of Solid Wastes and Sewage-related Issues"

25
MSW is thus seen as primarily coming from households but also includes wastes from offices,
hotels, shopping complexes/shops, schools, institutions, and from municipal services such as street
cleaning and maintenance of recreational areas. (http:en.wikipedia.org/wiki/solid waste)
There are five broad categories of MSW:
1.Biodegradable waste: food and kitchen waste, green waste, paper (can also be recycled).
2.Recyclable material: paper, glass, bottles, cans, metals, certain plastics, etc.
3.Inert waste: construction and demolition waste, dirt, rocks, debris.
4.Composite wastes: waste clothing, Tetra Paks, waste plastics such as toys.
5.Domestic hazardous waste (also called "household hazardous waste") & toxic waste: medication,
e-waste, paints, chemicals, light bulbs, fluorescent tubes, spray cans, fertilizer and pesticide
containers, batteries, shoe polish ((www. wikipedia.org) .
Solid Waste Management Management and disposal of solid waste is known as solid waste management (SWM) and it has
different dimensions. The ancient Hindu culture has made a deep sense of belonging to the Waste
Management concept. It says, “Lawanam Samudra Davatayoh, Phalam Vanaspati Devatayoh,
PakwanamVishnu Devtayoh, Jalam Varun Devetayoh” meaning “ Salt belongs to Ocean, Fruits
belong to Botanical World, Sweets belong to Lord Vishnu, and Water belong to Neptune. Similarly,
Gautam Buddha in his teachings referred to the reuse of the Saffron robes Chibar as bed cover,
pillow cover, sitting mat, and foot wrap and finally as floor wipe. Islam says, “Kullu Saiya Yarju Ila
Islahi” meaning Send Back To Its Source of Origin”. Thus. waste management was part of the
traditional societies following the Nature where there is no waste material that creates environmental
hazard. Every thing is perishable. Every thing is recycled back to its origin - the Panch Mahabhuta
Tatwoh (the five fundamental elements): the Earth, Water, Fire, Sky, and Light. (International
Conference on Sustainable Solid Waste Management, 5 - 7 September 2007, Chennai, India. pp.552-
559)
SWM includes Resource recovery, re-use, recycling. Resource recovery includes all activities of
waste segregation, collection and processing which are carried out taking into consideration the

26
economic viability of the material (Cointreau 1984:14). Re-use and recycling provide an opportunity
to capture some of the values from the waste. Of these two techniques, reuse is a simpler process
involving reutilisation of material in its end -use form without the necessity of reprocessing.
Recycling, on the other hand, involves processing waste through remanufacture and conversion of
parts in order to recover an original raw matter .
In the modern day perspective, the practical dimensions of solid waste management includes
collection, treatment and disposal of solid waste. However, SWM is related with other tangible and
intangible factors and if these factors are addressed properly , SWM can be sustainable and enhance
urban government’s capabilities. The related factors are environment, health, community, education,
finance, technology, governance, policy and regulation.
Figure No. 2
Source: ( JICA 2005:34)

27
Theoretical Background of Solid waste Management :
The concept of ”Sustainable Development” was first introduced by IUCN( International Union for
the Conservation of Nature and Natural resources ) in 1980 in a report on ”World Conservation
Strategy: Living resources Conservation for sustainable Development”. According to the report
“Sustainable Development” means improving the quality of human life while living within the
carrying capacity of the supporting ecosystems”. In 1987, Brundtland Commission introduced a new
a definition in its report “ Our Common Future”. According to this Commission, sustainable
development has two aspects, one is “ meeting the needs of present generation” and another theory is
“ doing something for the future generation”.
This statement provides a clear implication for environmental agenda particularly waste disposal in
Dhaka City. In Dhaka the Dhaka City Corporation (DCC) is the formal authority to collect and
disposal of solid waste. So question can be raised whether that DCC is capable enough to ensure
sustainability of solid waste management or not.
Evolution of Solid Waste Management
The concept of solid waste management (SWM) developed gradually over time. In many European
countries in the 1660s, burial in cotton or linen shrouds was banned to allow more cloth for
papermaking. In USA in the nineteenth century, the first combined waste incineration and electricity
scheme began after years of mainly mainly dumping wastes in the Atlantic Ocean, polluting the
beaches, resulting in protests by the resorts on the shores of New Jersey and New York. Then in
1894, a programme of source separation was implemented for disposal, whereas the separation of
wastes at the source allowed the city to recover some of the collection costs through the resale and
reprocessing of materials.
In the early part of the last century, an ethnic minority in Egypt, the Zabbaleen, was one of the
world's first communities to integrate recovery and recycling of municipal waste. It was the
environmental movement in the late 1960s, which formally presented integrated Solid Waste
Management concept as a guiding principle for managing the refuse. Since then this notion was
widely implemented mostly in the industrialised countries of the world..
28
Millennium Development Goals & Waste Management
The Millennium Development Goals of the UN have focused on waste management issues very
strongly. Particularly, Chapter 20 deals with environmentally sound management of hazardous
wastes, Chapter 21 with environmentally sound management of solid wastes and sewage-related
issues, While Chapter 22 with safe and environmentally sound management of radioactive wastes.
International Standard Organization 14001
The International Standard Organization (ISO) promotes the development and implementation
of voluntary international standards, both for particular products and for environmental management
issues. ISO 14000 refers to a series of voluntary standards in the environmental field including ISO
14001 related to Environmental Management Systems (EMS) and other standards in fields such as
environmental auditing, environmental performance evaluation, environmental labeling, and life-
cycle assessment. The ISO 14001 standard requires that a municipality, community or organization
put in place and implement a series of practices and procedures that, when taken together, result in
an environmental management system.
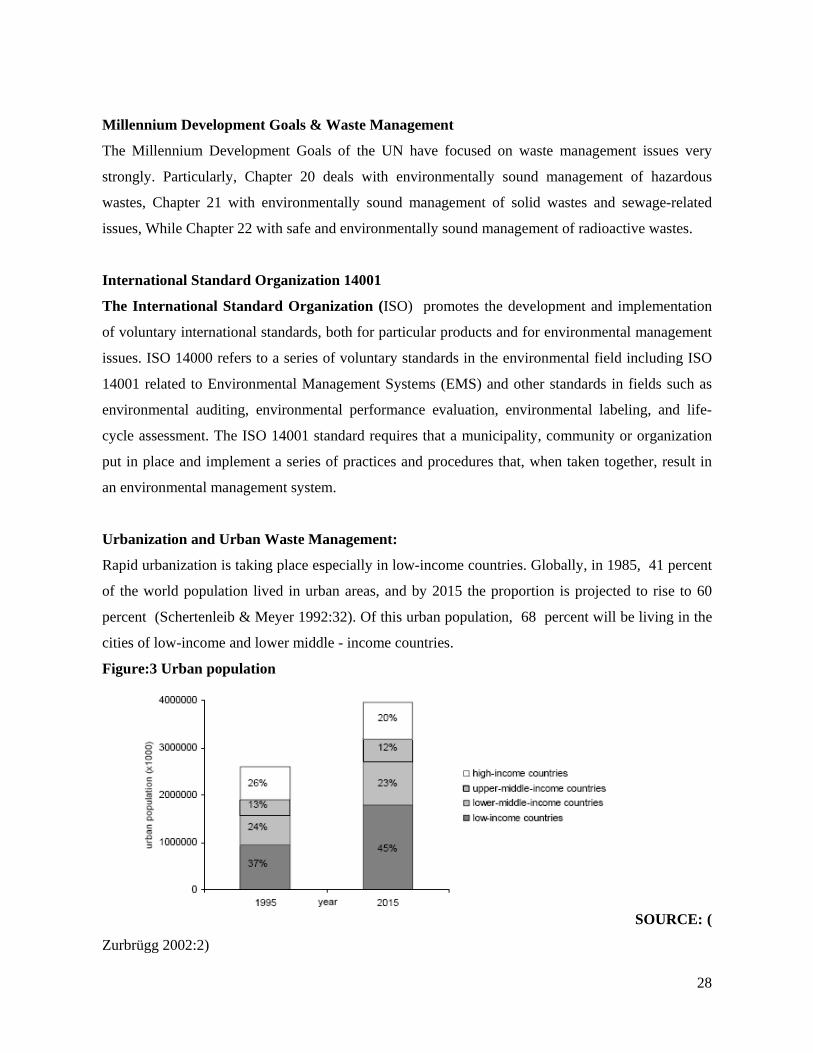
Urbanization and Urban Waste Management:
Rapid urbanization is taking place especially in low-income countries. Globally, in 1985, 41 percent
of the world population lived in urban areas, and by 2015 the proportion is projected to rise to 60
percent (Schertenleib & Meyer 1992:32). Of this urban population, 68 percent will be living in the
cities of low-income and lower middle - income countries.
Figure:3 Urban population
SOURCE: (
Zurbrügg 2002:2)

29
The global urban data for the year 1995 (World Resources Institute, 1997:89) shows that
approximately 65 percent of the urban population in the developing world still live in cities with
populations smaller than 750'000. Many of these "smaller" cities are facing urban environmental
management problems where appropriate approaches are sought now, before the cities' urban
environments deteriorate any further. The situation is becoming even more acute, as data shows that
slums are growing at an alarming rate and as mentioned above it is especially in the urban poor areas
where the municipal solid waste management service is lacking behind the needs of the inhabitants
(UNEP 2000:5).
Urbanisation: Global Perspective
Two hundred years ago only only five percent of the total population of a country used to live in the
urban area. In 2000 about fifty percent of the total world population has migrated from rural areas to
urban areas. About fifty five percent of the worlds population will be urban dwellers by 2015(Imura
and Bai,2000:135-136r).
Table 1: Percentage of Urbanization of World Population
Zone 1990 1995 2000 2005 2010 2015 2020 2025
Whole
world
43.1 45.2 47.6 50.1 52.1 55.6 58.5 61.2
Developed
world
72.7 74.2 75.8 77.4 79.1 80.8 82.4 83.8
Under
developed
world
34.3 37.2 40.3 43.5 46.8 50.1 53.5 56.7
Asia 31.2 34.0 37.1 40.4 43.8 47.3 50.9 54.4
Source: (Islam 2003:23)
The above table shows the upward trend of urbanization from 1990 to 2025. Increase of urbanization
although highest in the developed countries, this trend is lowest in the Asian cities. The figure of
2005, show that the average urban population in the Asian countries is 40.4 percent against the
worlds average of 50.1 percent and developed countries’s average 77.4 percent. It predicts that the
trend of urbanization will remain unabated in the decades to come. The city authority must ready to
face the upcoming challenges due to rapid urbanization.

30
Urbanization : Local perspective
Bangladesh is a developing country with about one and fifty million people in the area of 148,300
sq.km. The density of population stands at 881(BBS 2003:12) per sq. km. which is the highest in the
world except city states like Singapore and Hong Kong. On a per capita basis, it is three times more
populated than India and seven times more populated than China (Newton et al.1996:41). Basically
Bangladesh is a rural based country. Agriculture used to play and is still playing a dominant role in
the total economy of Bangladesh. After independence, the economy of Bangladesh started centering
at the urban places in all sectors like business, trade and commerce and industry.As Dhaka is the
centre of all development activities, it opens up new job opportunities and other facilities for all
classes of people. As a result only agriculture could not hold up the expanded population at the rural
areas.
A very big portion of rural migrated people of Bangladesh belongs to labor class. Of the seven
percent migrated people about six percent are poor. About 4.2 millions live in the slums in the
capital city contributing many odds including mal-management of municipal solid waste (World
Bank,2007:25). The slum dwellers comprise about 41 percent of the total population of the cities and
of Dhaka in particular. They are socially and economically deprived persons. Most of them do not
have access to clean water, proper sewerage system, gas , electricity and other civic services. Their
households are not come under DCC’s tax net. They do not have to pay any holding tax to the
municipal authority. But they generate solid waste nothing to pay for its disposal. So municipal
authority does not provide civic services to them. As a result, they become the worst victims of
environmental pollution caused by unattended solid waste.

31
Table-2: Urbanization in Bangladesh
Bangladesh Dhaka
Year Total Urban
population
Percentage
of urban
population
Average
annual
growth rate
Population Average
annual
growth rate
1901 702035 2.43 - - 1.04
1911 807024 2.55 1.39 154 1.8
1921 878480 2.64 0.85 169 0.9
1931 1073489 3.02 2.00 196 1.5
1941 1537244 3.66 3.59 296 4.2
1951 1819773 4.33 1.69 336 1.3
1961 2640726 5.19 3.72 557 5.2
1974 6273602 8.78 6.66 1774 10.4
1981 13228163 15.18 10.66 3440 8.1
1991 20872204 19.63 4.56 6844 6.5
2001 28605200 23.10 3.15 10170 4.5
Source: (BBS 2001:23 and Islam 2005:32)
The above table shows upward trend of migration from the rural Bangladesh to the urban places
across the country.The increase of urban population by 8.78 percent in 1974 against 4.32 percent in
1950. It is a big jump of migration in the urban areas in 1974. According to the table in 2001.the
urban population has been 23.10 percent of the total population of Bangladesh, which is nine times
higher than the figure of 1901 and nearly three times higher than the figure of 1974. it is a clear
upward trend of urbanization in Bangladesh after independence. Since than the trend of urban
population growth has marked very high in every decade.The rapid growth in population in the urban
places specially in Dhaka city is evidently responsible for producing more municipal waste.

32
Urbanisation and Waste Mangement
Asian cities are home to more than one billion people today. However, it projected that by 2025,
Asia will be inhabited by more than four billion people - half of them in cities - and will produce
more than 180 million tonnes of municipal solid waste (MSW) per day. The amount of waste is
rising to levels that are both difficult and costly to manage. .The Asian Development Bank (ADB
2000:8) estimates that urban authorities in Asia spend 50 percent to 70 percent of their total
revenues on waste management.1 In a separate study by the World Bank 2000, neglect of the
environment is calculated to cost an average of 5 percent of gross domestic product (GDP), while
government spending on environmental protection amounts to less than 1of GDP!( 3R practice in
east and south-east Asia, Waste Management World - September, 2007,Page-1)
As economic prosperity increases, the amount of solid waste produced consists mostly of luxury
waste such as paper, cardboard, plastic and heavier organic materials. In cities in the south, on the
other hand, waste densities and moisture contents are much higher (Cointreau et al.1984:54)
In addition, the hazardous content is quite high since the regulatory and enforcement system to
control such waste disposal are usually non-existent or not operating (Cointreau &Levine 1997:57).
This is a particular problem with waste from hospitals located within the city area, which is often
found mixed with municipal waste in open dumps and landfills.
These differences mean that waste management systems each require distinct approaches. For
example, as the waste content in developing countries is highly organic and susceptible to rapid
decay, the emphasis of the SWM process in these countries should be on the collection process.

33
Table 3. Economic development, urbanization and municipal solid waste generation
Country
Level of
economic
development
(GDP per capita
US$)
Level of
urbanization
(% of urban
population)
MSW
generation
(kilotons/year)
MSW
generation per
capita
(kg/capita-day)
Singapore 23,052 100.0 - -
Malaysia 3,915 57.4 - 0.88-1.44
Thailand 2,012 19.8 14,317 0.62
Philippines 989 58.6 10,670 0.50-0.70
China 856 35.8 130,320 1.70
Indonesia 710 41.0 - 0.76
Vietnam 401 24.1 - -
Laos 328 19.3 - -
Cambodia 256 16.9 - -
Source: Asia-Pacific in Figures, 2004 http://www.unescap.org/stat/data/apif/index.asp for GDP per capita, UNCHS, 2003 for level of urbanization; and Terazono et al., 2005 for MSW generation and per capita generation.
The Idea of Partnerships in SWM
Partnerships can be analyzed at different levels: politically as 'institutions' of governance; at the
planning level as instruments for public policy; sociologically as forms of social capital; and
economically as ways of reducing transaction costs. They include several dimensions: values,
processes, and institutions (Emura et al.2005:357-358).
There are a number of definitions of partnerships pertaining to urban governance . For my study I
use the following definition of partnerships:
1. It involves two or more actors, necessarily a public sector actor; 2. It refers to a more or less enduring relationship between the actors - based on a written or verbal agreement - regarding public goods provision; 3. There are benefits for all actors without assuming equality or equal benefits 4. It is realised in concrete activities, in which each actor invests materially or immaterially;

34
5. The bargaining process can include potential areas of tension and conflict as well as cooperation; 6. The partnership concerns the provision of public goods, or a spin-off relating to a public good.
Types of partnership arrangements in SWM
Public-private partnerships have received the most attention internationally and raise issues of public
interest and acceptability. Advantages are said to be savings on costs, less political interference, and
lower levels of coercion ( Ali 1993:12).
Governments generally privatize SWM activities to large-scale, formal enterprises. There is an
emphasis on strong contractual arrangements, which largely excludes informal businesses and
communities from qualifying. Although their potential is increasingly acknowledged, few
governments include them.
Public Private Partnerships in environmental management have been encouraged by the United
Nations Global Compact, and Millennium Development Goals and at the World Summit on
Sustainable Development in Johannesburg in 2002.Local involvement in public–private partnerships
has also been urged as a means of overcoming some of the political standoffs in implementing global
environmental agreements, such the UN Framework Convention on Climate Change (1992) and its
Kyoto Protocol (1997). Under the Kyoto Protocol, the Clean Development Mechanism (CDM) was
established to allow countries with specific greenhouse gas reduction targets (the so-called Annex I
countries) to achieve some of these targets by investing in climate-friendly activities in countries that
do not have these targets (non-Annex I countries, which are usually developing countries).
Before going to broad discuss about the theme, We should know what is PPP?
PPP is :
• A common strand of public policy with better efficiency promised.
• A governance tool involving a long term contract between govt and third parties.
• A growing model of NPM.
• It offers financial, technical opportunities and creates new collaborative platforms for ensuring
efficient, responsive service delivery of public sector.
• widely used for design, construction, financing and operation of public infrastructure
Public Private Partnership is the working arrangements based on a mutual commitment between a
public sector organization with any organization outside of public sector” (Bovaird, 2004:199).

35
PPP is an institutionalised form of cooperation of public and private actors, which, on the basis of
their own indigenous objectives, work together towards a joint target (Nijkamp et al., 2002.).
• Partners of PPP:
• public Sector Partners
• National government
• District administration
• Municipal authorities
• Local government bodies
• State run Corporations
• State universities and
• research organizations
• Private Sector Partners
• Commercial for-profit enterprises
• Development-focused voluntary
• non-governmental organizations
• (NGOs)
• Cooperative societies
• Community-based organizations
• Religious organizations
• Professional organizations
• Trade unions
• Research and academic
• Institutions
• Households
•
Forms of PPP:
There is no specific form and size of PPP that fits for all. The UN’s “Global Partnerships
Initiatives“ is an excellent form of PPP. In general, PPP attempts to bridge the gap of
understanding and trust between the public and private sectors and the following forms are used:.
:

36
BOOT: Build Own Operate Transfer
BTO: Build Transfer Operate
BOO: Build Own Operate
BBO: Build Buy Operate
Public Private Partnership Approaches in Solid Waste Management
SWM emerged as an essential, specialized sector for keeping cities healthy and livable.. The key
elements required for PPP—a public sector with less than satisfactory efficiency and capacity, a
private sector willing to undertake some parts of the activity, and the general public willing to pay
the private sector for the extra service—are all present to some degree in most developing countries.
“The public sector would be inclined to PPP because SWM consumes the majority of municipal
budgets, and PPP may offer considerable savings. For instance, municipal corporations spend
typically more than 60 percent of operations budget in primary collection” (Ali 1999:10-12). This
cost can be partly offset by having partnership with the private sector. Municipalities also tend to
suffer from chronic budget deficits, have much difficulty in expanding their work force, and have
limitation in meeting public demand, all of which could further provide incentive for collaboration
with the private sector. The people—the third tier—are willing to pay because they get better service
and cleaner neighborhood. The private operators provide solutions that are appropriate, demand-
responsive and low-cost.
Public private partnership approaches in solid waste management in India
Public Private Partnership for Solid Waste Management in Delhi:
Inception of PPP
Solid waste management in Delhi has been a very poorly planned affair with onus on simply
transporting the mixed waste by trucks and disposing it in sanitary landfills (SLF). . Complete
negligence of waste minimization and recycling over the years gave way to a whole lot of problems
with disposal emerging as a major one. With commonwealth games round the corner, Delhi
government in its attempt to overcome the grim scenario signed agreements with three private

37
companies for collection, segregation, transportation and disposal of municipal solid waste in six
zones on January 31 2005( The Hindu, January 31st 2005).Aimed at increasing efficiency and
effectiveness of its waste management activities, MCD planned this public private partnership
project in six zones – City, South, West, Central, Karol Bagh and SadarPaharganj. The three
agencies with which the civic body signed the “concession agreement” for the project are limited for
south, central, and city zones, Noida basedAg Enviro infra projects (P) ltd. For Karol Bagh and Sadar
Paharganj zones and Delhi based MetroWaste Handling (P) Ltd.(MWH) for west zone. The project
proposed to be implemented in phaseswent fully operational in June 2005. The private companies
were allotted a concession period of 9years inclusive of the implementation period of 12 months
from the date of signing the agreement.The agreement also contained a performance evaluation and
monitoring mechanism where the monitoring of the project was to be carried out by an independent
engineer appointed by mutual consent of the corporation and the companies.
MSV Pvt. Ltd. was appointed as the independent engineer to monitor the project. In this study we
have monitored the working and operation of Delhi based metro waste handling private limited,
which is handling the collection, segregation and transportation of the solid waste in the west zone.
The study shows the paradigm shift that has been brought about in the sphere of solid waste
management with the advent of public private partnership. It specially focuses on the
wastsegregation which was totally neglected during the MCD regime.
Scenerio after the inception of PPP
The system has undergone a huge transformation since the privatization. Compactor loaders are
being used for the transportation of the waste. Containerized mechanical loading and unloading is
done which avoids multiple handling, reduces spillage, ensures hygienic environment around the
WSD’sand also reduces environmental and health risks. Moreover separate vehicles are used for
biodegradable(green) and non-biodegradable waste(blue). A major chunk of the biodegradable
portion is sent to a centralized composting facility. The whole transportation activity is managed by a
fleet of34 vehicles including 16 compactors 9 mini Refuse Collectors(RCs) and 9 high capacity
dump trucks operated by a total of 51 drivers and 72 helpers. The capacity of the vehicles varies
between3m3 and 16m3. They are directly managed by a strong team of supervisors(including team
leaders)which are 49 in number. The movement of the vehicles takes place according to the proper
schedule and is tracked by a state of the art command and control system. Command and control
communication devices comprise of 34 wireless sets on vehicles, 32 wireless handsets with

38
operational and technical staff and 50 cellular phones. Moreover, the on road movement of the
vehicles is tracked by a special Global Positioning System (GPS) enabled system. 100 percent waste
collection and disposal is ensured within 24 hours and is achieved in 3 shifts of 6 hours each.
Breakup vehicles are also maintained to keep the stability of the system intact in the case of
vehicular breakdown and also for handling
Scenerio before PPP
Scenerio after PPP
and dropped into these SCBs. However the responsibility of bringing the waste to the SCBs lies
uponthe waste generators. There is no door to door collection system. Minimum one SCB has been
placedin an area of 1 sq.km. there are separate bins for wet and dry waste. The bins have been placed
39
after the consultation with the local residents. The bins are properly looked after and are repaired
from timeto time according to the requirement. The repair work is done at the Subhash Nagar central
work.
Conceptual background of PPPs with reflection on SWM
Theories pertaining to PPPs helps to understand the validity of this kind of partnership with solid
waste management. Here we would present a review of relevant of sociological ,economic and
management theories.
Sociological theories
Public private partnership for SWM may be viewed in light of sociological theories of Functionalism
and general systems as elucidated by Abuyuan (1999:12). According to the functionalism theory
institutions must survive by adapting to changing circumstances by means of interdependence on its
various branches or partners. PPPs in SWM adapt to this theory well if we view the partners as parts
of a whole organisation that delivers services. Here the partners (public and private) may be seen as
interdependent organs of a larger organisation each having its specialised function working as a
whole towards the common goal of delivering effective services.
The general systems theory analyses systems from three different viewpoints: (1) system to
determine the nature of relationship between various components of a system; (2) system
effectiveness to judge how satisfactory are relationships among various components of a system for
the whole system to survive or make optimum use of resources; and (3) system dynamics to
investigate what forces a system to change and the direction in which the change occurs.
This theory is also relevant to PPP for SWM. Indeed it is a prerequisite to have a clear role
demarcation and defined relationship to make PPP work in the SWM sector. It is necessary that the
private sector be given the role in which they have the maximum potential to excel. For example, the
private sector has a comparative advantage over the public sector in the case of primary collection.
Conversely, financial and management inputs for operating secondary collection may be beyond the
capacity of most private sector agencies, and it may be better to leave this activity to the public
sector.

40
Economic theory
In the private sector, people and commercial enterprises succeed by paying no more than necessary.
Businesses pay the market rate—it pays no more than necessary for labour, supplies and capital. In
contrast, government also procures goods and services from the market for providing public service,
but market competitiveness is not applied. The result is higher cost. In recent decades there has been
increasing concern about the cost of government, and at every level of government, there have been
serious budget difficulties (Cox, 1996). Cox, W. (1996). Competitive contracting for more effective
and efficient government. (www.publicpurpose.com). Meanwhile, an alternative economic
arrangement has been emerging. A diminishing distinction between the public and the private sectors
was noticed by Dahl and Lindblom as early as 1953 (Larkin, 1994:9).
Bozemanfound the formation of hybrid organisations making the dichotomy of public and private
sector even less distinctive. (Larkin, 1994:8) argued that these hybrid or ‘third sector organisations’
hold a great deal of promise for many of our domestic problems. These third sector organisations
provide a means to combine the ‘efficiency and expertise’ from the business world with public
interest, accountability and broader planning of government
The above concept is pertinent to PPP for SWM, as this is a basic service that must be provided to all
citizens, and profit cannot be the main motive. The government and public agencies cannot
completely withdraw from this sector because this has a public health and public good
dimension.The question, therefore, is how to minimise the cost and maximise the resource
utilisation, whilemaintaining the best possible quality of service. A hybrid or mixed organisation
composed of boththe private and public sector may offer such opportunity.
Management theories
To meet the needs of society three distinct sectors—public, private and non-profit—have emerged
although their boundaries are not always completely distinct. Each of these sectors has its
comparative advantage. Traditionally each sector used to restrict itself to its own sphere of activities.
Lately, however, organisations have grown to realise that much value can be created by co-operating
with others outside of its sphere. Aickenhead (1999:55) has investigated various theories of
management to reflect upon public/private partnership, a summary of which is given below.
Traditionally partnership among organisations occurred rarely and on a small scale. The perception
of the business world has been one in which the players fight bitter battles, not satisfied with only
winning but needing also to see others lose. But increasing demand, complexity and limitation of

41
resources have forced organisations to recast their views. They have begun to realize the importance
of developing a collaborative advantage. It is often no longer possible to win when others are losing.
The focus has shifted from ‘win–lose’ to ‘win–win Are conditions right for PPP in the SWM sector
in developing countries?
How PPP helps to enhance urban governance in the light of the above theories in
SWM
According to the functionalism theory institutions must survive by adapting to changing
circumstances by means of interdependence on its various branches or partner. If we absorb this
theory in swm, we can view various branches as partners and adapt changing circumstances means
facing challenges through urban innovations based on specialization. In swm in Dhaka city, primary
collection is done by primary service providers such as CBOs NGOs,. On the other hand DCC does
the secondary task that means waste carried to dumping site such as Matuail sanitary landfill, Amin
Bazar land fill, Uttara landfill. Matuail is the only official site, the two other are private land. Before
privatize conservancy works in zone 9 &10 DCC has to pay fifty three million taka in 2003 for
secondary works. After introducing PPP, private partners did it with thirty six million taka that
means saving sixteen million taka. If ppp allows in large scale in swm in other zones it would bring
better output . Primary service providers have comparative advantage in primary collection as it
already proved. On the other hand in secondary collection though DCC has comperative advantage
seemingly but the private organization is learning by doing. So if opportunity should be rendered to
private parties sothat they would reach at certain level of efficiency. SWM is a major challenge to
urban authority which should be faced by the various parties by the means of interdependence.
Conclusion: Though present chapter deals with conceptual issues of SWM and PPP, the
following chapter is written broadly focusing on global and local issues of swm specially
developed and developing countries in Asia. It also shortly encompasses SWM in Bangladesh
Perspective.

42
Chapter – 3
The Global and Local Scenerio of SWM
Introduction: This chapter is written on detailed observation of SWM that means
conventional system of collection, transfer and cost of disposal in LDACs in Asia. Then it
focuses on developed cities like Tokyo and Soul specially on the composition and treatment of
SWM with resource recovery like energy recovery from incineration plants. Lastly it also
focuses on SWM in Bangladesh and concerned legislations
.
Solid Waste Management: Global and Local perspective
Waste Management in developing cities in the world
Solid waste is a significant and growing problem in many urban areas of the developing world.
Current systems of waste management in most developing country cities are not very satisfactory
and are grossly inefficient and ineffective. Uncontrolled landfill, disposal of waste and open
dumping are evident even in developing country cities where a waste collection service is not
organized. There is also a general failure to keep industrial, municipal and sewage waste streams
separated. It has been estimated that in India, for example, around 39 million tons of sewage and
industrial waste, together with about 50 million of solid waste, finds its way into the coastal waters
of the Arabian Sea and Bay of Bengal. Solid waste is also often dumped as landfill material in the
coastal wetlands. This results in synergistic effects and intensified environmental damage and human
health hazard.
In Mexico City it was estimated that 38 percent of the Federal District and 19% of the State of
Mexico collection vehicle fleet were out of service at any particular time (Bartone, 1991:78). The
result is that solid waste is routinely 'dumped' in the environment. Gutman's study of Reynosa in
Mexico (Gutman, 1994:67) found severe pollution of the Escondida lagoon, once a mangrove area of
tourist potential, partly because of illicit dumping of solid wastes.

43
Leachate pollution affecting surface water bodies and groundwater is also commonplace. Gutman
(1994) suggests that perhaps 7 percent of Reynosa's population is exposed to considerable health
hazards from solid wastes, and a further 25-33% face 'moderate' risks. The main risks are
gastrointestinal and skin diseases, with an unknown serious element because the waste arisings
include hospital and industrial waste. 20-40% of waste is not collected at all.
In some cities like Madras a large livestock population contributes to the sanitation and solid waste
problems. According to a 1989 livestock census, there were over 30,000 cows and goats and more
than 100,000 poultry within Madras City. Cointreau (1989) notes the very high cost of street
cleaning in some countries. Thus in Thailand some 35-55% of recurrent costs of waste management
are accounted for by street cleaning. Health inspectors tend to be few and over-stretched; with
perhaps one inspector per 200,000 residents. Differences in street cleanliness between urban areas
can often be accounted for by the political will of urban leaders.
Costs of disposal
Cointreau-Levine (1992) has suggested some benchmark figure for the costs of disposal in
developing countries. These average costs are shown in the following table .Inspection of the data
suggests that these are high estimates, particularly for low income countries. On the basis of these
data, however, we can estimate some broad orders of magnitude for total disposal costs in
developing countries. globally, the waste disposal industry may have a gross value of some $37-77
billion, accounting for a fairly constant proportion of GNP at 0.2-0.5%.( Cointreau-Levine 1992:67)
Table: 4
Benchmark Costs for Municipal Waste Collection and Disposal ($ per
tonne)
Cost Items Low Income Medium Income High Income
Collection 15-30 30-70 70-120
Disposal 1-3 3-10 15-50
Transfer 3-5 5-15 15-20
Total (Maximum) 19-38 38-95 100-190
Source: adapted from Cointreau-Levine (1992)

44
Table: 5
Low Income Medium Income High Income
Urban population 10a 1.2 0.7 0.6
x Towns Waste Arising
per Capita
0.2 0.3 0.6
x Collection Efficiency 0.5 0.7 1.0
= Total Tonnage 120 mt 147 mt 360 mt
x Collection + Disposal
Cost
$16-33t $33-80t $85-170t
= Aggregate Disposal
Cost
$1.9-4.0 b $4.8-11.8 b $30.6-61.2 b
GNP $1070 b $2413 b $16,279 b
Disposal Cost/GNP 0.2-0.4% 0.2-0.5% 0.2-0.4%
Source: calculations based on data in Cointreau-Levine (1992:25)
Cointreau-Levine (1992) notes that MSW collection and disposal may often absorb 20-50% of
municipal government revenues in developing countries. The evidence from OECD countries is that
private collection probably reduces costs by 10-40% (Cointreau-Levine, 1991:87) but the evidence
for developing countries is unclear. Bartone et al. (1991) confirm significant cost reductions in Sao
Paulo relative to Rio de Janeiro because of the introduction of private collections. In general there
appears to be scope for private operators given that economies of scale appear not to exist in
collection and disposal beyond a certain point.
SWM in Least Developed Countries
World Bank has categorized some countries as Least Developed Countries (LDCs) in terms of the
following criteria: low-income, human resource weakness, and economic vulnerability. At present,
50 countries are designated as LDCs, out of which 8 countries are from Asia - Afghanistan,
Bangladesh, Bhutan, Cambodia, Laos PDR, Maldives, Myanmar & Nepal. These countries have a
number of priority issues pertaining to the country’s development. Among those, management of
municipal solid waste is one of the priority urban issues.

45
Although cities of LDACs have a lower rate of waste generation compared to the cities of the
developing countries, their quantum of waste is high owing to their higher levels of population
density. The tropical climates with a high degree of rainfall and humidity aggravate the problem of
solid waste disposal. As cities are becoming more urbanized, their waste composition also changes..
shows the comparison of solid waste generated per capita (kg/day) in different LDCs and
developing countries. It is observed that the generation rate ranges from 0.3 to 1.0 kg/capita/day.
Table:6 Solid waste per capita generated in LDACs
Name of LDACs Solid waste per capita generated(Kg/day)
Bangladesh 0.5
Bhutan 0.3
Kabul 0.4
Cambodia 1.00
LaosPDR 0.75
Maldives 0.66
Myanmar 0.45
Nepal 0.5
Thailand 1.00
Source: Zurbrügg, Christian( 2002:6)
A comparison of the current waste composition in LDACs (Zurbrügg, Christian 2002:8) shows that
about 70% or more (by weight) of the waste is combustible (i.e. organics and paper).
The ratio of paper and and plastics including voluminous materials such as food containers and
wrapping materials is higher in some countries where tourism industry is expanding; however
organic waste is still the dominating factor in all of the countries being studied.In Bangladesh, the
lower percentage of plastic is due to the restrictions of using thin plastics. Cambodia, with its slower
urbanization growth, also has the same trend with Bangladesh in terms of paper and plastic wastes.
Whereas, the low content of the organic material in Laos PDR is mainly due to the agricultural
lifestyle where a large scale of the food waste is used as an animal feed. On the other hand,
agricultural countries like Myanmar and Nepal, high percentage of their waste is organic, which is
contrary to the waste in Maldives. In Maldives, with its rapidly developing construction industry,

46
which is contributing significantly to the composition of their waste, has also lower organic waste
composition. This is similar to the situation in Kabul, Afghanistan where 50-60% of their waste
content comes from construction debris or white waste.
Figure:4
Comparison of organic and inorganic components of MSW
Source: Zurbrügg, Christian( 2002:6)
.
Collection and transport
Generally speaking, significant amount of the solid waste generated in urban centers are uncollected
and either burned in the streets or end up in rivers, creeks, marshy areas and empty lots. Waste that is
collected is mainly disposed off in open dump-sites, many of which are not properly operated and
maintained, thereby posing a serious threat to public health
The collection rate varies from city to city and collection facilities are either inadequate or
inefficient in almost all of the cities . Figure 5 describes the collection efficiency of various capital
cities in Asia. Bangkok, being one of the fastest developing cities in Asia, exhibited the highest
collection efficiency followed by Phnom Penh and Thimphu.

47
Figure: 5
Collection efficiency of LDACs
Source: Zurbrügg, Christian( 2002:8)
MSW management services account for a high percentage of municipal budgets. Expenditure on
MSW management can reach up to 40% of the municipal operating budget and, 70%-90% of this is
spent on collection. For instance, Kathmandu spends 38% of the municipal budget on MSW
management; 93% of this is spent on sweeping, collection, transfer and transport. In Phnom Penh,
part of the collection service is performed by a private company, which demands the waste collection
fee from households and directly deducted in their electricity bill.
Disposal of solid waste
Landfill
In most of the cities of LDACs, landfill is the most preferred method for the final disposal of solid
waste. Most of these sites practice open dumping, with no regards to the requirements for a sanitary
landfill. However, government and municipalities are already working to develop the sanitary
landfill sites in few urban areas. Since land is fast becoming scarce within city limits, new sanitary

48
landfill are often too distantly located compared to the open dumpsites within municipal limits,
thereby making the longer collection and delivery time,, which is ineffectively costly.
In many islands of Maldives organic wastes are composted at home backyards and non-
biodegradable waste (such as plastics) is dumped near the beach or buried in a few islands. Burning
of combustible waste at designated areas is also widely practice.
In Nepal, after the closing of Gokarna landfill site in 1994, the collected waste is just haphazardly
dumped along the Bagmati river banks. In the case of Bangladesh,two land fills are exist.These are
Matuail, AminBazar , The former is the only official site and recently it has been sanitized and the
latter is private land fill.Fifty percent of total waste is collected and the disposed in these two land
fill.The rest fifty percent is uncollected , which usually cause problem during heavy rainfalls and
flooding.
Composting
Composting is the second preferred method of solid waste disposal in LDACs, mainly due to the
high percentage of organic material in the waste composition. composting in bigger scale is not that
popular in the whole region. The main reason why centralized composting plants are not functioning
effectively includes (a) high operating and maintenance costs compared to open landfilling; (b)
higher cost of compost than commercial fertilizers; (c) incomplete separation of materials such as
plastics and glass, making the compost poor for agricultural application.
Recycling and recovery
Recycling is generally carried out by the informal sector. There are no policies that promote
recycling or resource conservation, and the municipalities do not have the expertise to launch the
recycling activities. In several places, such as Kathmandu, more of the waste could be recycled if
there was better infrastructure for collecting recyclables.
In Cambodia, even though waste separation at the source is not practice, still some valuable waste is
sorted out prior to collection and some done during the transportation. About 12% of the total wastes
are collected from the household and from commercial areas by the informal groups for recycling..
In Bhutan, around 20% of the collected wastes are sent for recycling. Whereas, most of the
recyclable wastes collected in Nepal and Bhutan are sent to India, due to insufficient recycling
factories in the countries. In Bangladesh no formal recycling and recovery system is exist. Without
any assistance of formal authority, about 12% wastes are re recycling and recovery by the waste
Pickers.

49
Incineration
Due to the high capital, operation and maintenance costs involved for the installation of incineration
plants, incineration is not popular as a waste disposal system in these countries .
In Afghanistan, due to inadequate incineration facilities at Kabul hospital, medical wastes are
improperly disposed off haphazardly along the city streets. In Bangladesh, recently PPP approaches
is applied in hospital waste management , yet the system is inadequate and working in a large scale.
The management of municipal solid wastes in LDACs has still many problems. The current
regulation system is not perfect, and the existing management system and the collection facilities do
not fit the present requirements at all. Government, NGOs, CBOs and private sectors are working
hard in this field but still the action is not enough.
Overview of Municipal Solid Waste Management in Developed Countries:
Introduction
Per capita generation of municipal solid waste in the developed countries has increased threefold
over the last two decades. It is predicted that waste generation in the developing countries will be
doubling in the coming decade and global waste will be increased fivefold by 2025 (Brandsma 1997:
6-7). Indeed, how to resolve waste problem has become of enormous pressure for government
policymakers. Even until a decade ago, however, major concern about waste problem had been such
issues as reduction of waste generation itself and new facility.Here SWM in two developed cities in
Asia like Tokyo and Seoul is focused.
Policy and Legislation regarding solid waste management all over the world Country Name of Act or Law
China Law of prevention and control of sw
Indonesia Government Regulation 12 of 1995
Japan Waste disposal and Public cleansing law
South korea Waste Management Act
Malaysia Environmental Quality Regulations
Philippines : Ecological solid waste management Act

50
Japan, Tokyo
Composition of MSW
As of 1997, the total amount of general waste collected in the ward area of Tokyo was 4 million tons,
of which household waste accounts for about 46% (1.84 million tons) and waste from businesses
occupies the rest (2.16 million tons). Of the waste collected by the Bureau of Waste Management,
the TMG, 2.3 million tons are combustible ( Of which waste paper occupies as much as 50%, kitchen
garbage 29.9%, and so on ) However, 8.1% of the total combustible waste is incombustible (plastics,
rubber, and leather) or unfit for incineration (metal, glass,ceramics, etc), meaning that some of
combustible waste has been separated incorrectly
Treatment of MSW
Until the early 1970s, the primary method of treating MSW in Japan was landfilling. However, from
the mid-'70s, incineration became the most sanitary method as interim treatment to treat wastes. In
Tokyo, as more wastes began to be processed by incineration than landfills from 1974, incineration
rate sharply increased . As of 1998, the Bureau of Waste Management, TMG has 18 incineration
plants and these facilities process 87.1% of post-recycling and 100% of the Bureau-collected
combustible waste. Meanwhile, landfills receive less waste over time, and two landfills are currently
in service to process about 13% of municipal waste from the ward area of Tokyo.
Although incineration rate is high, because of increasing pressures about environmentally sound
waste disposal, rising disposal costs, and energy saving, recycling/resource recovery has become of
the most attractive and desirable alternative for an eco-society with zero-emission that the Japanese
government has pursued recent years
Composting is another attractive way of recycling. As for the kitchen garbage that accounts for 43%
of household waste and about 22% of waste from business sector in 1997, households, restaurants,
and municipal buildings are the main target. For example, in 1998, 90,161kg/day of food waste were
generated from municipal buildings in Tokyo, and 14,722kg (or 16.3%) were composed. It is the
TMG's goal to increase the composting rate of garbage from municipal buildings to 83% by the year
2000. Although households and businesses composting their garbage are increasing, the size is still
small.

51
Policy Responses to the Waste Problem
a) Tokyo
.The TMG and the Japanese national government have implemented a variety of policy initiatives to
address waste problem. In 1989, the TMG launched a campaign "Tokyo Slim" initiative for waste
reduction and began to employ various educational and public information activities for encouraging
citizens to minimize waste generation, such as "Long-term Vision for the Waste Management,"
"Public Incinerator Construction Plan," and "Action Plan for Waste Reduction (1991"Tokyo Public
Cleansing Act" played the most active role in reducing MSW generation during the 1990s.
In 1997, "The TMG Basic Plan for Urban Waste Treatment: Tokyo Slim Plan 21" was formulated by
the TMG. It will be effective from 15 years from 1997 to 2011 as a guideline for waste treatment in
the 23 wards of Tokyo.
Energy Recovery from Incineration Plants
a) Tokyo
As of 1999, there are 18 incineration plants in the 23 wards of Tokyo17, and these facilities
processed 100 percent of combustible waste collected in the area. 18 incineration plants in the ward
area of Tokyo. Major sources from incineration plants are heat energy and steam. Heat energy
generated from incineration plants is used for supply to heated pools, bath water for the elderly, and
so on
Seoul
Before and after 1990, the waste problem emerged as a potential crisis in Seoul. First of all, Seoul's
per capita MSW generation was too much as compare to other mega-cities in developed countries. In
1992, Seoul generated 1.74kg of MSW per person per day, while Tokyo 1.34kg, New York 1.3kg,
and London 0.9kg
. Seoul's population increased from 2.4 millions in 1960 to 10.9 millions in 1991, and the city’s
MSW generation jumped from 0.8 million tons in 1962 to over 11.6 million tons in 1991, 14.5 times
increase as compared to about 3.7 times increase of population during the same period of time. This
was largely due to rapid economic growth and urbanization during the period since waste generation
generally responds to growth in population and economic activity as seen in Tokyo case. Daily per
capita generation of MSW in Seoul also increased from 0.74kg in 1962 to 2.93kg in 1991.

52
In 2000, Seoul generated 11,339 tons of MSW per day, paper accounts for the largest portion (28%)
of the total MSW generation, food waste 23%, plastics 7%, and so on. In Seoul, food waste is more
problematic than paper or any other waste streams in terms of effective waste management in Seoul.
Food waste contains a lot of water (80 to 85%) and is easily decayed, so it causes groundwater
contamination when it is directly land filled. Food waste also consumes a lot of fuel for combustion.
With these reasons, landfilling of food waste is supposed to be banned by Waste Management Act
from 2005. Therefore, how to reduce and utilize food waste is a thorny issue of waste policy. As of
2001, there are two composting facilities with daily total capacity of 40 tons and four foddering
facilities with totaled 270 tons capacity.
Classifying the total amount of 11,339 tons collected in 2000 into combustible, incombustible, and
recyclable,each accounts for about 60% (6,839.6 tons), 5.7% (648.4 tons), and about 34% (1,946.5
tons),
Treatment of MSW
MSW treatment by processing type in Seoul: landfilling rate, which had accounted for almost 100%
until 1990, decreased from 93.6 % in 1991 to about 50% in 2000; recycling rate increased from 6%
to 44.5%; and incineration from 0.43% to 5.5% during the period. By the Recycling Promotion Act,
all waste generators have to pay for their waste generation except recyclable materials. Also,
recyclable materials, such as paper, bottles, steels, cans, and plastics, are separately collected. In
2000, 3,851 tons of materials and 1,197 tons of food wastes were recycled.
The Seoul city and the national governments recognized the nature of waste problem: building new
waste facilities cannot be the primary option for managing MSW; rather it should be approached in
comprehensive way. Integrated System of Waste Management14 was launched to address the
dilemma. The Korean national government developed legislative initiatives such as the revision of
Waste Management Act to promote recycling (September, 1991), the Volume-based Waste
Collection Fee (January, 1995), and Separate Collection among others which every autonomous local
district(22 and now 25) had to construct incineration plant for the treatment of local waste generated
in their jurisdiction. This 'do-it-yourself-principle,' however, faced more mounting opposition from
local residents who live near the potential facility site13. This situation resulted in waste
management policy deadlock and the war on waste in Seoul (Yoon 1996:35).
Volume-based Waste Collection Fee greatly contributed to reduce waste volume and amount and to
promote recycling as seen in the previous sections. It also facilitated active citizen participation.

53
In Seoul, 10,971 tons/day of MSW were generated in 1999, of which combustible materials
accounts for about 60 percent. Of it 78.9 percent of them went to landfill, and about 8% of
combustible wastes and 4.8% of the total MSW generated were treated by incineration . Incinerators
accept industrial wastes as well, but only minimum portion of them is processed by
incineration.1,746 tons/day of general industrial waste and 11,231 tons/day of construction waste
were generated. 19.4tons (or 1.1%) and 22.5tons (or 2.9%) of each source were treated by
incineration. 1.2% of combustible general industrial wastes and 0.7% of combustible construction
wastes went to incineration plants. As of 1999, there are 27 incinerators in Seoul with totaled
capacity of 52,975kg per hour. However, 25 of 27 facilities have small capacity with the 50 to 300kg
per hour range, which treat as little as about 4% of the total waste treated by incineration in Seoul.
Two plants (that is, Nowon and Yangchon)account for 94% of the total capacity and handle 96% of
the total waste.
Energy Recovery From Incineration Plants in Seoul
Only Nowon and Yangchon plants produce heat. As in 1999, Nowon plant accepted 86,948 tons of
waste and treated 79,936 tons, and Yangchon plant received 84,298 tons and processed 81,338 tons.
Nowon plant was designed to treat 800tons/day (400tons for each furnace) and Yangchon
400tons/day, based on the amount of waste generation in the early 1990s. As mentioned, however,
municipal waste generation reduced by almost 30% and recycling rate increased to more than 40%.
The city and local district governments tried to take wastes from other districts, but it failed due to
residents' opposition. As a result, both plants do not have enough waste to run their capacity. Only
about 240tons/day of waste go to each facility, and Nowon and Yangchon's operation rate is as low
as 29 and 61.2 %, respectively. As for material type of waste treated by the two incinerator plants, as
presented in Figure 16, food waste accounts for nearly half of the total amount at both plants. Since
food waste contains a lot of water to reduce heat efficiency of incineration waste, reduction and
utilization of food waste are urgent policy issue. Paper also occupies large portion, 26% for Nowon
and 22% for Yangchon. Also, 4 to 6% of waste treated in the plants is unfit for incineration, such as
plastics, rubber, metal, etc

54
Energy Recovery From Landfill Gas - Seoul
Nanjido landfill had received almost all of unprocessed mixed municipal wastes generated in Seoul
for 15 years from 1978 to 1993, with no prevention facility of environmental pollution. When it was
closed in 1993, it became a huge garbage mountain with 94meter height and 92,000,000 m3 of
mixed garbage. Most serious problem was groundwater contamination and methane gas emissions
from the facility
According to a US EPA study, landfill methane gas emissions are a major contributor to greenhouse
gases and global warming.22 Some scientific evidence says that methane gas has 20 to 30 times
more negative impact than CO2 on global warming. Therefore, how to treat methane gas buried in
landfills is a big challenge to be solved.
The Seoul city government did stabilization project of the closed facility for 3 years from December
1996 to September 2001 to prevent groundwater pollution and methane gas emissions. Upon the
stabilization project, the city\ government recently announced "the Nanjido landfill gas-to-energy
plan." The followings are the summary of Nanjido landfill and the landfill gas-to-energy plan.

55
SWM in Some Asian Cities
Table:7 Typical characteristics of municipal solid waste management
in Asian cities by level of development
MSW characteristics
Level of development
Less-developed cities (Less than 2,000)
Rapidly developing cities (2,000-15,000)
Developed cities (16,000-30,000)
MSW generation (kg/capita-day) 0.3-0.7 0.5-1.5 >1.0
MSW collection rate <70% 80-95% 95-100% Recycling Informal Formal and informal Formal Expenditure from municipal budget (%) 15-40 5-25 1-5
Source: Imura et al., 2005
Table: 8 Solid waste disposal characteristics by city in the countries of Southeast Asia
Country/City
Percentage solid waste disposal Incinerated
Sanitary landfill
Open dumping Recycle Open
burning Other
1. Thailand Bangkok - 99.0 - - - 1.0 Chiang
Mai 2 98.0 - - - -
2.Cambodia Phnom
Penh - - 74.0 15.0 5.0 6.0
3. Indonesia Bandung - 78.6 - - 16.3 5.1 Jakarta - 77.7 - - - 22.3 Semaran
g - 74.3 - - - 25.7
Surabaya - 70.0 - 30.0 - - 4. Laos - - - - - -

56
5. Malaysia Penang 10 - 80.0 10.0 - -
6. Philippines Cebu - 100 - - - -
7. Vietnam Hanoi - 65.0 - 15.0 - 20.0
8. Singapore
66.3 33.7 - - - -
9. China - - - - - - Source: UNCHS, 2003
Among the ASEAN countries there is a marked range of waste generation per capita. Malaysia
(population of 22 million) generated an estimated 5,475,000 tons of solid waste. This is about 0.68
kg per capita/day in 2001. This was comparable to Singapore’s 5,035,415 tons of waste in the same
year. However, Singapore’s per capita waste generation is much bigger though it has a population of
only 4,452,700.
Vietnam generates about 49,134,000 tons per year (about 0.61 kg/capita/day). In the Philippines,
waste generation is an average of 36,172.50 tons per year, i.e. 0.50 kg/capita/day (in urban areas) and
0.30 kg/capita/day (in rural areas). In Lao PDR average urban waste production is 0.75 kg per capita
per day. The quantity of waste produced by Thailand in 2001 was 14.1 million tons or 38,640 tons
per day (about 0.23 kg/capita/day), an increase of about 470 tons per day compared to year 2000.
Mandalay City in Myanmar generates 10,526 tons per year, consisting mostly of 47.02 percent
organic, 39.44 percent mixed in organics, 10.14 percent wood/trimmings, and 1.9 percent plastic.
Vietnam’s urban waste typically consists of 30 percent organics, 30 percent plastic, 15 percent paper,
25 percent glass, cans and other metals.
Phnom Penh, Cambodia, with a population of one million had a waste volume of 450,963 m3 in
1998 (1.23 liters/capita/day).
Brunei with a population of 340,800 (2002 estimate) generates waste at a rate of 392 tons a day
(1.15kg/capita/day) comprising of 33 percent paper, 25 percent food waste, 16 percent plastic, 14
percent metals, 5 percent glass and 7 percent others.
In most ASEAN countries, there is generally no system to identify and classify MSW into domestic,
commercial and/or industrial wastes. All types of solid waste are mixed together and not sorted at
home or at other sources. So there is no differentiation during collection by public or private

57
contractors. In some countries waste collected is taken to a common processing center for separation,
treatment and disposal.
An excellent example of SWM and waste as resource
NANJIDO.
Nanjido, a small islet in the northwest part of Seoul, was made a landfill in answer to the waste
disposal problem that arose, due to the rapid development of Seoul into a metropolitan city, in the
late 1970s. Before the World Cup Park was created, Nanjido was known as a home for mountainous
piles of waste and garbage
“Seen from a ferryboat,
Nanjido was embroidered with orchid flowers and a field of reeds,
Wearing a blue belt of clear rivulets.
A little rustic, like a pretty country woman.”
From Nanjido by Jeong Yoenhee ,a student of Ph.d program in Austrlia
Nanjido became the site of a massive landfill dump covering 2.7 million sq.m. From 1978 to 1993,
92 million cubic meter of garbage including household, construction and industrial wastes were
dumped (Seoul Metropolitan Government ,2002). There was no waste separation. Contaminants
from households, construction, industry and sewage were co-mingled.
The landfill created massive environmental and social problems through air and water pollution and
land subsidence. Over 15 years, the ignition of 2000 fires further exacerbated air quality problems
(Seoul Metropolitan Government 2002).
The Seoul City Council closed the landfill in 1993 and covered the waste with a one meter soil
capping to block odors. The Council then formulated a long-term plan to restore the degraded land
into an environmentally friendly park. Commencing in 1994 and proceeding through to 2001, the
landfill site was treated in four major phases:
• leachate treatment
• levelling and soil recovery
• extraction and recycling of landfill gas

58
A vertical leachate barrier was installed to a depth of 30m and extending 6km around the entire
landfill mass. Leachate is collected at 31 wells placed at 200-m intervals around the perimeter and
piped to a leachate treatment plant. Each day, 2.1ML of leachate proceeds through on-site primary
treatment, secondary treatment at the nearby Nanji sewage treatment plant, and then is released into
the Hangang River (Seoul Metropolitan Government 2002).
Landfill gas (LFG) is collected from over 100 gas extraction wells and piped to a LFG utilisation
plant. Methane is generated at a rate of nearly 170cu.m/min and recycled for heating and cooling at
the World Cup Stadium and nearby residential complexes. Slope stabilisation around the landfill
(Seoul Metropolitan Government 2002). After 15 years buried under a giant municipal landfill waste
dump Nanjido, The Isle of Orchids, has been recreated as World Cup Park. At 350ha, it is almost as
large as New York’s Central Park. It features a diverse array of commercial, recreational and
sporting facilities and industrial precincts.
Management of SW in Bangladesh Bangladesh, being a developing country, is predominantly a rural country. In 1951, the percentage
of urban population was only 4.33% of the total population. Since then the rising trend has continued
reaching around 24% by the year 2001. Total number of urban areas in Bangladesh is 514, which
includes 6 City Corporations, 298 Pourashavas (Municipalities) and 210 other urban
centers.(Huda,2008).
3 (three) ‘systems’ of waste management are coexisting side by side in Bangladesh. One is the
`Formal System’, where municipalities/city corporations are responsible for Solid Waste
Management (SWM). ‘Formal system’ is based on the conventional system of collection
transportation- disposal of waste carried out by the local authorities. In this system the concept of
transfer stations, resource recovery, minimization and recycling are absent. Next is the `Community
Initiative’ that is based on primary solid waste collection by CBOs and NGOs, `Community
Initiatives’ of house-to-house waste collection in neighborhood started due to lack of satisfaction
with solid waste management service. Finally, `Informal System’ represented by the large informal
labor force involved in the solid waste recycling trade chain.

59
In Bangladesh, NGOs like Waste Concern, Prodipan, Environmental and Geographic Information
Systems (EGIS) are coming up with strategies to manage the solid waste specially in primary
collection.. Prodipan is working from collection of solid waste to composting and runs a small scale
incineration plant.
The following table shows the growth in solid waste generation over the years.Table No:9 Total Urban Solid Waste Generation in Bangladesh
Year Total Urban Urban Population (% Waste Generation Total Waste
Population Total) Rate (kg/cap/day) Generation
(Tonne/day)
1991 20872204 20.15 0.49** 9873.5
2001 28808477 23.39 0.5*** 11,695
2004 32765152 25.08 0.5*** 16,382
2025 78440000 40.0 0.6 ** 47,064
** Source: ADB, 2000, Zurbrugg 2002,
It is evident from the above Table that solid waste generation in urban areas in Bangladesh is
growing with the growth of population as well as per capita GNP. In 1991 the per capita GNP was
US $ 213 (World Bank, 1997) while the GNP in 2001 was US $ 351 per capita and in 2003 it was
US $ 370 ( Zurbrugg, 2002).
Table:10 Total Waste management in urban areas of Bangladesh City/town
TWG ton/day
Waste collection rate%
No. of cleaners /1000 pop
Cost per ton,tk.
% of recycling
DCC 4634.52 37 1.2 669.98 15.00
CCC 1548.09 70 0.77 411.59 12.45
RCC 172.83 56.67 0.8 235.56 6.7
KCC 321.26 47.70 0.62 986.00 6.00
BCC 134.38 44.30 1.24 1932.00 5.42
SCC 142.76 76.47 0.85 1562.00 4.23
PS 4678.40 54.42 1.05 447.85 3.89
OTHERURBAN CENTERS
1700.65 52 0.05 312.00 4.00
TOTAL 13332.89 Average 55%
- - -
(Source: Self Compiled, Waste Concern Technical Documentation, 2005)

60
It is evident from the above Table that waste collection rate is the lowest among six city corporations
though the number of cleaners/1000 is not so less. Waste generation rate per day is the second
highest which is a burning question now a days.
Solid Waste Management Related legislations in Bangladesh
National Level Framework: No seperate policy in Bangladesh regarding SWM
SW handling Rules
CDM Strategy 2004 identified SW as potential sector
Urban SWM Management policy statement: only mentions SW but no specific
direction
National Environmental Management Action Plan: No specific guideline.
Local Level Framework:
No adequate legislation
SWM is entrusted with Local Government Bodies
Conclusion: The following chapter will try to focus broadly on SWM in Dhaka City. It will bring to
light concern authority for managing waste of DCC and basic laws to discharge responsibility. It will
broadly describe how waste is managed and existing functions, institutional capacity of Conservancy
Department of DCC which is responsible authority regarding it.Finally how medical waste is
managed and relate PPP with it will be presented
Chapter – 4
Environmental Conservation Act 1995, Environmental Conservation Rules,1997 National Policy for Water supply and sanitation No specific direction about SWM in above three legislations

61
Solid Waste Management in Dhaka city
Introduction
This chapter gives emphasis on SWM issues in local level that means focus is given in micro
level. It broadly describes responsibilities and existing institutional capacities of DCC. How
waste is collected, transported and disposed are also presented including conventional
methods of solid waste disposal. Solid waste is a public good and government is responsible
for managing it, but now a days it is also managed privately in Dhaka City. Therefore chapter
responses to private waste management and relate it with PPP. Some models of PPP relate
with SWM is also discussed. It also focuses on prevailing actors and factors relating to SWM
Dhaka ( formerly Dacca and Jahangir Nagar), is the capital of Bangladesh. Dhaka is a megacity
and one of the major cities of South Asia. Located on the banks of the Buriganga River, Dhaka,
along with its metropolitan area, has a population of over 12 million, making it the largest city in
Bangladesh. It is also one of the most densely populated cities in the world. Dhaka is known as the
City of Mosques and renowned for producing the world's finest muslin. As a cosmopolitan city,
Dhaka has been the center of Persio-Arabic and Western cultural influences in eastern Indian
Subcontinent Under Mughal rule in the 17th century, the city was known as Jahangir Nagar. It was a
provincial capital and a centre of the worldwide muslin trade. The modern city, however, was
developed chiefly under British rule in the 19th century, and became the second-largest city in
Bengal after Calcutta (presently Kolkata). After the Partition of Bengal in 1905, Dhaka became the
capital of the new province of Eastern Bengal and Assam but lost its status as a provincial capital
again after the partition was annulled in 1911. After the partition of India in 1947, Dhaka became the
administrative capital of East Pakistan, and later, in 1972, the capital of an independent
Bangladesh.It consists of seven principal thanas – Dhanmondi, Kotwali, Motijheel, Paltan, Ramna,
Mohammadpur, Sutrapur, Tejgaon – and 16 auxiliary thanas – Gulshan, Lalbagh, Mirpur, Pallabi,
Shah Ali, Turaag, Sabujbagh, Dhaka Cantonment, Demra, Hazaribagh, Shyampur, Badda, Kafrul,
Kamrangir char, Khilgaon and Uttara. In total the city has 130 wards.
Although its urban infrastructure is the most developed in the country, Dhaka suffers from urban
problems such as pollution, congestion, and lack of adequate services
due to the rising population. Dhaka is consistently ranked as one of the least livable cities in the
world.

62
Dhaka City Corporation : DCC is the formal organization for SWM in Dhaka city.
Dhaka City corporation was established as the Dacca Municipality on August 1,1864. The first
elected Chairman was Annanda Chandra Roy. Mayor and Commissioner are elected through popular
vote. It was renamed in 1978 as Dhaka Municipal Corporation and again in 1990 as Dhaka City
Corporation. Until 1994,Mayors were appointed by the Government . First elected Mayor was Md.
Hanif and present Mayor is Sadak Hossain Koka. DCC was previously administered through the
Dhaka city corporation Ordinance , 1983 , The Dhaka city corporation (Amendment)
ordinance,1991. Currently the former laws were repealed by Local Government (City Corporation)
Ordinance, 2008.The number of ward is ninety and is divided in to ten zones.
Functions of Dhaka city corporation (in brief)
Table No:11
Animals
Animals husbandry
Stray animals
Animal hones and farms
Registration of sale of cattle
Livestock improvement
Dangerous animals
Cattle show, zoo Disposal of
carcasses etc.
Development
Development plans
Community development project
Health development project
Slum development
Civil defense
Food and Drinks
, culture:
Library
Fairs and shows
public health
Sanitation
Removal and disposal of refuse
public safety, Public streets
Streets
General provision about streets
Encroachment
Streets lighting
Streets watering

63
Floods
Famine
Dangerous and offensive articles
Burial and burning places
Latrines and urinals
Birth, death and marriage
registration
Infectious diseases
Health and maternity centers
Public health
Hospital and dispensaries,
Medical aid and relief
Social welfare,
urban planning,
Master plan
Site development schemes
Execution of site development
scheme.
Traffic control, Public vehicles
water supply and drainage
Arboriculture
Gardens
Open Spaces
Forests
Nuisances pertaining to tree
Tank and low-lying areas.
Water Supply
Private sources of water supply
Drainage schemes
Bathing and washing places
Dhobi ghats & washer men
Public water courses
Public ferries
Public fisheries
Manpower by category
Table No.12

64
Category
Approved
Existing
Vacant
1st Class
346
271
75
2nd Class
178
127
51
3rd Class
2298
1735
563
4th Class
2230
1836
394
Total :
5052
3969
1083
Master Roll :
7156
7156
0
Grand Total:
12208
11125
1083
Source: www.dcc.org
Basic laws regarding Solid Waste Management in DCC

65
Dhaka City Corporation Ordinance is the basic law regarding street/drain cleaning, waste collection
and transportation. According to Section 78 of the Ordinance, DCC is allowed to provide dustbins or
other receptacles at suitable places, and to require residents to bring their waste to the dustbins or
receptacles. However, it is not clearly mentioned who takes responsibility of primary waste
collection where such dustbins or receptacles are not provided.
Management of solid waste by DCC
Conservancy Department
Conservancy Dept. is the core organization for solid waste management and is in charge
of street and drain cleaning, carrying street and drain waste to dustbins/containers, and
loading and unloading of waste to and from truck at places of dustbins/containers and disposal sites.
Conservancy Department comprises a predominant portion of field workers and very few officers
for planning and administration at headquarters.
Functions of Conservancy Department
• Collect solid waste from domestic, business, hospital, street, public toilets and drains..
• Provide dustbins and other receptacles for accumulating the waste.
• Supervise cleaners who clean the roads, drains and sewerage lines.
• Collection and transportation of medical waste.
• Development of hospital waste landfill
• Arrange community meeting for promoting community base solid waste management
• Development of sanitary landfill
Work with JICA for clean city Dhaka in 2015.
Manage the private solid waste management and NGO based solid waste management
Source: www.dcc.org.

66
Institutional capacity of Conservancy Department Total cleaners 7500
Total trucks 370 ( cover + open)
Handtrolly 2080
Total staff Conservancy – 600, supervisory - 135 Annual budget(2002/2003) 476 million taka, tax revenue 146 million
taka, budget deficit 330 million taka Source of income 2 percent conservancy tax of total property
value
Negative correlation between income and expenditure. DCC spent 15.42 percent taka on SWM of
total income, where in Mumbai 303 taka, Manila 192 taka
Source: State of Dhaka Environment Report, 2005

67
Figure: 6
Workforce of conservancy Department
Source: interview of DCC officials
Chief Conservancy Officer (1)
Assist. Chief Conservancy Officer (2, one in charge of
Zone 1-5 and the other in charge of Zone 6-10)
Deputy Chief Conservancy Officer (1)
Conservancy Officer(10, one for each Zone)
(Conservancy Supervising Inspector) ( 20 for each Zone)
Conservancy Inspector(90 approved, one for each Ward,
around 20 posts are vacant and some inspectors work for
two wards.)
Cleaners(around 7,000, Ward (street) Cleaners, Storm Sewer Cleaner,
Truck Cleaner (for loading and unloading), Drain Cleaners, Other
Cleaners)

68
Waste Management of DCC is accomplished in following 4 phases :
• Primary Collection & Accumulation
• Transportation
• Final Disposal
According to DCC Ordinance of 1983, DCC has the responsibility for secondary collection as well
as proper disposal of waste. From Zone 1 to Zone 4, all of garbage is transported to Matuail landfill
site while Zone 5 to Zone 9 use both Matuail and Berri Band landfill site (Gabtoli). Waste from Zone
10 is dumped at Uttara landfill site.
Primary Collection FIGURE NO.7
.
Primary waste collection Secondary waste collection
Transport Transport
Residents/NGOs/CBOs DCC
Waste collection approaches in DCC
Dustbins/ containers
Households
Final disposal sites

69
In Dhaka City, waste collection consists of two parts, namely primary collection and secondary
collection. DCC is responsible for secondary waste collection to remove waste from its
dustbins/containers, and transport the waste to final disposal sites.
Residents are responsible for bringing their waste to DCC’s waste collection points where
dustbins/containers are located. NGOs/CBOs/private sector provide primary collection services and
collect waste door-to-door and transport the waste to dustbins/containers, or sometimes to vacant
lands, by rickshaw vans. Primary collection is a labor-intensive work that uses rickshaw vans usually
manned with one van driver and one to two helpers.They go to each house, collect waste from
residents and put the waste into the rickshaw van. In some areas, residents bring their waste to
rickshaw vans using buckets/bags by themselves. After collecting waste from house-to-house, the
rickshaw drivers and helpers dispose of the waste in DCC dustbins/containers, or at vacant lands.
Various local civil societies or CBOs duplicated the system of door-to-door collection introduced in
Kalabagan in 1987. It is said that more than 130 organizations were providing the door-to-door waste
collection services since 1999.(JICA,2005)
Approval of NGOs/CBOs for Primary Collection by DCC
In 2002, DCC introduced an approval system of NGOs/CBOs/private organization for providing
door-to-door waste collection services ward-wide. At present, Chief Conservancy Officer has
authority to sign the approvals.Organizations submit proposals and DCC evaluates those proposals
and approves them. At present, DCC has given approvals to 47 NGOs/CBOs to work in 57 areas,
covering 52 Wards(JICA,2005) . These CBOs playing significant role in the primary collection of
the Solid Wastes.
Nearly 7500 Nos. of DCC sweepers/cleaners sweeps roads and cleans drains and then put those
wastes into the nearby dustbins or containers using a Hand Cart. Dhaka City Corporation has 3
different types of dustbins. Such as: (i) Brick/Cement Made, (ii) GI Sheet Built & (iii) Auto-lifting
Container

70
Transportation
The wastes are transported by fleet of open (flat bedded) or closed vehicles (with vertically sliding
shutter on both sides) from the old part of the city where the roads and the lanes are narrow. In the
new part, de-mountable container system (hydraulically operated) is working. Every vehicle has got
specified areas and route through which they move to collect wastes. 370 Nos. of trucks (Both open
& covered) and container carriers are engaged in transporting the Solid Wastes from the
dustbins/containers to the disposal sites. For loading they uses cane basket&"Belcha"(Shoval)
Table No.13
Allocated Number of collection/Transport vehicles
Type Number of vehicle
Open truck 213
Container carrier 127
Trailer truck 3
Total 343
Source: Interviewed of DCC officials
If we analyze the table we find that total number of vehicles is 243.Open truck is 213 and no
covered truck is there.
Final Disposal
Method of Waste disposal in Dhaka City
1. Land filling
2. Open dumping
3. No composting
4. No recycling
Garbage Trucks & Carries bring the collected Solid Wastes to the selected Dumping Sites. DCC uses three

71
landfill sites (namely Matuail, Berri Band and Uttara, .It is said that Matuail is the only official landfill site
owned by DCC. The site has surrounding embankment and solid waste is filled inside the embankment. On
the otherhand, Berri Band and Uttara dumpsites are private land. It is explained that owners of the land
requested that DCC fill the land with solid waste, and so DCC has been disposing solid waste there. The
remaining capacity of Matuail site is estimated at 1.1 million ton as of the end of 2004.(JICA ,2005)
Table No.14
Existing landfill sites in Dhaka
Name of the site Area(hector) Start operation Incoming truck
Matuail 20 1993 282
Berriband 4 Not clear 138
Uttara 1 2003 18
Source: JICA 05:45
Table No.15
Average incoming waste amount to disposal site
Survey
time
Matuail Berry band Uttara Total
Waste
amount
carried
(t/d)
Number
of
vehicles
(unit/d)
Waste
amount
carried
(t/d)
Number
of
vehicles
(unit/d)
Waste
amount
carried
(t/d)
Number
of
vehicles
(unit/d)
Waste
amount
carried
(t/d)
Number
of
vehicles
(unit/d)
Dry season 649 226 313 122 06 2 969 350
Wet season 913 338 399 153 104 33 1416 525
average 781 282 356 138 55 18 1193 437
65% 65% 30% 32% 5% 4% 100% 100%
Source: JICA 05 :98
If we analyze the table we find that Matuail absorbs thirty five percent of total waste volume while
Berry band and Uttara absorb respectively 30% and 5%.

72
Recycling
Dhaka City Corporation yet to have any Solid Waste re-cycling project. However, waste which have
market value are being reclaimed or salvaged by waste pickers for recycling.
Private Solid Waste Management
Private Solid Waste Management in Dhaka City is a new approach. Recently Dhaka City
Corporation fully privatizes its conservancy works in Uttara, Gullshan , Banani, Baridara, Mohakali
and Tejgaon areas. These areas cover the northern part of the city , zone 9 &10
(No.1,17,18,19,20,21,37,and 38.). The private parties are handling this works very smoothly. Two
NGOs and two private contractors are responsible to run the project properly.
:Table-16
Composition of Solid Waste
Source
category
Income
level
Composition(%)
paper Food
waste
Wood&
grass
plastics Sand&
dust
others
Domestic
waste by
income
group
Upper 12 49 21 2 1 15
Middle 6 80 0 1 1 13
Lower 4 71 1 2 17 5
average 7 66 7 2 6 11
Business
waste
Restaurant 2 97 0 0 0 1
Shop,hotel 4 89 1 1 0 5
Market 5 53 23 3 6 9
Public
office
35 19 25 0 14 7

73
Street waste 2 4 10 0 73 11
Source : Interview of DCC officials
If we analyze the above table we find that average sixty six percent waste is organic (food) and
plastic is two percent and the highest is three percent which is used in market.
Table: 17
Department and operation wise actual SWM cost
Department wise:Table:16(a)
Items 1999-00
(million taka)
200-
01(million
taka)
2001-
02(million
taka)
2002-
2003(million
taka
Ratio(million
taka
Conservancy
department
212 243 279 305 64
Transport
department
66 73 84 106 22
Engineering
department
89 67 39 65 141
Total 367 383 402 467
Source: JICA, 2005
If we analyze the table we find that cost of conservancy department is increasing from 1999 to 2003,
on the other hand cost of engineering department is comperatively reducing.

74
Table no.18
Operation wise:
Items 1990-00
(million taka)
2000-
01(million
taka)
2001-2002
(million taka)
2002-2003
(million taka)
Ratio
(million taka)
Cleaning of
roads and
drains
201 227 249 273 57
Collection
and transport
87 98 116 139 29
Final
disposal
05 5 6 7 1.4
Repair works 74 53 31 57 12
Total 367 383 402 476
Source: JICA 05:45
If we analyze the table we find that operation cost of SWM is upward trend and the highest
expenditure(273million taka) is in cleaning roads and drains, on the other hand city authority spends
only seven million taka in final disposal while collection and transport cost is moderate.
Table No: 19
Financial balance of SWM
Items 1999-
2000(million
taka)
00-01(million
taka)
01-
02(million
taka)
02-
03(million
taka)
Ratio inDCC own
account(percentage)
Overall
SWM
revenue
126 141 150 176 6%
Overall
SWM
expenditure
367 383 402 476 8%
Balance -241 -242 -252 -300
Source: Waste Management Division, DCC
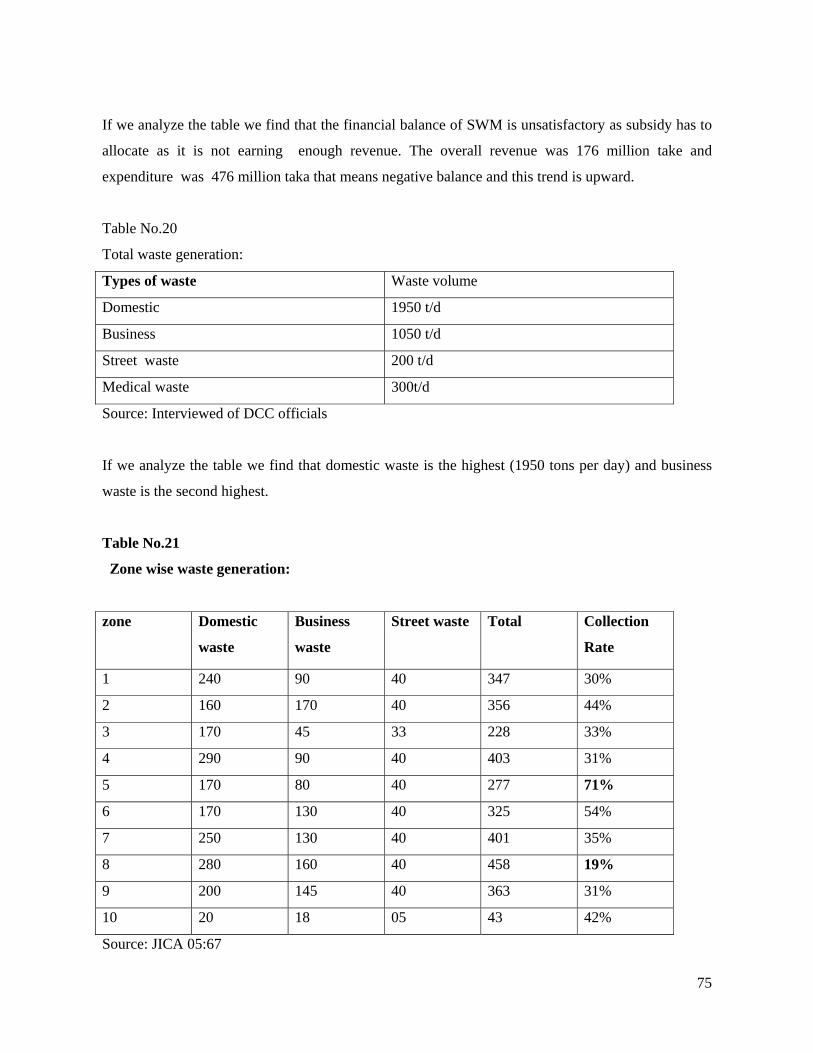
75
If we analyze the table we find that the financial balance of SWM is unsatisfactory as subsidy has to
allocate as it is not earning enough revenue. The overall revenue was 176 million take and
expenditure was 476 million taka that means negative balance and this trend is upward.
Table No.20
Total waste generation:
Types of waste Waste volume
Domestic 1950 t/d
Business 1050 t/d
Street waste 200 t/d
Medical waste 300t/d
Source: Interviewed of DCC officials
If we analyze the table we find that domestic waste is the highest (1950 tons per day) and business
waste is the second highest.
Table No.21
Zone wise waste generation:
zone Domestic
waste
Business
waste
Street waste Total Collection
Rate
1 240 90 40 347 30%
2 160 170 40 356 44%
3 170 45 33 228 33%
4 290 90 40 403 31%
5 170 80 40 277 71%
6 170 130 40 325 54%
7 250 130 40 401 35%
8 280 160 40 458 19%
9 200 145 40 363 31%
10 20 18 05 43 42%
Source: JICA 05:67

76
If we analyze the table we find that DCC is divided in to ten zones and zone 5 has the highest
collection rate(71%) and the lowest is in zone 8(19%).The main reason for highest collection rate is
as many CBOs and NGOs are working there for primary collection.
Table No.22
Assignment and number of cleaners and drivers
Workers
category
Assignment
area
number Total number Age
DCC worker 6,992 (6.880 cleaners are deployed to Zones and Wards
15~24=15%, 24~44=61%, 45~54=20%, >55=4%. Over 64 years = 1.43% (about 100 cleaners). There is no retirement system for Cleaners, so they could spend all their life doing this kind of work. There are many old cleaners in the Road Cleaner group. Comparatively Truck Cleaner and Container Cleaner are
younger than
Road Cleaner.
Road cleaners ward 5003
Deep drain
cleaners
zone 284
Storm sewage
cleaners
zone 119
VIP road
cleaners
Zone 178
Market cleaners Zone 425
Other cleaners Zone 19
Truck cleaners Zone 663
Special truck
cleaners
Zone 189
Container
cleaners
central 112
Truck driver ward 266 Most of them (76%) are between
25-44 years old Container
driver
Central
Private worker Zone 9 & 10 578
Road cleaner 359
Deep drain 86

77
cleaners
Truck cleaners 106
Truck driver 27
Source: Conservancy Officers of Zone Office,
If we analyze the table we find that total number of cleaners in eight zones is 6880, on the other
hand this number is only 578 in two zones. The average number of cleaners for each zone is 860 (
for 8 zones) while this number is only 289( for zone 9 &10). The reason behind is the latter zones
have been privatized and the former zones are not.
Table No. 23
Deployment of cleaners by zone
Symbol A B C D E F G H I ZONE no Road
cleaner
Truck
cleaner
Draincc
leaner
Storm
sewer
cleaner
VIP
road
cleaner
Market
cleaner
Special
truck
cleaner
Other
cleaner
total
10 65 27 24 0 0 0 0 0 116
9 294 79 62 0 0 0 0 0 445
8 465 33 40 0 20 15 20 0 593
7 460 33 40 0 20 7 19 9 588
6 586 141 25 39 36 132 18 0 977
5 633 121 48 13 50 97 40 10 1012
4 832 129 44 17 40 49 18 0 1129
3 565 71 32 12 4 15 8 0 707
2 681 65 25 25 0 78 8 0 882
1 781 70 30 13 8 32 58 0 992
DCC
cleaner
(zone 1-8)
5003 663 284 119 178 425 189 19 6880
Grand total 5362 769 370 119 178 425 189 19 7441
Source: JICA,05

78
If we analyze the table we find that total road cleaners in zone 1-8 is 5003 while this number is (
zone 9 &10 ) 315. The average is(zone 1-8) is 625 while it is only 157 (zone 1-8).The number of
other cleaners is also more in zones where primary collection is not privatized.
Table No. 24.
Service charge for door to door collection (per month – taka)
Income Area Service charge( per month –
taka)
High Gulshan ,Banani (ward-19) Hotel (500-1000)
Resident -rich( 100-300)
Middle and low Khilgoan(ward-23) Resident –
middle-30
Low -10
Middle and low Mirpur (ward-6) Resident –
middle 40
Low- 20
Industry – (100-500)
Source: interviewed of households
If we analyze the table we find that the households are willing to pay service charge and the positive
sign is that low income people is also willing to pay. Middle income people are playing important
roles as they are more aware and are forming CBOs in their respective area.
Medical waste management Medical waste is considered as the worst form of hazardous waste, which requires specialized
treatment and proper management for safe disposal.
According to Dhaka City Corporation's (DCC) Solid Waste Management Division, the volume of
total solid waste generated in the city is around 3,500 metric tons a day of which around 50 metric
tons are from healthcare facilities. There are various types of medical waste.
1.GeneralWaste

79
2.Liquide Waste
3.Infectious Waste
4.Plastic Waste
5. Sharp Waste
Table No: 25
.Average medical waste generation volume :
Types of waste Amount (percentage)
General waste ( kitchen waste,medicine box) 77.45
Infectious waste( cotton, bandage,amputed
body parts, placenta,blood of urine bags)
14.08
Plastic waste( syringe without needle,saline
bags,gloves)
3.83
Liquid waste( blood,laborotary chemicals) 3.4
Sharp waste(needle,blade,knife,vial ampoule) 1.24
Source: JICA ,2005
There is no updated information about the existing healthcare facilities. According to the health
ministry, there are only 368 registered clinics in the capital and 845 outside Dhaka. The number of
diagnostic centres is 1,541 of which 580 are in Dhaka city.
However, the number is far more than that as many hospitals continue to run without registration,
sources at the Directorate General of Health Services (DGHS) said.
Hospital wastes that are segregated at sources, more or less, are normally discharged to a public
dustbin in which wastes are mixed with general municipal waste. The wastes discharged and stored
in the dustbin are eventually scavenged by a waste pickers to recover recyclables. Remaining wastes
are collected by DCC waste collection fleet for a final disposal, mostly land disposal, at official or
unofficial dumpsites.

80
According to Dr. TariqBin Yousuf ,Project Director (Matuail Landfill) Dhaka City Corporation,
Medical waste volumes are as follows:
Table:26
Health care waste and its generation:
Forms of medical waste volume
Infectious, Harmful, Toxic & hazardous 10%-30%
General waste
70%- 90%
waste generation rate 1.9 kg/bed/day
Hazardous(Average) 0.169 kg/bed/day
Some good initiatives in HCW Management after 2005:
Recently Bangladesh government has introduced medical waste handling rules for all health care
service centres which is mandatory for all hospitals, clinics and other health care establishments.
•In-house segregation and storage in colour-coded bins
•DCC allocated 0.4 hectare land for final management
•HCEspay service charges
According to this handling rules each and every hospital and clinic has to segregate own waste in the
following ways:

81
1.General Waste (Black Bin) is put on the dcc bin,disposal by dcc
2.Liquid Waste (Blue Bin)discharged in to the drain and managed by biological system by the
respective health care establishments.
3.Infections Waste (Yellow Bin)
4.Pl astic Waste (Green Bin)
5.Sharp Waste (Red Bin)
Above the three collected by PRISM Bangladesh in three Separate color bin. Finally infectious waste
is disposed through autoclaving, burial and incineration.
New Approach of Medical Waste Management( PPP) in BANGLADESH
PRISM (Project in Agriculture, Rural Industry, Science and Medicine) Bangladesh, a reputed
national NGO in Bangladesh, is now working for medical waste management in association with the
DCC. With financial and technical support from Water and Sanitation Programme (WSP),PRISM
Bangladesh carried out a survey on the medical waste management in Dhaka City. Subsequently,
PRISM Bangladesh with the financial support from Canadian International Development Agency
(CIDA) has recently developed a disposal facility for low cost medical waste treatment and
management in Dhaka City.
The DCC has allocated one acre (0.405 hectare) of land in Matuail, a dumpsite near the city limit for
the final disposal of medical waste. .In the new approach, PRISM Bangladesh is involved in training
relevant personnel of different HCE for increasing awareness and proper in-house management of
medical wastes.
Bangladesh has developed a system for collecting segregated hazardous wastes (except radioactive
wastes)from each HCE through newly set up vehicles to carry this waste for final dumping at their
newly developed Matuail Plant. It has introduced in-house storage of medical waste in colour-coded
bins. All of the HCE should now be using the Government of Bangladesh (GoB) approved colour-
coded high density polyethylene bags for easy identification and segregation of infectious and non-
infectious medical wastes. This minimises the actual volume of potentially infectious medical waste
and makes the disposal less costly and more effective.

82
HCE in Dhaka City are paying a service charge for the collection from their premises and final
managementat the Matuail plant. Even govt. hospitals are not under the initiatives, but now these
hospitals have a fund subsidies by govt. a management committee is there to supervise the works.
To protect resale and reuse of syringes ,both manual and electric needle destroyers have recently
been introduced to different HCE to cut needles from syringes to protect against HIV and Hepatitis
viruses. A small effluent treatment plant has recently been constructed to treat the waste water
generated in the plant. One heavy duty autoclaving machine has recently been installed for sterilizing
cotton, gauge, bandage and such other contaminated materials. These sterilized materials are mixed
up with the general civic waste for disposing in DCC dumping area. An incinerator donated recently
by a Japanese organisation is installed at the Matuail plant. The use of an incinerator treats a large
amount of waste as well as reduces the volume of waste considerably
(http://www.biomedcentral.com)en
Recent developments
Government hospitals are entering into the system. Rules for medical waste management have been
introduced drafted. Decision has been made to introduce medical waste management course in
Medical Education Curriculum.

83
Figure: 8 At a glance PPP in medical waste management:
Ward-Wise Waste Management Project (PPP initiative)
Objectives
To provide superior quality of service to the residents
Waste generate points
segregate
General waste
Liquid waste Blue bin
Plastic waste Green bin
Sharp waste Red bin
Infectious waste Red bin
Road side Dcc bin
Discharged into drains managed by biological system
Collected by Prism Bangladesh in separate color bins
Final management Infectious waste
Sharp waste
1.autoclaving 2.burial 3.incineration
1.chemicaldisinfection 2.shredding 3.recycling
1.auto claving 2.burial
Dcc (final disposal)

84
Project Area 8 Wards
Zone 9: Ward 17, 18, 19, 20, 21, 37, and 38
Zone 10: Ward 1
Responsibility of private Parties
1.clean all roads, market, park, footpaths, etc
2. clean all open and closed drains.
3.clean the surrounding area of dustbin and container
4.Dump the waste at landfill site (Matuail)
Roles of DCC:
1.conservancy supervising inspectors and conservancy inspectors of Zone 9 and Zone 10 of DCC
gave practical training to the cleaners.
1. 2.DCC gave practical training to the contractors.
2. 3.Monitor their activities
3. 4.Send performance report
Source: Urban Planning Dept., DCC
Area based solid waste managementin Dhaka ( PPP)
To encourage area based is the main objective of DCC and JICA Study Team according Clean
Dhaka City Master Plan . This initiative has been launched based on the growing demands of city
dwellers in each and every ward so that waste can be managed socially and economically accepted
way through their active participation and empower them. According to DCC rules, it is the
responsibility of waste generator to dump waste into the DCC bins/ containers..To achieve the
objective DCC is working with a view to include all stakeholders in this purpose.
What is area based SWM?

85
Coordination between DCC and organizations involved in primary collection from door to door by
the community people, local level planning and implementation of such plans by them in order to
keep their respective area clean and environmentally sound, is called area based swm. It is a
endogenious initiatives and main objective is to include all stakeholders involved in it. The main
focus is at micro level and each ward is the focal point.
Objectives:
1 Area based planning and implementation by the community groups in each ward.
2.Effective coordination and enhance efficiency in quick transport of solid waste.
3.Ensure hundred percent collection. With a view to it,bring all small shops, slums and dense area of
narrow roads under sw collection.
4.Increase civic engagement of citizen.
Figure: 9
DCC(SWM division)
Advisers Board CCO Male wc Female wc Zonal executive officer
Organizations(primary collections)
SWM committee in Ward level
Community Unit group members

86
Members of Community Unit Group:
1.Voluntary workers
2.Professional grorups( religious leaders, teacher,)
3.Retired person
Why it needs?
1.To refrain from throwing waste around dcc bins/containers
2.To refrain from throwing waste in roads
3.To refain from throwing waste in drain
4.Ensure house to house collection
5.Increase consciousness among citizens
Roles and responsibilities of partners in area based solid waste management:
Ward Solid Waste Management Committee:
1. evaluate primary collection service providers by having an interview with each of them. The
evaluation criteria will cover the following:
• Financial capacity
• Management capacity
• Acceptability by community people
• Attitude of cooperating with community people
• Understandings of local conditions
2.Coordination and agreements would be made among Ward Solid Waste Management Committee,
primary collection service providers and DCC
3.Organize regular meetings with primary collection service providers regarding the daily activities
of primary collection. DCC Conservancy Inspector and staff of Community Solid Waste
Management Section, and Community Coordinators of Zone offices should also participate in the
meeting.

87
Community Unit Working Group
1.Supervise the activities at the community level by observing and getting the opinions of
community people.
2 .To increase public awareness in Dhaka City, the following should be implemented: There are
various target groups for raising awareness of solid waste management such as aged and young
persons, men and women, of different education and income levels.
Conservancy Department of DCC
1. Make efforts toward supporting primary collection service providers technically in order for them
to improve their capacity and to provide proper and efficient primary collection services in Dhaka
City.
2.Make continuous efforts to develop and improve the primary collection methods considering
local conditions, in order to improve the efficiency of solid waste management
3. Examine and develop the methods of primary collection and linkage with
secondary collection, in order to improve the efficiency of primary collection.
4.At present, transfer of waste from rickshaw vans to containers takes time and the waste scatters
around containers. DCC would conduct pilot projects to introduce new design of rickshaw vans and
containers
5. Organize annual conference inviting primary collection service providers to share their work
experiences and problem-solving, and to discuss how to improve the primary collection technically
6.Solid waste matters cover Environmental subjects. Matters regarding solid waste should be taught
by showing real situations and their relation with other daily activitiesMost of school teachers are not
competent to teach about solid waste, because they do not have proper knowledge of solid waste and
have never visited solid waste management facilities
Figure: . At a glance ppp in ward wise solid waste management:

88
Scenerio after inception of PPP in SWM in Dhaka City
In 2005, DCC privatized conservancy works in zone 9 and 10. According to officials of DCC, due to
privatization cost has been reduced drastically, though service quality is not improved as it was
expected. According to JICA Study Team, for cleaning of roads/drains and public spaces, DCC
deploys about 7,000 cleaners in eight zones while private firms deploy about 600 cleaners in two(
9&10) zones. A remarkable feature of DCC cleaners is the working hours; they work on average 4
hours with minimum 2 hours while private cleaners work on average 6 hours with minimum 4 hours.
This study reveals that productivity of workers is increased under PPP. SWM cost is also reduced.
According to Conservancy department ,the salaries of DCC cleaners is in average Tk.5000, on the
other hand in private cleaners salary is Tk.1500- 2000. They working on temporary basis, while the
most of the DCC cleaners are permanent and they get house allowance along with gross salary .The
statement indicates drastic reduction of cost in swm.
Table No.27
Comperative Study regarding working hours of DCC and private cleaners
Working period(hours) DCC cleaner(percentage) Private cleaner (percentage)
House Van
Responsibility of community,CBO/NGOs
DCC bin/container Dump waste to
Responsibility of
primary cleaners
Transport by DCC
Dump in landfills

89
7-8 0.7% 25%
6-6.5 15% 46.9
5-5.5 9.3% 21.9
4-4.5 45.6% 6.2
3-3.5 22.9% -
2-2.5 6.5% -
Starting time of work
At 4.00 a.m 32.8
At 5.00 a.m. 50.7
After 6.00 a.m. 16.5
Average working hour 4.12
Duration of working hour
Maximum 8 hours (6 a. m. -14 p.m) 8 hours (6 a.m. -11a.m.&14
p.m.-17 p.m)
Minimum 2hours (7 a.m. -9 a.m) 4 hours (6 a.m. -10 a.m.)
Source: JICA 05:67
If we analyze the table we find that the productivity of DCC workers is far less than the private
cleaners. 25% private workers work 7 to 8 hours while the percentage is less than one in DCC
workers.About 45%DCC workers work 4 to 4.5 hours while this percentage is only 6 in private
workers.
Table No.28

90
Comperative data of road cleaners and other cleaners
Road cleaners Garment factory workers
DCC Private Machine operator Assistant
Salary Permanent workers –
tk.4000, (who have
working experience
not less than 10 years
Tk.5200/ who have
working experience
not less than 20 years
Tk.2500/tk.85/day(
for temporary
workers)
All are
temporary
workers
Gross
salary per
month
tk.1500-
2000
Tk.3000/
Tk.1500/
Restraint time
hours
4 -5 5 -7 08 08
Housing
allowance
Tk.275/for
permanent workers
No house
allowance
No house
allowance
No house
allowance
remark Tk. 5000 -7000
including earnings
from second job
- Tk.4000
including 3 hours
overtime
Tk. 2500
including 3 hours
overtime
Source: JICA 05:56
If we analyze the table we find that though the productivity of DCC workers is far less than the
private cleaners but they get more salary than their counterparts. The above data shows the cronic
mismanagement of resources of DCC
Public private Community Partnership

91
Time has not come to evaluate but it can be said that this kind of partnership includes all kinds of
stakeholders, primary collectors to community leaders such as male and female ward
commissioners, religious leaders , members of civil society would be fruitful if the roles and
responsibilities of each and every partner is assigned clearly.
A Case study of SWM in ward -5
Bouniabad area is located in Mirpur under ward – 5. There are three to five big slums and the
number of slum dwellers is around ten thousand. They work as day labor, waste pickers etc. DCC
does not provide civic services to this area as they are not tax payer. The significant thing is that
these low income people show civic sense though DCC’s services is not there. with the help of local
NGOs involved in primary collection , they have established a strong sense of SWM. They put
wastes in their household bins or pots. NGOs collect wastes and dump near and there around the
Berri band area. All tiny homes are adjacent but you do not find any waste here and there within their
living area. They are also involved in recycling activities . The encouraging fact is that Most shops
have a small bin infront and put business waste in it. They do not throw them in the roads.
Comperatively the area is clean. But there is no direction from DCC about where the waste should be
dumped. So NGOs dump the collected waste inside which is alarming as it mixes directly with water
bodies which house fishes and other animals living on it. A section of slum dwellers backing with
local politicians dump waste beside the band and build illegal makeshifts on it. In thus way
government land is being grabbed and water bodies are polluted. If there was any partnerships
between NGOs and DCC , it is expected that most wastes would be collected by DCC . At least some
bins or containers are there. DCC could collect and dump waste. Building partnerships both parties
would be benefited. The indicators of urban governance through which it is measured, at least
covering most of them. As a result , access to civic activities by ultra urban poor and participation of
women could be ensured and equity had been maintained.
Limitations of DCC regarding SWM

92
DCC has nineteen source of income of its own but four or five of them contribute around sixty five
percent of total earnings. Holding taxes are fifty five percent of DCC revenue earning. Most of
revenue expenditure is incurred for salaries and wages. The own source of income.e for the year 01-
02 was tk.1557.2 million and other source was tk. 540.5 million. The subsidy from Government for
the last five years is increased from 25.77% to 38.43% (Islam 2003:67 )
DCC charges conservancy tax of 2% based on property’s rental value. The expenditure of swm is
52.87% more than the income . The per capita expenditure for swm in Dhaka is very low (Tk.53)
compared to other Asian cities such as Bombay Tk. 304, Manila Tk. 192 and Bangkok tk. 84 (
Enayetullah, 1995 :78)
DCC spent 15.42% of the total annual expenditure for SWM ( Yousuf 1996:38). The cost of per ton
swm is 930 Tk.(JICA 2005:87). DCC is functioning on the basis of ordinance of 1983. It has no
specific clause or section for industrial or medical waste storage, handling collection, disposal either
by DCC or any other authority. Recently Ministry of Forest and Environment introduced Medical
waste handling rules .Necessary bylaws have not been yet introduced on standard of refuse quality
and details of punishment of any offence detected by DCC mobile court. According to
Environmental Conservation Act 1995, each and every industry has to ensure inhouse waste water
treatment facility. With a view to it, Effluent treatment plant must be set up by the industry. Ministry
of forest and environment is the regulatory authority to super vise the rules is obeyed or not. But
there is no effective coordination among DCC, MoFE and other concerned organizations.
The sources and resources in relation to income of municipality are left exploited. The tendency of
evasion of holding tax by the city dwellers and large scale commitment of the elected representatives
are the main reasons of poor financial condition of DCC(Huda 07:101) .The assets of DCC are not
well managed well and it creates artificial impediment on the of its self- sufficiency. so DCC has to
depend on the subsidy of central govt. and support of donor agencies. Concervancy department gets
more or less 2% of DCC’s total budget. This small portion of allocation cannot meet the recurring
and non recurring expenditure of SWM of DCC .(Huda 07:45)

93
The Mayor of DCC in meeting expressed discontent for very low level of taxes earmarked for
conservancy work of the city of Dhaka. DCC has to provide huge subsidy from its annual revenue
income in SWM .Forty one percent people live in slums as they are not under tax net, DCC is unable
to lend civic service to them due to financial constraint .According to DCC Ordinance, assessment of
tax has to be made in every five years but since 1985 ( inception of ordinance) no holding tax
assessment is done.
There are 26 heads of taxes under schedule of the DCC Ordinance (Huda 07:67). Many of these
heads are left untouched from tax collection for an example from markets, bill boards, non motorized
vehicles, community centers etc.. In this way DCC deprives of its legitimate income from various
sources.
Very low productivity of conservancy workers creates pressure on the weak revenue of DCC. There
are many factors responsible for low output. Recruitment of more workers beyond requirement,
payment to ghost workers , engagement of bodli ,low level of wage are the main reasons .
DCC is empowered to enroll only waste workers or sweepers or cleaners on a temporary basis
without sanction of prescribed authority. The municipal authority found misusing of power by
recruiting huge number of waste workers beyond actual requirement, as a result productivity is low
(Huda 2007:90). A good number of sweepers or cleaners serve as maids or servants in ward
commissioner and senior officers at their residents. They also draw wages and benefits from DCC.
Actors and factors in solid waste management in Dhaka City
There are some differences regarding actors role in developed and developing countries as social ,
political, economic conditions are not same. Where informal sector plays significant role in
developing countries , formal sectors are main actors in developed countries. Actors in solid waste

94
management both in developed and developing countries are more or less same.Differences happen
in playing their roles.
Actors inSWM in Dhaka city
1.Mayor: Mayor is the peoples representatives who is elected by popular vote and he/she is the chief
officer of Dcc.He is the key actor who plays most vibrant role in policy formulating .He formulate
policy to manage solid waste.
2.CEO: Chief Executive Officer is the key actor in policy executing and he is accountable to Mayor
directly.CEO is a senior(Joint Secretary) level bureaucrat of the Government .
3.CCO: Chief Conservancy Officer is the head of conservancy department that is entitled to manage
SWand he is the chief policy executing officer regarding solid waste in DCC.
4.CBO: Community based organization plays significant role in primary collection of solid waste as
DCC ,s responsibility is secondary collection,transportation and disposal. According to DCC rules,
it is citizen’s duty to bring their waste in dcc provided bins. So community’s role is crucial. CBOs
are emerged as the growing demand of citizens for door to door collection.
5.Ward Commissioner: He is elected through popular vote and his jurisdiction is within the ward.
According to Clean Dhaka city Master plan prepared by JICA supervised by DCC, WARD
commissioner is the head of community motivational programs and his role is vital in primary
collection which is the core component of urban swm.
5. Household: Households are key actors in primary acollection as well as overall swm.They are key
stakeholders in sw related policy formulation and execution.Environmental conservation is mostly
depends on their role
6. Business Community :They also play role in swm.It is the civic duty of each and every
industrialist to keep their environment sound. According to DCC, there are –markets and industrial
waste accounts for roughly 23 percent. According to Environmental Conservation Act,1995 , each
and every industry has to set up effluent treatment plant(ETP) to treat waste. But this is not followed
by most of the industrialists. Though their role should be motivating to conserve the environment.
7. Waste picker: For the urban poor in developing countries, informal waste recycling is a common
way to earn income.They are informal actors in swm. At present DCC has no recycling project and

95
15 percent waste is recycled by them .Waste pickers role is important not only in Bangladesh but
also in all developing countries due to social, economic context of the world. In developing countries
about 1 percent of the urban population—at least 15 million people—survive by salvaging
recyclables from wastes. For instance, over 20,000 women work as paper pickers in Ahmedabad city
(Salahuddin & Shamim, 1992).It has been estimated that up to 150,000 waste pickers are active in
Municipal Corporation of Delhi area (UNEP 2005).
In fact, all cities in the developing world have a sizeable population that ekes out a living from
picking waste generated by their wealthier neighbours. This is the most vulnerable and marginalized
group that comprises mostly of women and children.
Factors in Solid Waste Management:
Solid waste management is considered to be a multi-dimensional issue due to the variety of factors
involved. Such factors indicatively include technology issues in respect to environmental
performance and output, issues of strategic and political policy and planning, public awareness and
social maturity questions, as well as issues of financial viability. Factors can be divided into the
following categories irrespectively economic context.1.social factors 2.economic factors
.Social factors:
Attitude towards waste: The residents of Dhaka city are heterogeneous in character in respect to
their social and economic status. We can classify the people living in Dhaka into three broad
categories depending on economic parameters. These are 1.Upperclass 2. Middle class 3. Lower
class.Upper class people depend on their servants for solid waste disposal, so they do not have any
headache where servants are putting waste,in dcc bins or not. Middle class people try to ensure to
make their homes and surroundings clean but they have little interest about where CBOs dispose
their waste. A very few people whom we can call as civil society , have access to seminar,
workshop,conferences etc. on proper SWM but they donot share their knowledge with other sections
of society. One example is establishment of dairy farms within DCC area. According to DCC
ordinance, dairy farms are prohibited within DCC area but such dairy farms had been found in the
campus of Parliament house, residential area of Dhanmondi, Uttara, Mirpur and other similar
important areas where most of civil society members and senior citizens live. According to Huda

96
(2008 :235), ex CEO, DCC , there are more than one thousand dairy farms in the city without lawful
authority.
Littering: Littering is defined as things scattered about or left in disorder, espically in public places
or outdoors in a messy state(Huda 08 :235). According to WHO, 1996, no littering is far better and
cheaper than cleaning up. Some author argue(WHO) that the rural urban migrate people who are not
aware of disciplines of city life. But this not fullytrue. The elite and educated citizens are not less
responsible. Many of these people have opportunity to visit developed countries and seen the
disciplined attitude of city dwellers. But they did not practice it in their home country . They throw
trashes from running cars, leave empty packets re and there though they know it is the violation of
law.
Littering Human excreta: More than two billion are without any form of improve sanitation in the
world.Only 1.1 billion of total six billion have their sewage treated in an environmentally acceptable
way. It means that the excreta from 5.9 billion are discharged in to the environment , on the land and
to the water bodies(Sabur,2007). About sixty percent of the total population of Bangladesh can’t
afford to sanitary latrines of any form. About forty one percent of urbanpopulation of Bangladesh
lives in slums and squatters . Only fourteen percent of them access to sanitation .According to Huda
(2008:245) this 85percent of 41percent slum dwellers in Dhaka city make natural call on open
space. The solid portion of human excreta deposited throughout Dhaka city in a day is about 375
metric tons.
Economic Factors:
1. Budget Constraints: DCC budgeted Tk 2,670 million of their own account for financial year
02/03. The problem of finance is that revenues collected were only 70% of budgeted amounts, on
average, from 2000-01 to 2002-03. This income gap compels DCC to squeeze its expenditures
except for salary/wages.
The major source of revenue is holding tax that accounts for 63% of revenue.in 2001-02,total SWM
income was 150 million and expenditure was 402 .on the other hand, in 2002-03 it was 176 million
taka and expenditure was 476million. Budget deficit is 300 million taka . This statements shows that
DCC suffering from the cronic budget deficit .Fifty to sixty percent income is spent on salaries of
staffs for swm. Only twenty to thirty percent revenue spent on waste collection, transportation and
disposal. The Asian Development Bank (ADB 2001:72) estimates that urban authorities in Asia

97
spend 50%-70% of their total revenues on waste management. In a separate study by the World
Bank, neglect of the environment is calculated to cost an average of 5% of gross domestic product
(GDP), while government spending on environmental protection amounts to less than 1% of GDP!
(3R practice in east and south-east Asia, Waste Management World - September, 2007. available in
www.3rkh.net)
2. Income level of citizens:
41% percent of total city dwellers who live in slums are out of tax net of DCC. This statement shows
that DCC does not provide swm service to the majority segment of population.As this low income
people do not pay tax , they deprive of sanitation and urban services which indicate poor governance
of urban authority
Other factors :
Cleaners and Drivers association: According to high officials of DCC, it is the vital factor in
managing waste. The total number of cleaners in DCC is not less than seven thousand and this huge
number of workforce is unproductive as most of cleaners are aged. They do not work properly but
authority can not take stern action due to strong stand of their associations. They are not motivated
to discharge their duties. When authority wants to take stern action against them ,they protest in the
banner of their association and stop work that means waste remains uncollected. They also put
political pressure on DCC officials . So authority can not take any decision against them.
Conclusion: The next chapter will deal with analysis based on primary and secondary data
that was collected through interview, questionnaire and case study. It also focuses on
potentialities of PPP in SWM and analyze how it can be replicated in other sector. Finally a
concrete conclusion along with some specific recommendations is also presented.

98
CHAPTER –5
Analysis and Conclusion
According to Waste Management Division of DCC in 2002/2003, solid waste management
expenditure was 476 million taka and revenue earning was176 million taka.Overall Budget deficit
was 300 million taka that means DCC has been suffering from cronic budget deficit.
DCC is divided into ten zones and out of ten zones ppp has been introduced in two zones ,
zone9&10. In 2003, due to PPP, cost was reduced drastically. Before introducing ppp, yearly SWM
cost was in these two zones, was 53 million taka and after inception of ppp in 2003 av erage yearly
cost was 37 million taka. The difference was 16 million taka that means ppp not only reduced cost
cost but also ensured efficiency of service delivery. According to a Study launched by JICA,2005, 45
percent DCCworkers employ labor only for 4 to 4.5 hours while it is 6 to 6.5 hours for private
workers. Though DCC workers paid more than private workers, they work less.
As I mentioned earlier due to partnership with private organization, cost has been reduced and this
model of PPPis sustaining. Since Conservancy department has been suffering budget deficit and not
able to ensure 100% waste collection and disposal,PPP is an excellent option DCCto its SW business
smothely and ensure environmental sustainability. Through PPP DCC can provide civic service
effectively and enhances
Workers productivity. It also lessens maintenance cost of vehicles.
Table No.29
Cost Reduction through PPP( Million taka)
SWM in 8 wards(Zone 9&10) Cost
Dcc own cost 53.1
Private Organizations 37.0
Average cost cut 16.1
Source: JICA 05:78

99
According to the above table, we find that average cost TK.. Sixteen million taka had been reduced
in 2003 in eight wards of zone 9&10 due to partnership between private and public organizations.
Before 2003, the annual SWMcost was 53.1 million taka and after privatization it took only 37
million taka to manage the whole task.
Table No. 30
Breakdown of cost cut ( Million taka)
Cost Items a.DCC(taka million) B.Private
organizations(taka
million)
Cost cut = a-b
Personnel 27.5 16.7 10.8
Fuel 9.0 6.4 2.6
Others 16.6 13.9 2.7
Source:JICA 05:56
The above table revealed that majority of the personnel cost that was derived from cleaners’ salary
of Tk. 10.0 million as shown in Table. Further broken down the cost into 2 factors: Tk. 3.3 million
by downsizing the number of cleaners and Tk. 6.8 million by downsizing the cleaners’ salary. Thus,
it is quite obvious that the lower level of cleaners’ salary of private organizations is a major
contributor of cost cut by privatization
According to Waste Management Division of DCC in 2002/2003, solid waste management
expenditure was 476 million taka and revenue earning was176 million taka.Overall Budget deficit
was 300 million taka that means DCC has been suffering from cronic budget deficit.
DCC is divided into ten zones and out of ten zones ppp has been introduced in two zones ,
zone9&10. In 2003, due to PPP, cost was reduced drastically. Before introducing ppp, yearly SWM
cost was in these two zones, was 53 million taka and after inception of ppp in 2003 av erage yearly
cost was 37 million taka. The difference was 16 million taka that means ppp not only reduced cost
cost but also ensured efficiency of service delivery. According to a Study launched by JICA,2005, 45

100
percent DCCworkers employ labor only for 4 to 4.5 hours while it is 6 to 6.5 hours for private
workers. Though DCC workers paid more than private workers, they work less.
As I mentioned earlier due to partnership with private organization, cost has been reduced and this
model of PPPis sustaining. Since Conservancy department has been suffering budget deficit and not
able to ensure 100% waste collection and disposal,PPP is an excellent option DCCto its SW business
smothely and ensure environmental sustainability. Through PPP DCC can provide civic service
effectively and enhances
Workers productivity. It also lessens maintenance cost of vehicles.
PPP in SWM : Some potentialities
CDM is the only flexibility mechanism that involves developing countries (Non- Annex B). It
allows developed countries (Annex-B) to achieve part of their reduction obligations through
investment in projects in developing countries that reduce GHG emissions or fix or sequester carbon
dioxide from the atmosphere.
What is Clean Development Mechanism (CDM)?
CDM( Clean Development Mechanism) : According to Kyoto Protocol Annex B countries have to
reduce 50 percent GHG reduction in 2008-12 compared to 1990. So Annex B countries are buyers
and Non Annex B countries are sellers. Market.Through CDM projects industries in developing
countries can be technologically upgraded and made environment friendly thus contributing to global
climate protection as well as promoting sustainable development in the host country. The
industrialized countries' investing entities can earn credit for emission reductions achieved through
its investment in developing country towards its own emission commitment.
Potential Sectors for CDM Projects in Bangladesh are
1.Energy, both supply side and demand side.
2. Waste
3. Forestry
Kitchen Waste:
There are twenty seven kitchen markets authorized by by DCC( Ittafaq, 8th june,09) . About one
hundred twenty such kind of markets are flourished privately without prior approval of DCC.

101
According to researchers, these one hundred forty seven markets produce ten tons of kitchen waste
everyday. The mentioned amount of waste which dumps in the DCC dustbins and the buying and
selling of these dustbins is a lucrative business for middlemen specially cleaners. A handsome
amount of transaction had been occurred last year, approximately three hundred sixty crores and fifty
lac taka. (The Daily Ittafaq,8th june,09). About twelve dustbins are put in Karwan Bazar which
produces the largest amount of kitchen waste of the said amount a nd each and every dustbin is sold
three to five lac taka every year. Dustbins are sold in daily basis yearly transaction is more or less
forty to sixty lac taka. The amazing fact is this large amount of money does not go to government
exchequer as middlemen like drivers, cleaners are invlolved in it. They do not dump in landfills
rather sell it in the market as it has economic value.
If PPP is entertained in this sector, DCC would be benefited in many ways such as financially and
able to overcome budget deficit in SWM as it is suffering. DCC can provide civic services to urban
poor with this money and improve quality of life of them which ultimately leads to better urban
governance. As this initiative would open up employment opportunities for urban poor, it would
generate income for them specially women. In the long run PPP will help in maintaining
environmental conservation, clean Dhaka city
Kitchen waste as resource
According to environmental researchers, it is possible to produce three tons animal food which
contains sixty percent protein and a lot of calcium using ten tons waste of fishes and other organic
wastes.If PPP is allowed in this sector, it will save foreign currency through decreasing of import of
animal food. Lessen environmental pollution and governance would be improved if transparency,
accountability and equity are ensured.

102
Table No:31
Tangible and non tangible benefits from public private partnership
At micro level At macro level
Provides work and earning opportunity to
the urban poor.
Cleaner neighborhood and streets.
Increases residents’ happiness and
enhances the quality of life.
Reduces municipal cost of garbage
collection and disposal waste.
Save land fill area.
Reduces the quantum of garbage.
Reduces environmental pollution.
Reduces other environmental costs
proper utilization of land
Reduces blocking of drains and sewers.
Improves sanitation.
Increases the aesthetic beauty of city.
Saves foreign exchange which would
otherwise be used to import expensive
technology and machinery (e.g., including
machine and costly fancy vehicles).
Saves resources which add significantly in
a positive way to sustainable urban
development
Skilled manpower as DCC provides staff
under PPP and enhances motivation of
staff.
Strengthens institutional capacity of DCC
and effective , efficient Urban governance

103
What about Matuail?
A master plan on solid waste management has been formulated in 2005 with a target year of 2015 to
make Dhaka City clean (JICA 2005:23). The master plan is emphasized on public awareness,
primary waste collection, transportation, final disposal as well as administration and financial
management. As part of the implementation of the master plan, Dhaka City Corporation has
constructed the first ever sanitary landfill in Bangladesh, which has inaugurated on 3rd October,
2007 for full-scale operation. The total area of the landfill is about 40 hectare; out of which on an
area of 20 hectare a 15 years old open dump is situated, and which has been converted into
controlled landfill through this project. The additional 20 hectares is an extended part which has also
developed for future landfilling. The total project cost is 466.3 million taka (7 million US $), which
has been allocated through JBIC (Japan Bank of International Cooperation) JDCF (Japan Debt
Cancellation Fund). The project was started in July 2005 for a two years period. Major sanitary
landfill components introduced under the Project were the leachate collection and gas venting
system, surface drainage improvement, systematic operation of waste by daily covering, slope
reformation, working roads, weighbridge operation, and vehicle washing facilities. A semi-aerobic
landfill system has been adopted to reduce the polluting load on the environment and speed up the
stabilization of the disposed waste. A perforated pipe network for leachate collection and gas venting
arrangement has been installed for proper collection of the leachate and provision of air supply
system. Periodical monitoring of the environmental parameters of the ground and surface water,
leachate quality and landfill gas is introduced as part of the operational measure of the sanitary
landfill
Conclusion and Recommendations The main purpose of my study was to understand the citizen’s perception on the SWM problem of
their locality and to see how solid waste is collected cost effectively .I also tried to explore how solid
waste is managed environmentally sustainable and in this regard how PPP helps. Throughout the
chapters I discussed the issues on the basis of my information gathered by means of field
observations, in-depth interviews of my key respondents.

104
Field evidence suggests that urban citizens consider solid waste a major problem of their localities,
but particular emphasis is given to its sustainable management either through building public-private
partnerships or privatising the delivery of conservancy services by means of contracting out its
operation. Common citizens want to pay more for SWM but community initiatives are not at large
stage and governance process is not enough to include all stakeholders.PPP is in a nascent stage and
there are some points of contradictions as transparency, accountability and other good governance
index are not present fully .PPP is the best instrument to minimize cost, to entertain private sectors
to compete with public sector based on comperative advantage what has already found in my
research. It should be encouraged and take some meaningfull initiatives to reduce cost and conserve
our environment healthy.
Solid waste management is considered to be a multi-dimensional issue due to the variety of factors
involved. Such factors indicatively include technology issues in respect to environmental
performance and output, issues of strategic and political policy and planning, public awareness and
social maturity questions, as well as issues of financial viability .Incorporating waste pickers into
waste management and recycling programs can in many cases be socially desirable, economically
viable, and environmentally sound. To do so, however, decision makers need to recognize that waste
pickers can be an asset, and municipalities need to engage with them as potential partners.
The SWM sector in developing countries will face increasing strain under rapidly growing
urbanisation. Alternatives to the present mode of delivering service by the public and private sector
working in isolation may become imperative to maintain a minimum quality of service.
Theoretical and practical considerations indicate that there is a good potential for public–private
partnerships in the SWM sector in developing countries. However, the conventional approach to
public–private partnership in the developed countries, where large conglomerates and government
agencies form alliances, may need to be modified for developing countries. A vertical integration of
SWM services between small-scale operators and the public sector may offer a better choice in these
countries Partnerships will not be effective and sustainable unless there is incentive for both public
and private agencies to enter into it. The following steps should be taken to promote public private
partnership in SWM.

105
Recommendations
1.Private sector should be allowed to earn experiences for handling waste management more
effectively.
2.Detect the loopholes or causes of unsatisfactory performance in the Wards of DCC under PPP.
3.Make the deed of contract process transparent and unambiguous.
4. Deed of contract should be prepared very carefully to avoid any kind of confusion and
contradiction.
5. Experiences of public and private sector in SWM should be replicated in other cities and towns
with necessary adjustments on local context.
6.Reasonble agreement ( market based and maintain equity)between DCC and private organizations
for absorbing the regular employees of the conservancy department with private sector to benefit
from their skills and expertise as well as to avoid sudden unemployed shock.
7.Impose user charge along with existing holding tax. User charge should be less and within the
willingness to pay level of citizens.
8.Take strategic plans to replicate PPP’s success.
9. Stop misuse and pilferage of sources and resources.
10. Evaluation of existing holding tax based on market.
11.Strengthen the capacity of the DCC through knowledge sharing with concern stakeholders.
12. Coordination with concern departments involved in SWM for developing better understanding
and Consensus Building
Conclusion: A new set of incentives must be designed for both private and public sectors. Other
barriers for meaningful partnership include weak structural, financial and legal framework. These
weaknesses provide outlets for lack of transparency, fairness and accountability—the underpinnings
of effective partnership. Repressive regulation or excessive competition may drive out the private
operators. Partnerships must also be dynamic, adjusting to new situations as both private and public
sector agencies evolve in terms of scope and nature. Therefore, the design of a partnership calls for a
balanced and measured approach. There may be a need for a facilitating agency to nurture
partnerships with possible subsidies. Capacity for effecting proper partnerships does not exist in
either public or private SWM agencies in low-income countries. Translating theories into realities
requires research and advocacy, building political will and popular support .Before then, studies
should be conducted to assess the gaps and prevailing situation both in light of demand and supply
side.

106
Bibliography
1.ADB (2001). Asian Environment Outlook 2001. Asian Development Bank, Manila.
.2. Ali, M. (1999). The informal sector: What is it worth? Waterlines,volume 17, pp-10–12.
3.Bhuiyan, M.A.H.,N.E. and Hossain, M.M.(2002),Unplanned Waste Disposal and Its Possible
Impact on Sub- surface Environment of Dhaka City,Bangladesh Environment ,2002,Volume 2.pp.39.
4.Bartone, Carl R., Bernstein, J.D. and Wright, F. 1991. Investments in Solid Waste Management:
Opportunities for Environmental Improvement. Policy Research and External Affairs Working Paper
No. 405,The World Bank, Washington DC.
.5. Brandsma, Erik K. D. 1997. Main Sources and Types of Waste and their Recent Trends. In
Changing Consumption
6.BBS(2003), Bangladesh Bureau of Statistics, Census Report of 2001,Government of Bangladesh.
7.Cointreau, S. J. (1984). `Solid waste collection practice and planning in developing countriespp-
14' Paper read to International Seminar on the Provision of Municipal Public Services in
DevelopingCountries,World Bank.Washington DC.
8.Cointreau, S.J. (1989). Provision of Solid Waste Services in Developing Countries. Paper read
toInternational Seminar on the Provision of Municipal Public Services in DevelopingCountries,
Assenovgrad, Bulgaria
9.Cointreau-Levine, S.J. (1992). Private Sector Participation in Municipal Solid Waste Services
inDeveloping Countries. Paper for the Infrastructure and Urban Development Department,World
Bank, Washington DC.
10. Enayetullah, I.( 1995), A Study of Solid Waste Management for Environmental Improvement of
Dhaka City, Page-65, unpublished M.URP thesis, Dept.of URP, BUET,Dhaka
11. East Asia: Stage Model of Urban Environmental Evolution,International Review for
Environmental Strategies Vol.1, No.1, pp. 135 – 158, 2000.
12..Gutman, P. (1994). Reynosa Municipal Solid Waste Management Alternatives. Draft Report,
World Bank, Washington, DC

107
13. Huda,K.M.N.(2008),Municipal Solid Waste Management, Bangladesh Perspective,pp-
245,Academic and Publishers Library, Dhaka.
.14.(International Conference on Sustainable Solid Waste Management, 5 - 7 September 2007,
Chennai, India. pp.552-559)
15. Islam,N.(2003),Urbanization for Development, pp-23,Published by the Editor from Transcraft
Ltd.Maola Brothers,Dhaka. .
16. Imura, H.; Yedla, S.; Shirakawa, H.; and Memon, M. A (2005). Urban Environmental Issues and
Trends in Asia – An Overview, International Review for Environmental Strategies, Vol. 5, pp. 357-
382.
17. Islam, N.(2005), Dhaka Now : Contemporary Urban Development,Published by Bangladesh
Geographical Society , Dhaka.
.18. Imura, H.; Yedla, S.; Shirakawa, H.; and Memon, M. A (2005). Urban Environmental Issues and
Trends in Asia – An Overview, International Review for Environmental Strategies, Vol. 5, pp. 357-
382.
19.ISSUE PAPER ON:URBAN GOVERNANCE: GLOBAL VISION AND LOCAL NEEDS
ASSESSEMENT, ANALYSIS &ACTION BY CITY GOVERNMENTS, www.unescap.org.
20.Newton, A., Wagenhauser, B. and Murray, J.(1996),Bangladesh – A Lonely Planet Travel
Survival Kit, Facts about the country,Published by Lonely Planet Publication, Austalia
21. OECD,( 1995). Towards sustainable consumption patterns: A progress report on member
country initiatives.pp.-45. Paris. 12.Commission on Global Governance, 1995, pp-12,
.22.Salam, M.A. (2001), Analysis and Design of Solid Waste Management System for A Residential
Zone of Dhaka City,Page-23, M.Sc. Engineering Thesis, Department of Civil Engineering.
23.State of Dhaka Environment Report, 2005
24.Tariq Bin Yousuf (1996); Sustainability of solid waste
25.UNDP(1997), Re-conceptualizing Governance, UNDP, 1997. Page-1.
.26.UNEP (2000) Solid waste management sourcebook, section 2.2, topic e: landfills. Available via
http://www.unep.or.jp/ietc/ESTdir/
27.UNCHS (2003). The Challenge of Slums, Global Report on Human Settlements, United Nations
Human Settlements Programme University of Amsterdam, The NetherlandsGBER Vol. 3 No.1 pp
46-65 .

108
28.World Bank (1999). What a Waste: Solid Waste Management in Asia (Washington D.C.: Urban
Development Sector Unit, East Asia and Pacific Region,
29.World Bank Waste Concern (2005). Available in the website: http://www.wasteconcern.org
30.World Bank(2007), Report on Environment of Dhaka City , Published on August 17 in “The
Daily Janakantha” a National Daily of Bangladesh.
World Resource Institute. 1997. World resources 1996-97: A guide to the global environment. Pp-
89,New York: Basic Books.
31. World Health Organization(1996), HealthyCities- Healthy Islands, Document Series, No. 6,
Guide for Municipal Solid waste Management in Pacific Island Countries
32. www.unhabitat.org.
33. (www.njhazwaste.com/glossary.htm
34. http:en.wikipedia.org/wiki/solid waste)
.35.www.dcc.org.
36.www.unescap.org
37.Xuemei Bai*a and Hidefumi Imura. A Comparative Study of Urban Environment
38.Yoon, Euiyoung. 1996. The Impacts of Waste Facilities on Property Values: An Interrupted Time
Series Analysis of Waste Incineration Plant Siting in Seoul, Korea. Unpublished Ph. D. dissertation,
Cleveland State University
39.Zurbrügg, Christian( 2002),Urban Solid Waste Management in Low-Income Countries of Asia
,How to Cope with the Garbage Crisis ,pp-2, Presented for: Scientific Committee on Problems of the
Environment (SCOPE) Urban Solid Waste Management Review Session, Durban, South Africa,
November 2002,available in www.unhabitat.org.)