enhancing usgs image processing capabilities- the development … · enhancing usgs image...
TRANSCRIPT

Enhancing USGS Image Processing Capabilities- The Development of a Users Guide, Video Tape Guide, and In-house Course Outline for ERDAS Software
By Neil Falcone
Open-File Report 93-676
U.S. Department of the Interior U.S. Geological Survey National Mapping Division

Enhancing USGS Image Processing Capabilities- The Development of: A Users Guide, Video Tape Guide, In-house Course Outline, for ERDAS Software
By: Neil Falcone521 National CenterU. S. Geological Survey, Reston, Virginia 22092
I. INTRODUCTION:
Among its various research activities the National Mapping Division (NMD) of the U.S. Geological Survey (USGS) conducts research to support the creation and management of spatial data bases for new map information. The development of advanced techniques to derive maps from images requires that NMD have an available commercial software package to process this data.
II. OBJECTIVE:
The objective of this document is to provide information about training aids developed by the USGS for one of the image processing packages in use: ERDAS software.
III. BACKGROUND:
The use of raster data for various applications and the need to become familiar with a general purpose system to process these data are essential to meet NMD research and production requirements. ERDAS 1 and other software systems have been used extensively for processing digital imagery.
The ERDAS system is one of the commercially available image processing and GIS software packages that is compatible with other raster and GIS systems used by the USGS. ERDAS software enables people to use menu driven modules with user specified and default choices to accomplish specific image processing tasks.
IV. APPROACH:
During the last two years NMD researchers have had an increasing need to learn about the ERDAS applications programs. In response to this need three different information resources were developed. First, an ERDAS users guide was created for an image processing operation. Second, a guide was made to a set of video tapes of an ERDAS vendor training course describing the ERDAS modules. Third, an in-house ERDAS training course was developed to assist in the completion of a digital revision project for the NMD's Mapping Application Center.
1 Any use of trade, product, or firm names is for descriptive purposes only and does not imply endorsement by the U.S. Government.
1

A. User Guide
Various requests for guidance in the use of the ERDAS system showed the need for an instructional guide that a new ERDAS user could use for image processing. Such a guide was compiled using a sample SPOT digital panchromatic image to illustrate the sequences of ERDAS modules that could be used to process these data. During the last two years this users guide has been used and expanded extensively in NMD for research and production. The guide (Appendix A of this report) describes ERDAS software commands with on-screen information to complete the image processing.
B. Video Tape Guide
The ERDAS vendor presented a 3 1/2 day class on the ERDAS system and modules, which though very informative and intensive, offered very little opportunity for a user to gain hands-on experience with the system. The majority of time was spent taking notes and trying to comprehend the large amount of information being presented.
The last ERDAS training offered by the vendor at the USGS research laboratory in February 1991 was captured on ten videotapes with approval from the instructor. These lectures proved to be very informative, especially with the capability for reviewing specific items of interest from the video. The image displays that were enlarged using the GIS laboratory's projection system, however, lost considerable sharpness and resolution when viewed on the video tape. Nevertheless, the sequence of ERDAS modules used for creating the images were satisfactorily captured explaining the processes.
The ten training tapes were previewed using the GIS laboratory's VMS recorder and television monitor. A video tape guide was compiled to permit the location of specific topics of interest. This guide functions as a table of contents for the topics discussed. This guide is contained in Appendix B. The video tapes are available on loan to USGS offices from the GIS laboratory in Reston.
C. In-house Training Course
In February of 1992 the NMD's Eastern Mapping Center requested that an in-house basic ERDAS training course be developed to support production requirements for the 1:100,000-scale digital revision project. The objectives of this course were to familiarize participants with the ERDAS software and to create ERDAS capabilities specifically tailored for this project. This course was designed as a one-time hands-on course, in which each person could operate various software modules under the guidance of the instructor. The three participants received technical assistance as they worked through their project using the ERDAS system.
The topics covered in the course consisted of:
1. INTRODUCTION SUNAI hardware configuration Basic UNIX operating system commands Overview of ERDAS capabilities Module functions and architecture
2. TAPES MODULE Tape formats and options Data input and output
3. IMAGE PROCESSING MODULE Image displayImage data characteristics and statistics Image enhancement functions Geometric correction of image data
4. CORE MODULE File management utilities Create subset/mosaic functions Cursor functions
V. SUMMARY:
1. An ERDAS users guide was developed to help people processing digital image data.2. A guide was compiled to video tapes of a course on ERDAS software modules,
which was presented to NMD participants by the vendor.3. A basic ERDAS training course was developed in-house to help new users become
familiar with the system.4. These efforts have combined to yield more expert use of ERDAS for NMD research
and production projects.
The use of ERDAS capabilities in NMD has proven to be essential for research and production efforts. The continued requests for ERDAS training, technical support, and new software have demonstrated that a system such as ERDAS can greatly affect the ability of NMD to accomplish its mission. As more people become experienced users of ERDAS, they can take advantage of the more advanced techniques and special applications for the processing of spatial data.
VI. REFERENCES:
ERDAS, Version 7.5, July 1991, Software modules documentation ERDAS, Version 7.4, October 1990, Software Overview

APPENDIX A.
GUIDE TO ERDAS IMAGE PROCESSING OF SPOT PANCHROMATIC DATA
CONTENTS
I. TAPES MODULE
A. MTCOUNT module determines format and size of tape.
B. PREVIEW module displays and selects desired image area.
C. LDDATA module loads image data from tape.
II. CORE MODULE
A. VIEW-READ module displays image.
B. BSTATS module creates and updates statistics for image.
C. VIEW-READ module redisplays image.
D. CURSOR-CURSES module locates pixel area for subset of image.
E. CREATE-SUBSET module creates subset of image.
F. BSTATS module creates statistics for subset of image.
G. VIEW-READ module redisplays subset of image.
III. IMAGE PROCESSING - GEOMETRIC CORRECTION MODULE
A. GCP module creates and edits ground control points (GCP's).
B. COORDN module computes coordinate transformation matrix.
C. NRECTIFY module performs linear nonlinear rectification.
D. CORE-BSTATS module creates and updates statistics for image.
E. CORE-FIXHED module modifies header information for image.

I.TAPES MODULE (bold shows input required of operator)
A. The MTCOUNT module is used to determine the format and size of the SPOT data tape. (Mount tape on SUNAI tape drive.)
ERD> 4. TAPESERD> 3. MTCOUNTRewind the tape ? (y,n) [yes]: retSkip any files ? (y,n) [no]: retSkip any records ? (y,n) [no]: retOutput to terminal,printer or both (t,p,b) ? choose oneformat: simple.ASCII, ebcdic,hex,dec (s,a,e,h,d) ? [simple]: ret'tape structure listing':file # 1, record # 5, 360 bytes
file # 2, record # 27, 3960 bytes image file -> file # 3, record # 6005, 8640 bytes
file # 4, record # 3, 1080 bytesfile # 5, record # 1, 360 bytes
ERD> ERDAS 'returns to main menu'
B. The PREVIEW module is used to load and display the complete image area from the tape without storing to disk. The upper left and lower right pixel coordinates of the image area are saved for reference.
ERD> 4. TAPESERD> 1. INPUTERD> 7. PREVIEWRewind the tape (y,n) [yes]: retSkip any files on the tape (y,n) [no]: yesNumber of files to skip ? [0]: 2Are there any header records on the tape ? (y,n) [no]: retsupported formats include :
A = bil (band interleaved by line)B = bsq (band sequential)
Select format (A,B) [A = bil]: ret Number of bands of data on tape ? 1 How many columns wide is the file ? 8640 How many rows are in the file ? 6005 Data is packed as 8-bit or 16-bit ? (8,1) [8-bit]: ret * image scaling parameters This data set has 1 bands ' 'Please choose from the set' : 1 Select band to color assignment [rgb] (-1 do not use this color)
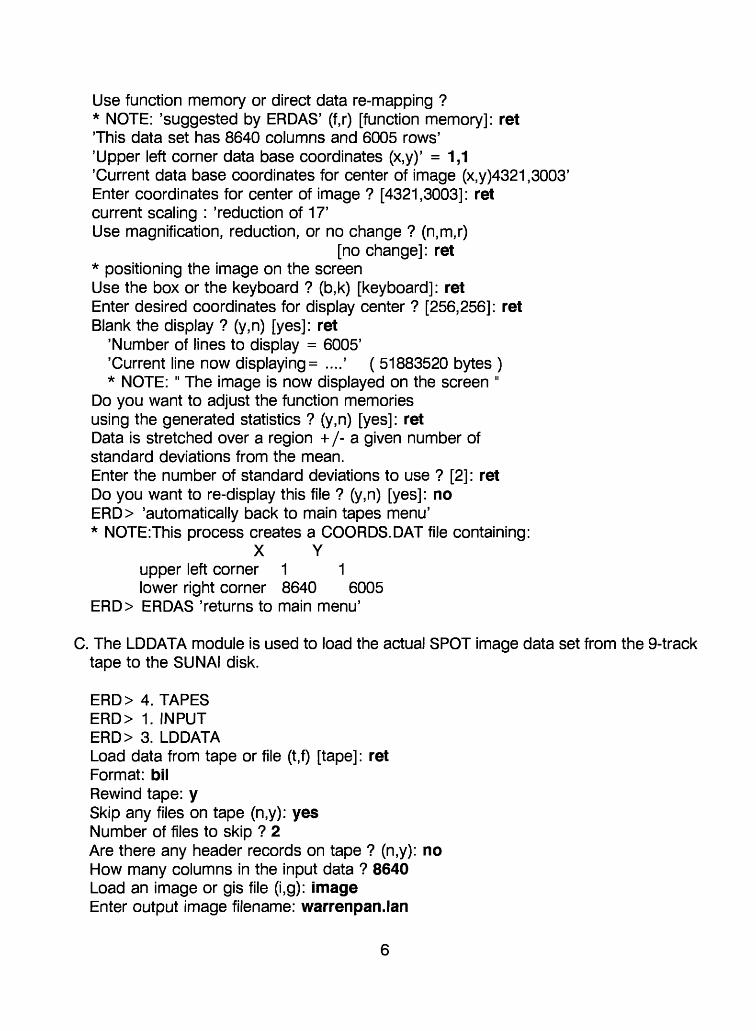
Use function memory or direct data re-mapping ?* NOTE: 'suggested by ERDAS' (f,r) [function memory]: ret This data set has 8640 columns and 6005 rows' 'Upper left corner data base coordinates (x,y)' = 1,1 'Current data base coordinates for center of image (x,y)4321,3003' Enter coordinates for center of image ? [4321,3003]: ret current scaling : 'reduction of 17' Use magnification, reduction, or no change ? (n,m,r)
[no change]: ret* positioning the image on the screenUse the box or the keyboard ? (b,k) [keyboard]: retEnter desired coordinates for display center ? [256,256]: retBlank the display ? (y,n) [yes]: ret
'Number of lines to display = 6005''Current line now displaying = ....' ( 51883520 bytes )* NOTE: " The image is now displayed on the screen "
Do you want to adjust the function memories using the generated statistics ? (y,n) [yes]: ret Data is stretched over a region + /- a given number of standard deviations from the mean. Enter the number of standard deviations to use ? [2]: ret Do you want to re-display this file ? (y,n) [yes]: no ERD> 'automatically back to main tapes menu'* NOTEThis process creates a COORDS.DAT file containing:
X Yupper left corner 1 1lower right corner 8640 6005
ERD> ERDAS 'returns to main menu'
C. The LDDATA module is used to load the actual SPOT image data set from the 9-track tape to the SUNAI disk.
ERD> 4. TAPESERD> 1. INPUTERD> 3. LDDATALoad data from tape or file (t,f) [tape]: retFormat: bilRewind tape: ySkip any files on tape (n,y): yesNumber of files to skip ? 2Are there any header records on tape ? (n,y): noHow many columns in the input data ? 8640Load an image or gis file (i,g): imageEnter output image filename: warrenpan.lan

How many pixels wide is the output disk file to be (8640): 2500Data is packed as 8-bit or 16-bit (8,1) [8-bit]: retHow many bands are in the input data ? 1How many bands are in the output file (1): retLoad all bands in order (y,n) [yes]: retCoords of upper left corner of the output file (x,y) [1,1]: retStart columns to load data in output file [1] : retStart row to load data in output file [1] : retStart coords. on input data (x,y) [1,1]: ret# of lines to load from input ? 2500# of columns to load from input ? [2500]: ret Rewind tape at end or skip to next file ?
(s,r) [skip to next file]: rewind# NOTE: The tape will now be loading '
' number of lines to load = 2500 '' current line now loading = .... '
ERD> ERDAS 'returns to main menu'
I. CORE MODULE
A. The VIEW-READ module is used to display the warrenpan.lan image on the screen.
ERD> 1. COREERD> 1. VIEWERD> 8. READEnter image filename : warrenpan.lan* Image scaling parameters' This data set has 1 bands 'Choose from the set : 1Select band to color assignment [rgb] ? [1,1,1]: retData is stretched over a region + /- a given number ofstandard deviations from the mean.Enter the number of standard deviations to use ? [2]: ret* NOTE: A 1.5 S/D will provide a higher contrast on image.Data limits for the red image (band 1) ? [0,83] : retThis data set has 2500 columns and 2500 rows 'Upper left corner data base coordinates (x,y) = 1,1Current data base coordinates for center of image(x,y) = 1251,1251Enter coordinates for center of image ?[1251,1251]: ret' current scaling : reduction of 5 'Use magnification,reduction,or no change ?

(n,m,r) [no change]: ret* Positioning the image on the screenUse the box or the keyboard ? (b,k) [keyboard]: retEnter desired coordinates for display center ? [256,256]: retBlank the display ? (y,n) [yes]: ret* NOTE: The image warrenpan.lan is now displayed on screen ' ERD> ERDAS 'Returns to main menu 5
B. The BSTATS module is used to create statistics for the warrenpan.lan image file.
ERD> 1. COREERD> 7. FILE MGMT.ERD> 3. HEADER/TRAILERERD> 1. BSTATSIs this an image or a gis file (i,g): imageEnter image filename : warrenpan.lanMake a statistics listing (y,n) [yes]: retMake a histogram listing (y,n) [yes]: retListing to go to printer, terminal, or both ? (p,t,b): bothNow define the area you wish to use for computing statistics.There are 2500 rows, and 2500 columns in the input imageUse the whole image ? (y,n) [ret]: ret'You may enter skip factors to avoid using the whole data basewhen computing statistics.'Enter x skip factor ? [18]: retEnter y skip factor ? [18]: retCount zeroes in the statistics computation (y,n) [yes]: ret* NOTE: A header listing for image file: warrenpan.lan is created and date statistics printed : '1-1-91' Date statistics created : '1-1-91' This file has 2500 rows, and 2500 columns, there are 1 bands in data set Upper left corner data file coordinates (x,y) is : 1,1 This file contains 8-bit data' 'minimum data value is 0' 'maximum data value is 255' mean .... s.d. .... median .... mode ....
'Histogram also prints out to desired output device.' ERD> ERDAS 'returns to main menu'
8

C. Repeat the VIEW-READ module to re-display warrenpan.lan after statistics have been updated in order to look at enhanced image.
ERD> 1. COREERD> 1. VIEWERD> 8. READenter image file name: warrenpan.lan* NOTE: to save time CTRL-D was executed to automatically sequence through the remaining arguments to display the image.
D. The CURSOR-CURSES module is used to locate the image area of the Warrenton and Catlett 7-1/2' quadrangles by displaying the pixel coordinates of the 4 corners of the image. This information was used to establish the size of the image for the subset covering the two quadrangles.
ERD> 1. CORE ERD> 5. CURSOR ERD> 2. CURSES Image file : warrenpan.lan* NOTE: The mouse is used to position the crosshairs on the image display at each of the 4 corners from identification on the paper map.' For example.
'screen' 'file' x y x y
cor. ul 1 1 11" ur 512 1 2500 111 II 1 512 1 250011 Ir 512 512 25002500
ERD> ERDAS 'returns to main menu'
E. The CREATE-SUBSET module is used to create the warrensub.lan image file covering the Warrenton and Catlett 7-1/2' quadrangles from the pixel value coordinates established in the CURSOR module.
ERD> 1. COREERD> 7. FILE MANAGEMENTERD> 1. CREATE/SUBSETERD> 6. SUBSETImage or gis file ? (i,g): imageEnter input image filename: warrenpan.lanThere are 2500 rows, and 2500 columns in the input image.Use the whole image ? (y,n) [yes]: no

Enter coordinates (x,y) for upper left corner ? [1,1]: 1,201 Enter coordinates (x,y) for lower right corner ? [2500,2500]: 2500,2200 This data set has 1 bands ' Enter output image filename: warrensub.lan How many columns are to be in the output file [2500]: ret How many rows are to be in the output file [2000]: ret Enter coordinates of absolute upper-left corner of output file ? [1,201]: retEnter output file coordinates at which to place upper-left corner of input subset ? [1,201]: ret Copy all bands in order ? (y,n) [yes]: ret 'Input image filename: warrenpan.lan' 'Output image filename: warrensub.lan'
'copying subset''number of lines to do: ....''current line
ERD> 'automatically returns to main menu at conclusion of SUBSET'
F. Repeat the BSTATS module on warrensub.lan image file to update the statistics and enhance the image for display.
ERD> 1. COREERD> 7. FILE MANAGEMENTERD> 3. HEADER/TRAILERERD> 1. BSTATSERD> ERDAS 'returns to main menu'
G. Repeat VIEW-READ module to redisplay the warrensub.lan image to insure that the complete area of the two quadrangles has been covered by map inspection.
ERD> 1. COREERD> 1. VIEWERD> 8. readEnter image filename: warrensub.lan'CTRL-D'
ERD> ERDAS 'returns to main menu'
10

I. IMAGE PROCESSING - GEOMETRIC CORRECTION
Prior to using ERDAS geometric correction programs, the horizontal GCP's necessary for image rectification are selected. The GCP's are selected with location and identification from map to image being the primary concern. The selected GCP's are precisely marked on each 7-1/2 minute quadrangle map. The rectangular Universal Transverse Mercator (UTM) x,y coordinate values for each point are measured from the maps using a transparent "romar" template for 7-1/2 minute scale. This template permits points to be measured to plus or minus 10 meters in the x or y axis. The 16 GCP's are selected in a matrix in order to provide a uniform spread of GCP's for geometric correction.
A. The GCP module is used to create and edit the GCP file for the warrensub.lan image file prior to image rectification.
ERD> 2. Image ProcessingERD> 3. Geometric CorrectionERD> 3. GCP (geometric correction)Enter ground control point filename: warrensub.lanGet file coordinates from keyboard or mouse (k,m)[mouse]: ret' The image file warrensub will then be displayedusing the commands for reading in an image 'Get map coordinates from keyboard, mouse or tablet(k,m,t) [tablet]: keyboard
An information listing appears on the menu display screen.
image source : warrensub : warrensub map source : keyboard entries form map points
point file coordinates map coordinatesx y x y
1 (to 16)
E = Edit Single Points B = Edit a block of pointsD = Delete points P = Position to new pointsF = Fix the screen X = Exit
* NOTE: Select option e = edit single points : e enter the next point to modify (-1 = done) ? [1]: ret Image is reduced. Select full resolution window size:
11
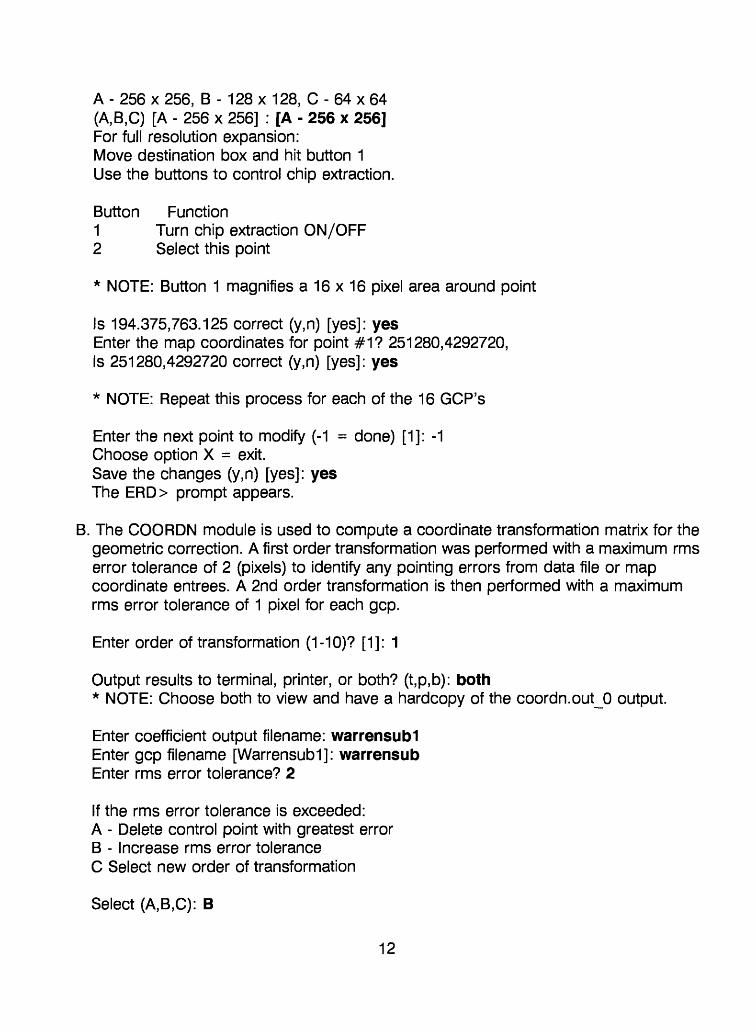
A - 256 x 256, B - 128 x 128, C - 64 x 64 (A,B,C) [A - 256 x 256] : [A - 256 x 256]For full resolution expansion:Move destination box and hit button 1Use the buttons to control chip extraction.
Button Function1 Turn chip extraction ON/OFF2 Select this point
* NOTE: Button 1 magnifies a 16 x 16 pixel area around point
Is 194.375,763.125 correct (y,n) [yes]: yesEnter the map coordinates for point #1? 251280,4292720,Is 251280,4292720 correct (y,n) [yes]: yes
* NOTE: Repeat this process for each of the 16 GCP's
Enter the next point to modify (-1 = done) [1]: -1Choose option X = exit.Save the changes (y,n) [yes]: yesThe ERD > prompt appears.
B. The COORDN module is used to compute a coordinate transformation matrix for the geometric correction. A first order transformation was performed with a maximum rms error tolerance of 2 (pixels) to identify any pointing errors from data file or map coordinate entrees. A 2nd order transformation is then performed with a maximum rms error tolerance of 1 pixel for each gcp.
Enter order of transformation (1-10)? [1]: 1
Output results to terminal, printer, or both? (t,p,b): both* NOTE: Choose both to view and have a hardcopy of the coordn.out_0 output.
Enter coefficient output filename: warrensubl Enter gcp filename [Warrensubl]: warrensub Enter rms error tolerance? 2
If the rms error tolerance is exceeded: A - Delete control point with greatest error B - Increase rms error tolerance C Select new order of transformation
Select (A,B,C): B
12

* NOTE: This option allows points to be retained to determine the possible cause and amount of the error.
* NOTE: A coordn.out listing is then generated with transformation and matrix parameters with a residual mean square error (rmse) for each GCP.
ERD> ERDAS 'returns to main menu'
* NOTE: The second order transformation is then performed after any pointing or map errors are identified and corrected by rerunning the GCP module and editing GCP's.
ERD> 2. Image ProcessingERD> 5. Geometric CorrectionERD> 2. COORDN (coordinate transformation)Enter order of transformation (1-10) ? [1]: 2output results to terminal, printer, or both ? (t,p,b)[both]: bothEnter coefficient output filename: warren2.cfnenter gcp filename: warrensubenter rms error tolerance ? 1'coordn.out_0 listing is printed for warrensub.cfn'here are the points you are using:
point count point # x y x pixel y 1 to # n 1 to # n
order of transformation is 2
These are the computed results of the matrix above:
point point image x pixel image y pixel count number x pixel residual y pixel residual
1 to 16 1 to 16
x rms error = 0.82739 y rms error = 0.89216,4292270total rms error = 1.21677ERD> ERDAS 'returns to main menu'
13

C. The NRECTIFY module is used to perform a nonlinear rectification on the warrensub.lan image file using the warrensub.gcp file and the warren2.cfn (2nd order) transformation to create the output warren2.lan image
ERD> 2. Image ProcessingERD> 3. geometric correctionERD> 5. NRECTIFYRectify a gis or image file ? (g,i): imageEnter input image filename: warrensub.lanEnter coefficient filename: warren2.cfnEnter output image file name: warren2.lanIs the output coordinate system a georeferenced coordinate system or a data file (pixel)coordinate system (g,d) [geo-referenced]: retAvailable coordinate types: (1-100)Specify coordinate type ? (1 = utm)Calculate default output map coordinates to transformthe entire input file (y,n) [yes]: noMap coordinates of upper left corner (x,y) ? 249000,4293000Map coordinates of lower right corner (x,y) ? 273000,4278000* NOTE: select UTM values outside of quadrangle upper left and lower right corners to insure complete image coverage of quadrangle boundaries, enter output pixel size (x,y) in meters ? 10,10* NOTE: 10 meter pixel size for SPOT PAN data available techniques for data resampling:
'nearest neighbor''bilinear interpolation''cubic convolution'
use which technique ? (n,b,c) [nearest neighbor]: ret
* NOTE: this information is displayed on the menu screen
'nearest neighbor'
input file: warrensub.lan output file: warren2.lan
percent of file processed:.........n.nn %
file in outposition [x,y] [x,y]upper left [-44,743] [1,1]lower right [2626,1672] [2401,1501]
ERD> ERDAS 'returns to main menu' when processing is completed
14

D. The CORE-BSTATS module is used to update the statistics for warren2.lan
ERD> 1. CORE ERD> 7. FILE MANAGEMENT ERD> 3. HEADER/TRAILER ERD> 1. BSTATS
E. The CORE-FIXHED module is used to establish the modified header information for the warren2.lan image file. This process permits the image data set to be used with other GIS systems, ie. TIGER, SPANS, ARC/INFO.
ERD> 1. COREERD> 7. FILE MANAGEMENTERD> 3. HEADER/TRAILERERD> 5. FIXHED (fix header)Is this an image file or a gis file? (i,g): imageEnter image filename: warren2.lan* header informationNumber of columns in this data set ? [2401]: retNumber of rows in this data set ? [1501]: retNumber of bands in this data set ? [1]: retEnter starting x position of upper left corner ? [1]: retenter starting y position of upper left corner ? [1] : retIs data packed as 4-bit,8-bit, or 16-bit ? (8,4,1) [8-bit]: retIs data base associated with any type of map ?(ie. geo-referenced or rectified ) (y,n) [yes]: retAvailable coordinate types: (1-100)Specify coordinate type ? [1] = (utm) : retEnter x map coordinate of upper left cell ? [249000]: retEnter y map coordinate of upper left cell ? [4293000]: retEnter x cell size ? [10]: retEnter y cell size ? [10]: retWhat are the units of area ?( acres, hectares, other units, or none) (a,h,o,n)[hectares]: retEnter no. of hectares per cell ? [0.01]: retERD> ERDAS 'returns to main menu'
15

APPENDIX B.
VIDEO TAPE GUIDE TO ERDAS VENDOR COURSE:
A listing of the topics contained on each VMS tape
Tape 1 Page 1.Overview of all ERDAS modules for version 7.4;VIEW-READ module displays LAN (image) files with single or multiple bands.
Tape 1 Page 2.FILE MANAGEMENT-BSTATS module creates and updates statistics to LAN and GISfiles.
Tape 1 Page 3.CURSOR-CURSES module allows interactive pixel measurement of file and datavalues for image with a mouse.FILE MANAGEMENT-LISTIT module lists image data values, histograms, headerstatistics, and GIS color schemes.
Tape 1 Page 4.ENHANCEMENT-ALGEBRAmoduleperformsalgebraic computations and mathematicalfunctions on image data.CORE IMAGE PROCESSING- RGBCLUS module compresses 24-bit image files into aGIS file with color scheme of input image.
Tape 2 Page 5.RGBCLUS module continued-CORE IMAGE PROCESSING-WFM module performs interactive image enhancements.
Tape 2 Page 6.TAPES module overview determines data input and output capabilities.INPUT-LDDATA module loads image data from tape or from disk file in non-ERDASformat.
Tape 2 Page 7.MTCOUNT module determines format and of tapes.INPUT-PREVIEW module performs image display from 9-track tape without diskspace storage.
Tape 3 Page 8. TAPES module continued-INPUT-LOADDEM module loads DEM (digital elevation model) data to disk from 9-track tape.INPUT-LDDTED module loads DTED (digital terrain elevation data) to disk from 9-track tape.OUTPUT-DUMPBIL module copies image data from disk to 9-track tape in BIL (band interleaved by line).
16

Tape 3 Page 8. (continued)-OUTPUT-DUMPBSQ module copies image data from disk to 9-track tape in BSQ(band sequential format).FILE MANAGEMENT-CREATE/SUBSET-MAKEFIL module creates an empty file forsubsequent input of image or GIS data files.FILE MANAGEMENT-CREATE/SUBSET-SUBSET module performs precise extractionof image data sets from an input image file by area or band.
Tape 3 Page 9.ALGEBRA module creates an enhanced image file by clipping image disk valuesfor an 8-bit display.
Tape 4 Page 10.ALGEBRA module discussion for concepts and capabilities of 8-bit displays.ENHANCEMENT-STRETCH module performs contrast stretch using display functionmemories.COLORMOD module modifies color schemes of image and gis displays and storesto disk.WFM module applies slope to intensity ranges.
Tape 4 Page 11.ENHANCEMENT-PRINCE module performs principal components analysis forcompressing image data files.
Tape 5 Page 12.ALGEBRA module performs ratioing between bands.CORE IMAGE PROCESSING-IPX module performs an interactive image processingenhancement using no memory. Low pass filtering for smoothing or high passfor sharpening is performed.ENHANCEMENT-DCONVLV module performs disk to disk filtering for an entireimage file.
Tape 5 Page 13.CURSOR-DIGSCRN module performs interactive digitizing of vector data using adisplayed LAN or GIS file.TABLET DIGITIZING-DIGPOL module performs interactive tablet digitizing(SUNAI not configured).PRECLASSIFICATION-SEED module performs interactive selection of trainingsamples from pixels for signature (SBD) files for supervised classification.FILE MANAGEMENT-DIGUTIL module performs digitized polygon file manipulation.FILE MANAGEMENT-CCVRT module converts map coordinates to latitude andlongitude and vice versa.GEOMETRIC CORRECTION-PROGCP module generates arbitrary GCP's for coordinateconversion of LAN or GIS files.PRECLASSIFICATION-SIGEXT module creates a signature (SBD) file based on thesamples defined in the digitized polygons (DIG) file.
17

Tape 5 Page 13. (continued)-FILEMANAGEMENT-CUTTER module extracts LAN or GIS for a specified region as delineated by DIG's.FILE MANAGEMENT-GRIDPOL module grids vector data in DIG files to a new or existing GIS file.
Tape 6 Page 14.Discussion of GIS files and trailer extensions with class values.FILE MANAGEMENT-CLASNAM module performs entering/editing class names for GISfiles.COLORMOD module continued; setting .RNB (rainbow) files for color modificationof single class values.Discussion of image plane having true or pseudo color graphics plane havingpseudo values (0-15) for transparent class value assignment.DIGUTIL module continued; to create a.PRO (projection) file.DIGSCRN module continued; to create a .DIG file by digitizing from graphicsdisplay.DISPOL module continued; to display polygons from DIGUTIL input.GRIDPOL module continued; to create GIS file from DIGUTIL input.
Tape 6 Page 15.VIEW-GISOVR module displays a GIS file in the overlay plane of the display withthe image as a backdrop.CORE IMAGE PROCESSING-CLUSTER module performs unsupervised classificationusing a two-pass sequential clustering method based on minimum spectraldistance, up to eight input bands are allowed, and up to 255 output classes forcreation of a new GIS file.SPATIAL ANALYSIS-CLUMP module performs contiguity analysis for raster regionmeeting criteria.SEED module continued; with "ARC-INFO LIVE LINK" for mix of supervised andunsupervised classification.PRECLASSIFICATION-SIGMAN module combines all signature manipulation: rename,delete, merge, and append statistics.PRECLASSIFICATION-CMATRIX module performs contingency matrix analysis oftraining samples with pixel evaluation.CLASSIFICATION-MAXCLAS module classification program produces a new GISfile, and GIS color scheme.CLASSIFICATION-PPDCLAS module performs interactive parallelepiped classifierwith alarms and creates a new GIS file.
Tape 7 Page 16.Classification alternatives, discussion of supervised (MAXCLAS) versus unsupervised (CLUSTR).CLASSIFICATION-ISODATA module performs unsupervised training using interactive spectral distance which outputs a signature file (SBD) and GIS file for analysis.
18

Tape 7 Page 16. (continued)-PRECLASSIFICATION-STATCL module performs statistical clustering producingSBD files with up to 255 classes.RASTER GIS MODELING MODULES discussion;SPATIAL ANALYSIS-SCAN module performs GIS filtering with boundary.CORE RASTER GIS-SEARCH module performs proximity analysis on GIS classeswith radius up to 254 pixels.SPATIAL ANALYSIS-SIEVE module removes raster regions from the output of theCLUMP program.CORE RASTER GIS-RECODE module performs class receding for individual, block,and offset receding.CORE RASTER GIS-OVERLAY module performs overlay of multiple GIS layers withGIS receding options.Use CLUMP->SIEVE->RECODE->OVERLAY->SCAN to produce an unsupervisedGIS file.PRECLASSIFICATION-DIVERGE module computes and reports transformeddivergence for evaluating signature separability and band combinations.
Tape 7 Page 17.Use SEED->SIGMAN->MAXCLAS to produce a supervised GIS file.SEED module (interactive) commands performs selection of training samples forsignature (SBD) file.RECTIFICATION image-to-map and image-to-image;GEOMETRIC CORRECTION-GCP module creates and edits ground control point(GCP) files using mouse or keyboard entry.GEOMETRIC CORRECTION-COORDN module computes a transformation matrixusing the GCP file.Discussion of 1st order and 2nd order transformation analysis for error contributionand residuals.Resampling of image data for new output image.Nearest-neighbor method uses fastest and simplest method of retaining originaldata values in output pixels.Cubic-convolution method uses data file values of 16 pixels in a 4 x 4 window fora smoother pixel edge.Bilinear-interpolation method uses data file values in a 2 x 2 window for thesmoothest output pixel value.
Tape 8 Page 18.GEOMETRIC CORRECTION-NRECTIFY module performs linear and nonlinear rectification (1st through 10th order).GEOMETRIC CORRECTION-LRECTIFY module performs geometric correction for (1st order) image-to-map or image-to-image registration, which allows input for scale and rotation. BATCH->TOPO->3D->COLORHARDCOPY processing for color hardcopy output;
19

Tape 8 Page 18. (continued)-BATCH menu command executes ERDAS programs without user interaction fromcreated "audit" file that records prompts and user responses.TERRAIN ANALYSIS-CONTOUR module creates a GIS file representing surfacecontours from a LAN file.TERRAIN ANALYSIS-RELIEF module produces topographical relief images of LANfiles with sun angle and elevation.TERRAIN ANALYSIS-SLOPE module computes slope or aspect of a topographic fileand produces a GIS file.CONTOUR module creates a GIS file representing surface contours from a LAN filecontaining elevation data.TERRAIN ANALYSIS-RESCALE module rescales 16-bit data to 8-bit data for imagedisplay and analysis.SURFACE-SORT module divides a DIG (digitized polygon) file into a grid ofseparate blocks, which is created from the digitized image.
Tape 8 Page 19.COLOR HARDCOPY module creates an output image or GIS file to print(not configured for SUNAI).HARDCOPY-GISMAP module produces color maps from GIS files supported onInkJet printers (not configured for SUNAI).HARDCOPY-LANMAP module produces color hardcopy maps from multiband imagefiles (not configured for SUNAI).HARDCOPY-CLRCHRT module prints a reference chart of a specific color patternfile (not configured for SUNAI).HARDCOPY-PRTLIS module prints map data from LIS (list) files (not configuredfor SUNAI).HARDCOPY-SCALMAP module produces black and white hardcopy maps from GIS orLAN single band files (not configured for SUNAI).HARDCOPY-TEKDMP module creates an unsealed hardcopy from a displayedimage (not configured for SUNAI).HARDCOPY-ELEKTROMAP module creates hardcopy output for an electrostaticplotting device (not configured for SUNAI).FILE MANAGEMENT-CPYSCR module copies an annotated or enhanced image fromthe display to a LAN or GIS.HARDCOPY-PSDUMP module uses modification in the ANNOTATE module for highresolution output (not configured for SUNAI).
Tape 9 Page 20.GISMO module review of the GIS modelling modules; RECODE module performs a GIS recede range.SCAN module performs floating neighborhood three X three window analysis for boundaries.CLUMP module performs class value assignment. SIEVE module performs raster region removal.
20

Tape 9 Page 20. (continued)- SEARCH module performs proximity analysis. GISEDIT module performs pixel by pixel editing.AGGIE module performs subsampling of GIS file to output larger pixel size. OVERLAY module performs overlay of multiple GIS layers with options to override GIS minimum and maximum values.INDEX module performs a weighted-sum analysis of multiple input GIS layers with GIS recede options.MATRIX module performs a coincidence analysis of GIS classes in two input GIS layers with GIS recede options.SUMMARY module performs a two-way cross-tabulation for GIS statistics. DSC (descriptor) files for text and numerical data that can be associated with the classes of a GIS file handled by data base management discussion; CLASNAM module assigns GIS class names for .DSC. DSCEDIT module performs input of descriptor data.INQUIRE module reports descriptor data,coordinates, GIS class values and overlay plane values for the multiple geo-referenced files (LAN and GIS). CDL (cursor display list) is a list of information about each pixel that can appear on the command screen for pixel-by-pixel analysis.
Tape 10 Page 21.GISMO III (IMAGINE) discussion of version 8.0.1 of ERDAS GIS modelling software programs, image transformations, interactive rectification, viewing capabilities, and enhanced Map Composer;ANNOTAT module performs highlight of displayed images or GIS files with vector data.ANTGRID module grids an annotation file into a LAN or GIS file. Final discussion and overview of all ERDAS modules that were covered in training course.
21