enlarged vestibular aqueduct
TRANSCRIPT

11
By:
Dr. Ghada Mohamed WageihM.B., B.Ch. &
MSc in Audiology

22

3
While acquired deafness is more common than genetic deafness by roughly
2 orders of magnitude, congenital deafness occurs in 1 per every 1000-2000 births
with autosomal recessive inheritance being the most common form (Bodensteiner et
al., 2003).
Researches suggest that 5–15% of children with sensorineural hearing loss
have enlarged vestibular aqueduct. EVA is considered the most common inner ear bony
malformation in children with SNHL of unknown etiology, that may predispose the
affected individuals to fluctuating or progressive SNHL.
The commonest two imaging modalities that are often used to identify the enlarged
vestibular aqueducts are CT scan and MRI of the inner ear. One or both tests are often
recommended to evaluate a child with sensorineural hearing loss especially when
hearing loss occurs suddenly, is greater in one ear than the other, or varies or gets
worse over time (NIDCD, 2006).
3

44

5
EVA percent is an increased finding in children with hearing
loss. So, this study was done to:
• estimate its percent in NSSNHL children.
&
• try to correlate between size of the aqueduct and
degree of hearing loss.
5

66

7
Development of the inner ear The auditory (otic) placode, appears opposite the hindbrain immediately above the
first external pharyngeal groove which in turn invaginates forming:
a pit Then a closed pit Then separated from the surface ectoderm & sunk in
the mesoderm
7

8
The auditory vesicle elongates and develops a groove on its medial side which
demarcates a tubular diverticulum, which will be modified into the endolymphatic
sac and duct, and continues to grow postnatally until the age of three or four years.
8

9
The major compartment of the vesicle, termed the utriculosaccular Chamber :
• From the dorsal part of the chamber, the three SCC develop & complete by the ninth week.
• From the ventral part of the chamber, the cochlear duct develops & become fully coiled by the twelfth week.
• The remaining central portion of the chamber represents the membranous vestibule, with the utricle develops dorsally and the saccule develops ventrally.
9

10
Vestibular Aqueducts They are narrow, bony canals that travel from the inner ear to deep inside the skull, in an
inverted ‘J’ shape or hockey-stick appearance to the posterior surface of the petrous pyramid.
It initially travels medially and parallel to the common crus (isthmus). Posterior to the common
crus, the distal portion of the vestibular aqueduct turns inferiorly and becomes triangular with
its apex at the isthmus and its base (aperture) at the posterior fossa (Murray et al., 2000).
Posteromedial view of the bony labyrinth illustrating the course of the vestibular aqueduct from its origin at the medial wall of the vestibule to its termination at the posterior fossa (Murray et al., 2000).
10

11 The membranous labyrinth and relation of the endolymphatic duct and sac to the external aperture of the vestibular aqueduct and the sigmoid sinus (Daniels et al., 1997).
11

12
The endolymphatic duct (ED)
and sac (ES) They are the non sensory components of the membranous labyrinth. The ED is a short
single-lumen tubule, about 2 mm in length. It is formed from the confluence of the utricular and
saccular ducts. Its proximal segment is called the sinus which lies in a groove on the
posteromedial surface of the vestibule, while its major portion is contained within the short,
slightly upwardly arched, horizontal segment of the VA.
After entering the VA, the sinus tapers and then narrows at its isthmus within the isthmus
of the VA. Distal to the isthmus of the ED, the ES begins. The proximal, intraosseous portion of
the sac, lying within the transversely widening, vertical segment of the VA, is covered
posteriorly by a thin scale of bone, the operculum. The distal, extraosseous portion of the sac
rests on a fovea on the posterior wall of the petrous bone, between layers of the dura (Daniels et
al., 1997). Their main function is believed to be their contribution in active ionic exchange of the
endolymph with CSF and also serve as a reservoir of the endolymph & a role in endolymphatic
pressure regulation because their capability of absorbing water (Emmett, 1985).
12

1313

14
Hearing loss in children There are two primary categories of hearing loss in children: acquired hearing loss and
congenital hearing loss.
About 50 % of all cases of congenital hearing loss are attributable to environmental
factors, such as congenital hyperbilirubinaemia, meningitis…. (Hegarty, 2005).
The other 50% of cases are thought to be inherited, i.e., of genetic causes.
Of these hereditary cases:
-Approximately 30 % are classified as syndromic (associated with other recognizable
anomalies) (Schrijver, 2004).
-The other 70% are classified as non-syndromic (without any other recognizable
features) (Hegarty, 2005).
14

15
Mechanisms of Normal
Hearing: (After Willems, 2000)
Sound waves are captured by auricle → to EAC
→ to TM → through ossicular chain to stapes to oval
window → to cochlear duct stimulating the organ of
Corti → which contains:
-Inner hair cells → act as pure receptors that transmit
signals to VIII nerve.
15
-Outer hair cells → which act as sensory & motor
elements that elongates and contracts by planned
action of filaments as actin & they are crowned by
stereocilia each consists of actin core, their tips are
linked by tip links of myosin.

16
• Movement of tectorial membrane leads to movement
of hair bundle which open the K+ channels & lead to
entering of K+ into hair cells from the endolymph &
causing depolarization of hair cells → leading to
opening of Ca++ channels → Ca++ influx into hair cells
& release of neurotransmitters → activating the nerve.
16

17Schematic section through the human cochlea showing K+ recycling pathway and the
expression of the connexin 26 (GJB2) (Kemperman et al., 2002).
Repolarization done by release of K+ through K+ channels into supporting cells, to stria vascularis through gap junctions formed by ( connexins) → then back to the endolymph which cause resetting the system
17

18
Genes implicated in hearing loss :
a) Connexin 26 (Cx26) and Connexin 30 (Cx30) :
DFNB1 was the first locus incriminated in autosomal recessive deafness, GJB2 was
found to be responsible. It is a small gene situated on chromosome 13q11; it has a
length of about 5.5 kilo bases. There are two exons of which only one contains the
coding sequence. The mRNA is 2.4 kilo bases long and translated into a protein with
226 aminoacids. This protein belongs to the connexin family.
Connexins are membrane proteins with four transmembrane domains. Six chains of
these proteins form a complex called connexon. Two connexons in the membranes of
adjacent cells form a cell-to-cell channel, a so called 'gap junction', which allows the
transport of small molecules and ions between cells. A connexon can contain various
types of connexin which determine molecules or ions can pass through (Kemperman et
al., 2002).
18

19
Schematic representation of gap junction, six connexins form a connexon, two connexons of neighboring cells form pores which allow intercellular transport
of small molecules (Kemperman et al., 2002).
This enables communication between adjacent cells and a large number of cellular
functions including cell growth, differentiation, reaction to signals, synchronization of
activity in excitable tissues, and homeostasis (Schrijver, 2004).
19

20
The 35delG mutation accounts for approximately 70 % of GJB2 mutant alleles
with a carrier frequency of 2.3 % to 4%. The three other mutations are, 167delT,
235delC or R143W (Roux et al., 2004).
b) SLC26A4 (DFNB4):
The SLC26A4 gene is located on chromosome 7q31 and contains 21 exons. The
encoded protein is pendrin, which is composed of 12 transmembrane domains. This
gene is detected only in thyroid, inner ear, and kidney. An autosomal recessive locus
for non-syndromic deafness designated DFNB4 also maps to 7q31, the same region
as SLC26A4 gene. Mutations of the SLC26A4 gene are causative for both Pendred
syndrome and DFNB4 (Kahrizi et al., 2005).
20

21
The SLC26A4 gene location; the gene is located on the long (q) arm of chromosome 7 at 7q31.1 (Kahrizi et al., 2005).
SLC26A4 gene encodes a 780-amino acid protein, pendrin. Pendrin is closely related
to a number of sulfate transporters and contains 12 transmembrane proteins.
In the inner ear, it is involved in the conditioning of the endolymphatic fluid, and in the
kidney it is involved in bicarbonate secretion. It is most probable that SLC26A4 is acting as
a Cl‾ / HCOз‾ exchanger. In the thyroid gland, it is supposed to transport iodide. There are
four mutations (L236P, IVS8+1G>A, T416P, and H723R) account for approximately 60%
of the total Pendred genetic load (Kahrizi et al., 2005).
21

22
EVA was documented in a patient with Waardenburg syndrome and
documented also in another patient with a positive GJB2 mutation screen, a
homozygous 35delG mutation. This shows that existing mutations/disorders
can coexist within the same patient and cause confusion regarding the likely
cause of an SNHL (Madden et al., 2003).
22

23 Protein localization of pendrin, KCNQ1, ZO-1 and F actin in cochlea and vestibular labyrinthof Slc26a4+/+ and Slc26a4‾/‾ mice (Wangemann et al., 2004).
23

24 View of the Outer, Middle, and Inner Ear with a Cross Sectional View of the Cochlear Duct and a View of Hair Cells. The genes related to deafness and the locations of the products they encode are shown (Morton and Nance, 2006).24

2525
26
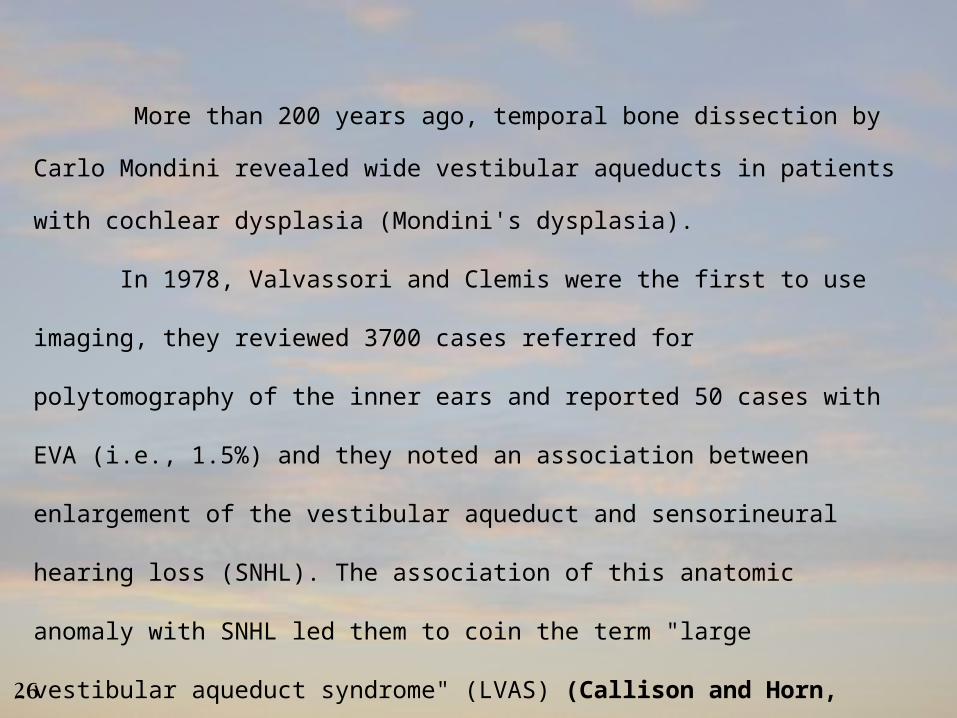
More than 200 years ago, temporal bone dissection by Carlo Mondini
revealed wide vestibular aqueducts in patients with cochlear dysplasia (Mondini's
dysplasia).
In 1978, Valvassori and Clemis were the first to use imaging, they reviewed
3700 cases referred for polytomography of the inner ears and reported 50 cases
with EVA (i.e., 1.5%) and they noted an association between enlargement of the
vestibular aqueduct and sensorineural hearing loss (SNHL). The association of
this anatomic anomaly with SNHL led them to coin the term "large vestibular
aqueduct syndrome" (LVAS) (Callison and Horn, 1998).
26

27
Causes of malformation :
There are two general theories on the origin or the cause of EVAS. Jackler et al suggested
that an arrest in the development in the fifth week of gestation prior to the lengthening and
narrowing of the VA results in an EVA. They thought that EVA is a result of narrowing failure of the
structure. Another group suggested that LVAS results from aberrant development of the duct and
sac later in fetal and postnatal life. Pyle was the first to measure the VA in a developing series of
human embryos; he stated that there is a progressive nonlinear growth of the VA throughout the
gestation. The growth of VA does not decline or reach a maximum size during fetal life; the VA
continues to grow postnatally until the age of 3 or 4 years. The membranous labyrinth is completely
formed by the 20th week of gestation, with the exception of the VA and its content. The width of
external aperture for the VA was 0.4 to 1.0 mm in normal temporal bones. Many studies agree with
Pyle’s theory that EVA is the result of continued growth rather than an arrest of development or
failure of early narrowing in embryogenesis (Su-Zhen et al., 2006).
27

28
The mechanism of hearing loss in EVAS (After Su-Zhen et al., 2006) and (Cox and MacDonald, 1996).
There are many theories for sudden and progressive SNHL in LVAS:
1. The first speculation: the reflux of hyperosmotic endolymphatic sac contents infused
through a wide patent endolymphatic duct into cochlear duct under rapid changes of
intracranial pressure.
2. The second speculation: the membranous labyrinth ruptures causing the mixture of
endo-perilymph, most probably by a defect or tear in an area of congenital weakness
in the basilar membrane.
28

29
3. The third speculation: rapid fluctuations of CSF pressure might create transient
force imbalances that damaging the membranous labyrinth when the VA is
enlarged and cochlear aqueduct is normal.
4. High incidence of round window abnormalities that may predispose the LVA
patient to perilymph fistulas, which could be the cause of sensorineural hearing
loss.
29

30
Clinical presentation of EVA :
Sensorineural Hearing Loss:
It was noticed that the hearing loss could fluctuate or deteriorate progressively which may
sometimes start from minor head traumas. Children with EVAS may have moderate or
severe hearing loss in childhood, but residual hearing allows the child to get adapted to
some situations, such as for example, to go to school and to develop spoken language
(Pinto et al, 2005).
Minor head trauma or barotraumas have been reported to be the predisposing factors for
sudden hearing deterioraton. Associated inner ear anomalies such as an enlarged lateral
semicircular canal could be found in a considerable number of CT scans of those patients.
(Madden et al., 2003).
30

31
Conductive or Mixed Hearing Loss:
Conductive or mixed hearing loss has occasionally been reported in EVA patients. Because
an air-bone (A-B) gap in low-tone frequencies is observed to some extent in persons with
SNHL, it is necessary to investigate whether the A-B gap is truly larger in patients with LVA
syndrome compared with other types of sensorineural hearing loss, such as sudden SNHL or
not. Nakashima et al. investigated whether the degree of A-B gap is larger in patients with
LVA syndrome than in those with idiopathic sudden SNHL and attempted to elucidate the
cause of the A-B gap.
The A-B gap in patients with LVA syndrome was always larger in low-tone frequencies
than in persons with sudden deafness at the same air conduction level. They also found that
the resonant frequency was rather low in patients with LVA syndrome compared with that in
normal control subjects (Nakashima et al., 2000).
31

32
Other investigators have suggested that cochlear conductive hearing impairment is the cause of
conductive hearing impairment in patients with EVAs (Arjmand and Webber, 2004).
And others suggested that a large vestibular aqueduct introduces a third mobile window into
the inner ear, which can produce an air-bone gap (Merchant et al., 2007).
When The VEMP threshold was measured in patients with LVA with mixed hearing loss it was
greater in amplitude and lower in threshold. Lower VEMP threshold, confirmed the theory of a
'third window' that allows volume and pressure displacements, and thus larger deflection of the
vestibular sensors (Schmerber et al., 2004).
32
33
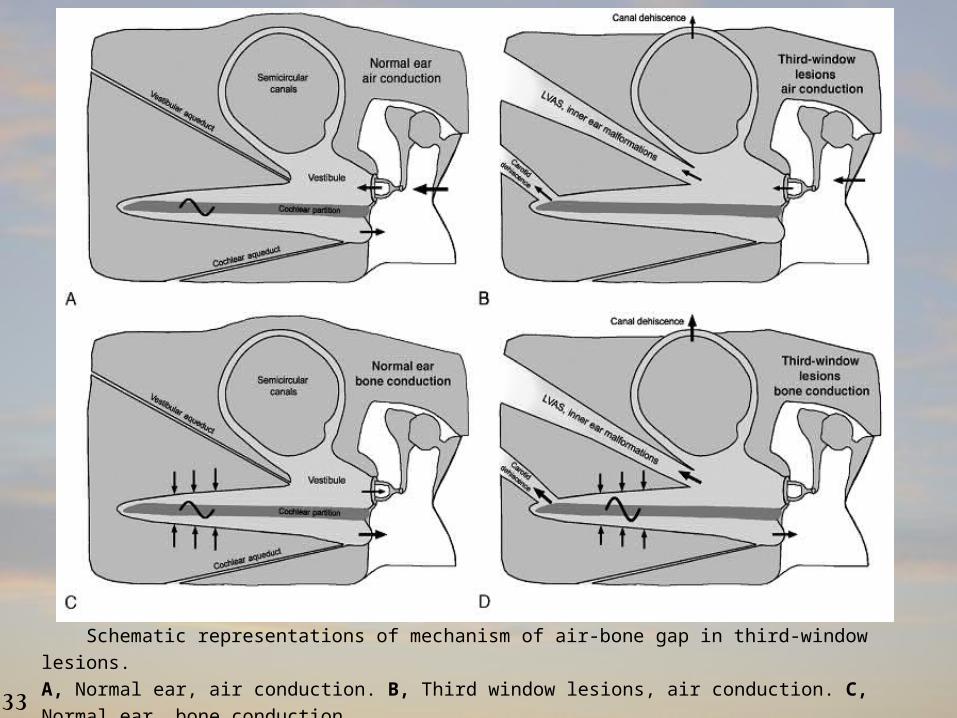
Schematic representations of mechanism of air-bone gap in third-window lesions.
A, Normal ear, air conduction. B, Third window lesions, air conduction. C, Normal ear, bone conduction.
D, Third-window lesions, bone conduction. (Merchant and Rosowski, 2008).33

34
Vertigo :
It has also been speculated that patients homozygous for H723R (His723Arg) tend to have
more episodes of vertigo than heterozygous patients. And they tended to have hearing fluctuation,
compared with the patients without vertigo. The relationship between the morphology of inner ear
structures and the presence of vertigo in LVAS has not been reported.
However, the relation between the morphology of the lateral semicircular canal (LSCC) and
vertigo in patients with LVAS was demonstrated. It was found that cerebrospinal fluid (CSF)
pressure waves pass through the enlarged vestibular aqueduct and may damage the
hair cells in the labyrinth (Ishida et al., 2006).
34

35
Management of EVA :
• Conservative management and amplification:
Conservative measures of the EVAS has been advocated and includes both avoidance of head
trauma or barotraumas, common cold, exercises such as weightlifting, diving and also long-term
exposure to sunshine and using of suitable hearing aids. Despite conservative measures, a large
number of affected patients continue to experience progressive hearing loss.
• Proposed surgical interventions for patients with EVAS have been limited and include:
The endolymphatic subarachnoid mastoid shunt and packing of the endolymphatic sac. The shunt
operation was strongly discouraged by Jackler and De La Cruz when four of seven patients suffered
an average decline in pure-tone average of 25 dB and 37% speech discrimination after shunt
placement (Welling et al., 1998).
There are 2 other surgical procedures that attempt to stabilize hearing in EVA patients:
• intraluminal occlusion of the endolymphatic sac.
• extraluminal extradural occlusion of the endolymphatic duct (Welling et al., 1999).
35

36
•Corticosteroid therapy:
Corticosteroid therapy (prednisolone 1-2 mg/kg/day) or equal titer's dexamethasone was
Administered as soon as sudden hearing loss developed in EVA patients. The pure tone audiometric
result improved more than 10dB at two or more consecutive frequencies. After receiving
corticosteroid, response rate was 85% (Lin et al., 2005).
•Hyperbaric oxygen (HBO) therapy:
It was performed on 22 occasions to a girl who was diagnosed with EVA and suffering from
sudden right sensorineural hearing loss not responding to steroid and prostaglandin therapy.
During the HBO2 therapy, her right hearing ability returned almost to the level determined prior
to the abrupt loss. So, HBO2 therapy was recommended for the treatment of SNHL associated with
LVAS if the hearing ability does not recover following conventional treatment (Nakashima et al.,
1999).
36

37
•Chemical labyrinthectomy:
Vertigo related to the EVAS may be unresponsive to pharmacotherapy. So, chemical
labyrinthectomy may be used instead. It was believed that this technique can be recommended in
patients with incapacitating vertigo due to unilateral vestibular aqueduct enlargement (Faye et al.,
2005).
• The cochlear implantation:
CI might be performed if hearing loss affects learning at school. Child with LVAS is considered
to be a candidate for a cochlear implant if hearing deteriorates despite the optimal hearing aids. If
their hearing fluctuates and subsequently improves, the children are kept under observation. If the
periods of inadequate hearing begin to adversely affect school performance, or if there are more
than 3 episodes of significantly decreased hearing within 1 year, the child becomes a possible
candidate (Au and Gibson, 1999).
37

3838

39
The vestibule (a) and lateral semicircular canal (b). The posterior semicircular canal (c) and vestibular aqueduct (d) still are visible posteriorly. The vestibular aqueduct is passing from the endolymphatic sac (e)which indents the posterior margin of the petrous bone, towards the vestibule. Posteriorly and laterally, the sigmoid sinus (f) is visible, and medially, the internal auditory canal (g) is the indentation on the medial border of the petrous bone. Note the middle ear space superior to the uppermost aspect of the tympanic membrane, the epitympanum, which houses the head of the malleus, as well as the body and short process of the incus (h). The petrous apex is visible (i) (Abbott et al., 2006).
AXIAL CT IMAGE OF THE TEMPORAL BONE:
39

40
CORONAL CT IMAGING OF THE TEMPORAL BONE:
Typical appearance and course of
the normal vestibular aqueduct from
posterior to anterior on routine coronal
computed tomographic scan. Arrows
point out the bony vestibular aqueduct
from its most posterior aspect (A) to
its entrance into the vestibule (G).
Further anteriorly, only the vestibule
is visible (H-I) (Murray et al., 2000).
40

41
Radiological
findings in EVA
High-resolution, thin-section CT scanning of the temporal bones has been the
mainstay of inner ear imaging in children with SNHL. The criteria for determining an
enlarged vestibular aqueduct are some what vague. The width of the aqueduct was
measured in two places:
1. The operculum (a line perpendicular to the posterior surface of the petrous
pyramid going to the most lateral or posterolateral pixel in the medial wall of the
operculum).
2. The mid point (The halfway point between the operculum and the posterior wall of
the crus commune or vestibule) (Madden et al., 2003).
41

42
A vestibular aqueduct diameter greater than or equal to 1.5 mm at the
mid point or greater than or equal to 2 mm at the operculum was defined as
an EVA. A mid point of 1.0 to 1.4 mm and an operculum of 1.5 to 1.9 mm
were considered border line EVA. A borderline EVA inculde both those with a
borderline mid point (1.0–1.5mm) and operculum (1.5–2.0mm), and those
with borderline operculum alone. Less than 1.0 mm for the mid point and 1.5
mm for the operculum were reported as normal VA (Madden et al., 2003).
42

43
Temporal bone image showing VA measurements at the midpoint (mp) and at the operculum (op) (Madden et al., 2003).
43

44
In each tomographic study performed, the radiographic appearance of the vestibular
aqueduct (VA) was carefully evaluated. The configuration of the VA was then
classified as suggested by Clemis and Valvassori into four groups (Emmett, 1985):
a) Normal VA: b) Obliterated VA:
d) EVA:
44
c) filliform:
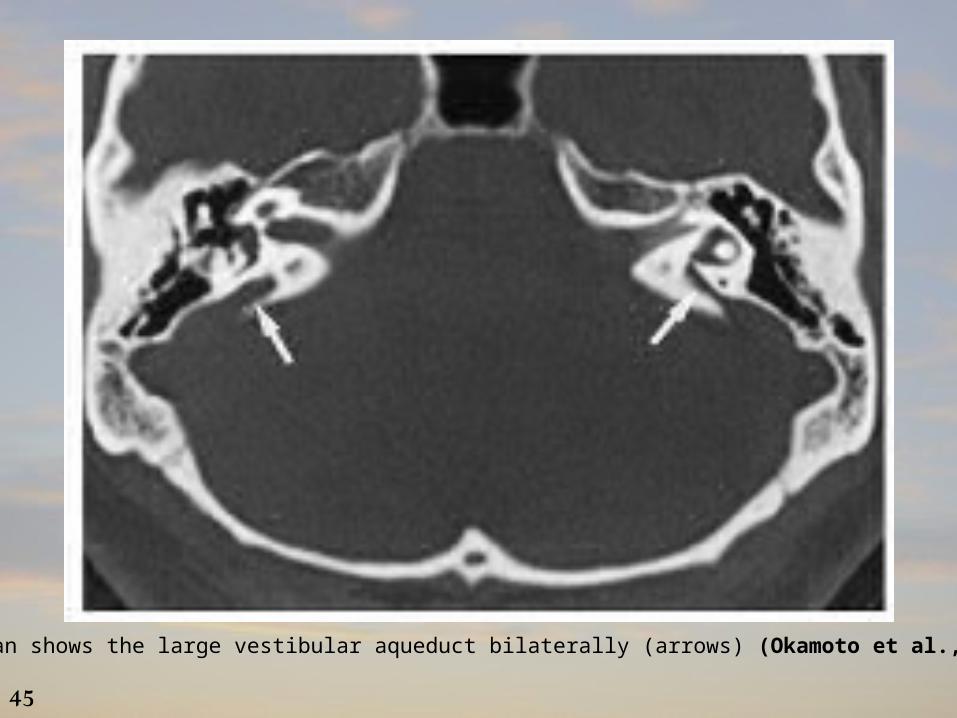
45CT scan shows the large vestibular aqueduct bilaterally (arrows) (Okamoto et al., 1997).
45

4646

47
Subjects:
• The study group comprised of 16 patients suffering from non-syndromic
sensorineural hearing loss since childhood.
• The control data was the normal radiological dimensions of the vestibular
aqueduct when investigated by HRCT.
Equipment:
1.Sound treated room.
2.Two channels clinical audiometer: orbiter 922.
3.Immittancemeter: GSI 33 version ΙΙ. Reflexes were tested at frequencies 500
to 4000 Hz.
4.Computed tomography imaging (CT): GE Light Speed Plus multislice machine
(4 slices), slice thickness was 1.25 mm, with interslice gap 0 mm.
47

48
Methods:
All patients included in the study were submitted to the following assessment protocol:
1.full history taking including: Personal history, history of hearing loss, Normal delivery and healthy full term infant, No prenatal complications, No neonatal or early postnatal complications and negative risk factors (e.g.: kernicterus, cyanosis…), history to exclude thyroid dysfunction, or other diseases, Family history of similar condition.
2.General and neurological examination.
3.Full ENT examination.
4.Audiological evaluation: including
a) Pure tone audiometry: including (air conduction and Bone conduction).
b) Speech audiometry: including (speech reception threshold (SRT), Word
discrimination score (WDS%) ).
c) Immittancemetry: including (single frequency tympanometry with a probe tone
of 226 Hz). This test was done to exclude middle ear abnormalities. Testing of
acoustic reflex threshold.
48

49
5.Radiological evaluation:
Non contrast CT scan of the petrous temporal bone in axial and coronal planes
was done to all patients included in the study.
6.Data were tabulated and statistically analyzed to evaluate the differences between
the groups under the study as regards the various parameters. Comparisons were
made in different groups using the Chi-square test. Together, correlations were tried
in between the essential studied parameters. A difference was considered statistically
significant when the probability (p) value was < 0.05.
49

5050

51
• Patient group:
The age ranged from 6 to 20 years with a mean age of 11.75 years ± 4.421. The study
comprised of 11 males and 5 females. The duration of hearing loss ranged from 0.5 to 15 years
with a mean of 5.091 years ± 5.439.
• Radiographic findings :
The study group (32 ears) was further subdivided according to the size of the vestibular aqueducts
as measured at two points (the mid point and the operculum) into:
EVA → group A,
Border line EVA → group B,
Normal VA dimensions → group C.
51

52
Table (1): showing the number and percent of ears in each group.
VA descriptionNo. of ears%
Group A618.750%
Group B1134.375%
Group C1546.875%
Total32100%
6
11
15
0
2
4
6
8
10
12
14
16
Group A Group B Group C
Ear
num
bers
Group A
Group B
Group C
Showing number of ears in each group A, B and C.52

53
Table (2): showing the mean and standard deviation (SD) of age in the 3 groups of the study.
10
11.8212.4
0
2
4
6
8
10
12
14
years
Group A Group B Group C
mean ages in the 3 study groups
Group A
Group B
Group C
illustrating the mean age of the 3 groups of the study.
N o . M e a n S D
A g e
G r o u p A 6 1 0 ± 2 .6 8 3
G r o u p B 1 1 1 1 .8 2 ± 5 .1 5 4
G r o u p C 1 5 1 2 .4 ± 4 .4 6 9
T o ta l 3 2 1 1 .7 5 ± 4 .4 2 1
N o . M e a n S D
A g e
G r o u p A 6 1 0 ± 2 .6 8 3
G r o u p B 1 1 1 1 .8 2 ± 5 .1 5 4
G r o u p C 1 5 1 2 .4 ± 4 .4 6 9
T o ta l 3 2 1 1 .7 5 ± 4 .4 2 1
53

54
Table (3) showing the number and percent of ears of each group which are further subdivided according to ear affected (Rt or Lt).
3
5
8
16
3
67
16
0
2
4
6
8
10
12
14
16
18
Group A Group B Group C total
Vestibular aqueduct description
Ea
rs n
um
be
r
Lt Ear
Rt ear
showing number of right and left ears included in each group.
There was no statistically significant difference (P> 0.05) between the 3 study groups as regard laterality.
G r oup A G r oup B G r oup C total P value
L t E ar N o. 3 5 8 1 60 . 9 2 4
% 1 8 . 7 5 % 3 1 . 2 5 % 5 0 % 1 0 0 %
R t ear N o. 3 6 7 1 60 . 9 2 4
% 1 8 . 7 5 % 3 7 . 5 0 % 4 3 . 7 5 % 1 0 0 %
G r oup A G r oup B G r oup C total P value
L t E ar N o. 3 5 8 1 60 . 9 2 4
% 1 8 . 7 5 % 3 1 . 2 5 % 5 0 % 1 0 0 %
R t ear N o. 3 6 7 1 60 . 9 2 4
% 1 8 . 7 5 % 3 7 . 5 0 % 4 3 . 7 5 % 1 0 0 %
54

55
• Audiometric Findings :
a) Severity :
Table (4) showing ears involved in each group tabulated versus the degree of hearing loss. Data
presented in both number and percent .
There was no statistically significant difference (P> 0.05) between the 3 groups as regard the severity of hearing loss.
Severity of hearing loss
T otal P valueSlig ht M ild M oderate M S Severe P rofound T H L
G r oup Acount 0 0 4 0 0 1 1 6
0 . 2 6 3
% 0 % 0 % 1 2 . 5 % 0 % 0 % 3 . 1 2 5 % 3 . 1 2 5 % 1 8 . 7 5 %
G r oup Bcount 1 1 1 4 1 0 3 1 1
% 3 . 1 2 5 % 3 . 1 2 5 % 3 . 1 2 5 % 1 2 . 5 % 3 . 1 2 5 % 0 % 9 . 3 7 5 % 3 4 . 3 7 5 %
G r oup Ccount 1 2 4 4 2 2 0 1 5
% 3 . 1 2 5 % 6 . 2 5 % 1 2 . 5 % 1 2 . 5 % 6 . 2 5 % 6 . 2 5 % 0 % 4 6 . 8 7 5 %
T otal count 2 3 9 8 3 3 4 3 2 ( 1 0 0 % )
55

56
0 0
4
0 01 1
6
1 1 1
4
10
3
11
12
4 4
2 2
0
15
0
2
4
6
8
10
12
14
16
Slight Mild Moderate MS Severe Profound THL Total
Severity of hearing loss
num
ber
of e
ars
Group A Group B Group C
Showing the number of ears according to the degree of hearing loss. M.S.= moderately severe.
56

57
• Audiometric Configuration:
Table (5) Showing the distribution of different PTA Configurations among the 3 study groups.
There was no statistically significant difference among the 3 groups as regards the PTA Configuration (P > 0.05).
R ising F lat R C B
Sloping
T H L T otal P valueG rad ual P recip itous S harp
G roup A 1 1 0 1 2 0 1 6
0 . 1 9 2G roup B 1 1 1 1 1 3 3 1 1
G roup C 2 1 1 5 5 1 0 1 5
T otal 4 3 2 7 8 4 4 3 2
R ising F lat R C B
Sloping
T H L T otal P valueG rad ual P recip itous S harp
G roup A 1 1 0 1 2 0 1 6
0 . 1 9 2G roup B 1 1 1 1 1 3 3 1 1
G roup C 2 1 1 5 5 1 0 1 5
T otal 4 3 2 7 8 4 4 3 2
57

58
1 1
0
1
2
0
11 1 1 1 1
3 3
2
1 1
5 5
1
00
1
2
3
4
5
6
Rising Flat RCB Gradual Precipitous Sharp THL
PTA Configurations
Ear
s N
um
ber
Group A Group B Group C
Figure showing different PTA configurations in each group and the number of ears in each configuration.
58

59
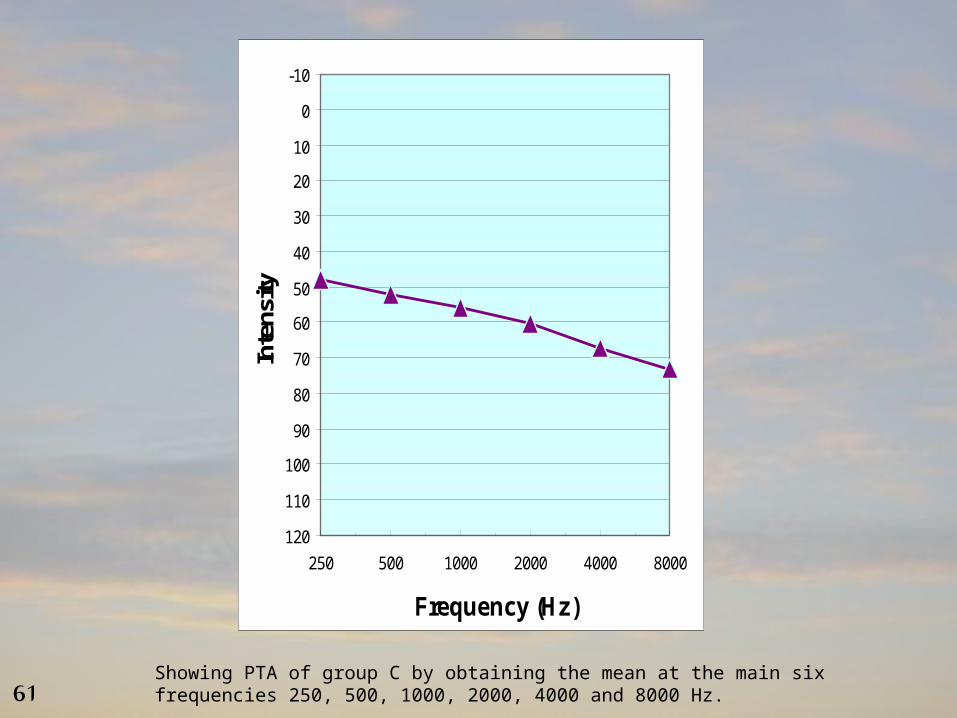
Table (6) showing the mean, standard deviation and range of hearing threshold level in )dBHL (at the main six frequencies in the 3 groups.
Group AGroup BGroup C
Hzmean SDMinMaxmean SDMinMaxmea
n SDMinMaxP value
25061.67±30.1113510063.1
8±26.7652510047.7
6±25.275251050.224
50067.5±33.7274012068.6
4±36.3382512052±26.78251100.295
100071.67±32.3524512069.0
9±39.4221012055.6
7±29.208151100.489
200068.33±31.574512070±38.9871512060.3
3±30.791101200.894
400068.33±30.2773512071.8
2±35.9362512067.3
3±32.064101200.975
800080±15.8116010075.9
1±24.7813010073.3
3±31.829151000.939
There was no statistically significant difference among the 3 groups as regards the mean of different frequencies (P > 0.05).
59

60
-10
0
10
20
30
40
50
60
70
80
90
100
110
120
250 500 1000 2000 4000 8000
Frequency (Hz)
Inte
nsity
Figure showing PTA of group A by obtaining the mean at the main six frequencies 250, 500, 1000, 2000, 4000 and 8000 Hz.
-10
0
10
20
30
40
50
60
70
80
90
100
110
120
250 500 1000 2000 4000 8000
Frequency (Hz)In
tens
ity
Showing PTA of group B by obtaining the mean at the main six frequencies 250, 500, 1000,2000, 4000 and 8000 Hz.
60
61
-10
0
10
20
30
40
50
60
70
80
90
100
110
120
250 500 1000 2000 4000 8000
Frequency (Hz)
Inte
nsity
Showing PTA of group C by obtaining the mean at the main six frequencies 250, 500, 1000, 2000, 4000 and 8000 Hz.61

62
• Immittancemetry Findings:
Table (7) showing distribution of different tympanometric findings among the 3 study groups
Type A, ARType A, no ARType As, no ARTotal
Group A2316
Group B38011
Group C68115
Total1119232
6
3
2
88
3
1
0
1
0
1
2
3
4
5
6
7
8
Ears Number
Type A, + AR Type A, no AR Type As, no AR
Group A Group B Group C
Figure showing the number of ears in each group according to the tympanometric findings. AR= acoustic reflexes.
62

63
Table (8) shows the mean and standard deviation of the word discrimination score
(WDS) in % in the 3 groups under the study
group Agroup Bgroup CX²P
value
meanSDmeanSDmeanSD
WDS%59.33%± 41.68%
54.55%
± 39.33%
70.13%
± 29.31%
1.0150.602
There was no statistically significant difference between the 3 groups as regard WDS% (p > 0.05).
63

64
In a trial to find relation between both the VA operculum and mid point and different variables, Pearson correlation was done and shown in the following tables:
Table (9) showing the Pearson correlation coefficient (r) of the vestibular aqueduct (VA) operculum and mid point with age.
Table (10) showing the Pearson correlation coefficient (r) of the vestibular aqueduct (VA) operculum and mid point with the word discrimination score (WDS %)
There was no statistically significant correlation between size of the operculum or the mid point with age.
There was no statistically significant correlation between size of the operculum or the mid point with the word discrimination score (WDS %) (p>0.05).
V A ope rc ulum V A m id p oint
A ger - 0 . 2 7 8 - 0 . 2 8 2
p 0 . 1 2 3 0 . 1 1 8
V A ope rc ulum V A m id p oint
A ger - 0 . 2 7 8 - 0 . 2 8 2
p 0 . 1 2 3 0 . 1 1 8
V A ope rc ulum V A m id p oint
W D S%r 0 . 0 4 8 - 0 . 0 0 2
p 0 . 7 9 6 0 . 9 9 2
V A ope rc ulum V A m id p oint
W D S%r 0 . 0 4 8 - 0 . 0 0 2
p 0 . 7 9 6 0 . 9 9 2
64

65
Table (11) showing the Pearson correlation coefficient (r) of the vestibular aqueduct (VA) operculum and mid point with pure tone thresholds at the main six frequencies.
There was no statistically significant correlation between size of the operculum or the mid point with pure tone thresholds at different frequencies (p>0.05).
0 .8 6 40 .8 3 8p
-0 .0 3 2-0 .0 3 8r8 0 0 0 H z
0 .7 10 .5 0 9p
-0 .0 6 8-0 .1 2 1r4 0 0 0 H z
0 .9 9 70 .8 2 9p
0 .0 0 1-0 .0 4r2 0 0 0 H z
0 .7 1 60 .8 5 1p
0 .0 6 70 .0 3 5r1 0 0 0 H z
0 .6 9 60 .8 6 4p
0 .0 7 20 .0 3 1r5 0 0 H z
0 .6 7 20 .8 3p
0 .0 7 80 .0 3 9r2 5 0 H z
V A m id p o in tV A o p er c u lu m
65
66
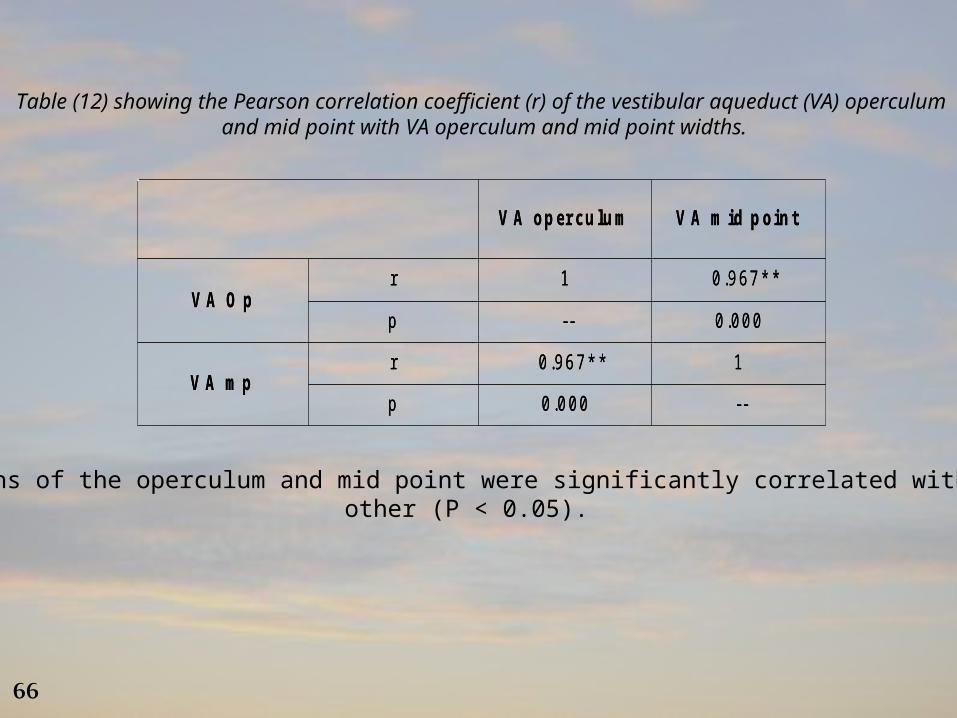
Table (12) showing the Pearson correlation coefficient (r) of the vestibular aqueduct (VA) operculum and mid point with VA operculum and mid point widths.
The widths of the operculum and mid point were significantly correlated with each other (P < 0.05).
V A o p er c u lu m V A m id p o in t
V A O pr 1 0 .9 6 7 * *
p -- 0 .0 0 0
V A m pr 0 .9 6 7 * * 1
p 0 .0 0 0 --
V A o p er c u lu m V A m id p o in t
V A O pr 1 0 .9 6 7 * *
p -- 0 .0 0 0
V A m pr 0 .9 6 7 * * 1
p 0 .0 0 0 --
66

67
CT scans of some cases included in the study
67

68
Examples of patients included in Group A (EVA) :
CT scan of female child aged 7 years old Showing bilateral EVA:
*Rt VA operculum = 6.0mm &
mid point = 3.8mm.
*Lt VA operculum = 5.2mm &
mid point = 3.8 mm.
68

69
Another male child patient aged 10 years old was diagnosed withAnother male child patient aged 10 years old was diagnosed withbilateral EVA :bilateral EVA :
Rt VA op = 2.4mmRt VA op = 2.4mm mp = 1.6mmmp = 1.6mm
Lt VA op = 3.6mmLt VA op = 3.6mm mp = 1.9mmmp = 1.9mm
69

70
Some CT scans of patients in Group B (Borderline EVA):Some CT scans of patients in Group B (Borderline EVA):
Rt op = 1.5 mmRt op = 1.5 mm mp = 1.2 mmmp = 1.2 mm
Lt op = 1.5 mmLt op = 1.5 mm mp = 1.1 mmmp = 1.1 mm
Rt op = 1.9 mmRt op = 1.9 mm mp = 0.9 mm mp = 0.9 mm 70

71
Examples of CT scans of Group C (normal VA dimensions) :Examples of CT scans of Group C (normal VA dimensions) :
Lt op = 1.1 mmLt op = 1.1 mm mp = 0.6 mmmp = 0.6 mm
Lt op = 1.1 mmLt op = 1.1 mm mp = 0.8 mmmp = 0.8 mm
71

7272

73
A large vestibular aqueduct can be demonstrated by computed tomography (CT). The
endolymphatic duct and part of the sac are contained in the vestibular aqueduct. Magnetic
resonance (MR) images can also show the anatomy and abnormalities of the fluid spaces related
to the membranous labyrinth (Okamoto et al., 1997).
In the present study, the quantitative and qualitative aspects of HRCT scan of 16 patients having
non-syndromic sensorineural hearing loss since childhood were assessed. The study group (32
ears) was further subdivided according to the size of the vestibular aqueducts into:
EVA → group A (6 ears),
Border line EVA → group B (11 ears),
Normal VA → group C (15 ears).
73

74
The age ranged from 6 to 20 years with a mean age of 11.75 years ± 4.421 in the study group. The
duration of hearing loss ranged from 0.5 to 15 years with a mean of 5.091 years ± 5.439. The mean of
age in each group was showing the following:
In group A: the mean of age was 10 years ± 2.683.
The average age at which hearing loss started was 6.667 years ± 2.994.
In group B: the mean of age was 11.82 years ± 5.154.
Hearing loss onset age was 7.773 years on average ± 4.796.
In group C: the mean age was 12.4 years ± 4.469.
Average age at which hearing loss started was 6.091 years ± 4.888.
This finding is in agreement with Tong et al., (1997) who found that hearing loss in EVAS usually
occurs at birth or in early childhood, less commonly in adolescence and occasionally in adulthood.
And also in agreement with the study of Su-zhen et al., (2006) who found that the onset of hearing
loss was often at early childhood, their study was on 100 cases, hearing loss started below the age of 7
years in 95 cases and between 8 years to adulthood in the other 5 cases. The starting age of hearing loss
was 3.9 years on average.
74

75
As regard the laterality (i.e.: right and left ears in each group) in the current study,
there were in group A, 3 ears right and 3 ears left. In group B, there were 6 ears right
and 5 ears left. In group C, there were 7 ears right and 8 ears left. There was no
statistically significant difference (P> 0.05) between the 3 study groups as regard
laterality.
This finding is in agreement with the study of Vijayasekaran et al., (2007) who
compared the median (range) measurements of the VA at the mid point for the left and
right ears of the 73 subjects; they noted no statistically significant differences.
75

76
As regards the audiometric results of the current study, all patients included in the study were
diagnosed with sensorineural hearing loss. The severity of hearing loss as determined by pure tone
averages (of 500 Hz, 1000 Hz, 2000 Hz and 4000 Hz) were; 2 ears demonstrating slight SNHL, 3
with mild SNHL, 9 with moderate SNHL, 8 with moderately severe SNHL, 3 with severe SNHL, 3
with profound SNHL and 4 with total hearing loss (THL). They were distributed among the 3 study
groups as follow:
In group A: there were 4 ears with moderate SNHL, 1 with profound SNHL and 1 with THL.
In group B: there were 1 ear with slight SNHL, 1 with mild SNHL, 1 with moderate SNHL, 4
with moderately severe SNHL, 1 with severe SNHL and 3 with THL.
In group C: 1 ear with slight SNHL, 2 with mild SNHL, 4 with moderate SNHL, 4 with
moderately severe SNHL, 2 with severe SNHL and 2 with profound SNHL.
There was no statistically significant difference between the 3 groups as regard the severity of
hearing loss.
76

77
These results are in accordance with Pinto et al., (2005) who found that there is no
correlation between the level of hearing loss and width of the aqueduct.
And also in accordance with the results of Su-zhen et al., (2006) who measured the
diameters of EVA cases in the axial planes of the temporal bone & found no correlation
between the EVA and hearing loss (r=0.067, P>0.05).
77

78
About the distribution of different PTA configurations among the 3 groups of the present study:
In group A: high frequency sloping curve is the more frequent one in 3 ears, followed by flat
audiogram in 1 ear, the rising audiogram in 1 ear and total hearing loss in 1 ear.
In group B: also the more frequent one was the high frequency sloping audiogram in 5 ears,
total hearing loss in 3 ears, flat audiogram in 1 ear, rising audiogram in 1ear and
RCB (reversed cockie bite) in 1 ear.
In group C: the more frequent one was also the high frequency sloping audiogram in 11 ears,
rising configuration in 2 ears, flat configuration in 1 ear and RCB audiogram in
1 ear.
There were no statistically significant differences between the VA operculum and midpoint and
the PTA configurations in the 3 groups.
78

79
These findings concerning the PTA configurations are in agreement with those of Su-zhen et al., (2006) who found that the SNHL of LVAS is most commonly high-frequency with a down-sloping configuration, from moderate to profound hearing loss at speech frequencies.
And also these results are in agreement with those of Pinto et al., (2005) who stated that There is no audiometric curve that characterizes or indicates the hypothesis of LVAS, reason why we should be attentive in cases of mixed loss and NSSNHL in childhood. But it was reported that one of the main characteristics of LVAS is fluctuating NSSNHL, especially in high frequencies.
And also in agreement with Tong et al., (1997) who found that most patients with EVA had
severe and progressive sensorineural hearing loss with predominantly high frequency involvement
initially.
And also in accordance with the findings of Madden et al., (2003) who found that the most
common audiometric configurations were down-sloping in 39% of ears of their study group and
flat in 35% of ears. A reversed cookie-bite shape was found in 17% of ears and an up-sloping
configuration in 9%. Also, they performed an analysis of audiometric parameters and VA size.
Individually, the PTA and audiogram configuration for each child showed no correlation with the VA
size. 79

80
In the current study, the Pearson correlation coefficient (r) of the VA operculum and
of the mid point were done with age, pure tone thresholds at the main six frequencies
and word discrimination score (WDS %).
There was no statistically significant correlation between size of the operculum or mid
point with any of these variables (age, pure tone thresholds at different frequencies,
word discrimination score (WDS %).
These results are in accordance with the study of Legeais et al., (2006) who found that
there was no statistically significant variability in vestibular aqueduct diameter as a function of
age of patients. As the aqueduct in young children evolves in form until the age of 3 years
and then stabilizes. Thus, the size of the aqueduct should be identical in all individuals older
than 3 years.
80

81
While these results are not in agreement with Antonelli et al., (1998), who evaluated the width
or thickness of the VA and its morphology, but the evaluation of the VA morphology was not done in
the present study.
Antonelli et al. performed CT scans 1-mm to all patients included in the study. They defined the
LVA when its width > 1.5 mm. The patency of the origin of the endolymphatic duct was graded
according to the following scale:
1= lumen of the duct visible only at the posterior fossa cortical plate;
2= lumen visible adjacent to the common crus;
3= dilated sac and duct (lumen larger than that of the common crus), but patency not visible
at entrance into the vestibule;
4= dilated duct with moderate patency (less than or equal to the lumen of the common crus,
i.e., a "double-barrel" appearance); and
5= dilated duct with high-grade patency at entrance into the vestibule (patency greater than
the lumen of the common crus). They found that the VA morphology and thickness were
correlated with hearing loss.
These results are also in accordance with the results of Vijayasekaran et al., (2007) who
found that no linear relationship between the width of the VA and the age of the subject.
And also in accordance with Pinto et al., (2005) who found that there is no correlation at the
level of hearing loss with age or width of the aqueduct.
81
82
In the current study when the Pearson correlation coefficient (r) was done
between the VA operculum and the VA mid point widths with each other, they
were significantly correlated with each other (P= 0.00).
These results are in accordance with the results of Vijayasekaran et al.,
(2007) who found that the widths of the operculum and mid point were
significantly correlated with each other (Pearson = 0.61, P ≤ .0001).
82

8383

84
1) EVA is considered one of the most common inner ear anomalies.
2) Each patient with NSSNHL should have HRCT with measuring of the
VA operculum and midpoint to exclude EVA or borderline EVA.
3) With the present measurements EVA is not related to the level of
hearing loss or configuration.
4) Inspite of non significant findings, high frequency hearing loss is
considered the most common configuration in patient with EVA as other
studies suggested it.
5) Measuring of the VA thickness and morphology is another method of
CT scan measurements recommended for further application.
84

