enma 6010: state transition diagrams1 enma 6010 state transition diagrams modeling time-dependent...
TRANSCRIPT
ENMA 6010: State Transition Diagrams 1
ENMA 6010
State Transition Diagrams
Modeling Time-Dependent Behavior
Reference: Wikipedia – State Transition Diagrams
© 2010 Mark PolczynskiAll rights reserved

ENMA 6010: State Transition Diagrams 2
Characteristics of Good Models
1.Graphical, with support for detailed text descriptions: Picture is worth a thousand words picture links to a thousand words.
2.Top-down partitionable: Globe Continents Countries
3.Minimally redundant: Make changes in just one place in the model.
4.Transparent: Requires no expertise in model building to understand the model.
ENMA 6010: State Transition Diagrams 3
Goals of System Modeling:
1.To focus on important system features while downplaying less important features,
2.To discuss changes and corrections to the user’s requirements at low cost and with minimal risk,
3.To verify that we understand the user’s environment,
4.To verify that we have documented our understanding in a way that would allow others to construct/maintain the system.
ENMA 6010: State Transition Diagrams 4
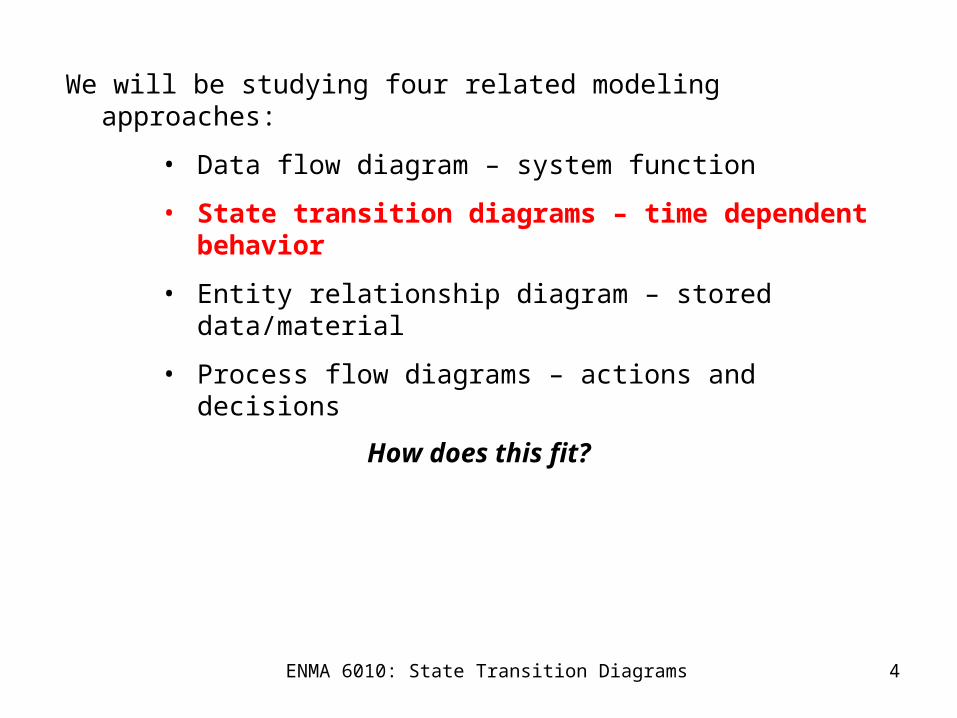
We will be studying four related modeling approaches:
• Data flow diagram – system function
• State transition diagrams – time dependent behavior
• Entity relationship diagram – stored data/material
• Process flow diagrams – actions and decisions
How does this fit?
ENMA 6010: State Transition Diagrams 5
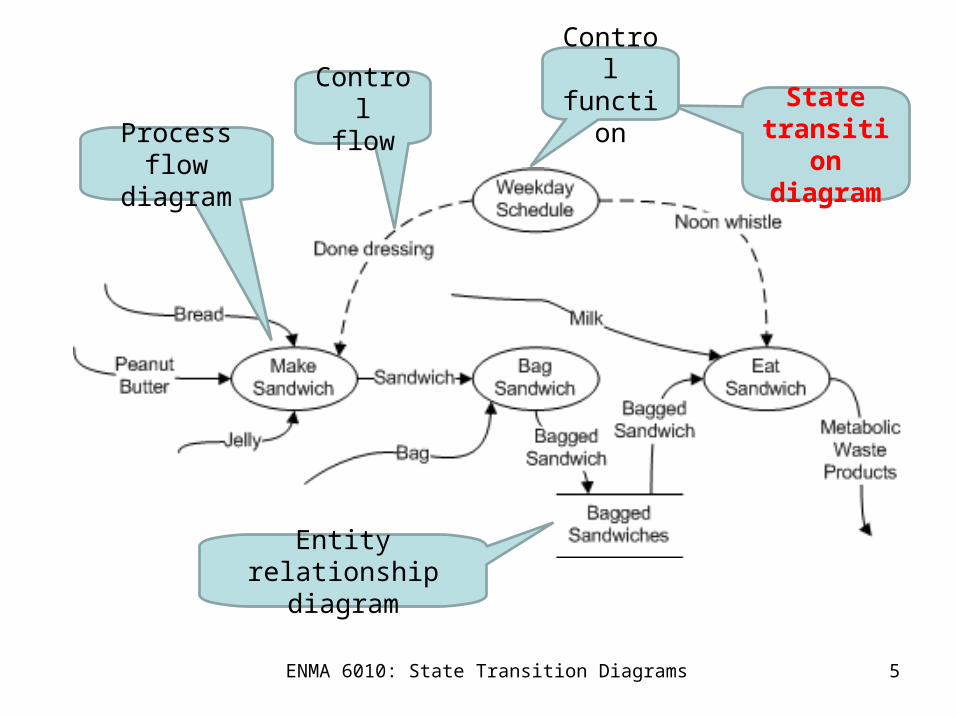
Statetransitiondiagram
Entity relationship diagram
Process flow diagram
Controlflow
Control function
ENMA 6010: State Transition Diagrams 6
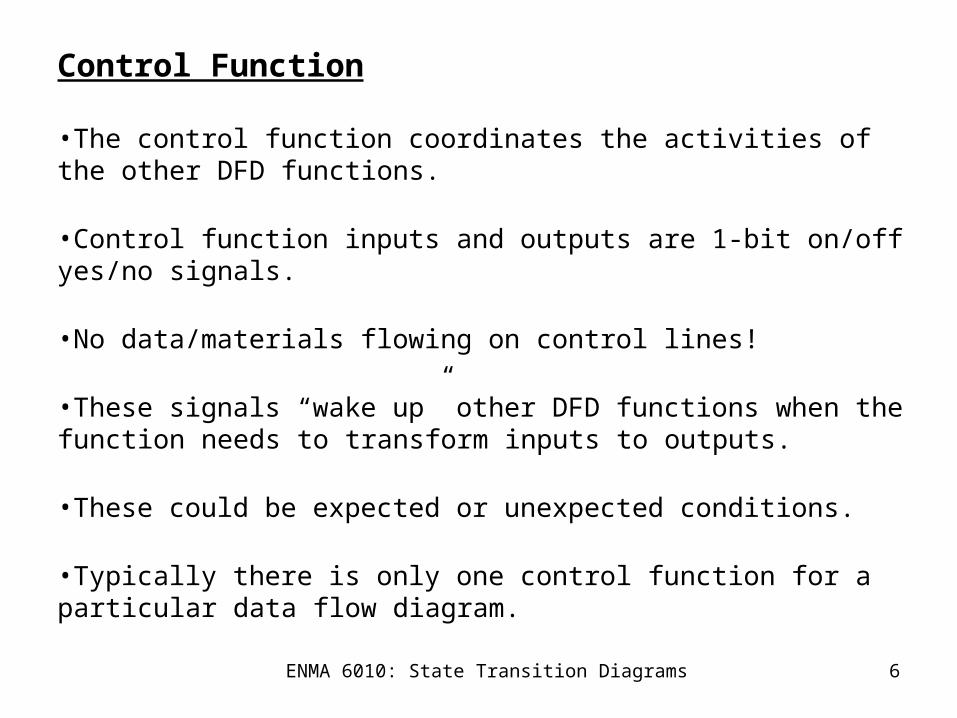
Control Function
•The control function coordinates the activities of the other DFD functions.
•Control function inputs and outputs are 1-bit on/off yes/no signals.
•No data/materials flowing on control lines!
•These signals “wake up” other DFD functions when the function needs to transform inputs to outputs.
•These could be expected or unexpected conditions.
•Typically there is only one control function for a particular data flow diagram.
ENMA 6010: State Transition Diagrams 7
STD vs. DFD
•The state transition diagram goes inside the control function.
•The control function inputs and outputs connect to the state transition diagram.
•The STD defines how the DFD functions (bubbles) get turned on and off.
•Thus, the state transition diagram controls system sequencing and timing.
Let’s see how this works…
ENMA 6010: State Transition Diagrams 8
State Transition Diagrams
State:Some behavior of a system that is observable and that lasts for some period of time.
A state is when a system is:
• Doing something – e.g., heating oven, mixing ingredients, accelerating engine,
• Waiting for something to happen – Waiting for user to enter password, waiting for sensor reading.
Transition: (Virtually) instantaneous change in state (behavior).
ENMA 6010: State Transition Diagrams 9
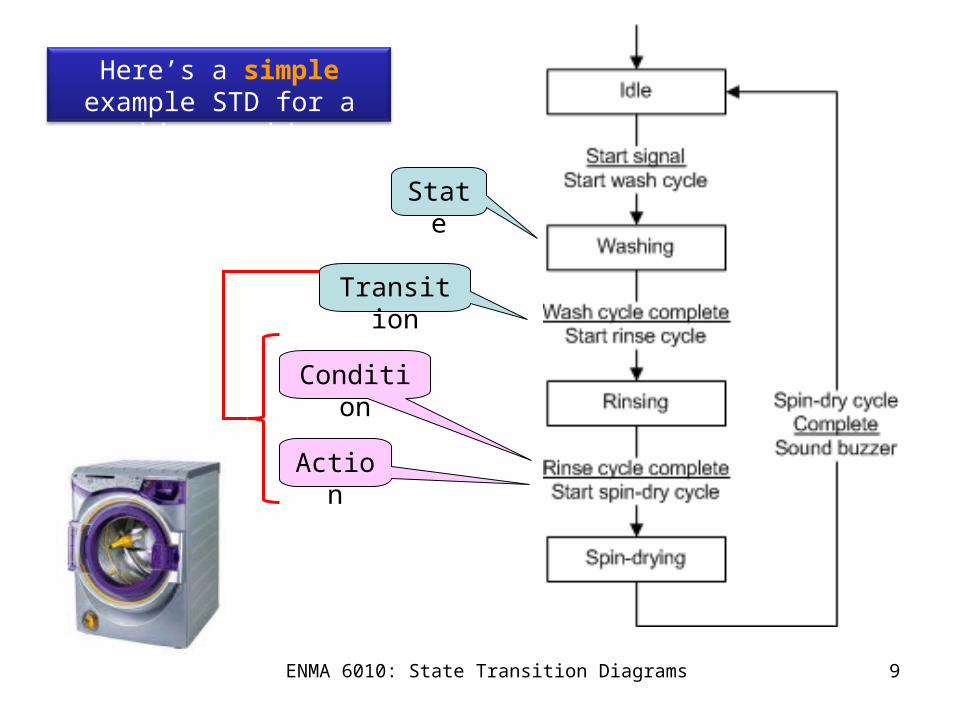
Here’s a simple example STD for a washing machine.
State
Transition
Condition
Action
ENMA 6010: State Transition Diagrams 10
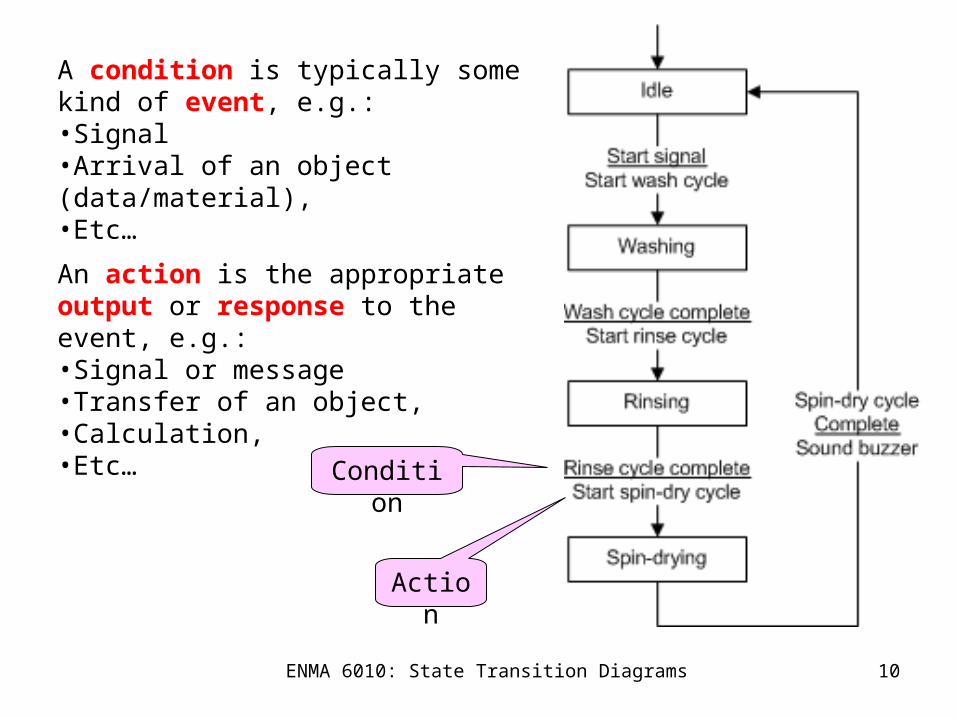
A condition is typically some kind of event, e.g.:•Signal•Arrival of an object (data/material),•Etc…
Condition
Action
An action is the appropriate output or response to the event, e.g.:•Signal or message•Transfer of an object,•Calculation,•Etc…
ENMA 6010: State Transition Diagrams 11
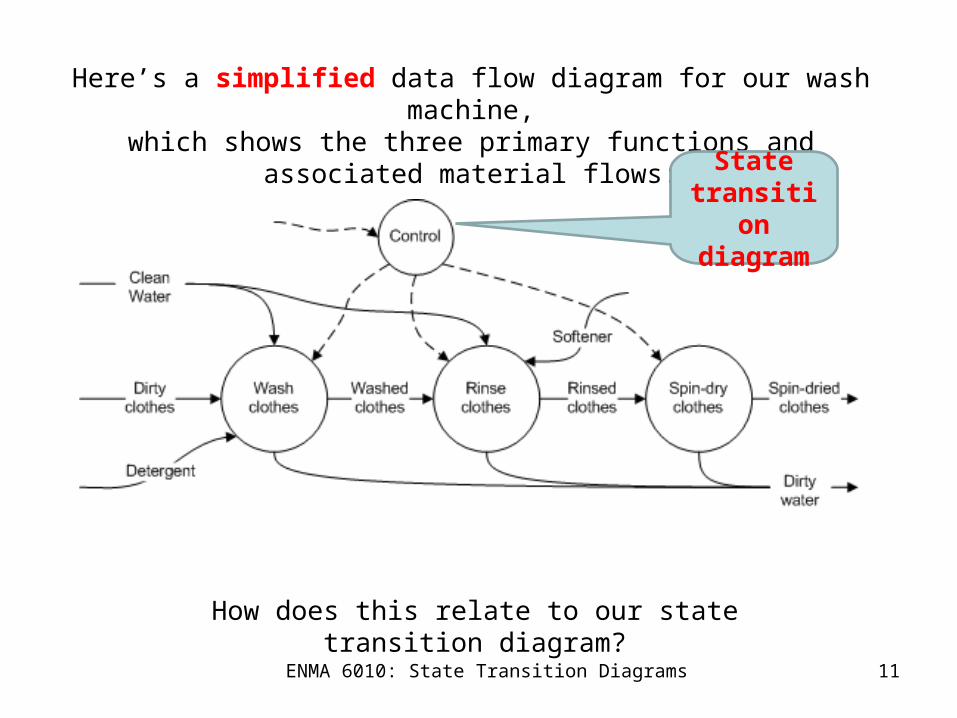
Here’s a simplified data flow diagram for our wash machine,which shows the three primary functions and associated material flows:
How does this relate to our state transition diagram?
Statetransitiondiagram
ENMA 6010: State Transition Diagrams 12
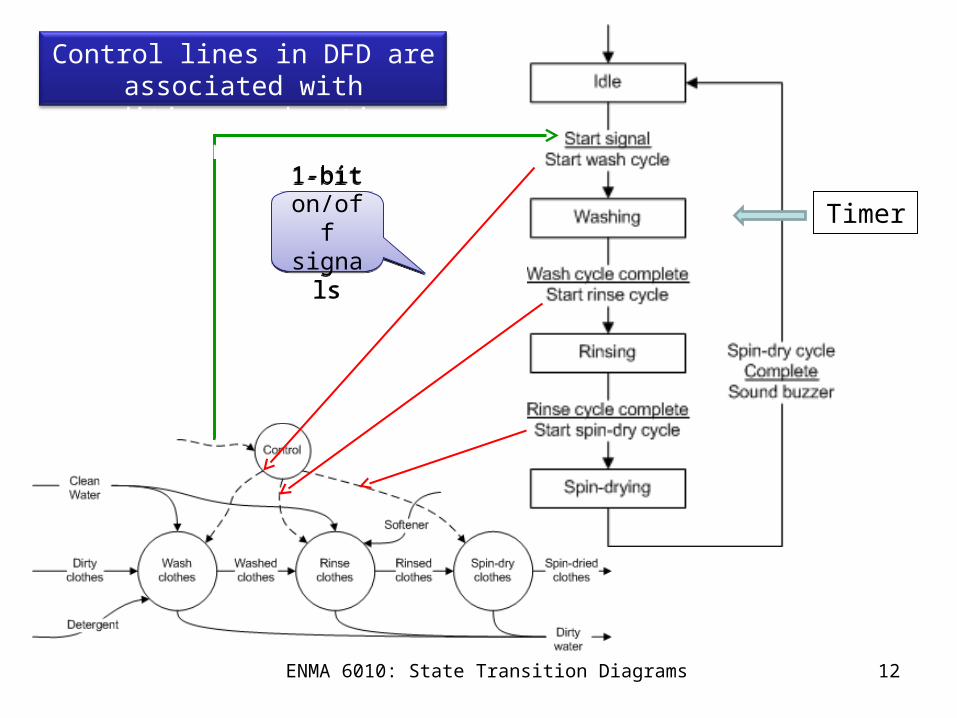
Control lines in DFD are associated with conditions and actions in STD
1-bit on/off signals
1-bit on/off signals
Timer
ENMA 6010: State Transition Diagrams 13
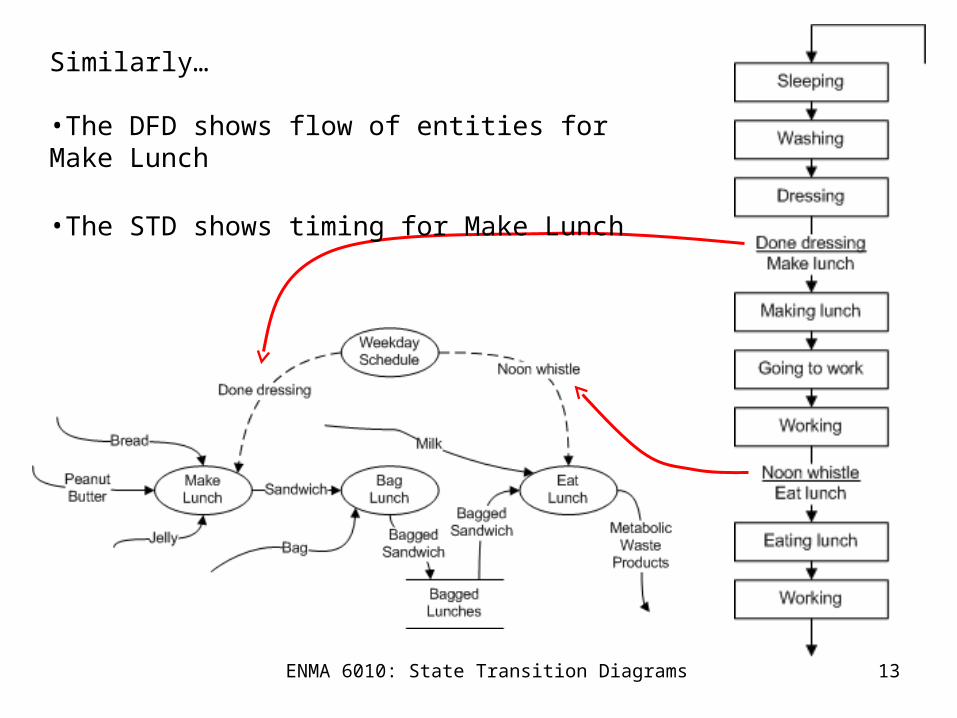
Similarly…
•The DFD shows flow of entities for Make Lunch
•The STD shows timing for Make Lunch
ENMA 6010: State Transition Diagrams 14
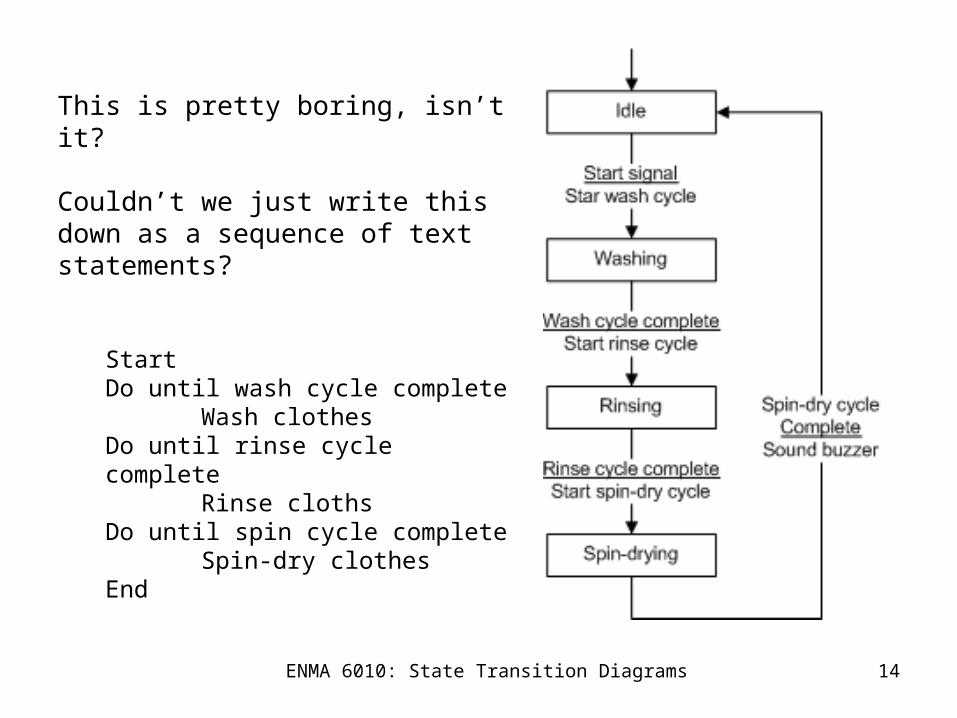
This is pretty boring, isn’t it?
Couldn’t we just write this down as a sequence of text statements?
StartDo until wash cycle complete
Wash clothesDo until rinse cycle complete
Rinse clothsDo until spin cycle complete
Spin-dry clothesEnd
ENMA 6010: State Transition Diagrams 15
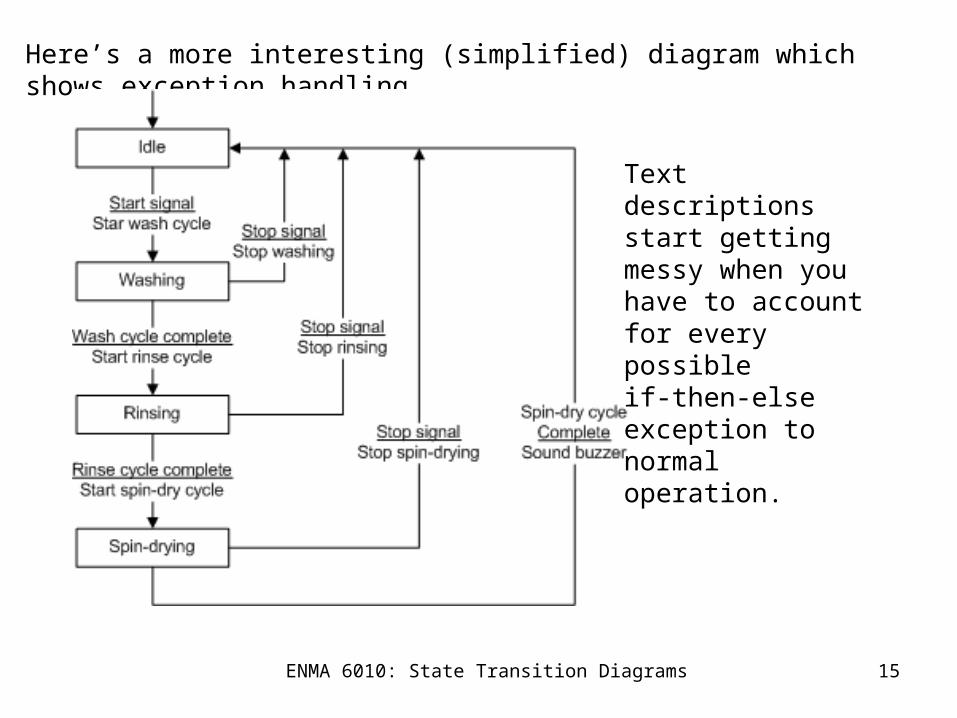
Here’s a more interesting (simplified) diagram which shows exception handling.
Text descriptions start getting messy when you have to account for every possible if-then-else exception to normal operation.
ENMA 6010: State Transition Diagrams 16
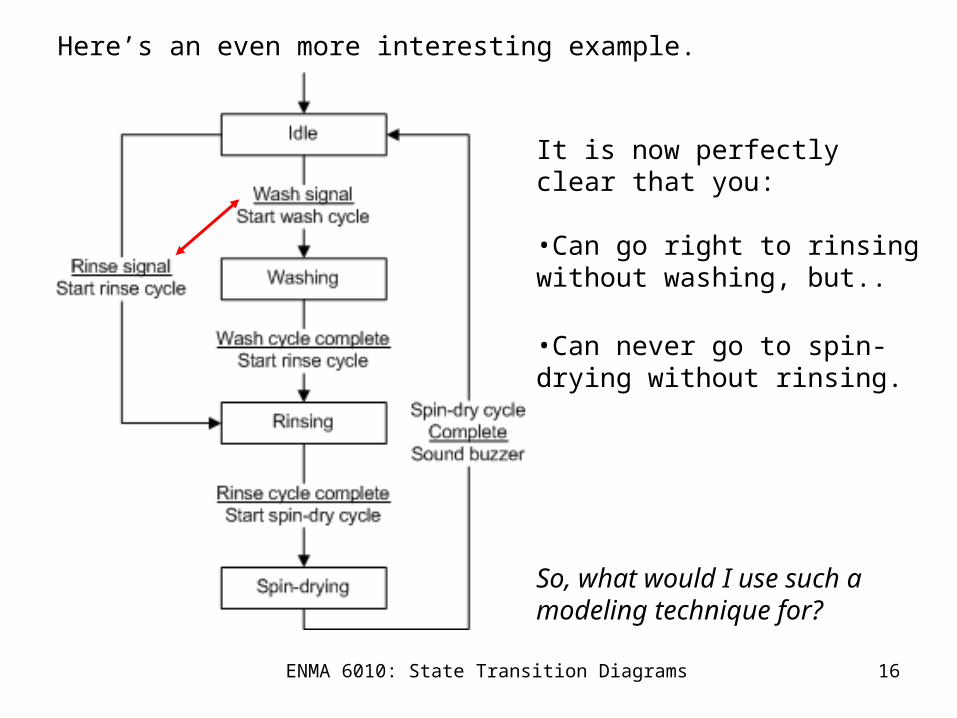
Here’s an even more interesting example.
It is now perfectly clear that you:
•Can go right to rinsing without washing, but..
•Can never go to spin-drying without rinsing.
So, what would I use such a modeling technique for?
ENMA 6010: State Transition Diagrams 17
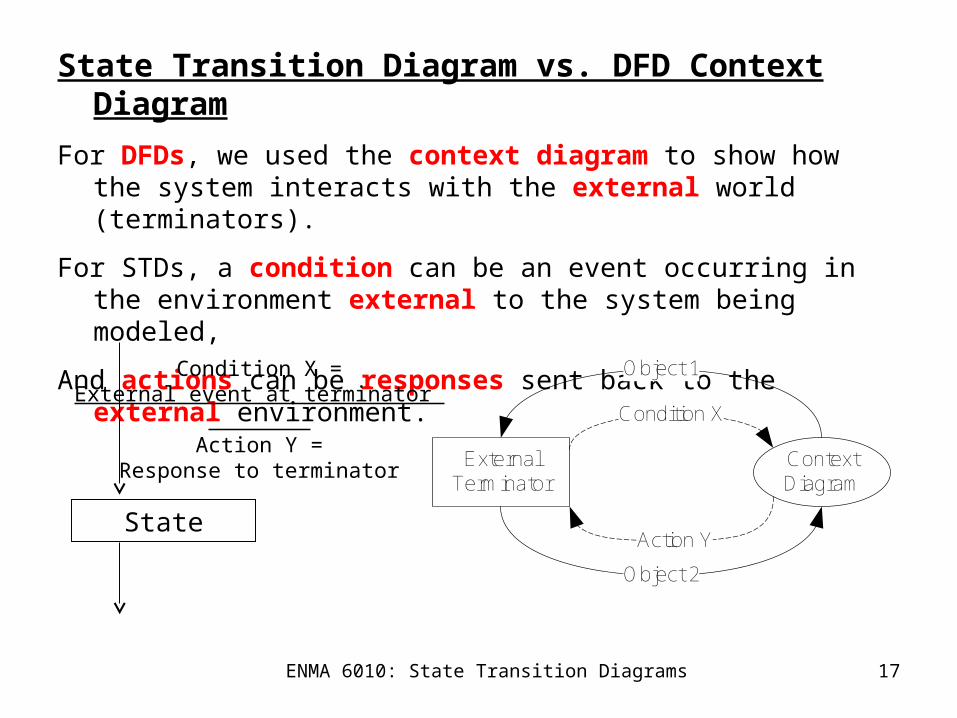
State Transition Diagram vs. DFD Context Diagram
For DFDs, we used the context diagram to show how the system interacts with the external world (terminators).
For STDs, a condition can be an event occurring in the environment external to the system being modeled,
And actions can be responses sent back to the external environment.
State
Condition X =External event at terminator
Action Y =Response to terminator
ExternalTerminator
ContextDiagram
Object 1
Object 2
Action Y
Condition X
ENMA 6010: State Transition Diagrams 18
State Transition Diagram Use• State transition diagrams have bee used for a long time to model
real-time systems such as:
• Process control,
• Telephone switching systems,
• Data acquisition systems,
• Military command and control systems.
• They are also quite useful in modeling “object oriented systems”such as those produced by Visual Basic.
• These are software program that basically sit there waiting until you initiate an event such as clicking an icon or hitting the “Enter” key.
ENMA 6010: State Transition Diagrams 19
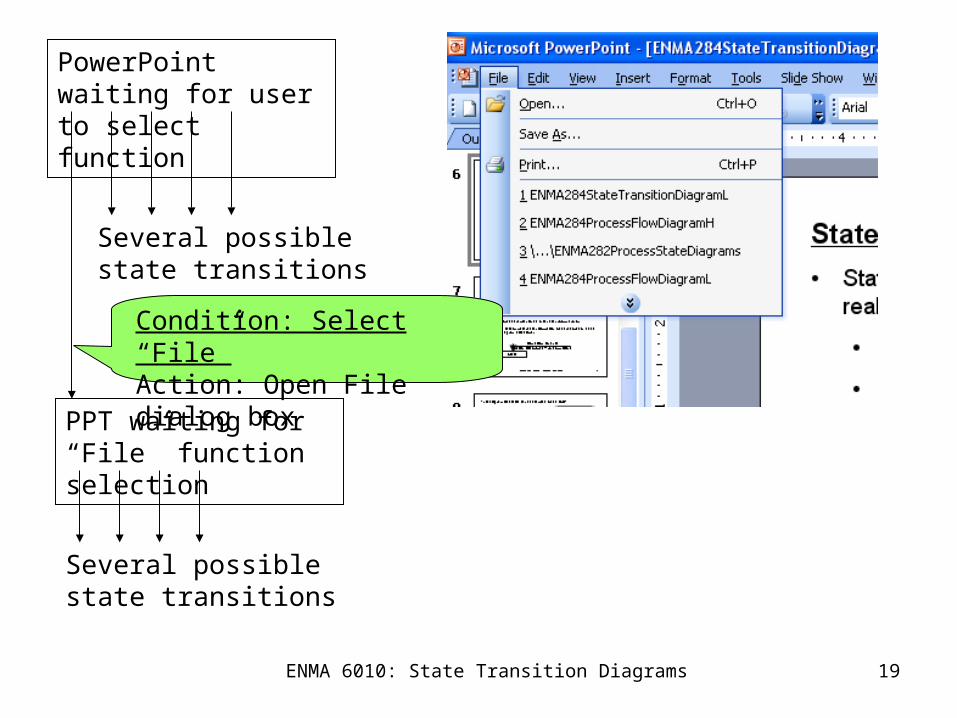
Condition: Select “File”Action: Open File dialog box
PowerPoint waiting for user to select function
PPT waiting for “File” function selection
Several possiblestate transitions
Several possiblestate transitions
ENMA 6010: State Transition Diagrams 20
Building State Transition Models
The literature and the references for this course provide details on rules and processes for building good state transition models.
We will not cover these details here, but we will touch on some key points in the following slides…
ENMA 6010: State Transition Diagrams 21
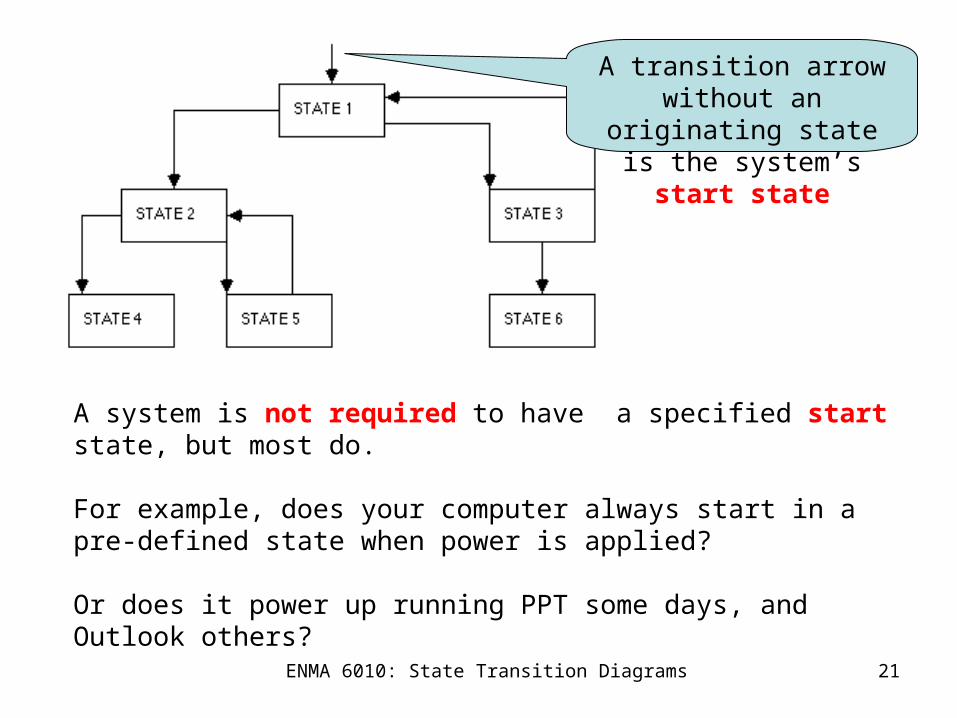
A transition arrow without an originating state is the
system’s start state
A system is not required to have a specified start state, but most do.
For example, does your computer always start in a pre-defined state when power is applied?
Or does it power up running PPT some days, and Outlook others?
ENMA 6010: State Transition Diagrams 22
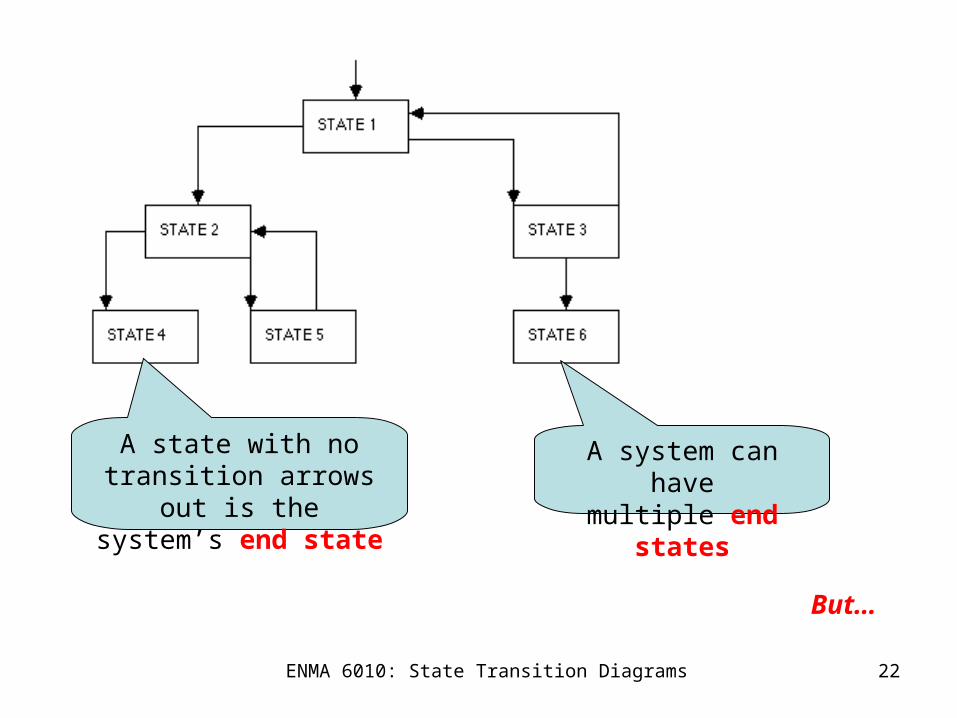
A state with no transition arrows out is the system’s
end state
A system can havemultiple end states
But…
ENMA 6010: State Transition Diagrams 23
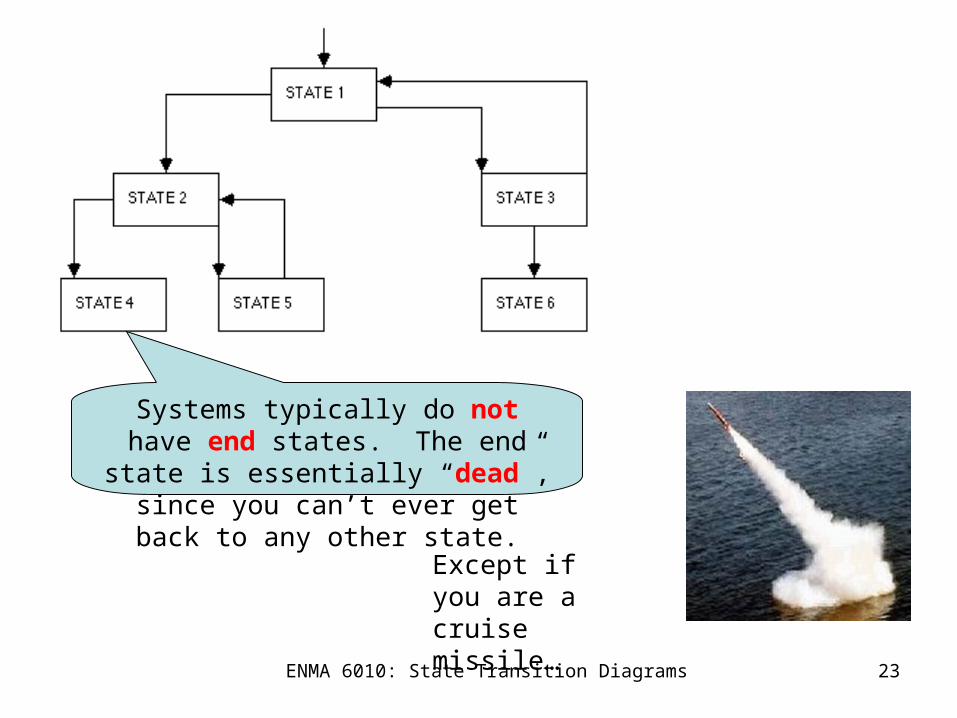
Systems typically do not have end states. The end state is essentially “dead”, since
you can’t ever get back to any other state.
Except if you are a cruise missile…
ENMA 6010: State Transition Diagrams 24
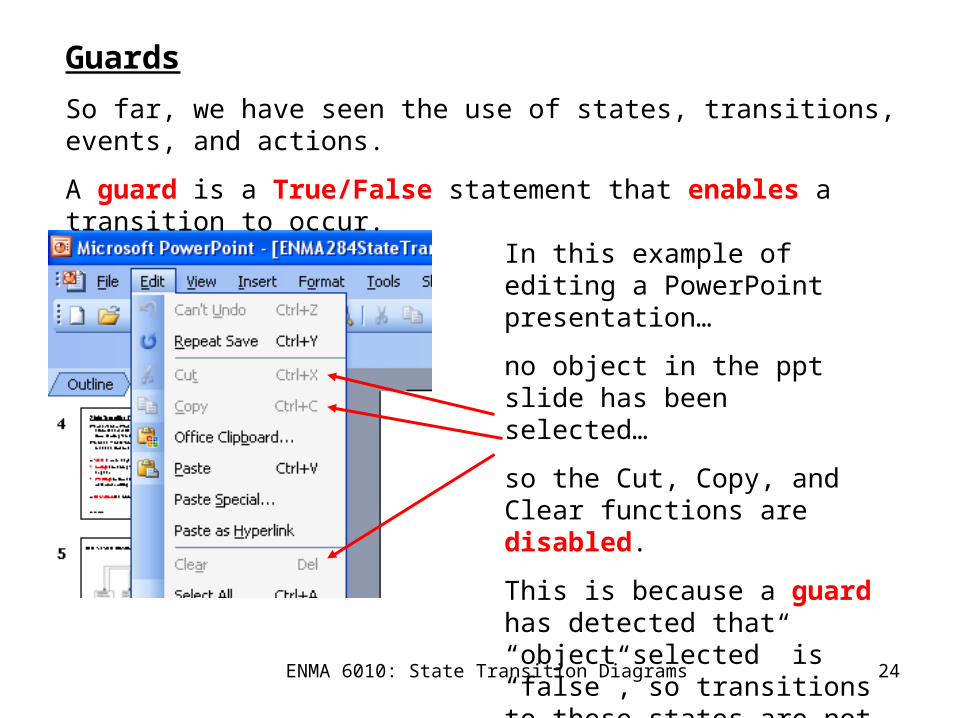
Guards
So far, we have seen the use of states, transitions, events, and actions.
A guard is a True/False statement that enables a transition to occur.
In this example of editing a PowerPoint presentation…
no object in the ppt slide has been selected…
so the Cut, Copy, and Clear functions are disabled.
This is because a guard has detected that “object selected” is “false”, so transitions to these states are not allowed.
ENMA 6010: State Transition Diagrams 25
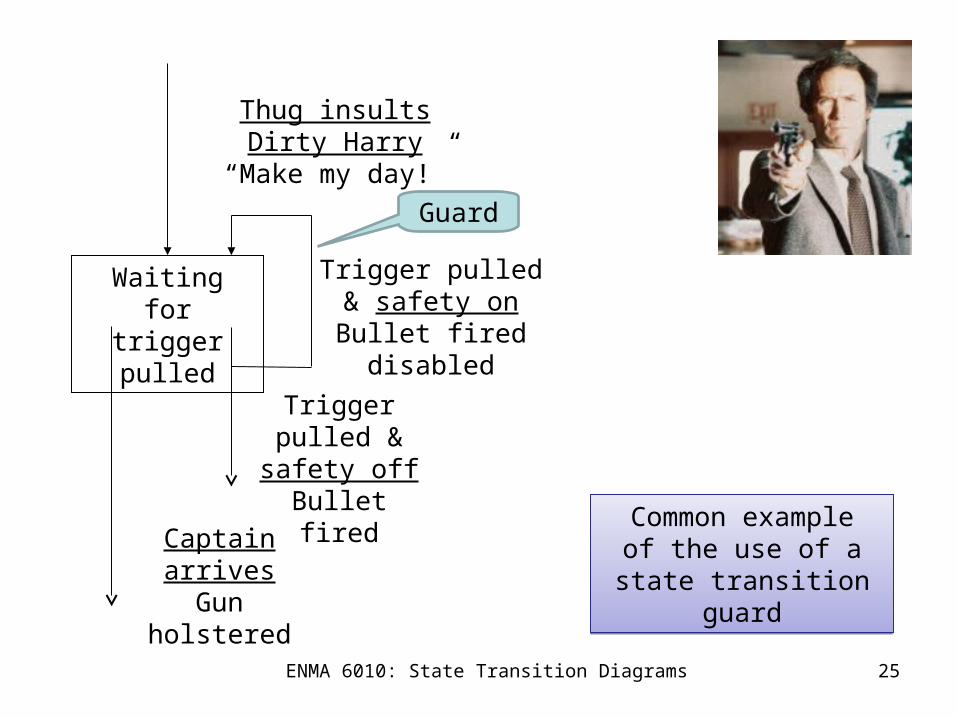
Waiting for trigger pulled
Trigger pulled & safety on
Bullet fired disabled
Trigger pulled & safety off
Bullet fired
Thug insults Dirty Harry“Make my day!”
Guard
Captain arrivesGun holstered
Common exampleof the use of a
state transition guard
Common exampleof the use of a
state transition guard
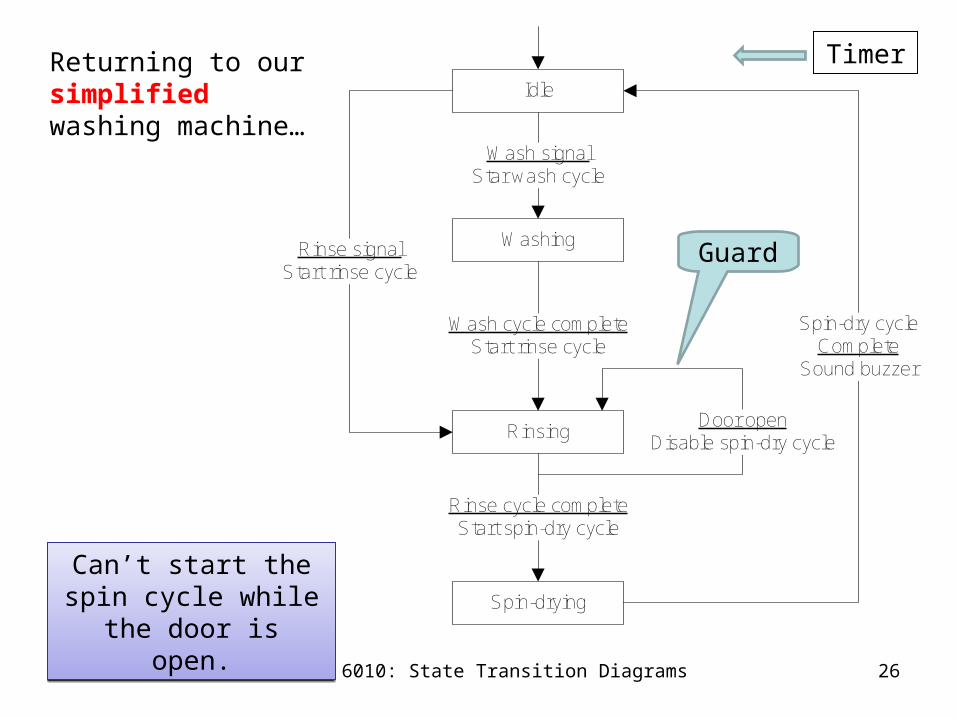
Idle
Washing
Rinsing
Spin-drying
Rinse cycle completeStart spin-dry cycle
Wash cycle completeStart rinse cycle
Wash signalStar wash cycle
Spin-dry cycle Complete
Sound buzzer
Rinse signalStart rinse cycle
Door openDisable spin-dry cycle
ENMA 6010: State Transition Diagrams 26
Returning to our simplifiedwashing machine…
Guard
Can’t start the spin cycle while the door is open.
Can’t start the spin cycle while the door is open.
Timer
ENMA 6010: State Transition Diagrams 27
Top-Down Partitionable Modeling
•Recall that STDs are inside of the control functions on DFDs.
•Now, DFDs can be decomposed into levels, and STDs follow the DFDs,so STDs are naturally decomposable.
Furthermore!
Sometimes it can help clarify things if you decompose an STD within a DFD…
ENMA 6010: State Transition Diagrams 28
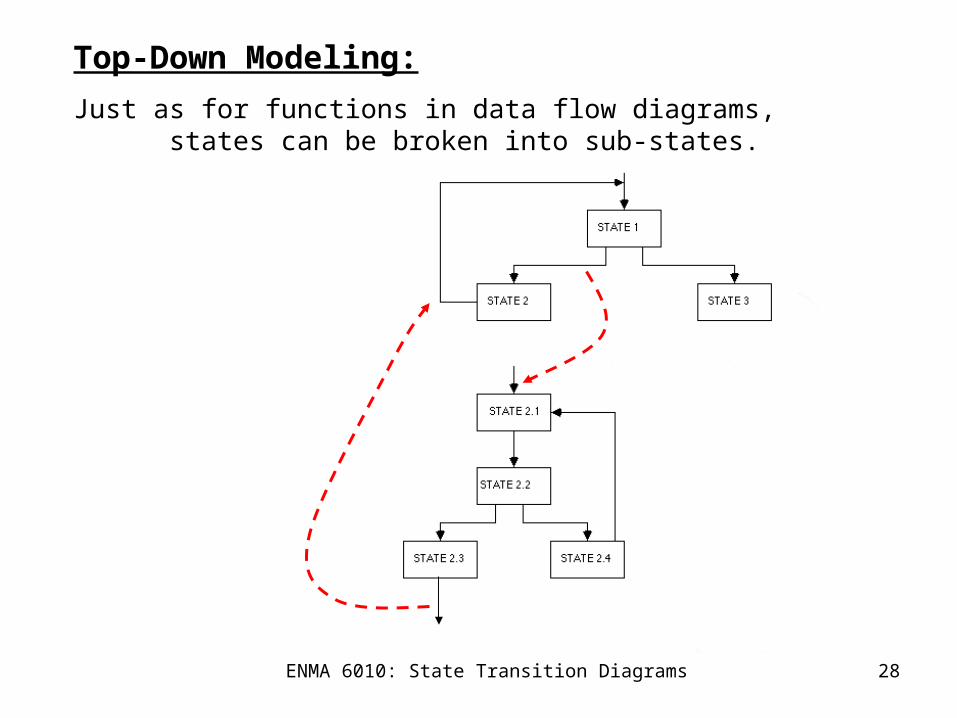
Top-Down Modeling:
Just as for functions in data flow diagrams,states can be broken into sub-states.
ENMA 6010: State Transition Diagrams 29
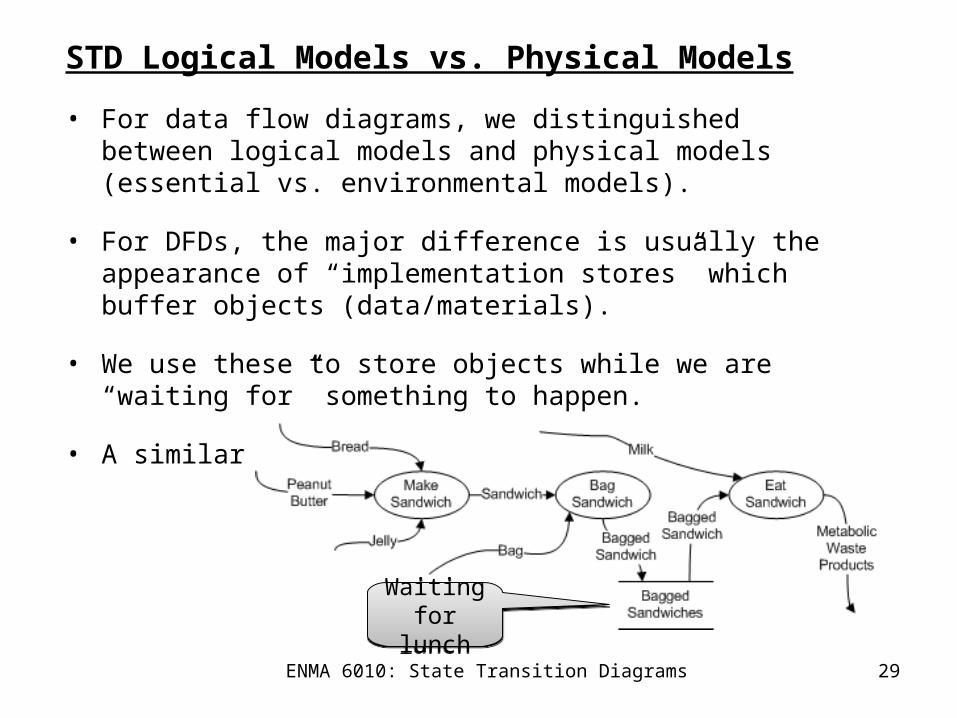
STD Logical Models vs. Physical Models
• For data flow diagrams, we distinguished between logical models and physical models (essential vs. environmental models).
• For DFDs, the major difference is usually the appearance of “implementation stores” which buffer objects (data/materials).
• We use these to store objects while we are “waiting for” something to happen.
• A similar situation holds for STDs.
Waiting for lunchWaiting
for lunch
ENMA 6010: State Transition Diagrams 30
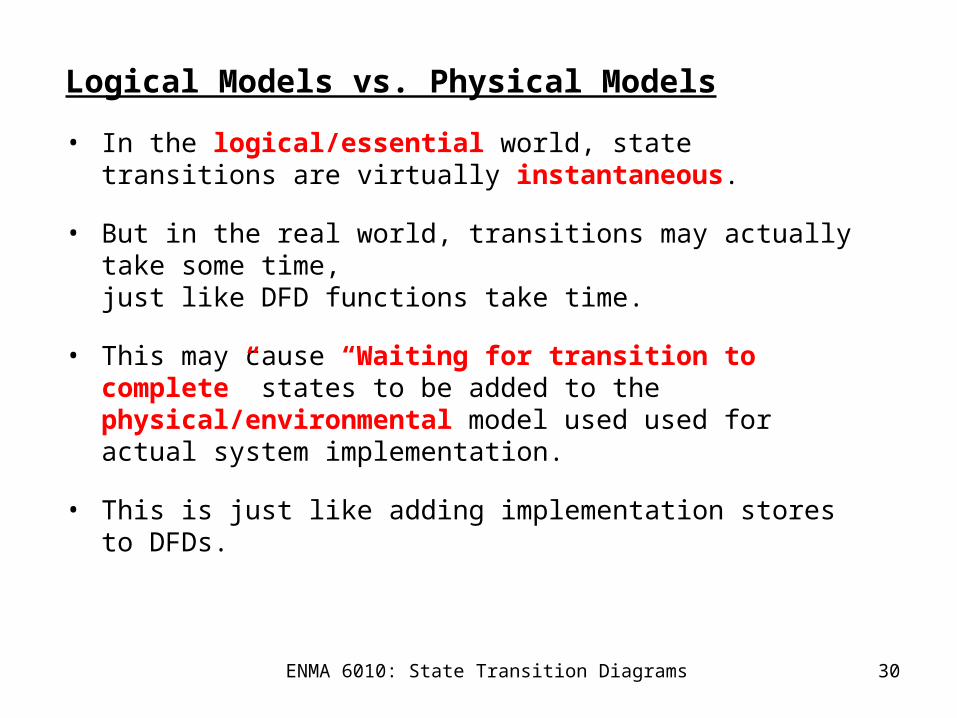
Logical Models vs. Physical Models
• In the logical/essential world, state transitions are virtually instantaneous.
• But in the real world, transitions may actually take some time,just like DFD functions take time.
• This may cause “Waiting for transition to complete” states to be added to the physical/environmental model used used for actual system implementation.
• This is just like adding implementation stores to DFDs.
ENMA 6010: State Transition Diagrams 31
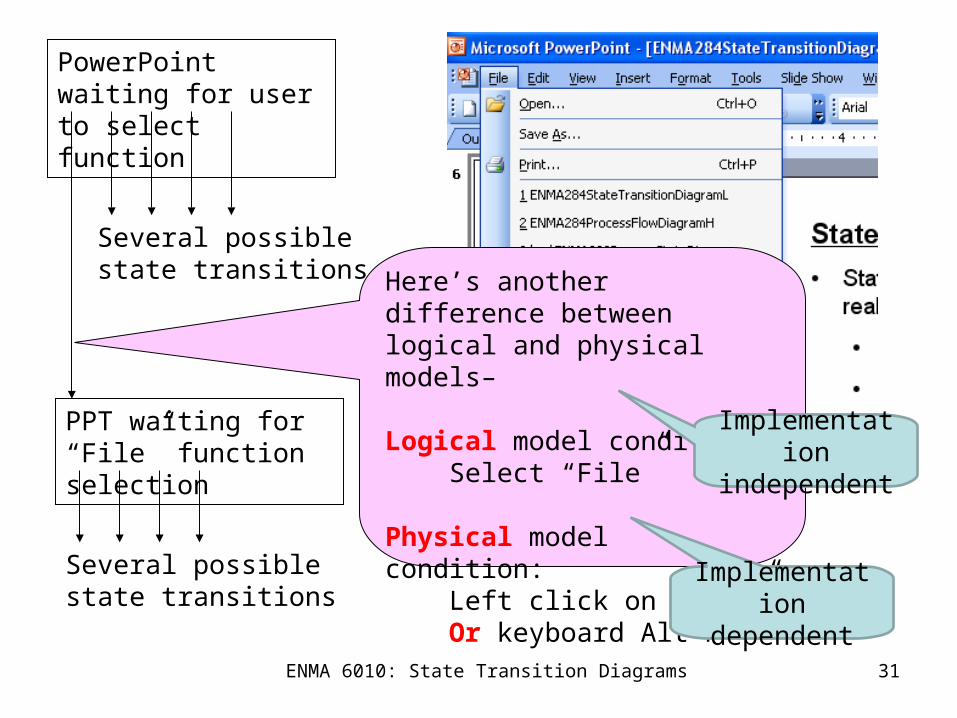
Here’s another difference between logical and physical models–
Logical model condition: Select “File”
Physical model condition: Left click on “File” Or keyboard Alt-F
PowerPoint waiting for user to select function
PPT waiting for “File” function selection
Several possiblestate transitions
Several possiblestate transitions
Implementationindependent
Implementationdependent
ENMA 6010: State Transition Diagrams 32
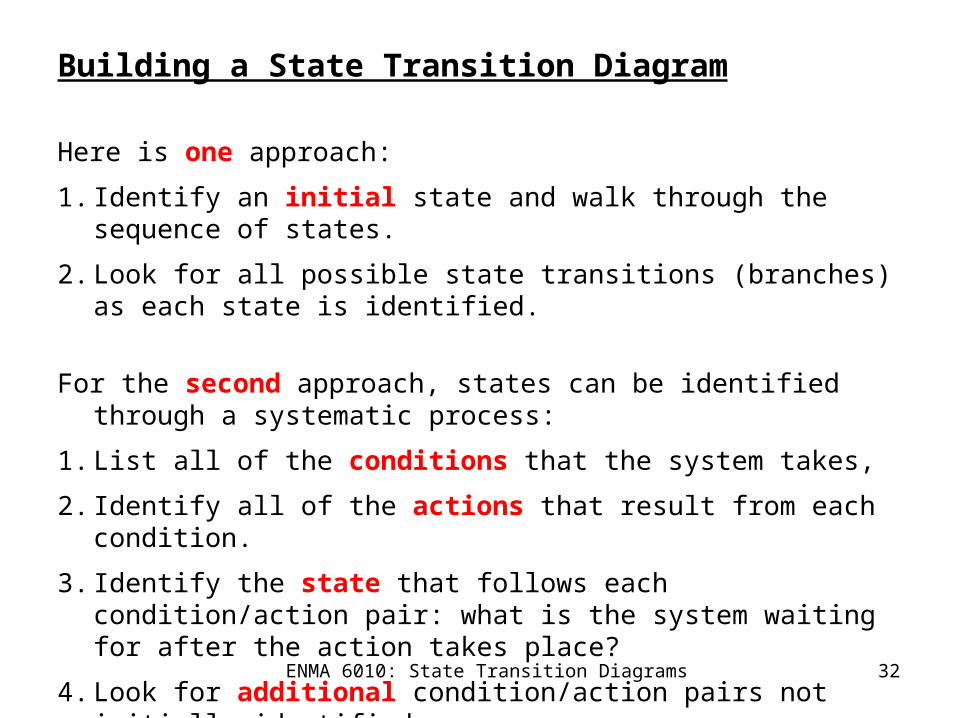
Building a State Transition Diagram
Here is one approach:
1. Identify an initial state and walk through the sequence of states.
2. Look for all possible state transitions (branches) as each state is identified.
For the second approach, states can be identified through a systematic process:
1. List all of the conditions that the system takes,
2. Identify all of the actions that result from each condition.
3. Identify the state that follows each condition/action pair: what is the system waiting for after the action takes place?
4. Look for additional condition/action pairs not initially identified.
ENMA 6010: State Transition Diagrams 33
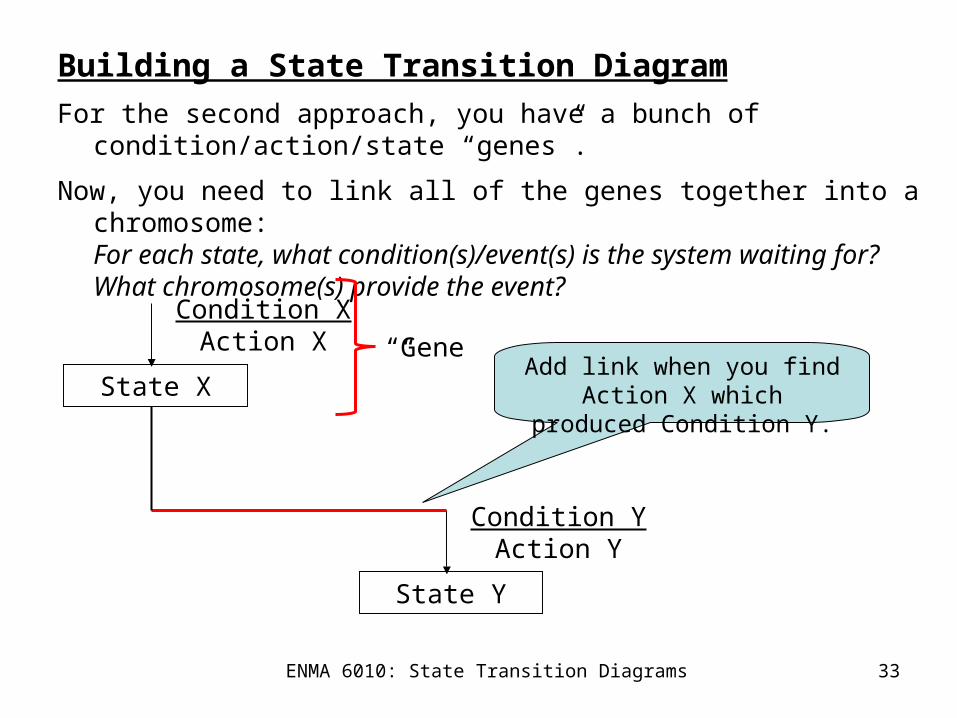
Building a State Transition DiagramFor the second approach, you have a bunch of condition/action/state “genes”.
Now, you need to link all of the genes together into a chromosome:For each state, what condition(s)/event(s) is the system waiting for?What chromosome(s) provide the event?
State Y
Condition YAction Y
State X
Condition XAction X
Add link when you find Action X which produced Condition Y.
“Gene”
ENMA 6010: State Transition Diagrams 34
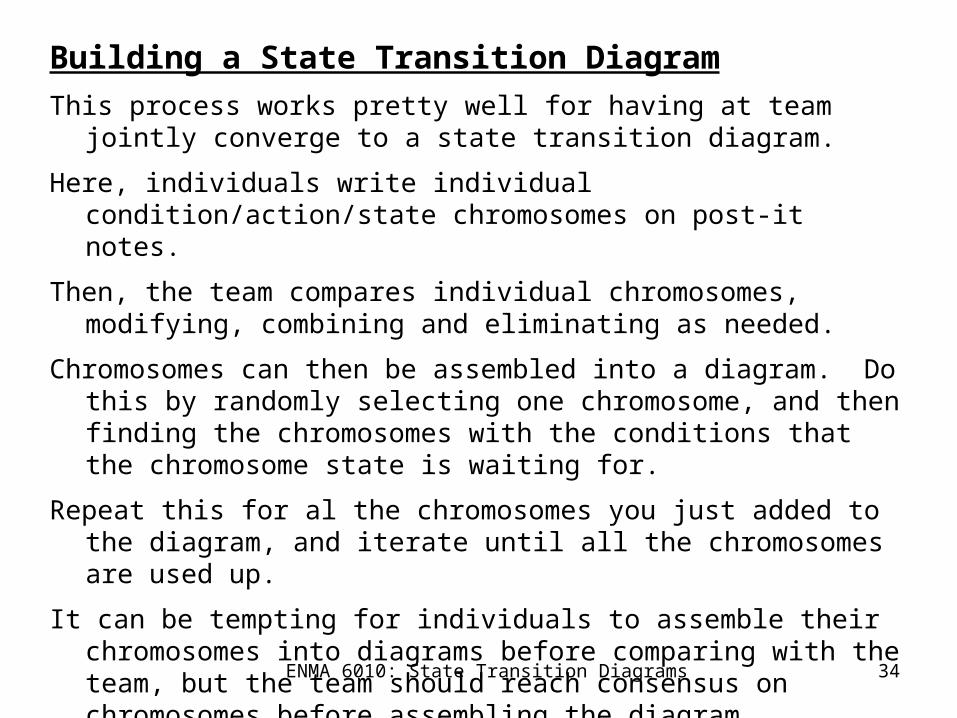
Building a State Transition DiagramThis process works pretty well for having at team jointly converge to a state
transition diagram.
Here, individuals write individual condition/action/state chromosomes on post-it notes.
Then, the team compares individual chromosomes, modifying, combining and eliminating as needed.
Chromosomes can then be assembled into a diagram. Do this by randomly selecting one chromosome, and then finding the chromosomes with the conditions that the chromosome state is waiting for.
Repeat this for al the chromosomes you just added to the diagram, and iterate until all the chromosomes are used up.
It can be tempting for individuals to assemble their chromosomes into diagrams before comparing with the team, but the team should reach consensus on chromosomes before assembling the diagram.
ENMA 6010: State Transition Diagrams 35
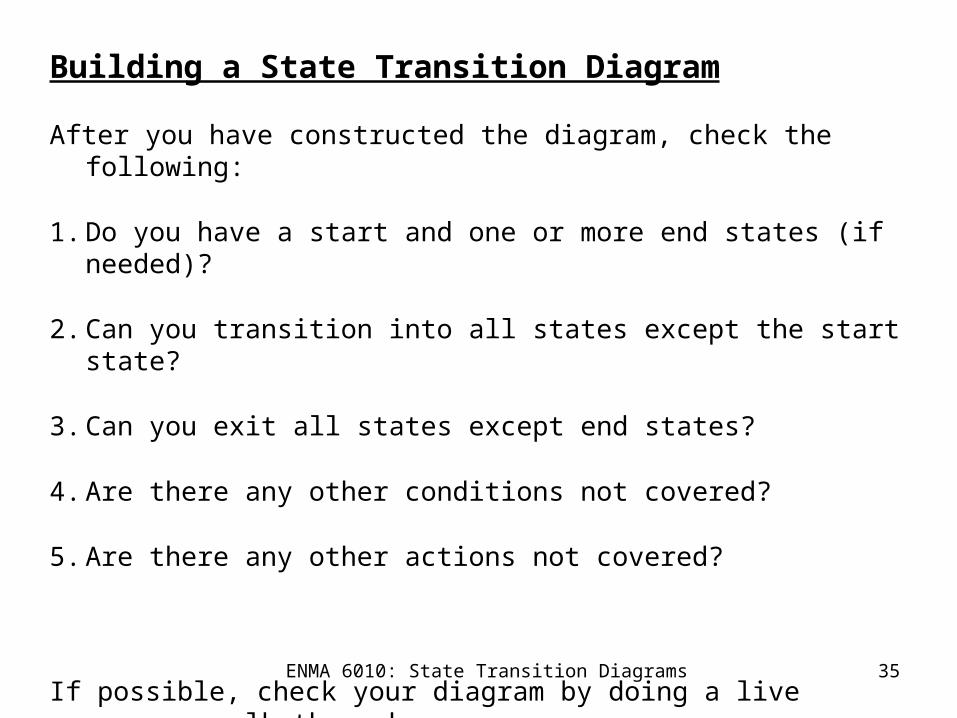
Building a State Transition Diagram
After you have constructed the diagram, check the following:
1. Do you have a start and one or more end states (if needed)?
2. Can you transition into all states except the start state?
3. Can you exit all states except end states?
4. Are there any other conditions not covered?
5. Are there any other actions not covered?
If possible, check your diagram by doing a live process walk-through.

ENMA 6010: State Transition Diagrams 36
List all eventsthat occur in the
system
For each event, identify the
corresponding action
Put the event-action-state sets on self-
stick notes
For each event-action pair, identify a unique
“following” state
Link states with actions
Compare all event-action-state sets
Eliminate duplicate states
Walk through system operation using the
model
Model accurate?
Use themodel
Identifymissingstates
Enter ExitBuildDiagram
IdentifyStates
Reviewand Revise
TestModel
Yes
No
Process Flow Diagram for State Transition Diagramming
ENMA 6010: State Transition Diagrams 37
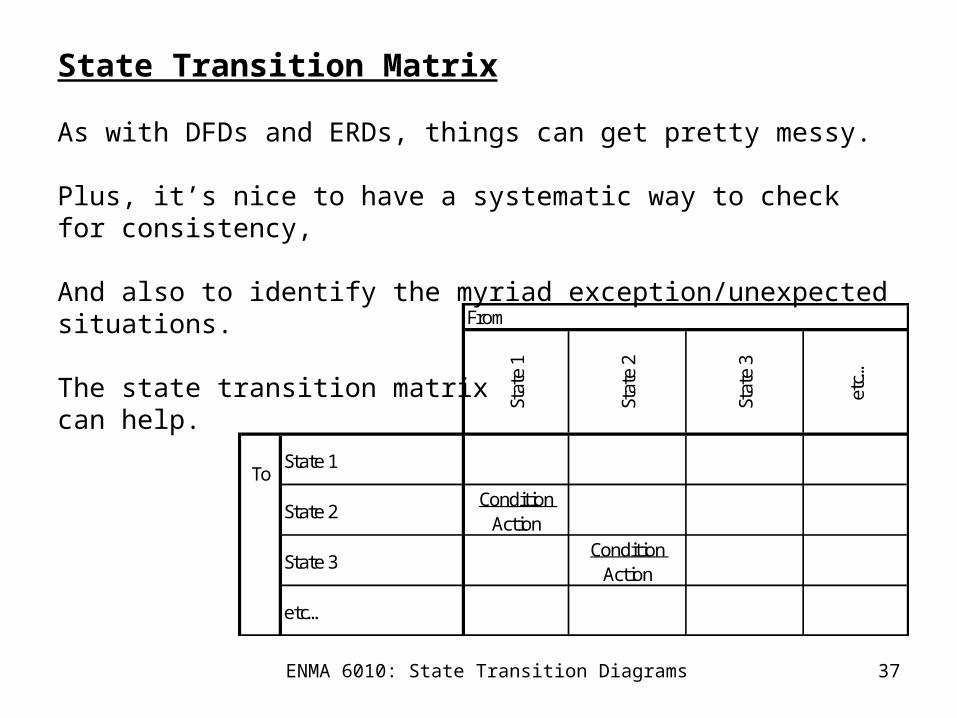
State Transition Matrix
As with DFDs and ERDs, things can get pretty messy.
Plus, it’s nice to have a systematic way to check for consistency,
And also to identify the myriad exception/unexpected situations.
The state transition matrixcan help.
From
Stat
e 1
Stat
e 2
Stat
e 3
etc…
ToState 1
State 2Condition
Action
State 3Condition
Action
etc…
ENMA 6010: State Transition Diagrams 38
From
Idle
Was
hing
Rins
ing
Spin
-Dry
ing
ToIdle
Spin-dry cycle complete
Sound buzzer
WashingWash signal
Start wash cycle
RinsingRinse signal Wash cycle
completeStart rinse cycle Start rinse cycle
Spin-Drying
Rinse cycle complete
Start Spin-dry cycle
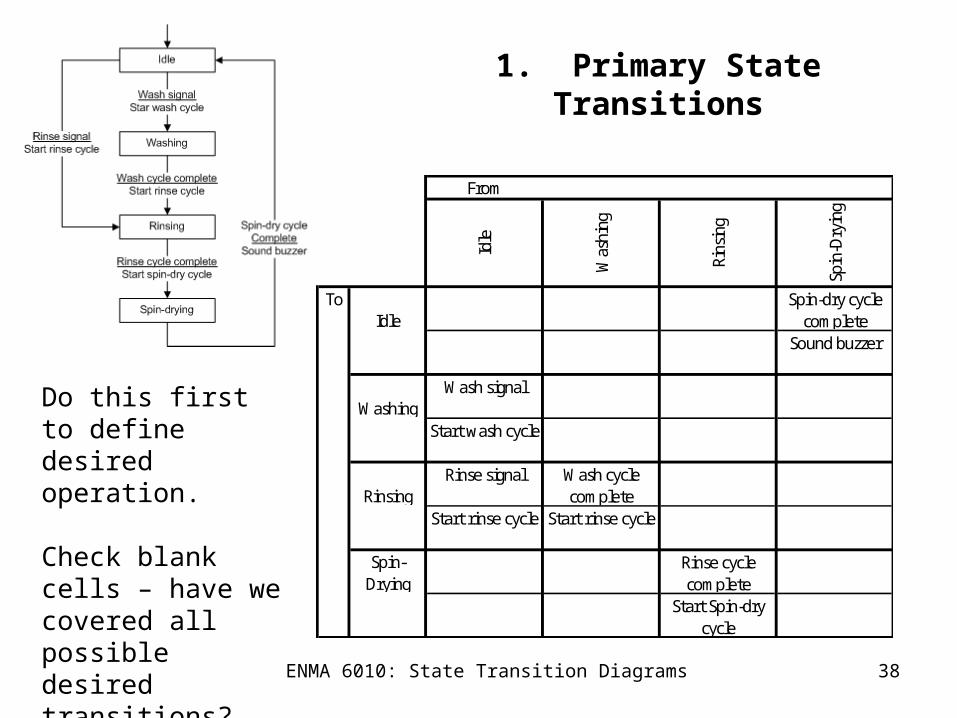
1. Primary State Transitions
Do this first to define desired operation.
Check blank cells – have we covered all possible desired transitions?
ENMA 6010: State Transition Diagrams 39
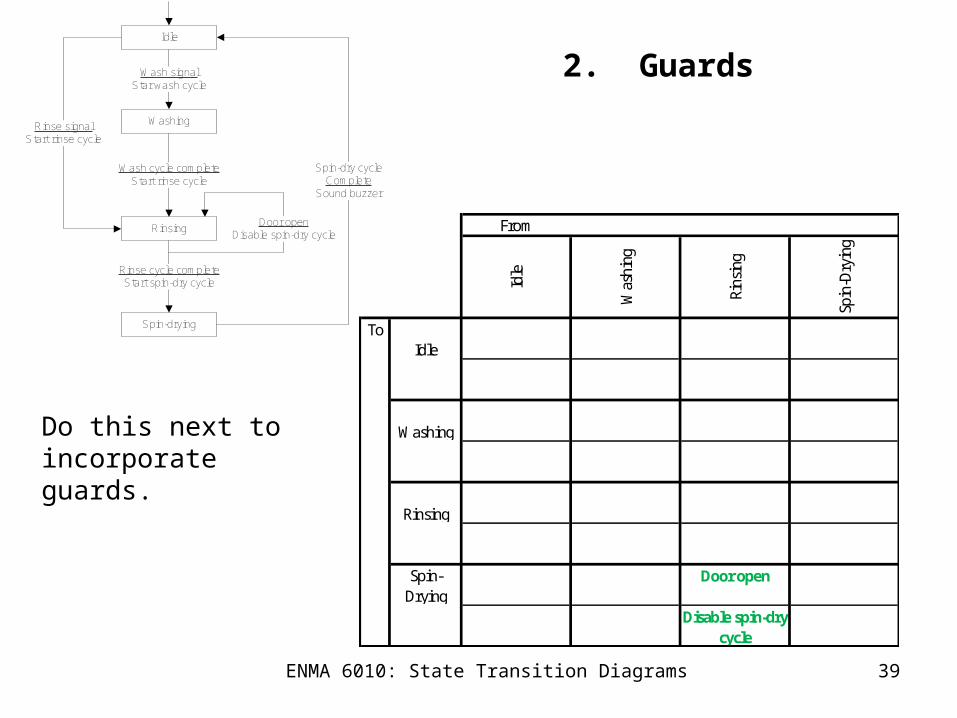
2. Guards
Do this next to incorporate guards.
From
Idle
Was
hing
Rins
ing
Spin
-Dry
ing
ToIdle
Washing
Rinsing
Spin-Drying
Door open
Disable spin-dry cycle
Idle
Washing
Rinsing
Spin-drying
Rinse cycle completeStart spin-dry cycle
Wash cycle completeStart rinse cycle
Wash signalStar wash cycle
Spin-dry cycle Complete
Sound buzzer
Rinse signalStart rinse cycle
Door openDisable spin-dry cycle
ENMA 6010: State Transition Diagrams 40
Idle
Washing
Rinsing
Spin-drying
Rinse cycle completeStart spin-dry cycle
Wash cycle completeStart rinse cycle
Start signalStar wash cycle
Spin-dry cycle Complete
Sound buzzer
Stop signalStop washing
Stop signalStop rinsing
Stop signalStop spin-drying
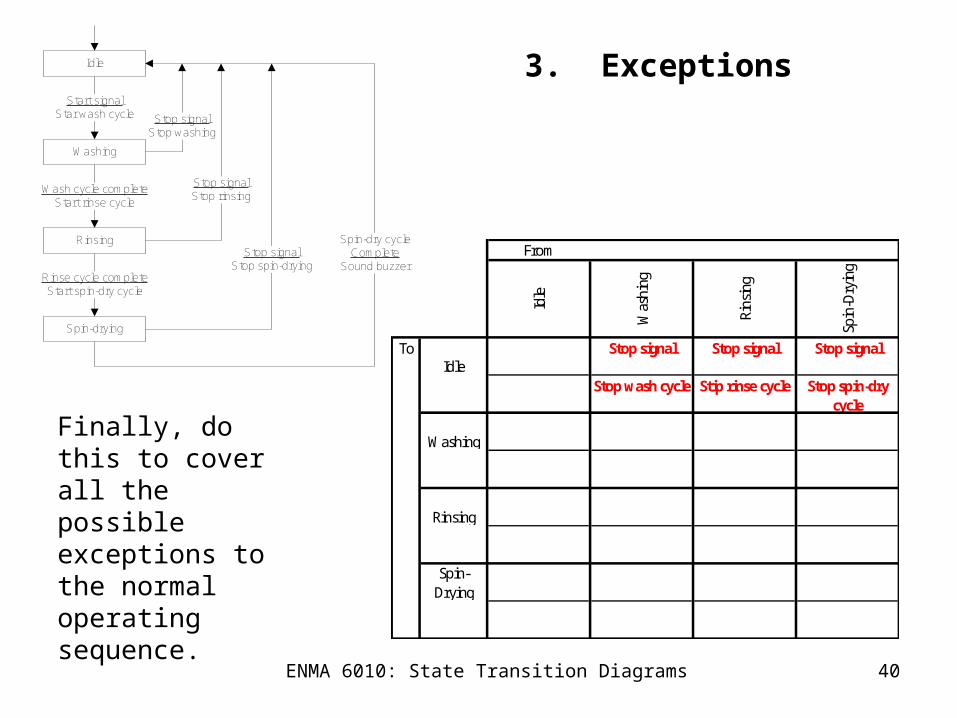
3. Exceptions
From
Idle
Was
hing
Rins
ing
Spin
-Dry
ing
ToIdle
Stop signal Stop signal Stop signal
Stop wash cycle Stip rinse cycle Stop spin-dry cycle
Washing
Rinsing
Spin-Drying
Finally, do this to cover all the possible exceptions to the normal operating sequence.
ENMA 6010: State Transition Diagrams 41
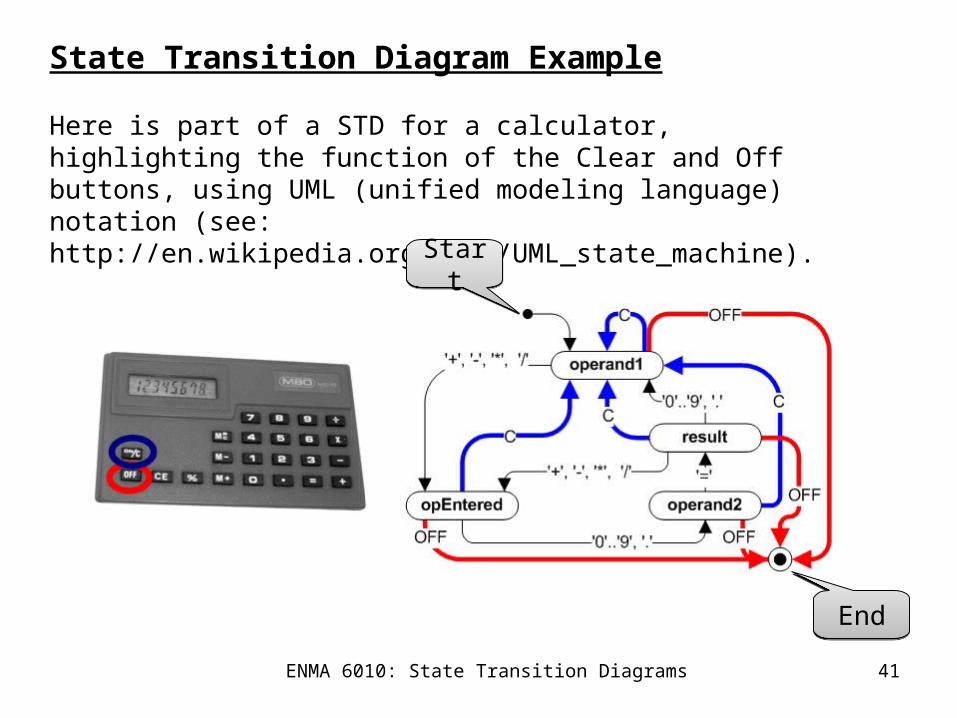
State Transition Diagram Example
Here is part of a STD for a calculator, highlighting the function of the Clear and Off buttons, using UML (unified modeling language) notation (see: http://en.wikipedia.org/wiki/UML_state_machine).
StartStart
EndEnd
ENMA 6010: State Transition Diagrams 42
State Transition Diagram Example
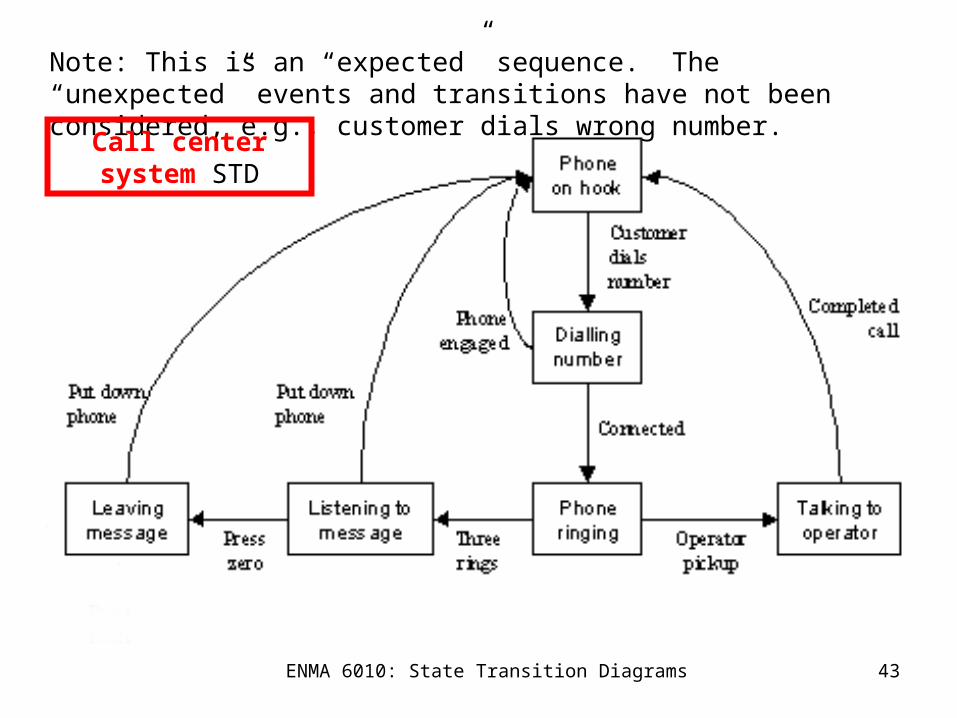
Here is an interesting example of a state transition diagram:
““The Emotional State-Transition Diagram”
http://syque.com/articles/state-transition/state-transition.htm
The first diagram shows what happens when a customer calls in to a call center with a problem…
ENMA 6010: State Transition Diagrams 43
Note: This is an “expected” sequence. The “unexpected” events and transitions have not been considered, e.g., customer dials wrong number.
Call center system STD
ENMA 6010: State Transition Diagrams 44
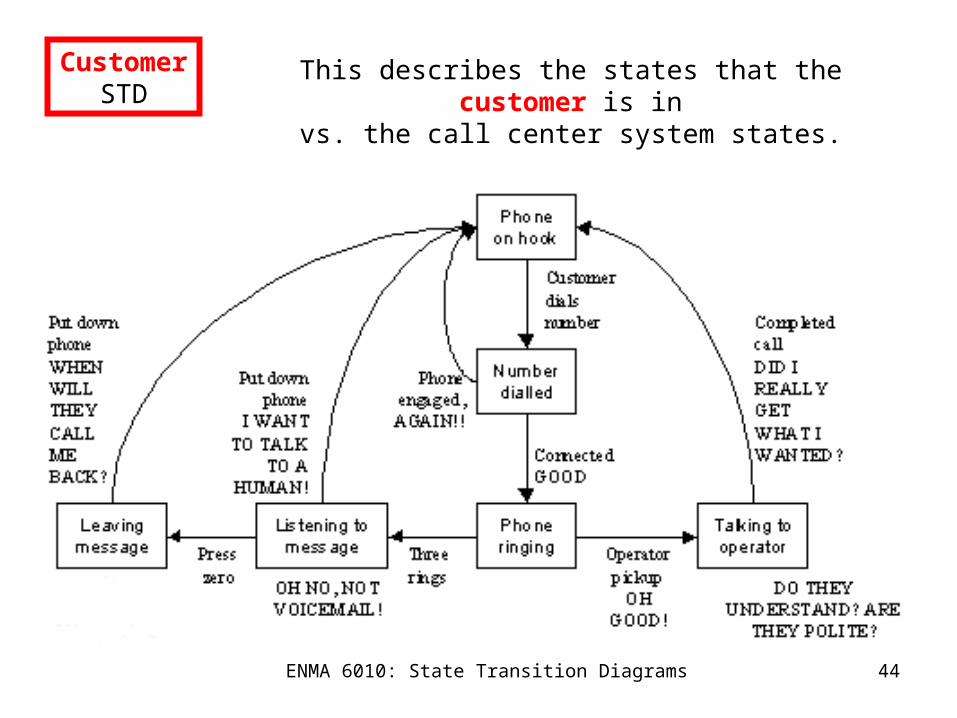
CustomerSTD
This describes the states that the customer is invs. the call center system states.
ENMA 6010: State Transition Diagrams 45
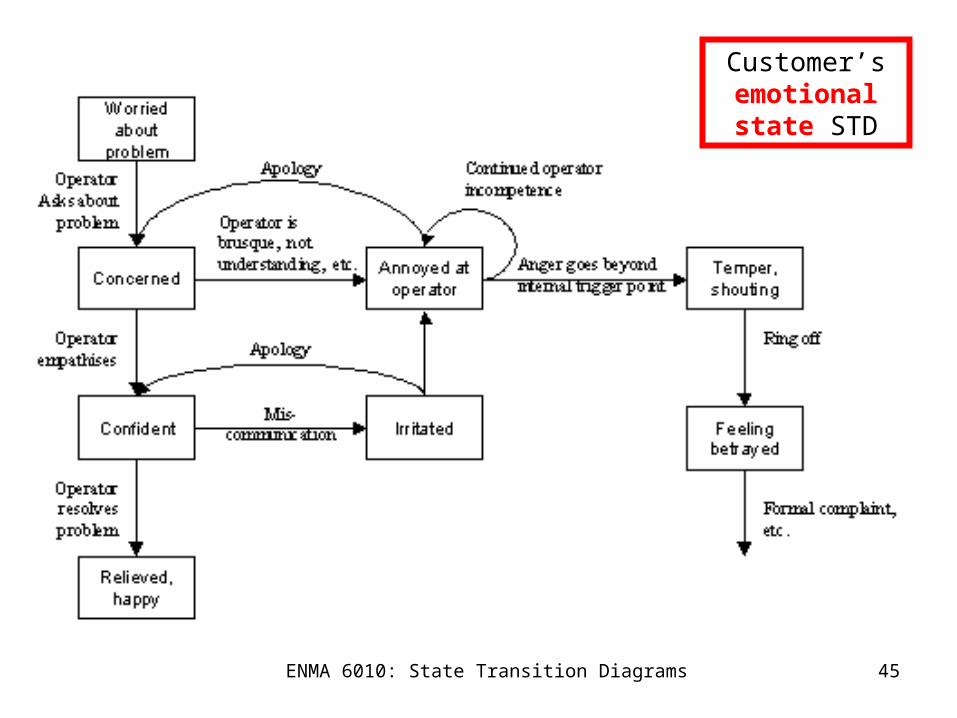
Customer’s emotional state
STD
ENMA 6010: State Transition Diagrams 46
Finally:
As mentioned, a state is when a system is:
• Doing something - Heating oven, mixing ingredients, accelerating engine,
• Waiting for something to happen – Waiting for user to enter password, waiting for sensor reading.
Well, waiting for something to happen is just a waste of time,
So state transition diagrams can be helpful in identifying and minimizing or eliminating time-wasting states.
Just like data flow diagrams were useful in identifying and minimizing or eliminating inventory and work-in-process.
You can do this by comparing logical/essential models with physical/environmental implementation models.
Do you really need to wait for some thing to happen?
ENMA 6010: State Transition Diagrams 47
Characteristics of Good Models
1.Graphical, with support for detailed text descriptions: Picture is worth a thousand words picture links to a thousand words.
2.Top-down partitionable: Globe Continents Countries
3.Minimally redundant: Make changes in just one place in the model.
4.Transparent: Requires no expertise in model building to understand the model.
ENMA 6010: State Transition Diagrams 48
Goals of System Modeling:
1.To focus on important system features while downplaying less important features,
2.To discuss changes and corrections to the user’s requirements at low cost and with minimal risk,
3.To verify that we understand the user’s environment,
4.To verify that we have documented our understanding in a way that would allow others to construct/maintain the system.
What’s next?
ENMA 6010: State Transition Diagrams 49
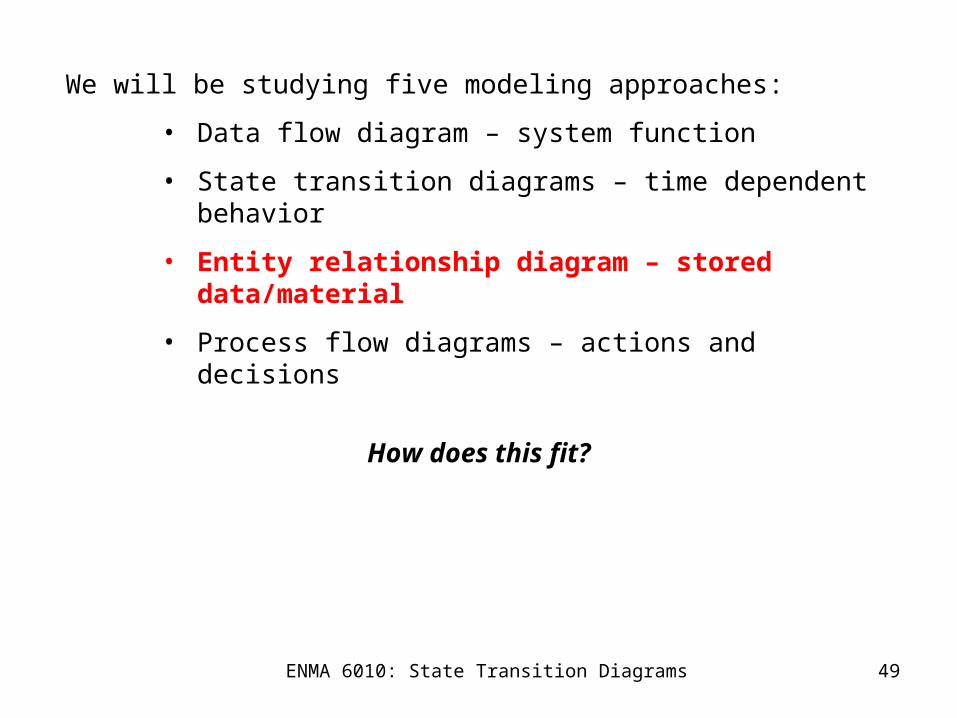
We will be studying five modeling approaches:
• Data flow diagram – system function
• State transition diagrams – time dependent behavior
• Entity relationship diagram – stored data/material
• Process flow diagrams – actions and decisions
How does this fit?
ENMA 6010: State Transition Diagrams 50
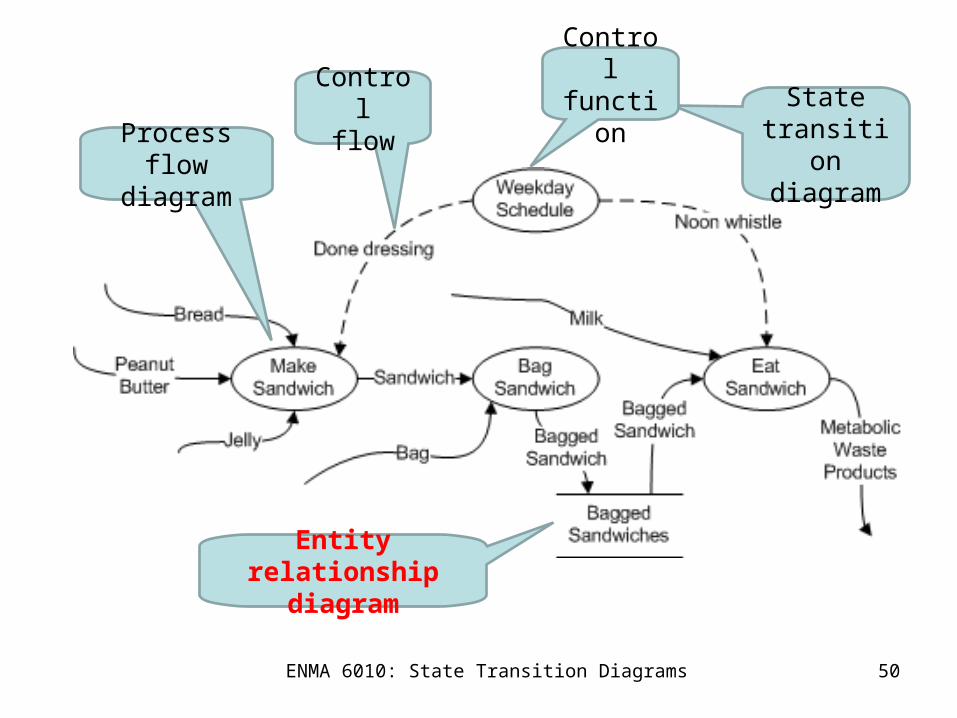
Statetransitiondiagram
Entity relationship diagram
Process flow diagram
Controlflow
Control function