enrollment report - kansas board of regents
TRANSCRIPT

Enrollment ReportElaine Frisbie
Vice President for Finance & Administration
April 14, 2021

Data CollectionsThe presentation today is made possible by the staff at the institutions who submit their data to the Data, Research and Planning team within the Board of Regents.
Using this information, we develop products such as DegreeStats, the Military Portal, the databooks, and the KHEStats online reporting tool, which is referenced throughout this presentation.
Many thanks to all the staff involved with the data collections.
2
ACADEMIC YEARENROLLMENT TRENDS
3
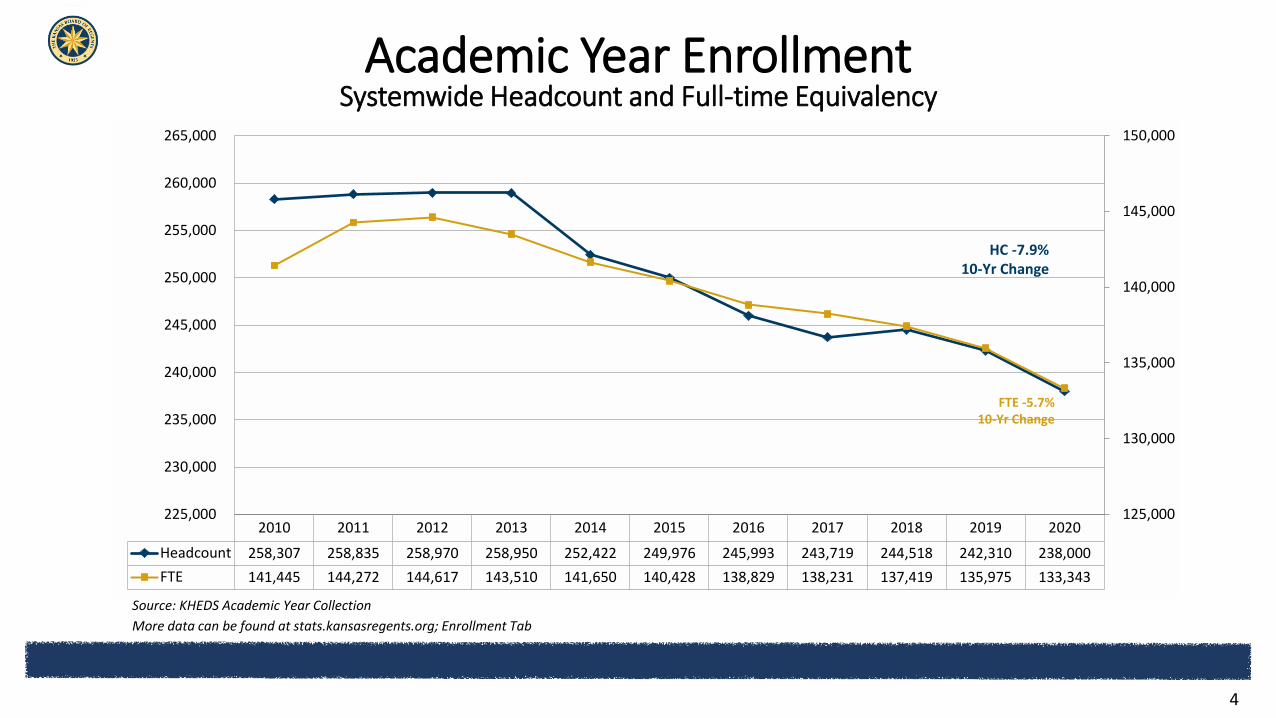
Academic Year Enrollment
Source: KHEDS Academic Year CollectionMore data can be found at stats.kansasregents.org; Enrollment Tab
Systemwide Headcount and Full-time Equivalency
2010 2011 2012 2013 2014 2015 2016 2017 2018 2019 2020Headcount 258,307 258,835 258,970 258,950 252,422 249,976 245,993 243,719 244,518 242,310 238,000FTE 141,445 144,272 144,617 143,510 141,650 140,428 138,829 138,231 137,419 135,975 133,343
125,000
130,000
135,000
140,000
145,000
150,000
225,000
230,000
235,000
240,000
245,000
250,000
255,000
260,000
265,000
HC -7.9% 10-Yr Change
FTE -5.7%10-Yr Change
4

Academic Year EnrollmentSystemwide Headcount by Race/Ethnicity
2010 2011 2012 2013 2014 2015 2016 2017 2018 2019 2020White 182,937 180,940 182,194 179,490 172,560 167,377 164,265 161,207 160,762 157,382 150,882Hispanic 14,065 16,988 17,354 18,732 19,481 20,245 22,045 22,788 24,298 25,236 25,890Black 17,108 17,469 18,876 18,675 17,812 17,400 16,048 15,952 16,267 15,717 15,070All Other 22,962 26,502 28,815 30,205 31,070 32,088 32,288 31,833 32,557 32,987 32,854Unknown 21,235 16,936 11,731 11,848 11,499 12,866 11,347 11,939 10,634 10,988 13,304
--
35,000
70,000
105,000
140,000
175,000
210,000
Source: KHEDS Academic Year CollectionMore data can be found at stats.kansasregents.org; Enrollment Tab
5

Academic Year EnrollmentSystemwide Headcount by Age Groups
2010 2011 2012 2013 2014 2015 2016 2017 2018 2019 2020Age <20 53,558 53,572 53,858 56,451 58,139 59,817 61,783 63,892 65,483 67,721 68,632Age20-24 103,043 103,322 103,399 102,443 100,014 99,487 98,599 96,946 97,429 95,720 93,816Age 25-34 57,735 59,101 59,700 58,558 56,409 54,692 52,105 50,241 49,011 46,761 44,767Age 35+ 43,971 42,840 42,013 41,498 37,860 35,980 33,506 32,640 32,595 32,108 30,785
--
20,000
40,000
60,000
80,000
100,000
120,000
Source: KHEDS Academic Year CollectionMore data can be found at stats.kansasregents.org; Enrollment Tab
6

Academic Year EnrollmentSystemwide Headcount by Residency
2013 2014 2015 2016 2017 2018 2019 2020Nonresident 41,804 45,107 45,284 48,433 49,863 50,763 51,477 52,570Exception by statute 6,282 4,874 8,078 6,267 6,341 6,266 5,818 5,584Resident 210,864 202,441 196,614 191,293 187,515 187,489 185,015 179,846
--
40,000
80,000
120,000
160,000
200,000
240,000
280,000
Source: KHEDS Academic Year CollectionMore data can be found at stats.kansasregents.org; Enrollment Tab
7

Academic Year EnrollmentState Universities Headcount and Full-time Equivalency
2010 2011 2012 2013 2014 2015 2016 2017 2018 2019 2020Headcount 109,175 109,416 110,044 109,481 108,759 109,348 108,350 107,728 107,849 108,039 108,730FTE 77,603 78,435 78,619 78,544 78,893 79,605 79,458 79,212 78,434 78,085 77,452
74,000
75,000
76,000
77,000
78,000
79,000
80,000
100,000
102,000
104,000
106,000
108,000
110,000
112,000
HC -0.4% 10-Yr Change
FTE -0.2%10-Yr Change
Source: KHEDS Academic Year CollectionMore data can be found at stats.kansasregents.org; Enrollment Tab
8
--
2,500
5,000
7,500
10,000
12,500
15,000
2010 2011 2012 2013 2014 2015 2016 2017 2018 2019 2020
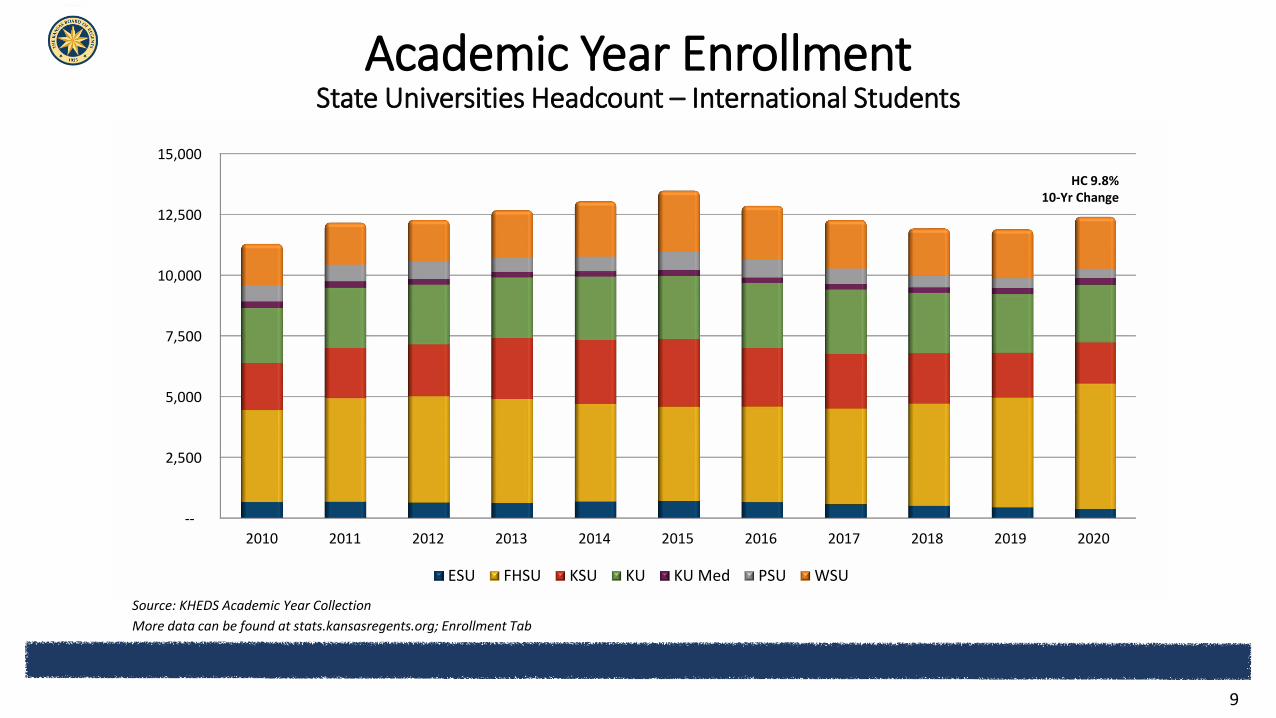
ESU FHSU KSU KU KU Med PSU WSU
Academic Year EnrollmentState Universities Headcount – International Students
HC 9.8% 10-Yr Change
Source: KHEDS Academic Year CollectionMore data can be found at stats.kansasregents.org; Enrollment Tab
9

Academic Year EnrollmentWashburn University Headcount and Full-time Equivalency
2010 2011 2012 2013 2014 2015 2016 2017 2018 2019 2020Headcount 8,178 8,593 8,671 8,406 8,084 7,848 7,803 7,702 7,745 7,527 7,226FTE 5,368 5,640 5,699 5,589 5,322 5,126 5,009 5,069 5,106 4,994 4,768
--
2,000
4,000
6,000
8,000
10,000
12,000
HC -11.6% 10-Yr Change
FTE -11.2%10-Yr Change
Source: KHEDS Academic Year CollectionMore data can be found at stats.kansasregents.org; Enrollment Tab
10
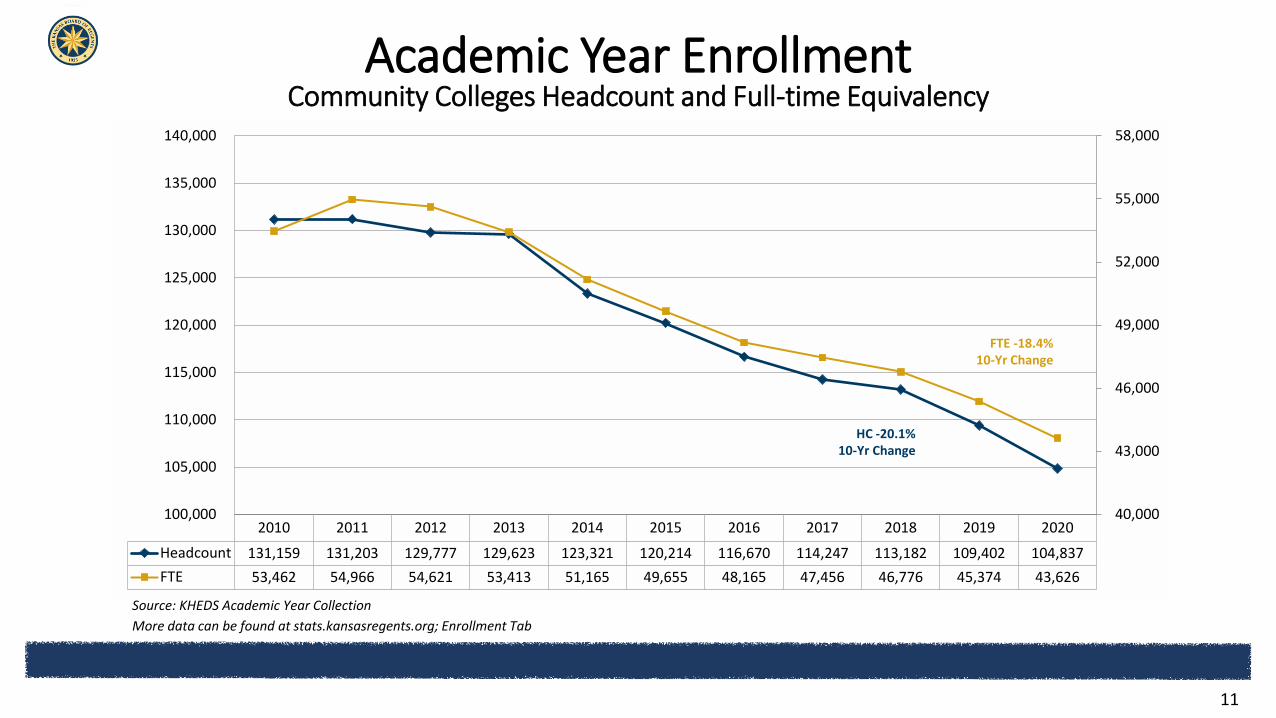
Academic Year EnrollmentCommunity Colleges Headcount and Full-time Equivalency
2010 2011 2012 2013 2014 2015 2016 2017 2018 2019 2020Headcount 131,159 131,203 129,777 129,623 123,321 120,214 116,670 114,247 113,182 109,402 104,837FTE 53,462 54,966 54,621 53,413 51,165 49,655 48,165 47,456 46,776 45,374 43,626
40,000
43,000
46,000
49,000
52,000
55,000
58,000
100,000
105,000
110,000
115,000
120,000
125,000
130,000
135,000
140,000
HC -20.1% 10-Yr Change
FTE -18.4%10-Yr Change
Source: KHEDS Academic Year CollectionMore data can be found at stats.kansasregents.org; Enrollment Tab
11

Academic Year EnrollmentTechnical Colleges Headcount and Full-time Equivalency
2010 2011 2012 2013 2014 2015 2016 2017 2018 2019 2020Headcount 9,795 9,623 10,478 11,440 12,258 12,566 13,170 14,042 15,742 17,342 17,207FTE 5,012 5,231 5,678 5,964 6,270 6,042 6,197 6,494 7,103 7,522 7,497
-
1,000
2,000
3,000
4,000
5,000
6,000
7,000
8,000
--
3,000
6,000
9,000
12,000
15,000
18,000
HC 75.7% 10-Yr Change
FTE 49.6%10-Yr Change
Source: KHEDS Academic Year CollectionMore data can be found at stats.kansasregents.org; Enrollment Tab
12

COLLEGE READINESS AND EQUITY
13

Demographic Changes
AmericanIndian Asian Black Hispanic
NativeHawaiian or
Pacific Islander
Two or MoreRaces White All Students
5-Year Change -80 183 32 1,528 3 266 -207 1,72510-Year Change -172 363 -227 2,962 -42 1,182 -1,707 2,183
-2,500
-1,500
-500
500
1,500
2,500
3,500
Kansas High School Graduates
Source: P20 Data System
14

72%
57%
English51%
36%
Math
51%43%
Reading
42%34%
Science
30%23%
Met All Four
College Readiness By SubjectPercent Meeting ACT Benchmarks 2013 Vs. 2020
BenchmarksEnglish – 18Math – 22Reading – 22Science – 23
Source: ACT Kansas College and Career Readiness Report 2020
15
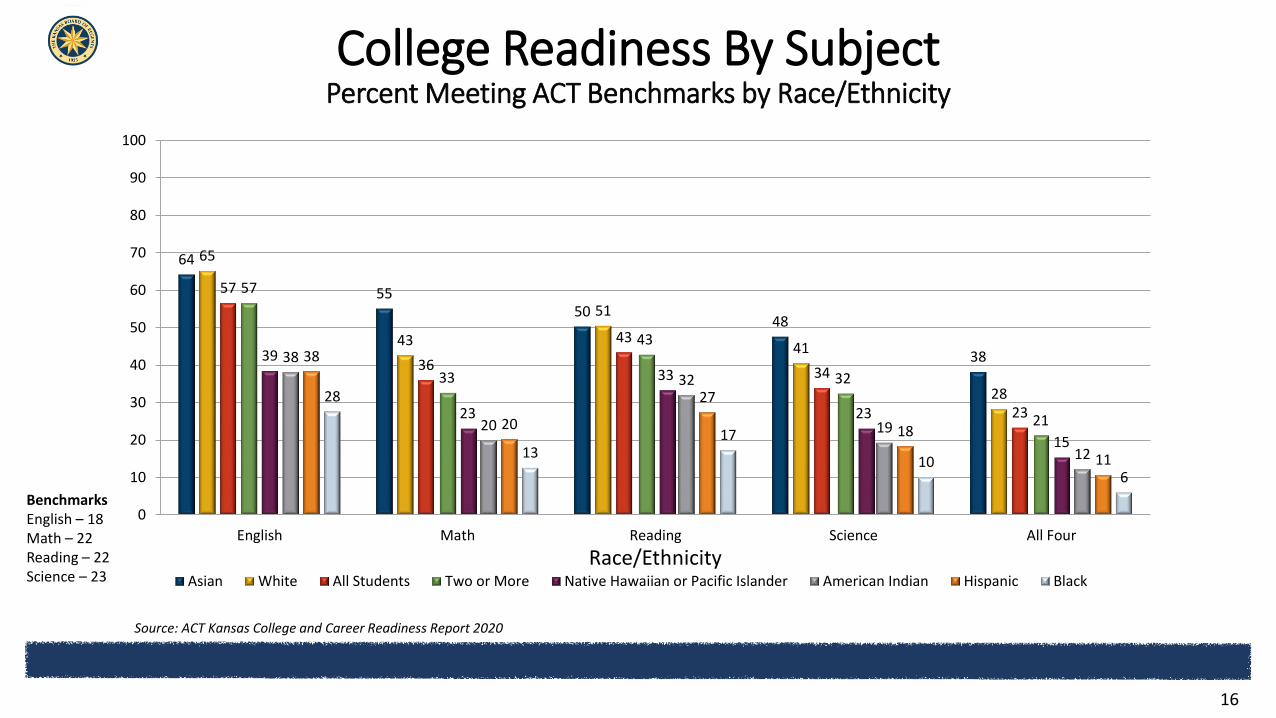
College Readiness By SubjectPercent Meeting ACT Benchmarks by Race/Ethnicity
Source: ACT Kansas College and Career Readiness Report 2020
BenchmarksEnglish – 18Math – 22Reading – 22Science – 23
64
5550
48
38
65
43
51
41
28
57
36
43
34
23
57
33
43
32
21
39
23
33
23
15
38
20
32
19
12
38
20
27
18
11
28
1317
106
0
10
20
30
40
50
60
70
80
90
100
English Math Reading Science All FourRace/Ethnicity
Asian White All Students Two or More Native Hawaiian or Pacific Islander American Indian Hispanic Black
16

College Readiness By SubjectPercent Meeting ACT Benchmarks by Family Income
BenchmarksEnglish – 18Math – 22Reading – 22Science – 23
86
6569
62
48
80
5862
52
40
78
5561
51
38
73
49
57
44
33
69
44
51
40
28
59
37
45
33
21
55
31
40
29
18
47
24
32
24
14
37
19
26
18
10
0
10
20
30
40
50
60
70
80
90
100
English Math Reading Science All Four
Dollars in Thousands> $150 $120-$150 $100-$120 $80-$100 $60-$80 $50-$60 $36-$50 $24-$36 $0-$24
Source: ACT Kansas College and Career Readiness Report 2020
17

55.2%55.6% 55.3%
54.9%
54.0%
55.2%
54.1%
52.6%
50.4%
49.3%48.6%
46%
48%
50%
52%
54%
56%
58%
2009 2010 2011 2012 2013 2014 2015 2016 2017 2018 2019
Percent of High School Students Entering Public Post SecondaryPublic College Going Rates
Source: KHEDS Academic Year Collection and P20 Data SystemKansas High School Graduates entering Public Postsecondary the academic year following high school graduation
18

Public College Going RatesPercent by Race/Ethnicity
54.7
%
58.9
%
52.9
%
57.3
%
56.8
%
52.2
%55.2
%
55.2
%
48.6
%52.2
%
52.5
%
45.1
%
44.8
%
50.0
%
33.3
%
49.9
%
35.3
%
39.9
%
45.3
%
50.0
%
38.4
%
47.2
%
51.5
%
39.6
%
30%
35%
40%
45%
50%
55%
60%
65%
2009 2014 2019
Asian White All Students Two or More Races Native Hawaiian or Pacific Islander American Indian Hispanic Black
Source: KHEDS Academic Year Collection and P20 Data SystemKansas High School Graduates entering Public Postsecondary the academic year following high school graduation
19

Public College Going RatesPercent by Concentration of Students Who Qualify for Free/Reduced Lunch
Source: KHEDS Academic Year Collection and P20 Data SystemKansas High School Graduates entering Public Postsecondary the academic year following high school graduation
20
43.2
%
42.4
%
38.9
%
46.0
%
44.5
%
45.7
%
52.7
%
50.6
%
50.4
%56.7
%
58.5
%
56.6
%
0%
11%
22%
33%
44%
55%
66%
2017 2018 2019
High Concentration Mid-High Mid-Low Low Concentration

Attainment RatesPercent by Race/Ethnicity
38.4%
19.7%
35.9%
31.8%
35.3%
36.3%
50.4%
45.4%
54.4%
49.0%
53.4%
60.0%
0% 10% 20% 30% 40% 50% 60% 70%
Kansas Postsecondary Class of 2020
Kansas Population
Attainment Percent
Asian and Pacific Islander White All Races American Indian Black Hispanic
Source: Lumina Foundation, A Stronger Nation, 2021 Report and KHEDS Academic Year Collection, 150% Graduation Rate
21

Developmental EducationPercent of Students Enrolled in Developmental Education
Institution Type Math, English, or Reading Math English/Reading
State Universities 8.1% 7.4% 1.5%
Community Colleges 29.9% 23.0% 17.6%
Unduplicated 19.9% 15.9% 9.9%
Source: P20 Data System and KHEDS Academic Year Collection
Definitions: Unduplicated number of 2019 Kansas High School Graduates entering 2020 Kansas Public Postsecondary as degree seeking, during the first year following High School Graduation
22

Students with Sufficient Academic Loadfor On-Time Graduation
70%
48%42%
75%
66%
48%
55%
0%
10%
20%
30%
40%
50%
60%
70%
80%
90%
Emporia StateUniversity
Fort Hays StateUniversity
Kansas StateUniversity
Pittsburg StateUniversity
University of Kansas Wichita StateUniversity
State UniversitiesTotal
2015 2016 2017 2018 2019 2020Source: KHEDS Academic Year Collection
23

Pell Count Systemwide by Academic YearInstitution Type 2014 2015 2016 2017 2018 2019 2020
State Universities 22,558 22,473 21,510 20,855 20,990 20,835 19,750Washburn University 2,392 2,258 2,125 2,027 1,975 1,960 1,814Community Colleges 28,127 26,496 23,450 21,535 21,151 20,733 20,259Technical Colleges 4,020 3,570 3,036 3,025 3,275 3,515 3,220Grand Total 57,097 54,797 50,121 47,442 47,391 47,043 45,043
Source: KBOR KHEDS AY Collection*All university data exclude graduate students.
Pell Percentage Systemwide by Academic YearInstitution Type 2014 2015 2016 2017 2018 2019 2020
State Universities 29.5% 29.4% 28.3% 27.8% 28.2% 28.2% 27.0%Washburn University 42.4% 41.7% 40.1% 38.1% 37.3% 41.4% 36.9%Community Colleges 42.5% 41.4% 38.1% 35.7% 36.3% 36.7% 35.7%Technical Colleges 59.6% 54.3% 48.2% 46.2% 46.1% 46.4% 46.4%Grand Total 36.8% 35.9% 33.6% 32.2% 32.7% 33.0% 31.8%
Source: KBOR KHEDS AY Collection*All university data exclude graduate students.
Serving Pell-Eligible Students

CHARACTERISTICS OFENTERING STUDENTS
25

First-Time Entering EnrollmentState Universities Headcount – Fall Census
0
2,000
4,000
6,000
8,000
10,000
2010 2011 2012 2013 2014 2015 2016 2017 2018 2019 2020Kansas State University 3,701 3,727 4,079 3,873 3,805 3,689 3,605 3,381 3,499 3,228 2,995University of Kansas 3,702 3,580 3,771 4,000 4,084 4,187 4,233 4,153 4,164 4,125 3,829Wichita State University 1,305 1,366 1,359 1,274 1,427 1,294 1,476 1,510 1,690 1,655 1,554
Rese
arch
U
nive
rsiti
es
0
1,000
2,000
3,000
2010 2011 2012 2013 2014 2015 2016 2017 2018 2019 2020Emporia State University 641 587 623 696 755 735 665 606 658 680 565Fort Hays State University 907 1,017 1,019 1,063 1,025 962 984 1,045 996 986 912Pittsburg State University 1,089 1,161 1,091 1,163 1,071 1,076 1,022 1,007 967 892 805
Regi
onal
U
nive
rsiti
es
Source: KHEDS Fall Census Collection
26

New Transfer EnrollmentState Universities Headcount – Fall Census
0
1,500
3,000
4,500
6,000
2010 2011 2012 2013 2014 2015 2016 2017 2018 2019 2020Kansas State University 1,612 1,580 1,607 1,781 1,815 1,617 1,491 1,356 1,307 1,300 1,147University of Kansas 1,518 1,495 1,509 1,421 1,323 1,216 1,245 1,216 1,249 1,142 1,073Wichita State University 1,390 1,467 1,464 1,287 1,373 1,270 1,239 1,215 1,297 1,186 1,009
Rese
arch
U
nive
rsiti
es
0
1,000
2,000
3,000
4,000
2010 2011 2012 2013 2014 2015 2016 2017 2018 2019 2020Emporia State University 421 407 453 387 387 354 350 349 316 296 265Fort Hays State University 2,205 2,292 2,378 2,172 2,211 2,349 2,219 2,392 2,742 2,964 2,015Pittsburg State University 545 519 573 649 652 588 586 602 531 548 420
Regi
onal
U
nive
rsiti
es
Source: KHEDS Fall Census Collection
27

THE EXPANDING CAMPUS
28

Dual EnrollmentCommunity and Technical Colleges
0
6,000
12,000
18,000
24,000
30,000
36,000
2010 2011 2012 2013 2014 2015 2016 2017 2018 2019 2020CEP 10,508 10,356 11,077 9,718 8,955 9,028 9,315 12,196 11,718 11,006 11,389CEP/Excel CTE 1,847 3,286 4,659 3,772 4,694 5,191 5,833 5,917Excel CTE 4,254 5,154 5,616 6,251 5,906 6,499 7,842 8,017Dual 6,627 6,889 6,822 4,391 4,773 4,825 7,079 4,872 5,519 6,211 6,665
Num
ber H
igh
Scho
ol S
tude
nts
Dual
ly E
nrol
led
in C
omm
unity
and
Tech
nica
l
CEP
EXCE
L CT
E
Source: KHEDS Academic Year CollectionMore data can be found at stats.kansasregents.org; High School Tab
29
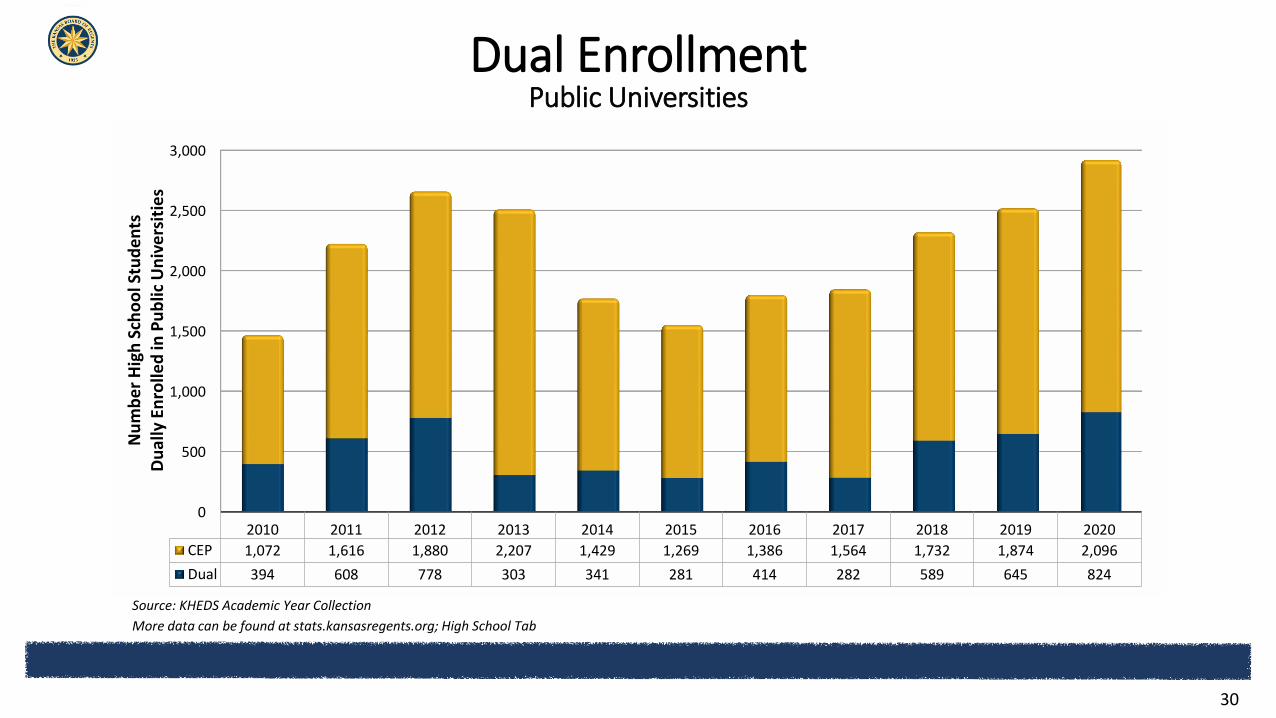
Dual EnrollmentPublic Universities
0
500
1,000
1,500
2,000
2,500
3,000
2010 2011 2012 2013 2014 2015 2016 2017 2018 2019 2020CEP 1,072 1,616 1,880 2,207 1,429 1,269 1,386 1,564 1,732 1,874 2,096Dual 394 608 778 303 341 281 414 282 589 645 824
Num
ber H
igh
Scho
ol S
tude
nts
Dual
ly E
nrol
led
in P
ublic
Uni
vers
ities
Source: KHEDS Academic Year CollectionMore data can be found at stats.kansasregents.org; High School Tab
30

Distance EducationAcademic Year 2020
Credit Hour Production
SectorDistance
Education Hours
Total Credit Hours
Percent Delivered Distance
Education
Share of Distance Education by
Institution Type
State Universities 587,593 2,221,053 26.5% 54.6%
Municipal University 31,451 138,578 22.7% 2.9%
Community Colleges 426,625 1,308,782 32.6% 39.7%
Technical Colleges 28,819 224,926 12.8% 2.6%
Systemwide Total 1,074,488 3,893,339 27.6% 100%
Source: KHEDS Academic Year Collection
31

FALL 2020 - PANDEMIC
32

Fall Preliminary Enrollment
Source: KHEDS Fall Preliminary CollectionMore data can be found at stats.kansasregents.org; Enrollment Tab
Systemwide Headcount and Full-time Equivalency
2010 2011 2012 2013 2014 2015 2016 2017 2018 2019 2020Headcount 187,586 188,447 188,694 186,190 184,717 182,101 182,663 182,010 181,530 179,847 165,251FTE 134,538 134,924 134,628 133,577 132,779 130,618 130,751 129,346 127,904 126,016 117,469
105,000
110,000
115,000
120,000
125,000
130,000
135,000
140,000
160,000
165,000
170,000
175,000
180,000
185,000
190,000
195,000
33

34
-25.2%
-6.1%
1.3%
-7.8%
-20.6%
-5.8%
2.4%
-5.9%
-30.0%
-25.0%
-20.0%
-15.0%
-10.0%
-5.0%
0.0%
5.0%
High School Dually Enrolled Undergraduate Graduate Total
Headcount FTE
Fall Preliminary Enrollment - Systemwide% Change Fall 2019 to Fall 2020
Source: KHEDS Fall Census Collection

More information can be found at www.kansasregents.org => Data
• Databooks for Each Sector• Enrollment Reports• Comprehensive Tuition & Fee Reports• Kansas Higher Education Statistics – self-serve reporting tool
35