ensemble-variational sea ice data assimilation anna shlyaeva, mark buehner, alain caya, data...
TRANSCRIPT

Ensemble-variational sea ice data assimilation
Anna Shlyaeva, Mark Buehner, Alain Caya,Data Assimilation and Satellite Meteorology Research
Jean-Francois Lemieux, Gregory Smith, Francois Roy, Environmental Numerical Prediction Research
Tom Carrieres Canadian Ice Service
Environment Canada

Page 2 – April 19, 2023
Regional Ice Prediction System (RIPS)
• Four 3DVar analyses per day of ice concentration at 5 km resolution on rotated lat-lon grid
• Observations assimilated:– SSMI and SSMIS NT2 retrievals– ASCAT observations– Canadian Ice Service ice charts
• Four 48hr CICE v.4.0 forecasts per day on CREG12 (subset of ORCA12) domain
• Atmospheric forcings from GEM, ocean forcings and initial fields from GIOPS

Page 3 – April 19, 2023
• state-dependent variances
• anisotropic covariances
Motivation to use ensembles
• Provide an estimate of the uncertainty in the analysis and background states
• Provide initial conditions for ensemble forecasts
• Improve how observations are assimilated by using improved background-error covariances obtained from ensembles:
Higher variances in marginal ice zone
Lower variances in open water and inside packed ice
Ensemble covariances Static covariances Currently used in 3DVar:
• constant variances
• constant correlation lengthscale
Page 4 – April 19, 2023
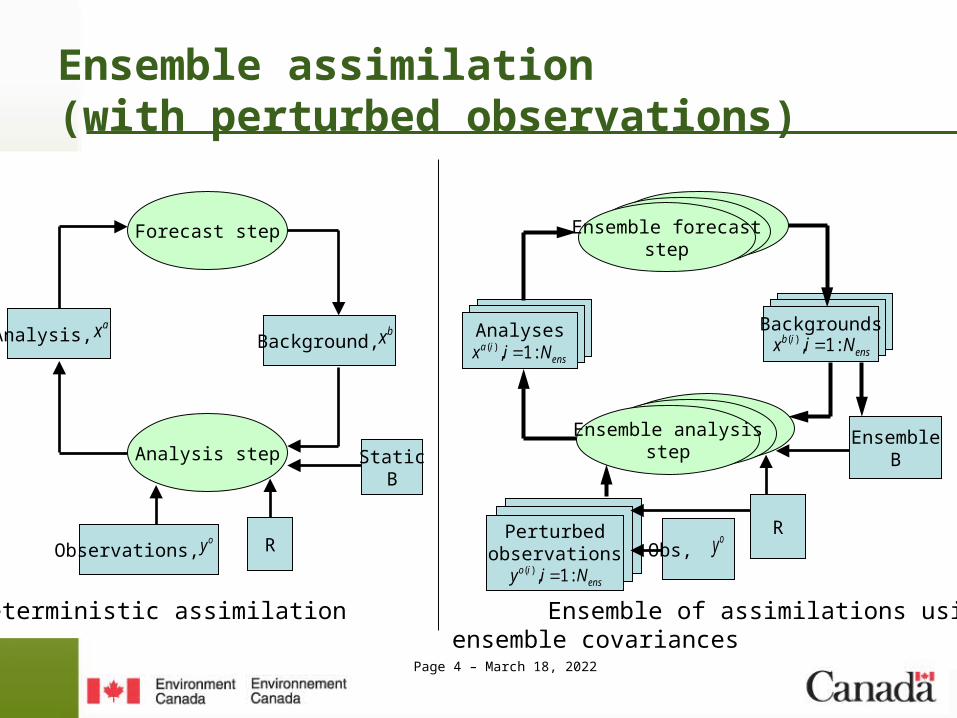
Ensemble assimilation (with perturbed observations)
Forecast step
Background, bx
Observations,
StaticB
Roy
Analysis, ax
Analysis step
Deterministic assimilation Ensemble of assimilations usingensemble covariances
Analyses
ensia Nix :1,)(
Ensemble forecaststep
Backgroundsens
ib Nix :1,)(
Ensemble analysisstep
EnsembleB
Perturbedobservations
ensio Niy :1,)(
RObs,
oy

Page 5 – April 19, 2023
First step: Ensemble of 3DVars (static B)
Ensemble forecasts
Analyses
ensia Nix :1,)(
Backgrounds
ensib Nix :1,)(
Ensemble analyses Static B
Perturbedobservations RObs,
oy
ensio Niy :1,)(
Ensemble B
Experiments for evaluating ensemble spread and tuning model error simulation

Page 6 – April 19, 2023
Simulation of uncertainties in forcings and initial fields
• Using ensemble atmospheric forecasts (Global Ensemble Prediction System) to force CICE
• Perturbing sea surface temperature (SST) and mixed layer depth (MLD) with differences between forecasts valid at the same time (NMC-like approach)
• Multiplying ocean current speed by a random number ~N(1,0.05)
• Initial spread generated by horizontally correlated ice concentration perturbations only near the marginal ice zone

Page 7 – April 19, 2023
Model biases
• Problem 1: model doesn’t represent fast ice
• Problem 2: model bias introduced through biases in atmospheric and ocean forcings
Ensemble meanStrong winds incorrectly cause the ice to move in all ensemble members
Ensemble spreadEnsemble spread is very low, butmean error is very high
Canadian Arctic Archipelago, July 2011, fast ice case

Page 8 – April 19, 2023
Extreme sea ice model error parametrization
• 21 ensemble member:– 7 members: full CICE model– 7 members: CICE dynamics only– 7 members: CICE thermodynamics only
• Motivation– Dynamics: 1/3 of ensemble members don’t move: increased
ensemble spread in the ‘ice shouldn’t move, but it’s moving’ case
– Thermodynamics: 1/3 of ensemble members don’t melt/freeze: increased ensemble spread in the ‘error in the forcings causing biases due to incorrect melt/freeze’ case

Page 9 – April 19, 2023
Ensemble of 3DVars experiment
• Experiment June 8, 2011 – September 30, 2011– Summer is the hardest period both for the analyses and for the
forecasts
• Observations perturbed with correlated errors (approach similar to initial ice concentration perturbations)
• Assimilated observations:– SSMI NT2 retrievals– SSMI/S NT2 retrievals– ASCAT observations– Canadian Ice Service ice charts
• Verification based on Canadian Ice Service daily ice charts (available for different regions)

Page 10 – April 19, 2023
• Statistics averaged over Foxe Basin ice charts for ice points with 10%-90% ice concentration (dashed for ensemble spread, solid for RMSE of ensemble mean)
Full ensemble vs 7 members using full model
Background ensemble spread and RMSE of ensemble mean time series
RMSEspread

Page 11 – April 19, 2023
• Statistics averaged over Foxe Basin ice charts for ice points with 10%-90% ice concentration (dashed for ensemble spread, solid for RMSE of ensemble mean)
Full ensemble vs 7 members using full model
Background ensemble spread and RMSE of ensemble mean time series
Extreme model error parametrization:
• Improves consistency between ensemble spread and error of ensemble mean (similar growth rates during forecast)
• Results in improved ensemble mean (smaller RMSE)
RMSEspread

Page 12 – April 19, 2023
Average observed ice concentration (in daily ice charts)Bottom:RMSE of ensemble mean & ensemble spread
Time-averaged ensemblespread and RMSE maps
50
40
30
20
10
0
25
20
15
10
5
0

Page 13 – April 19, 2023
Second step: First EnVar experiments
BackgroundAnalysisax
Forecaststep
Backgroundsens
ib Nix :1,)(
Analysisstep
EnsembleB
RObs, oy
bx
Using ensemble covariances from the ‘ensemble of 3DVars’ experiment in the EnVar data assimilation

Page 14 – April 19, 2023
EnVar: Single observation experiment
Observation=55%; Background=30%
Left: Background ice concentration
Using static covariances(10 km lengthscale)
Using ensemble covariances(50 km localization distance)

Page 15 – April 19, 2023
EnVar ice concentration analysis increment example (July 18, 2011)
Using static covariances (10 km lengthscale)
Using ensemble covariances(50 km localization distance)
Sharper and stronger increments (close to the ice edge, where there is a strong gradient in variances) in the ensemble covariances case
60%
50%
40%
30%
20%
10%
0%
-10%
-20%
-30%
-40%
-50%
-60%
60%
50%
40%
30%
20%
10%
0%
-10%
-20%
-30%
-40%
-50%
-60%

Page 16 – April 19, 2023
EnVar ice concentration analysis example (July 18, 2011)
Using static covariances Using ensemble covariances
Less negative ice concentration artefacts in analysis in the ensemble covariances case
100%
80%
60%
40%
20%
0%
-20%
-40%
100%
80%
60%
40%
20%
0%
-20%
-40%

Page 17 – April 19, 2023
EnVar analysis example: updating unobserved variables
Background ice concentration field Ice concentration increment
SST increment, degreesIce thickness increment, meters
60%
50%
40%
30%
20%
10%
0%
-10%
-20%
-30%
-40%
-50%
-60%

Page 18 – April 19, 2023
Conclusions
• Ensemble of 3DVars strategy:– Appears to give reasonable relationship between ensemble
spread and error in ensemble mean with current approach for simulating model error
– Also plan to compare ‘extreme model error parametrization’ with less extreme approach of perturbing several model parameters (ice-ocean, ice-atmosphere drags, ice rigidity, ice albedo)
• First experiments using EnVar for assimilation:– Sharper and more detailed analysis increments close to the ice
edge due to anisotropic ensemble covariances and strong gradients in ensemble variance
– Ensembles can be used to update other variables, e.g. ice thickness (distribution)

Page 19 – April 19, 2023

Page 20 – April 19, 2023
EnVar: using ensemble covariances in 3DVar
• 3DVar cost function:
• Using static B:
• Using ensemble covariances:
where L is localization operator (we use diffusion operator) and
xHxHyRxHxHyJ boTboT )()(2
1
2
1)( 1
1,...,1
,1
)()2()1(
ens
bNb
ens
bb
ens
bb
N
xx
N
xx
N
xxe
ens
ensN
k
kk Lex1
)(2/1)(
2/1Bx

Page 21 – April 19, 2023
Ice concentration perturbations
• Generate random field (white noise)• Multiply it by a factor dependent on the ice concentration at the current point
• Apply diffusion operator• Multiply by sigma
Goal: perturb mostly close to the marginal ice zone