ensilage of jack bean and cowpea grains sole or mixed with
TRANSCRIPT
Ensilage of Jack bean and cowpea grains
sole or mixed with sorghum to improve their nutritional value
as feedstuff for growing-finishing pigs
Dissertation
zur Erlangung des akademischen Grades
Doktor der Agrarwissenschaften (Dr. agr.)
an der Agrar- und Umweltwissenschaftlichen Fakultät
der Universität Rostock
Rostock, 2014
vorgelegt von:
Luis Alberto González Díaz
aus Rostock
geboren am 27.11.1975 in Santa Clara, Kuba

Gutachter:
1. Gutachter: Prof. Dr. Annette Zeyner Martin-Luther-Universität Halle-Wittenberg, Halle / Saale
2. Gutachter: Prof. Dr. Petra Wolf Universität Rostock
3. Gutachter: Dr. Andrés Castro Alegría Universidad Central de las Villas, Villa Clara, Kuba
4. Gutachter: Prof. Dr. Hans Schenkel Universität Hohenheim, Stuttgart
Datum der Einreichung: 05. September 2014
Datum der Verteidigung: 12. Juni 2015

Contents
Contents
1 Introduction................................................................................................... 1
2 Literature review ........................................................................................... 3
2.1 Particularities of animal production in the tropics .................................................... 3
2.2 The production of Jack bean, cowpea and sorghum grains in the tropics ............... 6
2.3 Anti-nutritional factors in Jack bean, cowpea and sorghum grains ........................ 11
2.3.1 Main anti-nutritional factors in Jack bean, cowpea and sorghum grains and
their impact on animal physiology ......................................................................... 12
2.3.2 Deactivation of anti-nutritional factors ................................................................... 21
2.4 Particularities of grain silages ............................................................................... 25
3 Task and aim ............................................................................................... 29
4 Materials and methods ................................................................................ 31
4.1 Experimental procedure ....................................................................................... 31
4.2 Selection and processing of the plant material ...................................................... 32
4.3 Ensiling experiments with grains of Jack bean and cowpea sole or mixed
with sorghum ........................................................................................................ 32
4.3.1 Rostock Fermentation Test (RFT) ........................................................................ 32
4.3.2 Preparation of model silages ................................................................................ 33
4.3.3 Pre-ensiling treatments ......................................................................................... 35
4.3.3.1 Soaking ................................................................................................................ 35
4.3.3.2 Pre-germination .................................................................................................... 35
4.3.4 Lab scale silages with pre-treated seeds .............................................................. 36
4.3.4.1 Model silages with soaked seeds ......................................................................... 36
4.3.4.2 Model silages with pre-germinated seeds ............................................................. 37
4.4 Standardized ileal digestibility of amino acids and apparent fecal digestibility
of selected nutrients ............................................................................................. 37
4.4.1 Constitution of diets used for digestibility trials ...................................................... 37
4.4.2 Determination of the standardized ileal digestibility of amino acids ....................... 38
4.4.2.1 Animals and housing ............................................................................................ 38
4.4.2.2 Experimental design and diets .............................................................................. 39
4.4.2.3 Chyme collection and analysis ............................................................................. 40
4.4.3 Determination of fecal digestibility of selected nutrients ........................................ 41
4.4.3.1 Animals and housing ............................................................................................ 41
4.4.3.2 Experimental design and diets .............................................................................. 42
4.4.3.3 Feces collection and analysis ............................................................................... 42
4.5 Chemical analysis ................................................................................................ 43
4.5.1 Chemical analysis of the plant material, silages, chyme and feces ....................... 43
4.5.2 Determination of fermentation products ................................................................ 44
4.5.3 Determination of the aerobic stability of silages .................................................... 45
4.5.4 Determination of deoxynivalenol ........................................................................... 45
4.5.5 Determination of anti-nutritional factors ................................................................ 46

Contents
4.6 Calculations .......................................................................................................... 51
4.7 Statistical analysis ................................................................................................ 52
5 Results ........................................................................................................ 54
5.1 Silages of remoistened Jack bean and cowpea grains sole or mixed with
sorghum ............................................................................................................... 54
5.1.1 Chemical analysis of the plant material ................................................................. 54
5.1.2 Rostock Fermentation Test using Jack bean and cowpea sole or mixed with
sorghum ............................................................................................................... 55
5.1.3 Model silages with remoistened grains ................................................................. 58
5.1.4 Anti-nutritional factors in silages of remoistened grains ........................................ 61
5.1.4.1 Trypsin inhibitory activity (TIA) .............................................................................. 61
5.1.4.2 Hydrogen cyanide (HCN) ..................................................................................... 62
5.1.4.3 Canavanine .......................................................................................................... 63
5.2 Silages of soaked Jack bean and cowpea grains sole or mixed with sorghum ...... 64
5.2.1 Soaking ................................................................................................................ 64
5.2.2 Model silages with soaked legume grains ............................................................. 66
5.2.3 Anti-nutritional factors in silages of soaked legume grains .................................... 71
5.2.3.1 Trypsin inhibitory activity (TIA) .............................................................................. 71
5.2.3.2 Hydrogen cyanide (HCN) ..................................................................................... 72
5.2.3.3 Canavanine .......................................................................................................... 73
5.3 Silages of pre-germinated Jack bean and cowpea grains sole or mixed with
sorghum ............................................................................................................... 74
5.3.1 Pre-germination .................................................................................................... 74
5.3.2 Model silages with pre-germinated legume grains ................................................ 76
5.3.3 Anti-nutritional factors ........................................................................................... 80
5.3.3.1 Effect of pre-germination on selected anti-nutritional factors in not ensiled
legume grains ....................................................................................................... 80
5.3.3.2 Effect of pre-germination on selected anti-nutritional factors in ensiled
legume grains ....................................................................................................... 81
5.3.3.2.1 Trypsin inhibitory activity (TIA) .............................................................................. 81
5.3.3.2.2 Hydrogen cyanide (HCN) ..................................................................................... 82
5.3.3.2.3 Canavanine .......................................................................................................... 83
5.4 Silages of Jack bean and cowpea mixed with sorghum as feedstuffs for
growing pigs ......................................................................................................... 84
5.4.1 Evaluation of feedstuffs used in the animal trials .................................................. 84
5.4.2 Standardized ileal digestibility of essential amino acids and apparent
digestibility of proximate nutrients in raw cowpea-sorghum mixtures and
corresponding silages ........................................................................................... 90
6 Discussion .................................................................................................. 92
6.1 Soaking and pre-germination as silage pre-treatments ......................................... 92
6.1.1 Soaking ................................................................................................................ 92
6.1.2 Pre-germination .................................................................................................... 95
6.1.3 Pre-ensiling treatments and selected anti-nutritional factors ................................. 95

Contents
6.2 Effect of different pre-ensiling treatments, additives and mixing with sorghum
on selected fermentation parameters in Jack bean and cowpea silages ............... 96
6.3 Effect of different pre-ensiling treatments and additives on selected anti-
nutritional factors in Jack bean and cowpea silages mixed or not mixed with
sorghum ............................................................................................................. 103
6.4 Silages of Jack bean-sorghum and cowpea-sorghum mixtures as feedstuffs
for pigs ............................................................................................................... 108
6.4.1 Standardized ileal digestibility of essential amino acids in raw cowpea-
sorghum mixtures and corresponding silages ..................................................... 109
6.4.2 Apparent digestibility of proximate nutrients in raw cowpea-sorghum mixtures
and corresponding silages .................................................................................. 112
7 Conclusions .............................................................................................. 115
8 Summary ................................................................................................... 117
8.1 Summary ............................................................................................................ 117
8.2 Zusammenfassung ............................................................................................. 119
9 References ................................................................................................ 123
10 Table index
11 Figure index
12 Appendix
Abbreviations
Abbreviations
AA amino acid
AC acetic acid
AD apparent digestibility
ADFOM acid detergent fiber (exclusive residual ash)
ADLOM acid detergent lignin (exclusive residual ash)
ADT additive
AEE acid ether extract
ALA alanine
ANF anti-nutritional factors
ARG arginine
ASP asparagine
BA butyric acid
BC buffering capacity
BW body weight
CG cyanogenic glycosides
Con-A concanavalin A
CF crude fiber
cfu colony forming units
CP crude protein
CT condensed tannins
CWP cowpea
CYS cystine
DM dry matter
FM fresh matter
GLU glutamic acid
GLY glycine
HIS histidine
HU hemagglutination unit
ILE isoleucine
JBN Jack bean
LA lactic acid
LAB lactic acid bacteria
LEG legume grain (either Jack bean or cowpea)
LEU leucine
LYS lysine
m.a.s.l. meters above sea level

Abbreviations
MET methionine
MOL molasses
MOR moisture re-constituted
ME metabolizable energy
NA not analyzed
ND not detected
NDFOM neutral detergent fiber (exclusive residual ash)
n.s. not significant
OM organic matter
PA propionic acid
PET pre-ensiling treatment
PHE phenylalanine
PRG pre-germinated
PRO proline
RFT Rostock fermentation test
SER serine
SID standardized ileal digestibility
SOK soaked
SOR sorghum
STI storage time
THR threonine
TI trypsin inhibitor
TIA trypsin inhibitory activity
TIU trypsin inhibitory unit
TTM treatment
TYR tyrosine
VAL valine
VFA volatile fatty acids
w/v weight per volume
WSC water soluble carbohydrates

Introduction
1
1 Introduction
Due to the increasing world population, the resulting food demand is a challenge to
be faced. In 2010 a total of 925 million people were estimated to be undernourished,
whereas the developing countries account for 98 % (FAO, 2010b). In the tropical
countries of the less-developed world, the majority of people depend directly or
indirectly mainly on agriculture and livestock-based activities (Preston, 1995). Efforts
have been made to alleviate poverty by supporting agriculture and animal production.
Preston (1995) considers though, that the lack of understanding of the ecological,
socio-economic and cultural limitations inherent in these countries constrains
severely the application of conventional development models so that autochthonous
models and technologies have to be focused stronger, considering as well the
efficient use of the abundant biodiversity of the tropics.
In Cuba, to face the increasing demand for animal products, integrated sustainable
farming systems appropriate for small producers have been implemented, achieving
a high level of production and causing only marginal environmental problems.
However, a serious problem when raising animals in the tropics is still an insufficient
feedstuff production to supply livestock farming. In particular, there is a lack of high
quality feedstuffs rich in protein, as most developing countries in the tropics cannot
afford to import those cost-intensive feedstuffs, or they are simply not available.
Thus, the use of local protein sources is a promising solution.
The most viable option appears to be the exploitation of neglected legumes, which
abound in the tropics (Udedibie & Carlini, 1998b). Recently, the grains of under-
utilized legumes like Jack bean (Canavalia ensiformis) and cowpea (Vigna
unguiculata) receive attention, being more adapted to adverse environmental
conditions, highly resistant to diseases and pests and of good nutritional quality
(Siddhuraju, 1994). However, legumes show some drawbacks which hamper their
use in animal nutrition, as they contain several anti-nutritional factors, which make
them less palatable or affect the digestibility of nutrients. Furthermore, in tropical
regions with increased temperatures and a high humidity, drying and storage of dried
feedstuffs are particularly problematic. Silages of legume grains are seen as an
option, although a high buffering capacity and low levels of water soluble
carbohydrates indicate poor ensilability characteristics.

Introduction
2
The present study shall contribute to broaden the knowledge about the suitability of
Jack bean and cowpea grains as a possible feedstuff for pigs. Thereby, ensilage
should be investigated as a method for conservation of those legume grains sole or
mixed with sorghum, whereas the application of pre-ensiling treatments of the grains
is studied with respect to an increase of ensilability, the reduction of anti-nutritional
factors and the improvement of the nutritional value.

Literature review
3
2 Literature review
2.1 Particularities of animal production in the tropics
The tropics frame the area between the Tropic of Cancer and Capricorn. They are
commonly characterized by their predominant high temperatures throughout the year
and seasons, determined by the precipitation regime. The tropics are known to
shelter over half of the world’s biodiversity (Green et al., 1996). Furthermore, their
sensitivity and effects on the global climate are well documented (Galvin & Jones,
2009). However, the tropical developing countries face a serious problem, namely the
scarcity of food for the human population and feed for the dwindling livestock industry
(Udedibie & Carlini, 1998b). Thereby, the claim to maintain the biodiversity of the
tropics does not contradict with the establishment of new feed sources, as there is a
wide range of nutrients in the tropical flora which is currently not optimally used.
There are inherent reasons for the poor productivity of the tropical agriculture
compared to the temperate zones. Gallup & Sachs (2000) highlighted many
disadvantages of the tropics, among others a low soil quality, low crop yields, an
irregular rainfall regime, pests and diseases, difficulties in transferring technology
generated mainly for highly developed countries as well as the fact that agricultural
research is mainly focused on the temperate zones. Paterniani (1990) and
Brewbaker et al. (1985) concluded the same when analyzing corn production. As a
consequence, in developing tropical countries the food production does not increase
as fast as the population grows.
Many technical and economical endeavors at national and international levels tried to
increase animal production and animal productivity in the tropics, but results in
general have been meager. The most repeated error is the attempt to import
technologies that proved to work under temperate climes, but not for staple foods
with low performance under tropical conditions. Protein sources like soybean and
other oilseeds and legumes are most of the time imported, which represents a barrier
against the sustainability of the animal production. Although those feedstuffs could be
planted, the available infrastructure is insufficient for their optimal use (Figueroa, 2003).
Alternative feedstuffs are commonly used by pig smallholders in most of the
developing countries in the tropics. Studies about new feeding strategies have been
made not only in tropical but also in temperate countries with variable results (Ly,
1990) to identify new feed sources and to optimize their nutritive efficiency and
Literature review
4
profitability. In order to substitute cereals as a source of energy in pig rations, roots
and tubers are seen as a choice. Particularly the roots of cassava (Lindberg et al.,
2000b; Parra et al., 2002; Vasupen et al., 2008) and sweet potato (Manfredini et al.,
1993; Gonzalez et al., 2003; Moron et al., 2006; Pietrosemoli et al., 2006; Gupta et
al., 2009) were studied, mainly due to their exceptional yield and contents of starch
and water soluble carbohydrates. There are experiences in using taro (Buntha et al.,
2008) and yam, but their cultivation is relatively rare.
The use of fresh fruits or their industrial byproducts is also seen as an option, but
they are feasible only when used in farms close to the plantations or their processing
industry. Plantains and bananas for example, when fed ripe or properly processed
(e.g. dried, cooked, ensiled), are an alternative source of starch and sucrose, but low
in crude fiber and crude protein (Ly, 2004). Naturally grown palm tree fruits
(Roystonea regia) and pig production are commonly combined in extensive raising
systems in Cuba. The fresh ripe oily nuts contain about 25 % ether extract (rich in
unsaturated fatty acids) and 26 % crude fiber and are suggested by Ly (2000) to be
fed ground to improve the animal´s performance. Other species like the extracted or
raw African oil palm (Elaeis guineensis [Jacq.]) has been tested with good results
replacing cereals in rations for fattening pigs (Ocampo, 1994). Others, like Jatropha
curcas, gained popularity due to the nutritive value of the detoxified kernel meal,
which supplemented with additional lysine is comparable with soybean meal for
feeding pigs (Wang et al., 2011).
Citrus pulp, a byproduct of the citrus juice industry, with crude protein contents of 6 to
8 % of dry matter (DM) and crude fiber contents of 11 to 18 % of DM have been used
in pig rations in proportions of 10 to 20 % of DM and up to 40 % of DM when it is
ensiled (Dominguez, 1995; Sotto et al., 2009). Even the inclusion of dried coffee pulp
has been as well reported in pig feeding (Okai et al., 1985).
Sugar cane and its byproducts are used as feedstuffs in those countries where the
sugar cane industry prevails. The animal’s performance can be improved when sugar
cane juice or molasses is used instead of the freshly ground plant (Xande et al.,
2010). Due to the low N content of molasses, a good response in animals is obtained
when it is combined with a protein source like soybean (Hidalgo et al., 2006). The
nutritional value of broiler offal (Lallo et al., 1997), shrimp byproducts (Lindberg et al.,
2000a) and catfish (Nguyen et al., 2010) can be improved by fermentation with
molasses after inoculation with lactic acid bacteria. Growing “Torula” yeast (Candida

Literature review
5
spp.) in molasses produces a biomass with 40 to 50 % crude protein in the DM when
it is industrially produced, enhancing the animal´s performance (Diaz et al., 1996;
Savon et al., 1999).
The microbial protein is an important source of essential amino acids, which makes
distillery byproducts a valuable source of nutrients. Nevertheless, feedstock species,
processing methods, the yeast used for fermentation and analytical methods (Liu,
2011) have influence on the final product. “Torula” yeast´s vinasse may supply up to
30 % of the crude protein in cereal based pig diets (Piloto et al., 2009), a growth rate
of 810 g·d-1 and a feed conversion rate of 3.6 was obtained when 20 % of fresh
distillers solubles and soy bean were fed to pigs (Sarria & Preston, 1992). In contrast,
condensed molasses residue (63 % DM) from the microbial production of citric acid
can provide only a small percentage of the daily ration for pigs due to its low crude
protein content and gross energy value (Weigand & Kirchgessner, 1980).
The omnivorous nature of pigs provides the opportunity to include roughages in their
rations, where crop byproducts are produced in high amounts and with acceptable
nutritional quality. Dried or ensiled leaves of cassava and sweet potato were
identified to be a valuable source of protein (Lindberg et al., 2000b; Ogle et al., 2005;
Ly et al., 2010; 2011). The use of trees, shrub leaves (Ly et al., 2001) and aquatic
plants (Ly et al., 2002) receives only little attention in the tropics, their tremendous
yield and chemical composition could be of better use (Table 1).
Table 1: Chemical composition of the leaves of selected trees, shrubs and aquatic plants
DM OM NDF N
(%) (% DM)
Multifunctional
trees
and
shrubs
Acacia auriculiformis 40.8 93.4 68.0 2.73
Flemingia macrophylla 41.8 94.1 73.0 3.19
Gliricida sepium 27.1 93.0 59.1 3.27
Leucaena leucocephala 43.5 93.1 66.0 3.09
Morus alba 33.3 86.3 31.5 3.54
Trichanthera gigantea 26.3 85.4 50.8 3.46
Aquatic plants
Azolla pinnata 6.8 82.9 42.8 4.50
Pistia stratiotes 6.8 78.6 47.3 5.54
Spirodella polyrhiza 4.7 90.5 58.2 4.57
adapted from Ly et al. (2001; 2002); DM, dry matter; OM, organic matter; N, nitrogen; NDF, neutral detergent fiber
Literature review
6
Animal manures as feedstuffs are especially attractive, as feed costs are reduced
and a partial solution for the manure management and the environmental pollution is
provided. Cattle manure silages have been included in pig rations to cover part of the
requirements in molasses and maize-based diets (Diaz & Elias, 1976; Diaz et al.,
1979). Cattle manure is rich in so called “growth promoting factors” including
undigested food, vitamin B complex, essential amino acids and certain hormonal
remains. However, its economic value as a feedstuff is much lower than its value as
a fertilizer (Martin Jr et al., 1983). The demand for biogas substrates reduces even
more its chances to be used as animal feedstuff.
Alternative feedstuffs in general have lower nutrient concentrations than conventional
ones. The protein is of low biological quality, which requires supplementation of high
concentrated N sources and essential amino acids, which are cost-intensive.
Furthermore, alternative feedstuffs often have a high moisture content, which makes
them difficult to store for long periods, as drying causes extra costs. Grains of
underutilized tropical legumes overcome those drawbacks. They have an acceptable
nutritional composition and their dry matter content offers the possibility to conserve
them for longer periods of time.
2.2 The production of Jack bean, cowpea and sorghum grains in the
tropics
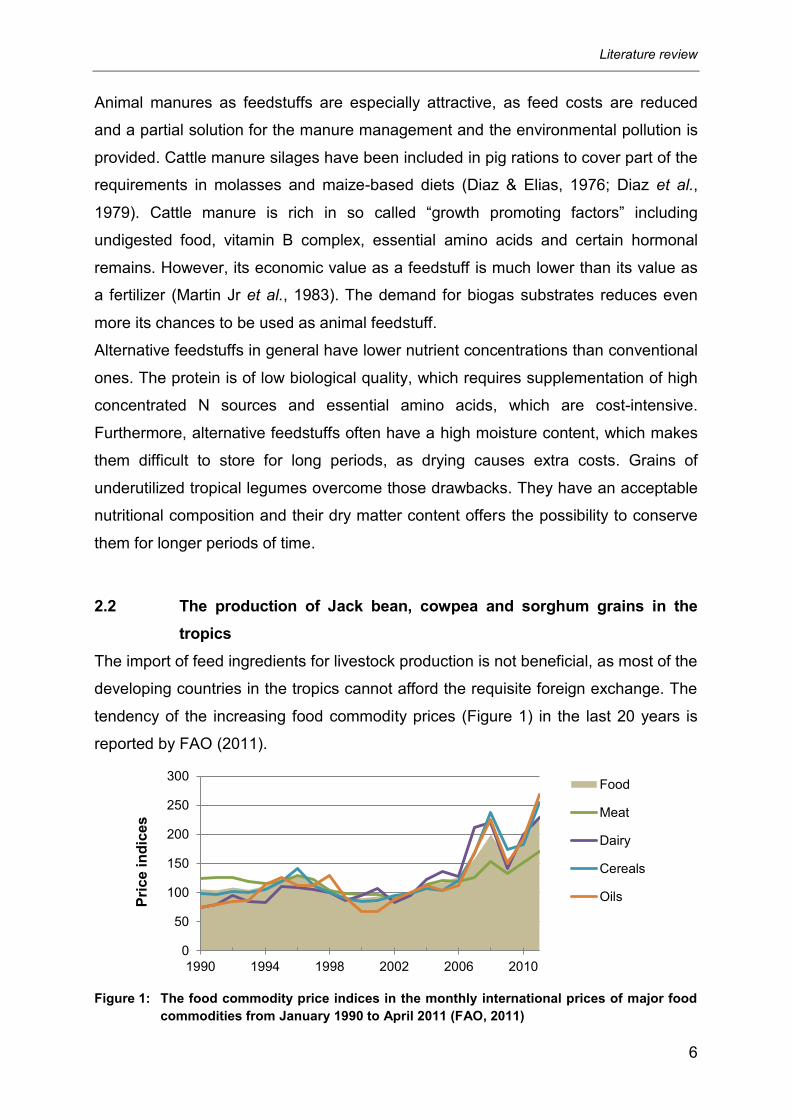
The import of feed ingredients for livestock production is not beneficial, as most of the
developing countries in the tropics cannot afford the requisite foreign exchange. The
tendency of the increasing food commodity prices (Figure 1) in the last 20 years is
reported by FAO (2011).
Figure 1: The food commodity price indices in the monthly international prices of major food
commodities from January 1990 to April 2011 (FAO, 2011)
0
50
100
150
200
250
300
1990 1994 1998 2002 2006 2010
Pri
ce in
dic
es
Food
Meat
Dairy
Cereals
Oils

Literature review
7
Mainly in developing countries, there is an interest in new food sources, especially
those ones rich in protein. The prevailing attitudes to the environment´s protection
and to a sustainable agriculture also favor the production of legumes (Deshpande &
Damodaran, 1990; Lambert & Fenwick, 1991). Moreover, due to symbiotic abilities
they play an important role in colonizing disturbed ecosystems (Arianoutsou &
Thanos, 1996; Smil, 1999).
Legumes have been included in the diets of animals and humans since their
cultivation (Graham & Vance, 2003). There are evidences that bean (Phaseolus
vulgaris) and soybean (Glycine max) were each domesticated more than 3000 years
ago in America and Asia, respectively (Hymowitz & Singh, 1987; Kaplan & Lynch,
1999). Unfortunately, the improvement of legume crop yields has not kept pace with
that of cereals. FAO (2010c) noted, that the world yield of cereals increased by
150 kg·ha-1 between 1999 and 2008 with the exception of the last recorded period
(2008-2009), where no increase was observed. The world legume yield per hectare
and year did not increase between 1999 and 2007 and only by 30 kg·ha-1 in the
period from 2007 to 2009. Partially, this difference is due to the unfavorable
environmental conditions under which many legume species are grown, as they are
often cropped after corn or rice at the end of the growing season (Graham & Vance,
2003) without an adequate agro-technical support (fertilizers, irrigation, pesticides,
herbicides, fuel or machinery). As a consequence, grains and their byproducts are
limited and expensive as they are the main source of nitrogen in the diet of animals
and humans.
The exploitation of neglected novel legumes abounding in the tropical region seems a
viable option to ease the current pressure on the conventional legumes (Cáceres et
al., 1995; Udedibie & Carlini, 1998b). Unfortunately, they don´t receive the same
attention by science and are not included in the pig feeding systems like the
conventional ones (Figueroa, 2003).
Originated in the New World (Sauer, 1964), Jack bean (Canavalia ensiformis [L.]
DC), as well known as Riesenbohne, Haba de Caballo or Pois sabre (Legel, 1984),
has been identified as a legume adaptable to a wide range of agronomic and climatic
conditions with a high potential for exploitation as a source of protein and energy for
livestock (Arora, 1995; Cáceres et al., 1995; Akpapunam & SefaDedeh, 1997a;
Sridhar & Seena, 2006).

Literature review
8
The plant is characterized by a vegetative cycle of 170 - 240 days, a fast germination
(2 - 3 days), 60 - 100 cm height and taproots. It is able to grow up to 900 m.a.s.l. and
it tolerates drought, shadow and moderate floods (Morris, 2007). Poor soil conditions
(low phosphorus contents and a pH between 4.3 and 8.0) are accepted due to the
colonization of mycorrhiza and rhizobia (Udedibie & Carlini, 1998b). Yields have been
reported between 0.5 and 6.0 t·ha-1 (Bressani et al., 1987; Kessler, 1990; PROSEA,
1992; Carlini & Udedibie, 1997) in close relation with the region and the experimental
conditions. Sridhar & Seena (2006) compiled from data of several authors an
overview of the chemical composition of Jack bean raw flour (Table 2).
Table 2: Chemical composition of raw Jack bean seeds (Canavalia ensiformis [L.] DC)
Component Content
Dry matter (%) 86.5 - 96.2
Crude protein
(% DM)
22.8 - 35.3
True protein 24.2 - 28.2
Albumins 7.8 - 8.6
Globulins 13.0 - 14.6
Prolamins 0.6 - 0.9
Glutelins 1.8 - 2.0
Ether extract 1.6 - 12.1
Crude fiber 4.7 - 11.4
Ash 2.3 - 5.8
Total starch 24.7 - 36.9
Digestible starch 26.1
Resistant starch1 10.8
Nitrogen free extract 45.8 - 65.4
Gross energy (MJ kg·DM-1
) 14.7 - 19.1
according to Sridhar & Seena (2006) 1Resistant starch content is calculated as total starch minus digestible starch.
Cowpea (Vigna unguiculata [L.] Walp), also known as blackeye bean and southern
pea (Uzogara & Ofuya, 1992); caupí, caritas, fríjol in Venezuela; Augenbohne or
Kuhbohne in Germany (Cook et al., 2005), is one of the most important food legumes
in the tropic and sub-tropic regions, where drought is a major production constraint
due to low and erratic rainfall (Singh et al., 1997). As much as 1 t·ha-1 of dry grain
was produced in a Sahelian environment with only 181 mm of rainfall and a high
evaporative demand (Ehlers & Hall, 1997). Cowpea is a warm-season crop well
adapted to many areas of the humid tropics and temperate zones. It is tolerant to

Literature review
9
shadow, heat and drought, but intolerant to frost (Ehlers & Hall, 1997; Singh et al.,
1997). Germination is rapid at temperatures above 18 °C and growing ranges
between 0 and 1500 m.a.s.l.. Cowpea has the capacity to fix nitrogen in soils with
adverse conditions like low dry matter contents, a pH range of 4.5 to 9.0, low
contents of organic matter (< 0.2 %) and sand contents over 85 % (Uzogara & Ofuya,
1992; Singh et al., 1997; Sprent et al., 2010). Yields are reported between 0.3 and
4.0 t·ha-1 (Cook et al., 2005). Sarmiento et al. (2011) refer to a range between 1.5
and 2.5 t·ha-1 and for the variety INIFAT 93 a yield of 1.05 to 1.25 t·ha-1 was reported
in Cuba (Diaz et al., 2000). Not only its resistance to extreme environments, but as
well its nutrient composition makes cowpea a potential source for animal feeding
(Makinde et al., 1996a; Makinde et al., 1996b; Erlwanger et al., 1999; Castro et al.,
2002b; Ibrahim et al., 2002; Diaz et al., 2003; Sarmiento et al., 2011). Selected
parameters of the nutritional value of cowpea are given in Table 3.
Table 3: Chemical composition of raw cowpea seeds (Vigna unguiculata [L.] Walp)
Component Content
Dry matter (%) 87.7 - 94.3
Crude protein
(% DM)
22.0 - 26.7
True protein* 23.4 - 24.0
Ether extract 1.0 - 2.5
Crude fiber 5.6 - 7.8
Ash 2.6 - 4.3
Nitrogen free extract 33.1 - 60.0
Gross energy (MJ kg·DM-1) 13.5 - 14.1
Source: Bressani (1985); PROSEA (1992); Uzogara & Ofuya (1992); León et al. (1993); Souci et al. (2000);
Castro et al. (2002b); Diaz et al. (2003); Frota et al. (2008); USDA (2010)
*Values of true protein not necessarily correspond to the range of crude protein reported.
Despite its potential, the world production of cowpea is meager. In 2009, 5.7 million t
were produced, which is considerably low compared to soybeans with 223.2 million t
(FAO, 2010a).
Nowadays, high prices are not only associated to legumes but as well to cereals (see
Figure 1). Substituting conventional cereals for native alternatives in rations for pigs
is a topic being considered by sustainable feeding systems in developing countries.

Literature review
10
Sorghum (Sorghum bicolor [L.] Moench), a major cereal in the world behind rice,
wheat, corn and barley, is a staple food for humans in the semi-arid tropics of Africa,
Asia and Latin America (ICRISAT, 2004). It has the ability to cope with many types of
stresses, including heat, salinity and water logging (Ejeta & Knoll, 2007).
Furthermore, it is considered as a model species for drought tolerance due to its
inherent drought tolerant characteristics (Ali et al., 2009; Pérez et al., 2010; Rajarajan
& Ganesamurthy, 2011). Primarily it is a crop of hot, semi-arid tropical environments
with only 400 - 600 mm rainfall, which are too dry for corn.
Due to its favorable chemical composition (Table 4), sorghum grains have been
evaluated with good results as a substitute for conventional cereals in diets for pigs
(Myer et al., 1985; Myer & Gorbet, 1994; Myer & Gorbet, 2004; Nyannor et al., 2007;
Benz et al., 2011), broilers and laying hens (Jacob et al., 1996; Castro, 1999; Ambula
et al., 2003; Barcellos et al., 2006; Dominguez et al., 2009), dairy and beef cattle
(Mitzner et al., 1994; Santos et al., 1997; Chiou et al., 1999; Theurer et al., 1999;
Menezes et al., 2009) and horses (Al Jassim, 2006; Gobesso et al., 2008; Gollcher et
al., 2010).
Table 4: Chemical composition of sorghum seeds (Sorghum bicolor [L.] Moench)
Component Content
Dry matter (%) 89.4
Crude protein
(% DM)
9.4
Ether extract 3.4
Crude fiber 2.1
Ash 1.6
NDFOM 10.6
ADFOM 4.9
ADLOM 0.4
Starch 70.1
Gross energy (MJ kg·DM-1) 16.2
Source: NRC (2012)
According to FAOSTAT (2010a), sorghum reached a world production quantity of
62.1 million t with an average yield of 1.4 t·ha-1 in 2009. Africa and America are the
first world producer regions (Figure 2), whereas the United States is the first world
producer country. Currently, the world production of sorghum is irrelevant compared
to corn and wheat, with 682 and 817 million t in 2009, respectively.

Literature review
11
Figure 2: World production of sorghum grains between 2000 and 2009 (FAOSTAT, 2010a)
Despite their nutritional value and adaptability potential, Jack bean, cowpea and
sorghum are not commonly used as a feed or cultivated in the same proportion than
other seeds. Among various reasons, those grains are well known to contain anti-
nutritional factors (ANF) and toxic compounds able to induce adverse effects in farm
animals. Hence, their use in diets is limited, mainly for non-ruminants.
2.3 Anti-nutritional factors in Jack bean, cowpea and sorghum grains
Plants protect themselves against pests and predators, which is associated with the
action of certain substances that have a proved harmful effect on animals and
humans. These compounds are able to produce a violent and immediate reaction or,
more commonly, a subtle effect is manifested after a persistent ingestion. The
resulting low palatability of the plants and the reduction of the digestive efficiency
have a negative impact on the animal´s performance, leading to death in the worst
case. Since their discovery, these defensive mechanisms are known as anti-
nutritional factors (ANF). However, as recently the effects of ANF have been
described not only as negative, but as well positive or both (Champ, 2002; Jamroz &
Kubizna, 2008), the terms ‘secondary plant metabolites’ or ‘bioactive substances’
considering their impact on health, are preferred (Champ, 2002; Makkar et al., 2007;
Jezierny et al., 2010). Nevertheless, the term ‘ANF’ will be used in the present work.
0
5
10
15
20
25
30
Millio
n t
Africa
America
Asia
Europa
Oceania

Literature review
12
2.3.1 Main anti-nutritional factors in Jack bean, cowpea and sorghum grains
and their impact on animal physiology
The incorporation of alternative feedstuff sources in animal nutrition mandatory
involves an increased occurrence of ANF, as these substances are found in a wide
range of tropical plants. The main ANF with a proved negative effect on animal
performance can be divided in the groups of protease inhibitors, lectins or
phytohaemagglutinins, amylase inhibitors, non-protein amino acids, phenolic
compounds, glycosides, alkaloids, non-starch polysaccharides and others like e.g.
phytic acid or gossypol (Champ, 2002; Jezierny et al., 2010). With an improvement of
analytical methods it might be possible that more substances will be included.
Jack bean stands out by its content of mainly concanavalin A, canavanine, trypsin
inhibitors, cyanogenic glycosides, polyphenols and saponins (Akpapunam &
SefaDedeh, 1997a; b; Sridhar & Seena, 2006). In cowpea, the most prominent ANF
are lectins, trypsin inhibitors, cyanogenic glycosides and tannins, although only
moderate levels of these substances are present (Prinyawiwatkul et al., 1996b;
Olivera-Castillo et al., 2007). Sorghum grains are well known to contain variable
quantities of tannins (Brandon et al., 1982; Saura-Calixto et al., 2009; Ojeda et al.,
2010) as well as phytic acid (Ojeda et al., 2010) and non-starch polysaccharides
(Verbruggen et al., 1993; Castro et al., 2002a; Muralikrishna & Rao, 2007) depending
on the cultivar. In the following, a description of the most common ANF in the
evaluated grains will be given.
CONCANAVALIN-A (CON-A)
Concanavalin-A (Con-A) is the plant lectin most studied and was first isolated and
crystallized by Summer & Howell (1936). Although lectins can be found in animals
like jellyfish, Nemopilema nomurai (Imamichi & Yokoyama, 2010), in the coelomic
fluid of sea cucumber, Holothuria scabra (Gowda et al., 2008) and in the heart tissue
of buffalo, Bubalus bubalis (Ashraf et al., 2010), they occur in abundance mainly in
the seeds of legumes, whereas Jack bean is the natural source of Con-A (Carlini et
al., 1988; Udedibie & Carlini, 1998b). Lectins are proteins respectively glycoproteins,
which have at least one non-catalytic domain that exhibits reversible binding to
specific monosaccharides or oligosaccharides (Sze & Tzi, 2011). They can interact
as well with proteins, membranes and other molecules to influence plant cell
morphogenesis and nodule development (Brewin & Kardailsky, 1997) and play an

Literature review
13
important role in the nitrogen fixation. Bezrukova et al. (2011) indicated a close
relationship between lectins and the hormonal systems controlling cell division.
Like most of the ANF, lectins form a defense barrier against plagues and diseases.
Con-A has been reported to increase mortality in insects like e.g. Acyrthosiphon
pisum (Fitches et al., 2008), Aedes aegypti (Sa et al., 2009) and Myzus persicae
(Jaber et al., 2008). Its antifungal activity has been proved against Aspergillus flavus
(Baker et al., 2009), Microsporum canis (Pinheiro et al., 2009), Saccharomyces
cerevisiae, Colletotrichum musae and Fusarium oxysporum (Boleti et al., 2007).
Moreover, studies demonstrated the in vivo anti-tumor (Li et al., 2008; Zhang et al.,
2010) and antiviral (Keyaerts et al., 2007; Swanson et al., 2010) effects of lectins.
Due to their affinity to glycoproteins and carbohydrates they have been used to
isolate glycoproteins (Alvarez-Manilla et al., 2010), to obtain information about the
carbohydrate composition of samples (Pilobello & Mahal, 2007) and in the diagnosis
of parasite diseases (Yang et al., 2010).
Con-A accounts for 15 to 35 g·kg-1 DM of the Jack bean seed (Sharon & Lis, 1972;
Hague, 1975), representing about 20 % of the total protein in the grain (Dalkin &
Bowles, 1983). However, lectins have undesirable effects on farm animals, mainly
monogastrics, as they are mainly resistant to digestion (Pusztai et al., 1990; Udedibie
& Carlini, 1998b; Kelsall et al., 2002). Con-A is able to agglutinate the red blood cells
of chicken, guinea pigs, rabbits, sheep, rats and most of the human blood types
(Liener, 1974a; Carlini et al., 1988). It has also been reported to bind rat and human
nerve cells (Gulati et al., 1986). Presumably, the harmful effect is caused by the
ability to bind the membrane receptors of the epithelial cells of the small intestine. As
a result, changes may be induced in the structure of the absorptive epithelium
(microvilli lining), changing the surface of the small intestine, leading to an
interference with the absorption of nutrients (Liener, 1974b; 1997; Kunzelmann et al.,
2004). As well, Con-A is known to inhibit the activity of enzymes of the brush border
of the enterocytes and to interfere with the adherence of enterobacteria and the
intestinal wall (Carlini & Udedibie, 1997; Naughton et al., 2000). Therefore, it is
assumed that side effects on immune functions, the protein metabolism, enzyme
activities and hormonal regulations can occur (Herzig et al., 1997; Ovelgonne et al.,
2000; Kordas et al., 2001).
Literature review
14
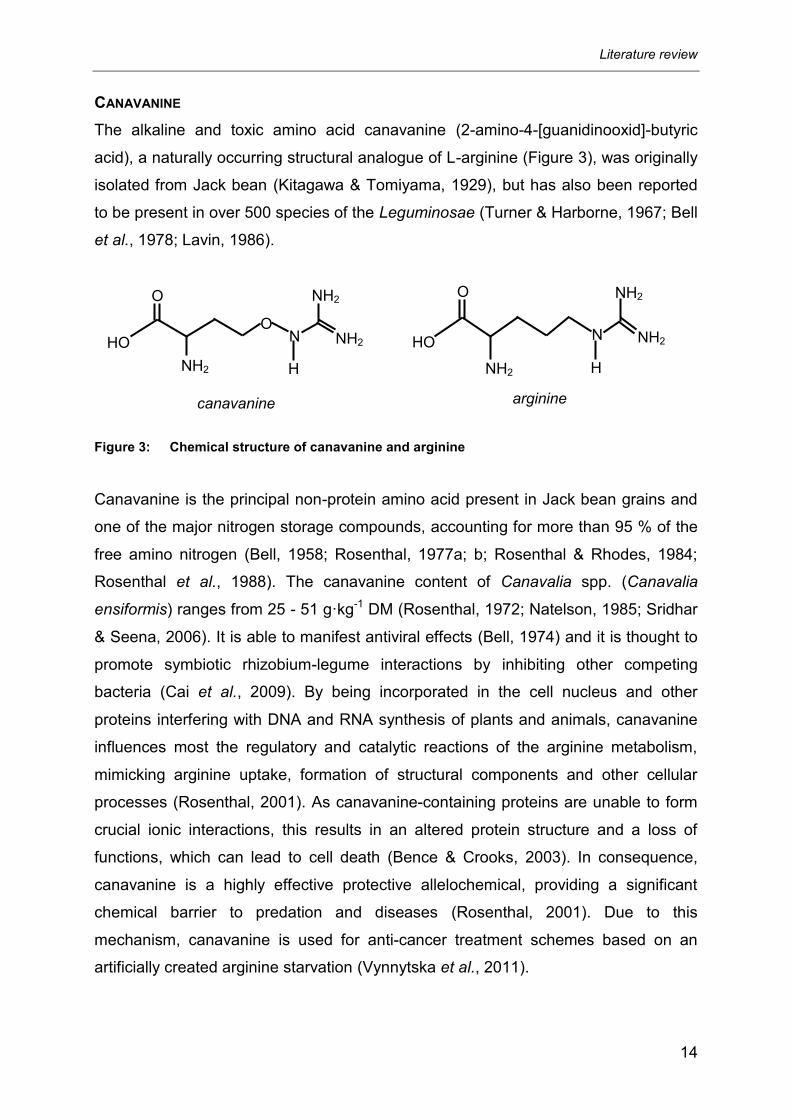
CANAVANINE
The alkaline and toxic amino acid canavanine (2-amino-4-[guanidinooxid]-butyric
acid), a naturally occurring structural analogue of L-arginine (Figure 3), was originally
isolated from Jack bean (Kitagawa & Tomiyama, 1929), but has also been reported
to be present in over 500 species of the Leguminosae (Turner & Harborne, 1967; Bell
et al., 1978; Lavin, 1986).
Figure 3: Chemical structure of canavanine and arginine
Canavanine is the principal non-protein amino acid present in Jack bean grains and
one of the major nitrogen storage compounds, accounting for more than 95 % of the
free amino nitrogen (Bell, 1958; Rosenthal, 1977a; b; Rosenthal & Rhodes, 1984;
Rosenthal et al., 1988). The canavanine content of Canavalia spp. (Canavalia
ensiformis) ranges from 25 - 51 g·kg-1 DM (Rosenthal, 1972; Natelson, 1985; Sridhar
& Seena, 2006). It is able to manifest antiviral effects (Bell, 1974) and it is thought to
promote symbiotic rhizobium-legume interactions by inhibiting other competing
bacteria (Cai et al., 2009). By being incorporated in the cell nucleus and other
proteins interfering with DNA and RNA synthesis of plants and animals, canavanine
influences most the regulatory and catalytic reactions of the arginine metabolism,
mimicking arginine uptake, formation of structural components and other cellular
processes (Rosenthal, 2001). As canavanine-containing proteins are unable to form
crucial ionic interactions, this results in an altered protein structure and a loss of
functions, which can lead to cell death (Bence & Crooks, 2003). In consequence,
canavanine is a highly effective protective allelochemical, providing a significant
chemical barrier to predation and diseases (Rosenthal, 2001). Due to this
mechanism, canavanine is used for anti-cancer treatment schemes based on an
artificially created arginine starvation (Vynnytska et al., 2011).
H NH2
NH2 O
HO NH2 N
arginine canavanine
H NH2
NH2 O
O
HO NH2 N

Literature review
15
The first reaction to canavanine-containing diets when fed to pigs is an intake
reduction (Enneking et al., 1993; Belmar & Morris, 1994b). Animal feeding trials
showed a number of deleterious effects following the consumption of legumes
containing canavanine. In chicken, decreased feed intake and growth and a
significant reduction in plasma concentration of basic amino acids was determined.
The L-canavanine as well reduced the intestinal absorption of amino acids sharing
similar transport systems throughout the brush border membrane vesicles (Herzberg
et al., 1971; Rueda et al., 2003). Although evidence of its toxicity to mammals in vivo
is limited, some canavanine fed animals showed abnormalities similar to those seen
in the human systemic lupus erythematosus, an autoimmune disease that adversely
affects the kidneys and the skin (Bell, 2003). This syndrome was provoked as well in
monkeys fed alfalfa sprouts (Bardana et al., 1982; Malinow et al., 1982) and in
humans after long ingestions of alfalfa tablets (Roberts & Hayashi, 1983).
TRYPSIN INHIBITORS
The existence of protease inhibitors in plants is known since 1938. They are widely
spread throughout the plant kingdom, but especially occur in the Leguminosae,
Gramineae and Solanaceae (Richardson, 1977). However, as protease inhibitors are
abundant in legumes, they are the most studied species (Udedibie & Carlini, 1998b).
The trypsin inhibitor was first described in Jack bean by Orru & Demel (1941) and
later confirmed by Borchers & Ackerson (1950), whereas in cowpea it was first
reported by Borchers & Ackerson (1947) and later by Jaffe (1950). Sorghum was as
well thought to contain trypsin inhibitors (Filho, 1974; Mulimani & Vadiraj, 1991).
However, the influence on the protein digestion is supposed to be caused rather by
the action of tannins (Loomis & Battaile, 1966; Anderson, 1968; Los & Podsédek,
2004). Studies verified the presence of two kinds of cowpea protease inhibitors,
namely trypsin inhibitors and trypsin-chymotrypsin inhibitors (Gennis & Cantor, 1976;
Gatehouse et al., 1980), which later were renamed Kunitz and Bowman-Birk family,
respectively.
In addition to their role of regulating proteolytic activities, protease inhibitors protect
fluids or tissues from degradation by unwanted or foreign proteolytic activities
(Neurath, 1984). In plants, they occur particularly in storage tissues such as seeds or
tubers. Those parts might act as depot or safe storage forms of protein, which are
immune to digestion until required during germination or sprouting (Richardson,

Literature review
16
1981). However, the increase in endopeptidase in the storage tissues during seed
germination cannot be accounted for by the inactivation of an "equivalent amount" of
inhibitors (Chrispeels & Baumgartner, 1978).
The trypsin inhibitors themselves contribute to the exceptional nutritional value of
legumes. In the total protein of Lima and Navy bean for example, it represents
approximately 32 and 40 % of the total cystine, respectively (Kakade et al., 1969),
although the assumption that they are a source of protein used during germination
has to be questioned. For instance, while the content of trypsin inhibitors decreased
during germination of Jack bean (Akpapunam & SefaDedeh, 1997b), no decline was
determined for 10 days of germination in Phaseolus vulgaris (Nielsen & Liener,
1988), or even trypsin inhibitors were found to increase (Richardson, 1981; Savelkoul
et al., 1992). Besides, there is consensus about their capacity to target multiple
digestive enzymes of predators and pathogens (Richardson, 1981; Ryan, 1990).
The inhibitors of the serine proteases (trypsin and chymotrypsin) found in plant
feedstuffs are the most studied (Belitz & Weder, 1990). They are polypeptides which
form well-characterized stable complexes with trypsin and chymotrypsin on a one-to-
one molar ratio, obstructing their binding sites and disrupting their enzymatic action
(Udedibie & Carlini, 1998b). Inactivation of trypsin in the gut by trypsin inhibitors from
soybeans induced the intestinal mucosa releasing cholecystokinin (CCK). This
hormone stimulates the pancreatic acinar cells to produce more trypsin,
chymotrypsin, elastase and amylase. When this negative feedback continues, an
important loss of S-containing amino acids is created, leading to growth reduction,
pancreatic hypertrophy/hyperplasia and carcinogenic effects (Liener, 1976; Savelkoul
et al., 1992). Grant et al. (1995) found that rats fed a soybean or cowpea based diet,
showed an extensive increase in the relative and absolute weights of the pancreas
and an increase in the incidence of macroscopic pancreatic nodules and possible
pancreatic neoplasia. However, the negative feedback through CCK does not seem
to be the only mechanism by which pancreatic proteases secretion is controlled.
Pusztai et al. (1997) proved that soybean inhibitors remained effective in stimulating
pancreatic secretion after elimination of their inhibitory activity by complex formation.
HYDROGEN CYANIDE
The cyanogenic glycosides (CG) are glycosides of -hydroxy nitriles. All known
compounds are -linked, mostly with D-glucose (Poulton, 1990; Vetter, 2000). Most

Literature review
17
CG derive from the five hydrophobic protein amino acids tyrosine, phenylalanine,
valine, leucine and isoleucine (Poulton, 1990). The CG are not toxic themselves, but
due to an enzymatic or acid hydrolysis hydrogen cyanide (HCN) is liberated (Makkar
et al., 2007), so that free HCN is not found in intact plant cells. The enzymatic
reaction starts by splitting off the carbohydrate part by one or more -glycosidases
(pH 4.0 - 6.2), after which the corresponding cyanohydrins are formed. This
intermediate may decompose either spontaneously or enzymatically in the presence
of an -hydroxy nitrile lyase (pH 5.0 - 6.5) to release HCN and an aldehyde or ketone
(Figure 4). The non-enzymatical decomposition proceeds rapidly at alkaline pH, but is
negligible below pH 5.5 (Poulton, 1990). Vetter (2000) found this to be possible in a
wider range of pH ( 4) and temperatures ( 35 ºC).
N C C O
R
H
sugar1-O-sugar
2
ß-GlycosidaseN C C
R
H
OHHydroxynitrile
Lyasesugar
1 -O- sugar
2 NCH
Cyanogenic Disaccharide
+
-Hydroxynitrile
C O
H
R
N C C O
R
H
sugar1
Cyanogenic Monosaccharide
sugar2
ß-Glycosidase
ß-Glycosidasesugar1
II
II
I
Figure 4: Simultaneous (I) and sequential (II) mechanisms for the catabolism of cyanogenic
disaccharides (Poulton, 1990)
The hydrolysis of CG occurs at a significant rate only after tissues have been
disrupted by animal mastication, fungal attack or mechanic destruction. It is
postulated that CG represent a defense barrier against predators (Poulton, 1990;
Vetter, 2000) or might serve as nitrogen storage compounds (Selmar et al., 1988;
Selmar et al., 1990). As well, their role as a promoter for pre-germination has been
confirmed by Maruyama et al. (1996).
Hydrogen cyanide primarily involves the inhibition of cytochrome-c-oxidase (Panda &
Robinson, 1995), a vital enzyme in the tricarboxylic acid cycle, blockading the aerobic
synthesis of ATP (Egekeze & Oehme, 1979; Younes & Strubelt, 1988; Laurena et al.,
1994; Makkar et al., 2007). The toxicity symptoms of ingested HCN are peripheral
Literature review
18
numbness and light-headedness followed by mental confusion and stupor, cyanosis,
twitching and convulsion with terminal coma. The HCN can be converted into
thiocyanate (Sorbo, 1953), which induces the formation of nitrosamine, a proven
carcinogen (Makkar et al., 2007).
Monogastric animals are less susceptible to HCN intoxication than ruminants, as a
high rumen pH and microorganisms accelerate cyanogenesis. Because of a bitter
taste, rejection by animals is the first reaction when fed legume grains rich in CG
(Makkar et al., 2007). Betancur-Ancona et al. (2008) evaluated HCN in seeds of
Canavalia ensiformis and determined contents of 159 mg·kg-1 DM. They assumed
that the different contents found by Bernal & Jiménez (1990) and Linder (1995) with
110 mg·kg-1 and 20 g·kg-1 DM, respectively, could be attributed to the cultivar.
Sridhar & Seena (2006) stated a range of HCN between 0 and 112 mg·kg-1 DM.
Cowpea seeds contain HCN from 4.8 to 6.0 g·kg-1 DM, reported by Umoren et al.
(1997) after evaluation of raw grains of four varieties. Onwuka (2006) found lower
contents (83.8 mg·kg-1) and Olivera-Castillo et al. (2007) did not detect any amount
of HCN. Like in the case of Jack bean, this could be related to the cultivar, the crop’s
location or the environmental conditions. In dry sorghum grains undetectable or low
amounts (1 to 29 mg·kg-1) of dhurrin were found, a cyonagenic glycoside which
results in HCN. However, dhurrin can be drastically increased during sprouting
(Panasiuk & Bills, 1984; Ahmed et al., 1996).
TANNINS
Tannins are polyphenolic water soluble compounds with molecular weights between
500 and 3000 Da (Perezmaldonado et al., 1995; Santos-Buelga & Scalbert, 2000; Li
et al., 2006; Saura-Calixto et al., 2009). They can be divided into two major groups:
hydrolysable and condensed tannins (Makkar et al., 2007; Saura-Calixto et al., 2009).
Hydrolysable tannins are esters of phenolic acids, either gallic acid (gallotannins) or
hexahydroxydiphenic acid (ellagitannins), and a polyol, which is usually -D-glucose
or quinic acid as presented in Figure 5 (Salminen et al., 1999; Clifford & Scalbert,
2000; Santos-Buelga & Scalbert, 2000). Gallotannins are easily degraded by
bacteria, fungi and yeasts, while ellagitannins are more difficult to be degraded by
microorganisms, due to their complex structures with additional C–C bonding (Li et
al., 2006).

Literature review
19
Figure 5: Structures of pentagalloylglucopyranose (A, gallotannin) and trigalloyl-HHDP-
glucopyranose (B, ellagitannin) (Salminen et al., 1999)
Condensed tannins (CT, Proanthocyanidins) are polymers made of elementary
flavan-3-ol units that are linked by C-C and occasionally C-O-C bondings (Santos-
Buelga & Scalbert, 2000). The flavan-3-ols are dominated mainly by the catechins
and gallocatechins, which may also exist as gallate esters of the C-3-hydroxy group
(Bors et al., 2001). In Figure 6 the basic form of CT is presented. A key feature of
proanthocyanidins is that they are transferred to anthocyanidins upon heating in
acidic media (Santos-Buelga & Scalbert, 2000).
Figure 6: Basic structure of proanthocyanidins. R1=H, R2=H: propelargonidins; R1=H, R2=OH:
procyanidins; R1=OH, R2=OH: prodelphinidins (Santos-Buelga & Scalbert (2000))
Tannins form complexes with proteins (e.g. enzymes, hormones, toxins) by covalent,
hydrogen and ionic bonding (Mitaru et al., 1984). This is an essentially dynamic
surface phenomenon and generally reversible, which basically involves proteins that
possess an open, random coil type conformation and whose principal forces are

Literature review
20
hydrophobic effects (Santos-Buelga & Scalbert, 2000). These interactions are similar
to antigen-antibody interactions in that a binding agent and ligand of comparable
sizes associate multivalently to form soluble and insoluble complexes (Hagerman &
Butler, 1981).
The affinity of proline-rich proteins (PRP) and histatins with tannins is considered as
the first defensive animal reaction to minimize the adverse effects of tannins after
ingestion. Furthermore, the tannin-PRP complex is assumed to resist endogenous or
microbial enzyme attack in the digestive tract (Robbins et al., 1987). Kamphues et al.
(2010) described an adaptation of pigs to counteract the effects of tannins by
increasing size, mass and proline content of parotid glands after 7 days of consuming
diets with high tannin content. However, when the capacity of the defensive barrier is
exceeded, digestibility of amino acids can be severely affected and the endogenous
protein losses increase (Jansman, 1993; Steendam et al., 2004; Myrie et al., 2008).
The intensity of interaction between tannins and proteins is determined by the nature
of both, being the relative ratio of tannins and protein in solution and physical and
chemical conditions such as type of medium, temperature, pH value, ionic strength
and incubation time (Hagerman & Butler, 1989). As well, the higher the
polymerization of tannins, the lower the affinity with proteins (Santos-Buelga &
Scalbert, 2000).
Tannins can form complexes as well with starch, inhibiting -amylase attack
(Deshpande & Salunkhe, 1982), although they are known to bind directly -amylase,
too, reducing its activity (Yan & Bennick, 1995; Santos-Buelga & Scalbert, 2000).
Having o-dihydroxyphenyl groups, CT are excellent chelators of Fe (III) (Santos-
Buelga & Scalbert, 2000) and they also form complexes with Al (III) and Cu (II)
(Kennedy & Powell, 1985; Kipton et al., 1987).
According to Jansman (1993), the bitter or astringent taste produced by tannins is
associated with the precipitation of mucoproteins or a direct binding of taste
receptors, which reduces palatability and hence negatively affects the voluntary feed
intake. Moreover, tannins provoke necrotic effects on the gastric mucosa and
glandular atrophy. When absorbed, tannins cause kidney and liver failure, leading to
the death of the animal (Jansman, 1993; Makkar et al., 2007).
Most of the tannins are found in the seed’s coat (Reddy et al., 1985; Adebooye &
Singh, 2007; Han et al., 2009), which underlines their role as a first defense barrier
against predators and microorganisms. In the grains of Jack bean, cowpea and
Literature review
21
sorghum they are present in different amounts. Sridhar & Seena (2006) stated in
Jack bean seeds contents of tannins from 0 to 900 mg·100 g-1·DM and of total
phenols from 730 to 1818 mg·100 g-1 DM, whereas condensed tannins were not
found. Ibrahim et al. (2002) evaluated the effect of fermentation, soaking and pre-
germination on cowpea and determined 210 mg·100 g-1 DM tannins in the raw grains
using the Folin-Denis reagent method. Onwuka (2006) on the contrary reported
higher quantities (3.42 g·100 g-1 DM) in cowpea using the same method.
Like in Jack bean and cowpea, the tannin content in sorghum grains depends on the
cultivar (Reddy & Pierson, 1994). Elmaki et al. (1999) classified them in low (0.32 %
of DM) and high (1.44 % of DM) tannin containing cultivars in order to test different
methods for deactivation. Ahmed et al. (1996) showed a variation of 220 to
410 mg·100 g-1 DM in three cultivars. Castro et al. (2002a) found a similar variability,
when determining tannins with a range of 0.04 to 1.99 % of DM in four Cuban
sorghum varieties.
2.3.2 Deactivation of anti-nutritional factors
Numerous attempts have been made to decrease the negative effects of ANF in
feedstuffs. Among them, soaking, peeling, boiling, germination, fermentation,
expansion and toasting are the most recurrent methods described in literature. None
of these techniques is new and some are used already for thousands of years.
However, nowadays the knowledge is provided to understand how those methods
work and how they can be optimized (Hill, 1998). Even when highly developed
methods for the deactivation of ANF (e.g. the application of microwaves and
irradiation) are used at present, none of them provide the definitive solution so far.
For selecting an adequate deactivation method, the following points should be
considered:
Different chemical structures of ANF produce differences in their chemical and
physical properties as consequence
Different ANF may appear at the same time in one feedstuff
Deactivation methods might reduce some ANF, but drastically increase others
The final product after deactivation might be as harmful as the not treated one or
even more

Literature review
22
Deactivation methods transform as well other nutrients in the feedstuff, which in
some cases is not desired
ANF play important roles in the seed´s physiology and its defense against predators
The quality of the deactivated product (physical and chemical characteristics,
palatability, etc.) has to be in accordance with the requirements of the animal
species to be fed
Most of the commonly used deactivation technologies are expensive and high
energy consuming
Among the deactivation methods, those ones involving the use of high temperatures
(cooking, roasting, autoclaving, extruding, etc.) have been widely applied. They
deactivate most ANF by denaturation. Adebooye & Singh (2007) studied cooking of
whole cowpea grains, which reduced the total phenol content. When the seeds were
previously decorticated, the result was improved by 10 %.
Combining different deactivation methods achieves the best results. Onwuka (2006)
reported about the advantage combining soaking and boiling. Soaking for 12 h
followed by boiling for 80 min reduced trypsin inhibitor activity from 25.6 to
3.2 TIU·mg-1 DM in vegetable cowpea. Further reductions were observed for
haemagglutinin (from 49.5 to 9.5 HU·mg-1 DM), cyanogenic glycosides (from 83.8 to
5.1 mg·kg-1 DM), alkaloids (from 9.6 to 0.5 % DM) and tannins (from 3.4 to 1.3 %
DM). Ibrahim et al. (2002) proved that the combination of either pressure or pre-
germination with cooking was more effective than cooking alone in cowpea.
Pizzani et al. (2006) toasted Jack bean meal at 220 and 230 ºC (3 min) and at 240 ºC
(2 min) and reduced the original canavanine content by more than 90 %.
Nevertheless, the true metabolizable energy (TME) content of raw Jack bean was not
improved by toasting. No significant differences were found between TME of raw
Jack bean and toasted at 200, 220 and 230 ºC (3 min) or at 240 ºC (1 or 2 min),
whereas toasting Jack bean meal at 180 ºC (3 min) or 230 ºC (1 or 2 min)
significantly reduced TME. No haemagglutinating activity was detected in toasted
Jack beans, but Con-A binding to duodenal mucosa ranged from moderate to weak.
Reactive lysine and protein solubility was reduced as both, temperature and toasting
time, increased. The effect of extrusion in Jack bean was assessed by Zamora
(2003), who found increased digestibility values for protein (from 58 to 90 %) and
starch (38 to 53 %). Protease inhibitor activities (trypsin and chymotrypsin) and -

Literature review
23
amylase inhibitor activity were reduced by 95 % and no haemagglutinating activity
was detected. However, the canavanine content remained on the same level. By
cracking Jack bean grains before cooking, Udedibie & Carlini (1998a) completely
eliminated the haemagglutinating activity of the beans within 1 h of normal and
15 min of pressure cooking. When whole grains were used, 45 min of pressure
cooking inactivated Con-A, whereas it took at least 3 h with normal cooking (96 ºC).
Rackis et al. (1986) indicated that it is necessary to apply a minimum of
1200 J·g-1 DM to inactivate urease and 1670 J·g-1 DM to destroy 95 % of the trypsin
inhibitors in soybean. Nevertheless, during heating the availability of amino acids,
especially lysine and cystine, is affected due to their susceptibility to the Maillard
reaction (Parsons, 1996; Bruce et al., 2006), which also reduces the efficacy of
pancreatic and intestinal enzymes (Stein et al., 2008). The same author proved that
the loss of reactive lysine increased by the 25-fold when the samples were heated at
130 °C.
Due to its thermostability (melting point at 184 ºC), poor results have been obtained
using heat for deactivation of canavanine in Jack bean (Belmar et al., 1999; Sridhar &
Seena, 2006). According to Tepal et al. (1994) and Zamora (2003), extrusion at 110
resp. 155 ºC had no influence on the reduction of canavanine. Later studies
concluded that temperature has to be increased to reduce canavanine, but expected
that nutrients will be affected at the same time, which was proven by Michelangeli et
al. (2004b), who evaluated the ileal and fecal digestibility of various dietary
components of toasted Jack bean (194 ± 2 °C, 18 min) in pigs. The original
canavanine content of raw Jack bean was reduced by 95 % after toasting. However,
toasting of Jack bean grains as well reduced total amino acids and their digestibility
by approximately 50 %. Activity of haemagglutinins was not detected in toasted
grains, but NDFOM and ADFOM contents were markedly increased due to the toasting
procedure. The authors concluded, that even when ANF were reduced, the resulting
nutritional value of the toasted grains for growing pigs was rather low. In a second
experiment, the effect of feeding growing pigs with diets containing 20 % of Jack
bean, toasted under various conditions of temperature and time, was evaluated. Pig
performance varied depending on the toasting conditions, but only the diet with 20 %
Jack bean toasted at 194 ºC (18 min) showed no significant differences in feed intake
and weight gain compared with the control diet (Michelangeli et al., 2004a). The

Literature review
24
effect of heating on other ANF like e.g. tannins still has to be questioned (Jansman,
1993; Agbede & Aletor, 2005).
Other deactivation methods like germination, soaking and fermentation are
alternatives to be considered when the cost-intensive use of heat cannot be afforded.
Furthermore, those methods are assumed to improve the nutritional value of the
feedstuffs. Pre-germination of cowpea seeds for 24, 48, 72 and 96 h resulted in a
gradual decrease of the oligosaccharide content with pre-germination time while the
level of monosaccharides increased. Protein and energy content increased slightly,
while calcium and iron decreased with pre-germination and both ascorbic acid and
niacin increased significantly, while thiamine decreased significantly according to
Akinlosotu & Akinyele (1991). Ghavidel & Prakash (2007) observed that pre-
germination significantly increased protein, thiamin, in vitro iron and calcium
bioavailability and in vitro starch and protein digestibility of cowpea. Tannins were
reduced by 28 % in pre-germinated grains and by 47 % after dehulling. Soaking
cowpea seeds (24 h, 25 ºC) before milling resulted in a 20 % decrease of TIA
(Prinyawiwatkul et al., 1996a). Soaking (16 h) in bicarbonate solution remarkably
deactivated ANF, as TIA was reduced from 24 % to 16 % when soaked only in water.
The same effect was observed with oligosaccharides and phytic acid, but not with
tannins. Pre-germination is assumed to be effective in reducing all ANF including
tannins and for soaking was stated that the longer the soaking time, the higher the
reduction (Ibrahim et al., 2002). Depending on the soaking time (10, 20, 30 h) tannins
were reduced in a following pre-germination (72 h) in low and high tannin-containing
cultivars of sorghum (Elmaki et al., 1999).
Several species and genera of yeasts, molds or bacteria have been evaluated in
fermentation processes with legume seeds (Reddy & Pierson, 1994). Khattab &
Arntfield (2009) studied the effect of Saccharomyces cerevisiae when they fermented
two cowpea varieties for 24 h and found reduced contents of total phenols and
tannins. They assumed that this effect was attributed either to polyphenol oxidase or
to the microflora fermentation. Furthermore, fermentation resulted in a reduction of
TIA (38 - 47 %) and oligosaccharides (71 - 72 %), which they assumed was caused
by the secretion of hydrolytic enzymes by the yeast or the action of the naturally
present -galactosidase stimulated by the pH acidification.
During a spontaneously appearing fermentation by the native microflora of cowpea
grains a decrease of verbascose (80 %) and stachyose (6 %) was observed,
Literature review
25
whereas raffinose increased by 13 % as Akinyele & Akinlosotu (1991) reported.
Moreover, increases of sucrose (8 %), fructose (105 %), glucose and galactose
(56 %), as well as of thiamin, niacin, phosphorus, gross energy and protein were
determined. Prinyawiwatkul et al. (1996a) inoculated cowpea with a commercial
Rhizopus microsporus var. oligosporus starter culture and demonstrated an
increased nutritional quality of cowpea flour, including the absence of raffinose and
stachyose and increased B vitamin contents. However, a slight increase in TIA
occurred after 18 h of fermentation and TIA at 24 h was higher (514 mg·g-1 flour) than
that at 0 h (382 mg·g-1 flour). Ibrahim et al. (2002) used Rhizopus oligosporus and
Lactobacillus plantarum (DSM 20205) as inoculants and eliminated completely TIA
and oligosaccharides and reduced remarkably phytic acid, whereas tannins
noticeably increased. Egounlety & Aworh (2003) reported similar results for the same
ANF, except that tannins were not evaluated.
Belmar et al. (1999) reported in their review about the use of fermentation
respectively ensiling methods and their impact on the deactivation of ANF in Jack
bean. The “fermentation” with urea, dry or in solution (Carlini & Udedibie, 1997), has
been applied with good results in poultry feeding (Udedibie & Carlini, 1998b; Belmar
et al., 1999). It is considered that urea has a denaturing effect on thermostable ANF
(Udedibie et al., 1994), but so far it could not be clarified how urea improves the
nutritive value of Jack bean. Risso & Montilla (1992) did not find the same positive
effects using a similar proceeding with Jack bean for pig feeding.
2.4 Particularities of grain silages
Although the use of microorganisms to deactivate ANF in the fermentation process is
not a novelty, the effect of ensiling grains on ANF is not well documented.
The term “fermentation” refers to processes that obtain energy from the oxidation of
organic compounds such as carbohydrates, which use an endogenous electron
acceptor, which is usually an organic compound, but not oxygen. On the contrary, in
“respiration” electrons are donated to an exogenous electron acceptor, such as
oxygen, via an electron transport chain (Li, 2004; Prescott et al., 2004). However, the
generally accepted view is established in literature, that fermentation is any process
of chemical change in organic substrates through the action of microbial enzymes (Li,

Literature review
26
2004; Singleton & Sainsbury, 2006). Nevertheless, the strict biochemical definition of
fermentation is frequently overlooked.
Ensilage is a fermentation process itself, but with certain particularities that make it
unique compared to other forms of fermentations. McDonald et al. (1991) enounced
the principal once:
1. Anaerobic conditions have to be achieved.
2. Undesirable microorganisms (e.g. clostridia) have to be suppressed, promoting
those ones performing lactic acid fermentation.
The basic theory of ensilage is comprehensively described in literature (Woolford,
1984; McDonald et al., 1991; Buxton et al., 2003). Therefore, no details will be given
at this point.
Legumes are regarded as rather unsuitable for ensiling due to three main factors:
they have a high buffering capacity (BC), they tend to have low contents of water
soluble carbohydrates (WSC) and they are low in dry matter (DM) when used solely
as forages (McDonald et al., 1991). Although the DM content in grains of Jack bean
and cowpea is favorable, the high BC and low WSC content remain as limiting factors
for ensiling.
In the tropics, conservation of grains affronts difficulties due to the influence of a high
temperature and humidity, which promotes the development of fungus and undesired
bacteria, affecting the nutritional quality. Ensiling represents an alternative to
preserve the nutritional value of legume grains for animal feeding.
Ensiled grains can show significant contents of lactic acid as the result of microbial
activity, but lactic acid level is lower and pH is higher than in ensiled forages (Pieper
et al., 2010). The quality of fermentation is thereby determined by the level of
moisture, previous processing and ensiling of fresh or dried grains followed by
reconstitution (Buchanan-Smith et al., 2003). Corn silages with a moisture content of
275 g·kg-1 or more contained more lactic acid than the drier corn (Goodrich et al.,
1975). Similar results were obtained in silages of reconstituted sorghum (moisture
contents of 250, 300 or 350 g·kg-1), where lactic and acetic acid increased and pH
and ethanol decreased as moisture level increased. However, ammonia-N was lower
in a moisture level of 250 g·kg-1 (Huck et al., 1999). In practice, grains with moisture
content 250 g·kg-1 are usually more difficult to compact to produce the desired
anaerobic environment than moister grains. However, when grains contain a

Literature review
27
moisture 300 g·kg-1 their feeding value is affected. Under field conditions this
optimal moisture content corresponds to fully mature grains even before the
technological ripeness (Buchanan-Smith et al., 2003). In the case of Jack bean and
cowpea seeds the adequate moisture content to produce high quality silages still has
to be evaluated.
As a fermentative process, ensiling might offer several advantages over other
methods of feed processing and preservation. It is particularly useful for the
processing of hard legume seeds, improving digestibility through reducing bean
flatulence and the elimination of ANF, in particular trypsin inhibitors (Deshpande &
Salunkhe, 2000).
Fermentation of a cereal-legume mix is especially beneficial with respect to the
complementation of their amino acid content. The sulfur-containing amino acids
methionine and cysteine are often limiting in legumes, while cereal proteins are
generally deficient in lysine (Deshpande & Salunkhe, 2000). Therefore, combined
ensiling of cereal and legume grains can be seen as a possibility for harvesting and
preserving mature high moisture grains as an integral diet.
The main carbohydrate in cereals is starch, a polysaccharide not available for the
majority of lactic acid bacteria. To use cereals as an effective source of water soluble
carbohydrates, amylase or amylase-rich materials should be added to the mixed
silages (McDonald et al., 1991) or an alternative carbohydrate source like molasses
should be used. The latter has been proven to increase lactic acid and to reduce pH
and ammonia-N levels (Migwi et al., 2000; Van Man & Wiktorsson, 2002; Huisden et
al., 2009; Nkosi et al., 2009; Lima et al., 2010; Lima et al., 2011). On the other hand,
the role of plant enzymes involved in the hydrolysis of starch and hemicelluloses
releasing WSC (Muck, 1988) and the direct fermentation of amylolytic lactic acid
bacteria (LAB), among them L. plantarum, indicates that WSC addition is not always
mandatory to produce good quality silages. Reddy et al. (2008) showed the steps
how LAB can use starch (Figure 7).
Amylolytic lactic acid bacteria
Direct / single step fermentationLactic acidStarch
Figure 7: Scheme of lactic acid production from starch as substrate (Reddy et al., 2008)

Literature review
28
Homolactic bacteria are part of the epiphytic microflora of legumes. After a natural
fermentation of cowpea for 4 days at 25 ºC, Lactobacillus casei, Lactobacillus
leichmanii, Lactobacillus plantarum and Pediococcus pentosaceus were isolated
(Zamora & Fields, 1979). These bacteria are homofermentative, producing an entire
lactic acid fermentation, which would improve conservation of DM, reduce
solubilization of N and give greater aerobic stability at feed-out (Buchanan-Smith et
al., 2003). Contrary to classical believe, well fermented silages containing high
proportions of lactic acid in the total fermentation acids are prone to aerobic
instability. Indeed, silages with high concentrations of acetic and butyric acids are
associated with silages which are quite aerobically stable (Wilkinson & Davies, 2013).
The high DM content of grains seems to play a role in depressing epiphytic
lactic acid bacteria when low moisture fermentations take place. Thus, using
inoculants in silage is seen positive. Pieper et al. (2010) compared the effect of
inoculants in silages of reconstituted (250 g·moisture kg-1) wheat, barley and triticale
grains and obtained higher lactic acid contents and a lower pH than in not inoculated
ones. Sebastian et al. (1996) reported the same results with corn at a moisture
content of 220 g kg-1.
Task and aim
29
3 Task and aim
Although the potential of feed resources for pigs in the tropics is superior to that of
the temperate zone (Ly, 1993), animal feeding systems established by most of the
countries in this region, especially Cuba, are mainly based on soybean and cereals
like wheat or corn. Paradoxically, their availability is not in accordance with the
animal production demands. Therefore, they have to be imported with extra costs
and the risk of subordination to the world market in consequence.
Non-conventional feedstuffs like Jack bean and cowpea represent an alternative due
to their positive chemical composition, adaptability, resistance and low input
demands. However, their content of anti-nutritional factors still limits their inclusion in
pig rations. To overcome this problem, different deactivation methods have been
tested with variable results. Most of them involve high implementation costs and
energy consumes, which is difficult to afford for low-input farmers and furthermore is
environmentally questionable.
For a long time, fermentation has been used to process feedstuffs. Numerous
evidences demonstrate its influence on the improvement of the nutritional value of
feedstuffs (Belmar et al., 1999; Granito et al., 2002; Azeke et al., 2005; Nout & Kiers,
2005; Baik & Han, 2012; Muzquiz et al., 2012; Torino et al., 2013). Therefore, the
question arises, if silages of Jack bean and cowpea sole or mixed with sorghum
would not only conserve well, but produce the same positive effects on the nutritional
value of these feedstuffs. To answer this question the following hypothesis was
enunciated:
“It is possible to produce good quality silages of Jack bean and cowpea grains sole or
mixed with sorghum grains with their main anti-nutritional factors being reduced,
which increases their nutritional value as a feedstuff for growing-finishing pigs.”
The main objectives of the present study were formulated as follows:
1. Preparation of silages of Jack bean and cowpea grains sole or mixed with
sorghum grains, which have a high fermentation quality.
2. Reduction of the main anti-nutritional factors in grains of Jack bean and cowpea
sole or mixed with sorghum through ensiling.
3. Evaluation of the effect of ensiling on the animal performance through the
determination of standardized ileal digestibility of essential amino acids and

Task and aim
30
apparent digestibility of selected nutrients using pigs under experimental
conditions.
In order to implement the main objectives, the following work plan was developed:
1. The ensilability of Jack bean and cowpea grains in two different mixtures with
sorghum should be evaluated through an in vitro rapid fermentation test (RFT)
using a lactic acid bacteria inoculant and molasses as additives.
2. The influence of soaking and germination as pre-ensiling treatments on the
reduction of buffering capacity and the increase of water soluble carbohydrates of
the legume grains should be tested.
3. The effect of an additive (lactic acid bacteria and/or molasses) and mixing with
sorghum on the pH value and the main fermentation products (lactic acid, volatile
fatty acids, alcohols, ammonia) in Jack bean and cowpea lab scale silages
(ROMOS) after different pre-ensiling treatments (soaking, pre-germination or
remoistening to 65 % dry matter) should be evaluated.
4. The effect of storage time on the reduction of selected anti-nutritional factors in
silages of Jack bean and cowpea grains sole or mixed with sorghum grains should
be determined.
5. The fermentation quality and the effect on selected anti-nutritional factors of
ensiled Jack bean and cowpea mixed with sorghum using additives and a selected
pre-ensiling treatment should be evaluated as well on a large-scale (ton silages).
6. The effect of ensiled Jack bean-sorghum and cowpea-sorghum mixtures on the
standardized ileal digestibility of amino acids compared with their equivalent raw
mixtures should be demonstrated through a digestibility trial with minipigs with an
ileal-rectal anastomosis.
7. The influence of ensiled Jack bean-sorghum and cowpea-sorghum mixtures on
the fecal digestibility of selected nutrients compared with their equivalent raw
mixtures should be analyzed through a digestibility trial with growing-finishing pigs.

Materials and methods
31
4 Materials and methods
4.1 Experimental procedure
Harvested seeds of Jack bean (JBN), cowpea (CWP) and sorghum (SOR) at their
ripe stage were thoroughly sun dried, winnowed and stored. A chemical evaluation of
selected nutrients (DM, OM, CP, CF, AEE, NDFOM, ADFOM, ADLOM, starch and ash)
in the grains was made. Furthermore, selected ANF were determined for JBN (trypsin
inhibitory activity, canavanine, hydrogen cyanide and tannins), CWP (trypsin
inhibitory activity, hydrogen cyanide and tannins) and SOR (hydrogen cyanide and
tannins). Buffering capacity and water soluble carbohydrates (WSC) were determined
in all grains to estimate ensilability.
An in vitro fermentation test (Rostock Fermentation Test, RFT) was run to estimate
ensilability before ensiling on a lab scale. Hereby, additives (molasses and lactic acid
bacteria inoculant) were applied in different mixtures of JBN and CWP with SOR.
Changes in pH during incubation (0, 14, 18, 22, 26 and 38 h) and chemical analysis
of filtrates (lactic acid, volatile fatty acids, ammonia and ethanol) at the end of the test
were used as selecting criteria for treatments of silages.
After the evaluation of results in RFT, Rostock model silages (ROMOS) were
prepared. Three different experiments were conducted depending on the used pre-
ensiling treatment. Beans were remoistened to approximately 65 % of DM, soaked or
pre-germinated (each pre-ensiling treatment sole and mixed with SOR). A change in
the chemical composition of the grains caused by the pre-ensiling treatments was
expected to improve ensilability. The 65 % DM silages were thought to act as a
control variant. Silages were disposed in a factorial design, where the effects of the
type of bean, the pre-ensiling treatment used, the mixture with SOR, the use of
additives and the storage time were the main factors to be evaluated. Fermentation
products in silages after 60 days of storage and ANF at four storage times (0, 5, 20
and 60 days) were the used variables.
Silages of JBN+SOR and CWP+SOR with selected pre-ensiling treatment and
additive were used in pig feeding trials. The selection criteria for the combination of
pre-ensiling treatment and additive did not only consider results of model silages, but
also practical reasons for future on-farm use. Therefore, grain-sorghum mixtures
were ensiled in plastic tons for 60 days. Selected nutrients, fermentation products
and ANF were determined to evaluate the nutritional quality of the silages.

Materials and methods
32
Silages and their respective raw mixtures as control were fed to minipigs with an
ileal-rectal anastomosis and the standardized ileal amino acid digestibility was
calculated using the regression method. Fecal digestibility of selected nutrients (DM,
OM, ash, starch, CF, AEE, NDFOM, ADFOM and ADLOM) was determined in fattening-
finishing pigs using the same feedstuffs. The calculation was made by difference.
4.2 Selection and processing of the plant material
Fully mature Jack bean (JBN, Canavalia ensiformis [L.] DC) grains were hand
harvested and sun dried at the Agricultural Experimental Station “Álvaro Barba”
(22º43'N, 79º90'W), Central University of Las Villas, Santa Clara, Cuba. Seeds were
planted on brown carbonated soils and neither fertilizer nor irrigation was applied.
Cowpea (CWP, Vigna unguiculata [L.] Walp.) var. INIFAT-93 seeds were purchased
from a local market (State´s Seeds Distributer, Villa Clara, Cuba). Sorghum (SOR,
Sorghum bicolor [L.] Moench) was purchased at Scharnebecker Mühle Di Ha GmbH,
Scharnebeck, Germany. All grains were stored in cellular nylon bags prior to use.
4.3 Ensiling experiments with grains of Jack bean and cowpea sole or
mixed with sorghum
4.3.1 Rostock Fermentation Test (RFT)
In order to conduct the in vitro method of RFT (Pieper et al., 1989; Zierenberg, 2000),
grains of JBN and CWP were milled to 4 mm mesh size. From the coarsely ground
material 50 g was mixed with 200 ml of deionized water in glass beakers of 600 ml
capacity. The following treatments were applied (n=3): control without additive (LEG),
molasses (MOL, 4 %), Lactobacillus plantarum (LAB, 3x10⁵ cfu·g-1, DSM 8862 and
8866), MOL+LAB. Furthermore, sorghum (SOR) grains (4 mm mesh size) were
mixed with legume grains to reach either 20 or 24 % crude protein of the dry matter in
the mix and as well combined with LAB (SOR+LAB) (Table 5), whereas 20 and 24 %
of crude protein would meet the requirements between weaning and growing-
fattening phase.
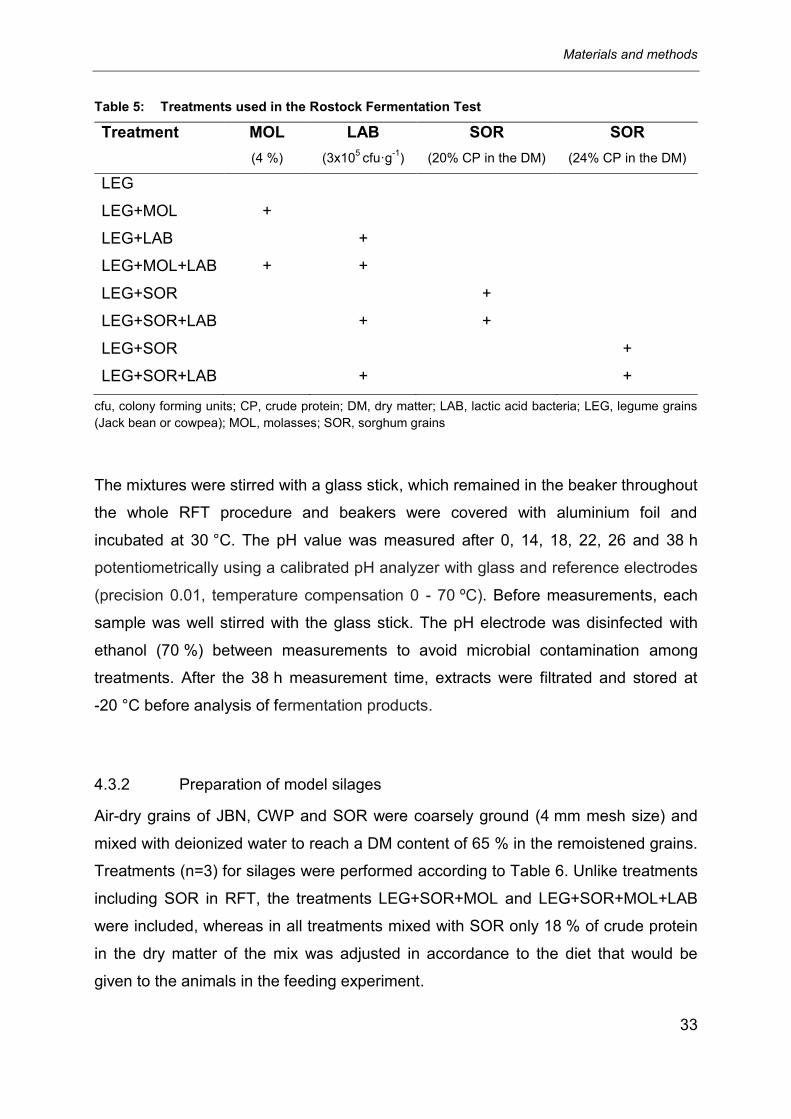
Materials and methods
33
Table 5: Treatments used in the Rostock Fermentation Test
Treatment
MOL
(4 %)
LAB
(3x10⁵ cfu·g
-1)
SOR
(20% CP in the DM)
SOR
(24% CP in the DM)
LEG
LEG+MOL +
LEG+LAB +
LEG+MOL+LAB + +
LEG+SOR +
LEG+SOR+LAB + +
LEG+SOR +
LEG+SOR+LAB + +
cfu, colony forming units; CP, crude protein; DM, dry matter; LAB, lactic acid bacteria; LEG, legume grains
(Jack bean or cowpea); MOL, molasses; SOR, sorghum grains
The mixtures were stirred with a glass stick, which remained in the beaker throughout
the whole RFT procedure and beakers were covered with aluminium foil and
incubated at 30 °C. The pH value was measured after 0, 14, 18, 22, 26 and 38 h
potentiometrically using a calibrated pH analyzer with glass and reference electrodes
(precision 0.01, temperature compensation 0 - 70 ºC). Before measurements, each
sample was well stirred with the glass stick. The pH electrode was disinfected with
ethanol (70 %) between measurements to avoid microbial contamination among
treatments. After the 38 h measurement time, extracts were filtrated and stored at
-20 °C before analysis of fermentation products.
4.3.2 Preparation of model silages
Air-dry grains of JBN, CWP and SOR were coarsely ground (4 mm mesh size) and
mixed with deionized water to reach a DM content of 65 % in the remoistened grains.
Treatments (n=3) for silages were performed according to Table 6. Unlike treatments
including SOR in RFT, the treatments LEG+SOR+MOL and LEG+SOR+MOL+LAB
were included, whereas in all treatments mixed with SOR only 18 % of crude protein
in the dry matter of the mix was adjusted in accordance to the diet that would be
given to the animals in the feeding experiment.

Materials and methods
34
Table 6: Treatments used for silages of remoistened grains of Jack bean and cowpea
Treatments
MOL (4%)
LAB (3x10
5 cfu·g
-1)
SOR (18 % CP in the DM)
LEG
LEG+MOL +
LEG+LAB +
LEG+MOL+LAB + +
LEG+SOR +
LEG+SOR+MOL + +
LEG+SOR+LAB + +
LEG+SOR+MOL+LAB + + +
Laboratory-scale silages were prepared following the vacuum-packed Rostock model
silage (ROMOS) method (Hoedtke & Zeyner, 2011). For the vacuum sealing of the
plastic bag silages, a vacuum sealer (V.300, LAVA vacuum-package, Bad Saulgau,
Germany) was used. Six-hundred grams of samples was packed into polyethylene
bags (PA-PE 20/70, 200×300 mm, LAVA vacuum package, Bad Saulgau, Germany).
Silage material was pre-compressed by hand before the bags were air-evacuated
and heat-sealed. In order to prevent deformation of ROMOS bags, adhesive tape
was wrapped around the sealed polyethylene bags. To avoid bloating, the wrapped
bags were perforated with a needle (2×50 mm, Rometsch GmbH, Heilbronn,
Germany), which was disinfected after each bag with ethanol (70%) and put
immediately into a second bag (PA-PE 20/70, 200×300 mm, LAVA vacuum package,
Bad Saulgau, Germany) which was air-evacuated with the same proceeding and
sealed at once to maintain anaerobic conditions. ROMOS were stored at 30 ºC for 5,
20 and 60 days.
At each opening day, silages were homogenized and a representative sample was
taken to determine DM, pH value, selected ANF and losses. The latter were
calculated as percentage of the initial weight before ensiling. Selected nutrients and
fermentation products of filtrates were determined only in 60-day silages. For pH
measurement and analysis of filtrates, a portion of 50 g fresh silage was used.
Samples were weighed into 600 ml beakers, mixed with 200 ml deionized water,
stirred with a glass stick, covered with aluminum foil and kept overnight (4 ºC). The

Materials and methods
35
pH was measured after extracts reached room temperature. Extracts were filtrated
through filter paper (Whatman, grade Nº 4) and kept at -20 °C prior to analysis.
4.3.3 Pre-ensiling treatments
4.3.3.1 Soaking
For evaluation of a suitable soaking pre-ensiling treatment to be used for lab scale
silages, three soaking times and four proportions of grain to water were used to
assess the effect on the buffering capacity (BC) and selected parameters (DM, crude
protein and ash). For both legumes a thorough selection of grains was made by
hand. Quantities of 100 g were weighed into 600 ml beakers and deionized water
was added as shown in Table 7.
Table 7: Experimental design of the soaking trial with Jack bean and cowpea grains (n=4)
Soaking time 18 h 24 h 30 h
Grain:water ratio (w/v)
1:2 1:2 1:2
1:3 1:3 1:3
1:4 1:4 1:4
1:5 1:5 1:5
Beakers were covered with aluminum foil and incubated at 30 ºC. After soaking water
was drained, grains were rinsed with deionized water, oven-dried at 60 ºC for 72 h
and milled (1 mm mesh size) before being analyzed.
4.3.3.2 Pre-germination
The pre-germination trial with the legume grains was conducted to evaluate the
influence of pre-germination on selected chemical parameters (WSC, DM and CP),
which were thought to show an impact on ensilability. Furthermore, selected ANF
were determined (TIA, HCN and canavanine) according to chapter 4.5.5, as through
germination a reduction of those ANF was expected.
Following the method of Oboh et al. (2002), grains were soaked for 30 min in a
sodium hypochlorite (1 %) solution and thoroughly rinsed afterwards (5 times) with
deionized water. Grains were soaked (9 h) in deionized water at the ratio of 1:3 (w/v).

Materials and methods
36
Sterile Petri dishes were lined with filter paper on which cotton wool was spread and
sprayed with deionized water. Grains were hand selected and 30 JBN and 200 CWP
seeds were selected per dish (n=3). The pre-germination trial was conducted under a
light and darkness regime in a temperature regulated chamber (25 ºC). The
treatment under light regime was given 12 h·d-1 natural light and 12 h·d-1 in total
darkness. As the experiment was done in a room with only one window, additional
artificial light (150 W bulb) was used to homogenize light in the whole room. Seeds
under total darkness regime remained in the same room but were covered by a
carton box. Grains were sprayed with deionized water two times per day to maintain
humid conditions. Samples were collected at 12, 24, 48, 72 and 96 h and at 12, 24,
48 and 72 h for JBN and CWP, respectively. Pre-germinated grains were oven dried
at 60 ºC, milled (1 mm mesh size) and stored for chemical analysis.
4.3.4 Lab scale silages with pre-treated seeds
4.3.4.1 Model silages with soaked seeds
In accordance to the results of the soaking trial, the appropriate treatment was
selected to prepare ROMOS. The necessary quantity of JBN and CWP was hand
selected and soaked in tap water for 24 h at a grain to water ratio of 1:4 (w/v) in
plastic boxes (80 l volume) in a tempered room (20 ºC). Afterwards, grains were
rinsed with tap water and drained for 20 min in stainless steel sieves.
Soaked grains were crushed (universal feed masher, Bad Liebenwerda, Germany) to
approx 4 mm mesh size. Each treatment (Table 8) was prepared in a dough mixer
(25 kg capacity). The mixer was disinfected between treatments with ethanol (70 %)
to avoid carry-over of the inoculant. The ensiling procedure followed the method of
ROMOS described in chapter 4.3.2.
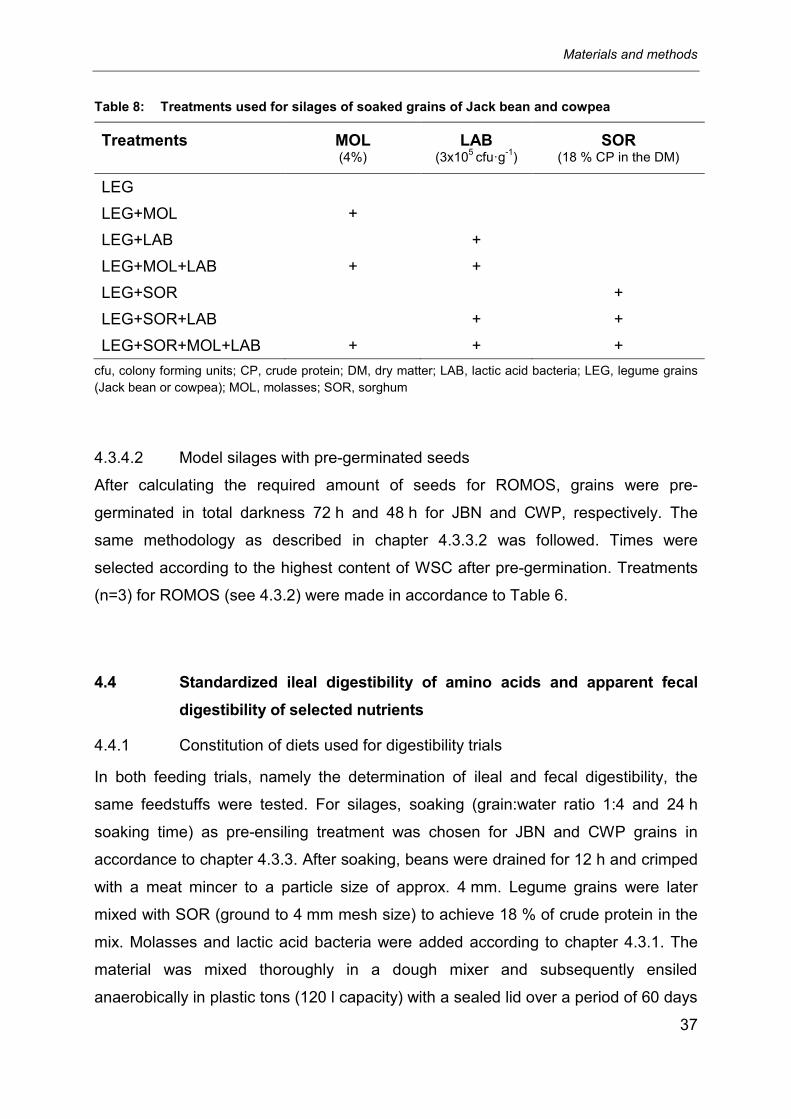
Materials and methods
37
Table 8: Treatments used for silages of soaked grains of Jack bean and cowpea
Treatments
MOL (4%)
LAB (3x10
5 cfu·g
-1)
SOR (18 % CP in the DM)
LEG
LEG+MOL +
LEG+LAB +
LEG+MOL+LAB + +
LEG+SOR +
LEG+SOR+LAB + +
LEG+SOR+MOL+LAB + + +
cfu, colony forming units; CP, crude protein; DM, dry matter; LAB, lactic acid bacteria; LEG, legume grains
(Jack bean or cowpea); MOL, molasses; SOR, sorghum
4.3.4.2 Model silages with pre-germinated seeds
After calculating the required amount of seeds for ROMOS, grains were pre-
germinated in total darkness 72 h and 48 h for JBN and CWP, respectively. The
same methodology as described in chapter 4.3.3.2 was followed. Times were
selected according to the highest content of WSC after pre-germination. Treatments
(n=3) for ROMOS (see 4.3.2) were made in accordance to Table 6.
4.4 Standardized ileal digestibility of amino acids and apparent fecal
digestibility of selected nutrients
4.4.1 Constitution of diets used for digestibility trials
In both feeding trials, namely the determination of ileal and fecal digestibility, the
same feedstuffs were tested. For silages, soaking (grain:water ratio 1:4 and 24 h
soaking time) as pre-ensiling treatment was chosen for JBN and CWP grains in
accordance to chapter 4.3.3. After soaking, beans were drained for 12 h and crimped
with a meat mincer to a particle size of approx. 4 mm. Legume grains were later
mixed with SOR (ground to 4 mm mesh size) to achieve 18 % of crude protein in the
mix. Molasses and lactic acid bacteria were added according to chapter 4.3.1. The
material was mixed thoroughly in a dough mixer and subsequently ensiled
anaerobically in plastic tons (120 l capacity) with a sealed lid over a period of 60 days

Materials and methods
38
at room temperature (approx. 20 ºC). After opening, silages were well homogenized.
Samples were taken for chemical analysis and the determination of aerobic stability.
To maintain silage quality during the feeding trials, silages were aliquoted and stored
at -20 °C until being used. Aliquots were thawed at 4 °C the day before feeding.
In a simple palatability test, JBN silage was refused by the animals in all possible
proportions proposed to be tested. Therefore, JBN containing silage had to be
excluded from the feeding trail.
Besides the silages containing CWP, the corresponding raw (not ensiled) mixture of
CWP and SOR was offered as feed. Both grains were milled (4 mm mesh size) and
mixed in the same proportion like in silages to reach 18 % crude protein in the mix.
However, neither molasses nor lactic acid bacteria were applied.
4.4.2 Determination of the standardized ileal digestibility of amino acids
4.4.2.1 Animals and housing
The experimental protocol was approved by the Ethical Committee of the Ministry of
Agriculture, Food Safety and Fishery Mecklenburg-Western Pomerania, Germany
(Permission No.: LALLF M-V/TSD/7221.3-2.1-026/09). The experimental design,
collection and treatment of chyme and analyses of feed and ileal effluent were
conducted according to the recommendations of GfE (2005b).
Eight adult castrated minipigs (strain Minilewe) were used, that were fitted with an
end-to-end ileo-rectal anastomosis (IRA), conserving the ileo-ceco-colic valve and
isolating the colon completely (Hennig et al., 1986; Laplace et al., 1994). Pigs were
housed individually in floor pens (3 m2 per pig) for the first 9 days of an adaptation
period, during which the proportion of the feed to be tested was gradually increased.
During the following 7 days, which comprised 2 days for adaptation and 5 days for
collection of ileal effluents, animals were kept in metabolic cages (0.8 m2 per pig).
In the subsequent cycles with duration of 10 days each, pigs were housed in the floor
pens for 3 days adaptation and the following 7 days in accordance to the first cycle.
The rooms were air conditioned and temperature and light was controlled (18 to
20 °C; 06.00 to 18.00 lighting). All animals were declared healthy at the beginning of
the trial. The perianal region was washed daily with warm water and protected
against feces irritation with a zinc oxide containing cream.

Materials and methods
39
4.4.2.2 Experimental design and diets
The trial was disposed in a Latin square design and standardized ileal digestibility
was calculated by the regression method. As there are restrictions in feeding raw
CWP grains due to its content of ANF, the CWP was limited to 10, 20 and 30 % of
the DM in the tested diets. Therefore, wheat (milled to 4 mm mesh size) was included
as basal feed ingredient.
Two experiments were undertaken. In experiment 1 with four animals with a mean
body weight (BW) of 64.0 ±2.1 kg, grain silage was fed and in experiment 2 (four
animals with a mean BW of 58.6 ±1.9 kg) the raw mixture of grains was used. The
composition of the diets is presented in Table 9.
During both experiments the feed supply was restricted to a daily level of
35 g DM·kg-1 BW0.75. The daily rations were divided into two equal meals mixed with
water (1:2.5, w/w) and fed at 07.00 and 14.00. In addition to drinking water, pigs were
offered twice a day 200 ml of an electrolyte solution (composition, g·l-1: 5.38 NaCl,
0.680 CH3COONa×3 H2O, 0.372 KCl, 0.548 CaCl2×6 H2O, 0.304 MgCl2×6 H2O;
concentrations, g·l-1: 3.218 Na, 0.195 K, 0.036 Mg, 0.100 Ca, 3.651 Cl) with little
modifications to prevent mineral depletion due to IRA (GfE, 2002). Due to animals’
adverse reaction, CH3COONa×3 H2O was reduced tenfold. The pigs consumed
solution volumes of 20 to 24 ml·kg-1 BW0.75 and day, and the daily Na supply was
adjusted to the 2.5-fold of the requirements of intact pigs.
To minimize the effect of endogenous amino acids (AA) on apparent digestibility (AD)
values and in accordance to the results of Furuya & Kaji (1989) and Fan et al. (1994),
the German Society of Nutrition Physiology (GfE, 2002) introduced the following
threshold levels in assay diets (g·kg-1 DM): 9.0 lysine, 7.0 threonine, 3.0 methionine
and 12.0 leucine. The assay diets were supplemented with crystalline AA up to the
abovementioned levels. Crystalline AA are considered to be 100 % digestible (Chung
& Baker, 1992), so that they were not considered in the intake.

Materials and methods
40
Table 9: Composition of diets (g·kg-1
DM) used in the experiments for determination of ileal
digestibility
Experiment 1
1 2 3 4
Ingredients Wheat Silage + wheat
(10% CWP of DM)1
Silage + wheat (20% CWP of DM)
Silage + wheat (30% CWP of DM)
Wheat 947 755 563 371
Silage2 - 195 391 586 Mineral mix3 35 35 35 35
L-leucine 4.2 2.8 1.4 0
L-lysine*HCl 8.2 6.9 5.6 4.4
L-threonine 4.1 3.5 3.0 2.4
DL-methionine 1.7 1.5 1.4 1.3
Experiment 2
1 2 3 4
Ingredients Wheat Mix + wheat
(10% CWP of DM)1
Mix + wheat (20% CWP of DM)
Mix + wheat (30% CWP of DM)
Wheat 947 755 564 372 Raw mix2 - 195 391 586 Mineral mix3 35 35 35 35 L-leucine 4.2 2.7 1.3 0 L-lysine*HCl 8.2 6.6 5.0 3.4 L-threonine 4.1 3.5 3.0 2.4 DL-methionine 1.7 1.5 1.3 1.2
CWP, cowpea; DM, dry matter 1 The percentage of CWP was calculated depending on the daily DM intake per animal.
2 Mixture cowpea and sorghum to reach 18 % crude protein in the DM
3 Mineral and vitamin premix (Spezialfutter Neuruppin GmbH, Neuruppin, Germany); content of minerals and vitamins per kg diet: 5.87 g Ca, 0.25 g Mg, 1.63 g P, 1.25 g Na, 125 mg Co, 0.75 mg I, 125 mg Fe, 75 mg Mn, 0.25 mg Se, 178.75 mg Zn, 0.50 mg Co, 12500 I.U. vitamin A-palmitate, 1250 I.U. cholecalciferole, 37.5 mg tocopherole, 1.88 mg methylnaphthochinon, 2.5 mg thiamin, 6.25 mg riboflavin, 3.75 mg pyridoxine, 25 μg cobalamine, 15.63 mg Ca-pantothenate, 31.25 mg nicotinic acid, 125 mg choline chloride, 0.31 mg folic acid, 75 μg biotin
4.4.2.3 Chyme collection and analysis
The ileal effluents were quantitatively collected in metal containers adapted to the
metabolic cages with a solution of methanol and formaldehyde (95:5, v/v) to prevent
microbial fermentation and N losses (Laplace et al., 1994). Total amounts were
sampled once a day, pooled and frozen at -20 °C. At the end of the collecting period,
the total effluent was weighed, homogenized and approximately 500 g fresh sample
was taken for chemical analysis. Prior to freeze-drying, methanol and formaldehyde
solution was removed by air-drying for 24 h. Dried digesta samples as well as feed
samples were ground to 1 mm mesh size.

Materials and methods
41
Feedstuffs and digesta were analyzed for AA composition (except tryptophan)
according to Hackl et al. (2010). Samples of 2 g of each diet and dried effluents of all
individual animals were hydrolyzed with 60 ml of 6 N HCl for 22 h at 110 ºC and then
filtrated. For analysis of sulphur-containing AA, samples of 2 g each were oxidized
using 10 ml of an oxidative mixture containing formic acid and H2O2 (9:1, v/v) and
kept at 4 ºC overnight. Consecutively, 1 N KMnO4 was added until no more
discoloration took place and then samples were hydrolyzed with 60 ml of 6 N HCl for
22 h at 110 ºC. After cooling, the samples were transferred to flasks, filled up to
500 ml and filtrated. The AA in the filtrates were quantified by HPLC (Shimadzu,
Kyoto, Japan) using a cation column (LC K06; Alltech-Grom GmbH, Rottenburg-
Hailfingen, Germany). The temperature of the column was programmed to oscillate in
a range between 57 and 74 ºC and a pH gradient from 3.45 to 10.85. The buffer flow
rate was 0.45 ml·min-1. The AA solutions were mixed with ninhydrin at a flow rate of
0.25 ml·min-1 for color development at 128 ºC and determined by use of an UV-
detector at 570 nm (proline at 440 nm).
4.4.3 Determination of fecal digestibility of selected nutrients
4.4.3.1 Animals and housing
The experimental protocol was approved by the Ethical Committee of the Ministry of
Agriculture, Food Safety and Fishery Mecklenburg-Western Pomerania, Germany
(Permission No.: LALLF M-V/TSD/7221.3-2.1-010/10). The experimental design,
collection and handling of excreta and chemical analyses of diets and excreta were
conducted according to the recommendations of GfE (2005a).
Six castrated pigs of the breed ‘German Landrace‘ were selected with an initial mean
BW of 49.0 ±2.1 kg. Pigs were housed individually in fattening pens (1.5 m² per pig)
for the first 4 days of an adaptation period. After that time, animals were kept in
metabolic cages (0.8 m² per pig) for 3 more days of adaptation and another 5 days
for collecting feces. At the end of the cycle, pigs were weighed to recalculate the daily
DM intake and housing started again in the fattening pens for the first days of
adaptation like described before. The rooms were air conditioned and temperature
and light was controlled (18 to 20 °C; 06.00 to 18.00 lighting). Animals finished the
trial with a mean BW of 66.6 ±4.4 kg.
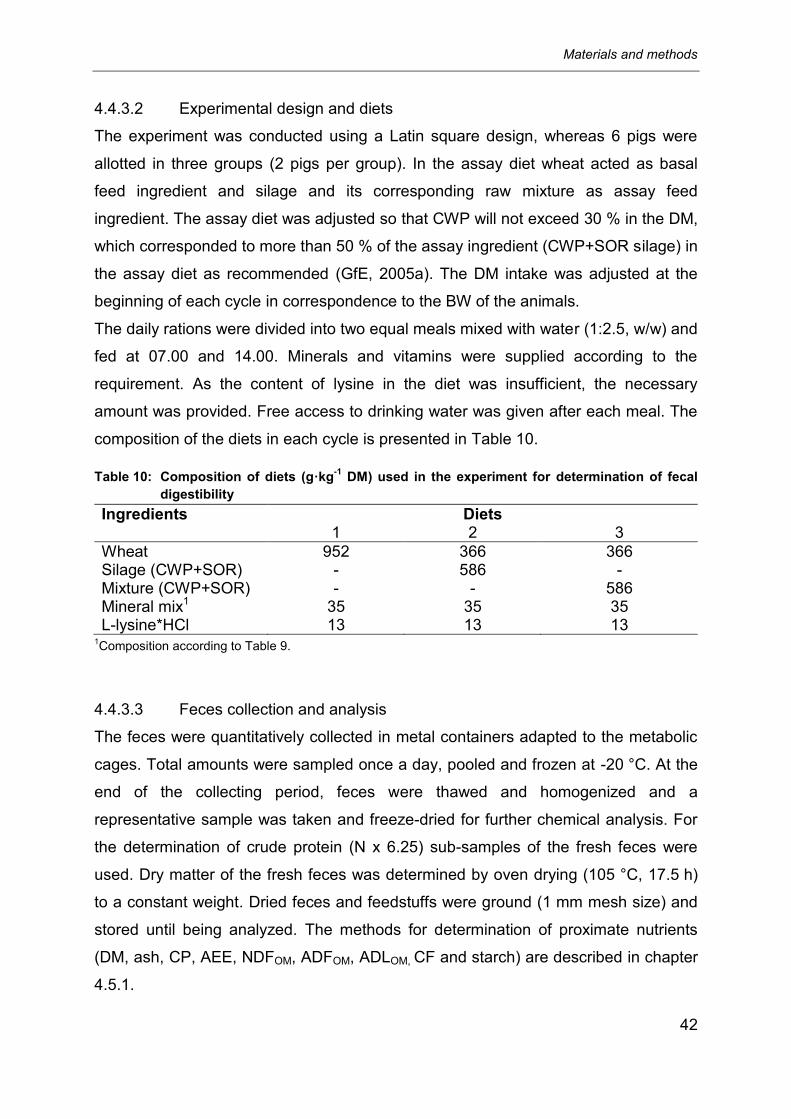
Materials and methods
42
4.4.3.2 Experimental design and diets
The experiment was conducted using a Latin square design, whereas 6 pigs were
allotted in three groups (2 pigs per group). In the assay diet wheat acted as basal
feed ingredient and silage and its corresponding raw mixture as assay feed
ingredient. The assay diet was adjusted so that CWP will not exceed 30 % in the DM,
which corresponded to more than 50 % of the assay ingredient (CWP+SOR silage) in
the assay diet as recommended (GfE, 2005a). The DM intake was adjusted at the
beginning of each cycle in correspondence to the BW of the animals.
The daily rations were divided into two equal meals mixed with water (1:2.5, w/w) and
fed at 07.00 and 14.00. Minerals and vitamins were supplied according to the
requirement. As the content of lysine in the diet was insufficient, the necessary
amount was provided. Free access to drinking water was given after each meal. The
composition of the diets in each cycle is presented in Table 10.
Table 10: Composition of diets (g·kg-1
DM) used in the experiment for determination of fecal
digestibility
Ingredients
Diets 1 2 3
Wheat 952 366 366 Silage (CWP+SOR) - 586 - Mixture (CWP+SOR) - - 586 Mineral mix1 35 35 35 L-lysine*HCl 13 13 13
1Composition according to Table 9.
4.4.3.3 Feces collection and analysis
The feces were quantitatively collected in metal containers adapted to the metabolic
cages. Total amounts were sampled once a day, pooled and frozen at -20 °C. At the
end of the collecting period, feces were thawed and homogenized and a
representative sample was taken and freeze-dried for further chemical analysis. For
the determination of crude protein (N x 6.25) sub-samples of the fresh feces were
used. Dry matter of the fresh feces was determined by oven drying (105 °C, 17.5 h)
to a constant weight. Dried feces and feedstuffs were ground (1 mm mesh size) and
stored until being analyzed. The methods for determination of proximate nutrients
(DM, ash, CP, AEE, NDFOM, ADFOM, ADLOM, CF and starch) are described in chapter
4.5.1.

Materials and methods
43
4.5 Chemical analysis
4.5.1 Chemical analysis of the plant material, silages, chyme and feces
The dry matter (DM) was determined according to the guidelines of the VDLUFA
(1993). A representative sample of air-dried seeds, silages, chyme or feces was
milled to 1 mm mesh size (Brabender, Duisburg, Germany). Milled samples were
stored in sealed glass flasks at room temperature for further analyses. Approximately
2 g (accurate weighing) of the milled samples were oven dried (105 ºC) for 3 h until
constant weight.
In silages, at every opening day, bags were opened and the whole content mixed in a
disinfected tray. After organoleptic evaluation of the quality, a representative portion
per bag was divided in a couple of trays and protected with aluminum foil. Trays were
stored at -20 °C before being freeze-dried (4 to 5 days). After freeze-drying the trays
were weighed and milled (1 mm mesh size). Then the same proceeding described
before for DM determination was followed. A dry matter correction was not made for
volatile silage products as currently there still remain uncertainties, when the freeze
drying method is used instead the classical oven drying (Eriksson & Ericson, 2012).
Furthermore, equations for correcting silage dry matter of grain silages should be
developed in the future.
Ash was determined in all materials by ashing at 600 ºC for 6 h in a muffle furnace.
The mineral composition of soaked JBN and CWP of selected soaking treatments
was analyzed at the Zentrum für Lebensmittel und Tierernährung, Oberschleißheim,
Germany. According to Stürmer (2005), a hydrolysis of the samples was made with
HNO3 for Ca, Na, K, P and Mg using a microwave (EHTOS 1600, MLS, Leutkirch,
Germany). For Cl, samples were washed with water and the slurry was used for
analysis. Ca, Na and K were measured using a flame spectrophotometer (EFOX
5053, Eppendorf, Hamburg, Germany). For Mg an Atomic Absorption
Spectrophotometer (AAnalyst 800, Perkin Elmer, Shelton, USA) was used. P was
determined spectrophotometrically (Genesys 10 UV, Thermoscientific, Waltham,
USA). The determination method of Cl was based on the principle of colometric
impulse titration by the use of a silver electrode pairing (Chloroidmeter 50cl,
SLAMED, Frankfurt, Germany).
Crude protein (N × 6.25) was analyzed with Kjeldatherm and Vapodest (Gerhardt,
Königswinter, Germany). Neutral detergent fiber (NDFOM, exclusive residual ash) and

Materials and methods
44
acid detergent fiber (ADFOM, exclusive residual ash) were determined by wet
chemical analyses (Goering & Van Soest, 1970) with prevail enzymatic hydrolysis
and crude fiber (VDLUFA, 1993) using a FOSS analyzer (Fibertec 2010, Rellingen,
Germany). Applying the Soxhlet principle, acid ether extract was determined after
acid hydrolysis and petroleum ether extraction (Soxtec 1047 and 2050, FOSS
Tecator, Hoganas, Sweden).
Water soluble carbohydrates (WSC) were analyzed as monomeric and dimeric
sugars in water extracts (1 h at 25 ºC) by HPLC (HPX-87C, Biorad, Hercules, CA,
USA) according to Menge-Hartmann et al. (2009) with a flow rate of 0.65 ml·min-1 at
refractive index detector (column temperature 80 ºC). For the determination of starch,
an enzymatic procedure using amylase (Thermamyl 120, Novo Nordisk A/S,
Denmark) was chosen (Schmidt et al., 2005). Concentration of glucose was
measured by HPLC after enzymatic hydrolyses and the starch content was
calculated by considering the increase of glucose.
For buffering capacity (BC), 0.5 g of plant material was mixed with 50 ml deionized
water, shaken for 2 min using a magnetic stirrer and left for 30 min at room
temperature. The BC was determined by titration with lactic acid (0.1 mol·l-1) to a pH
of 4.0 (Weissbach, 1967).
4.5.2 Determination of fermentation products
Filtrates of RFT and silage extracts were analyzed for fermentation products. Lactic
acid was determined by HPLC (Aminex HPX-87H, Biorad) with a flow rate of
0.60 ml·min-1 at the UV detector. Volatile fatty acids (acetic, propionic, butyric, valeric
and iso-valeric acids) and alcohols (ethanol, propanol and 2,3-butanediol) were
quantitatively separated by gas chromatography (GC-14A, CLASS-VP, Shimadzu,
Kyoto, Japan). Nitrogen was used as carrier gas at a pressure of 1 kg·cm-2. The
temperature of the injector and flame ionization detector was kept constant at 190 ºC
each. The temperature of the column oven was programmed at 110 ºC during the
first 1.5 min and increased to 170 ºC at a rate of 12 ºC·min-1 thereafter. Ammonia
was determined in the filtrates using a modified CONWAY (Conway & Byrne, 1933)
micro-diffusion technique (Voigt & Steger, 1967).

Materials and methods
45
4.5.3 Determination of the aerobic stability of silages
Aerobic stability was determined in the silages prepared for the feeding experiments
after 60 days of storage by means of temperature rise (Honig, 1990). Samples (n=4)
representing 100 g of DM were filled into plastic containers (1.25 l capacity), of which
the base as well as the lid were provided with a hole of 1 cm diameter to guarantee
air circulation. A thermocouple was fixed through the hole in the lid in the geometrical
centre of the sample and the closed test container was put into a cylinder made of
styrofoam. Temperature was measured at intervals of 6 h for 7 days and recorded by
data logger software (Version 4.2, PS ES Electronics Services, Nieuwendijk,
Netherlands). Silages were considered as aerobically unstable if the temperature of
the silage sample and the room temperature (set at 20 °C) differed by more than
3 °C. Moreover, pH and DM were determined at the beginning and at the end of the
test.
4.5.4 Determination of deoxynivalenol
The plant material was analyzed for deoxynivalenol (DON) in accordance to
Oldenburg et al. (2007) at the Bundesforschungsinstitut für Tiergesundheit, Friedrich-
Loeffler-Institut, Braunschweig, Germany. Samples were analyzed by HPLC
equipped with a diode array detector (SPD-M10AVP, Shimadzu, Duisburg,
Germany). Separations were done on an Aqua C18 column, 5 µm, 250x4.6 mm
(Phenomenex, Aschaffenburg, Germany). Quantification was made at 218 nm.
Previously, a clean-up with an immuno-affinity column (IAC, DONprepTM, R-Biopharm
AG, Darmstadt, Germany) was made. A mechanical shaker was used to extract 10 g
sample (1 mm mesh size) in 80 ml deionized water for 1 h. Afterwards, 20 ml extract
was filtered through a fluted filter and 3 ml of the filtrate was afterwards filtered
through a polivinylidene fluoride membrane syringe filter (0.45 µm, Amchro,
Hattersheim, Germany). Through an IAC, 2 ml of the extract was passed under
gravity. The column was washed once with 2 ml and twice with 1.5 ml of deionized
water using a slight vacuum. Four successive portions of 1 ml methanol were passed
slowly. The solvent was separated from the eluted DON using a rotator evaporator.
The last traces were blown out under a gentle stream of nitrogen. The authors
Materials and methods
46
recommend, that dilutions of the extract should be made before passing through IAC
when DON surpasses 3 mg·kg-1 DM due to column limited capacity.
4.5.5 Determination of anti-nutritional factors
Sample preparation
Prior to analysis, samples were finely milled in a ball mill (Retsch, MM 200,
Germany), whereas overheating had to be prevented. The oscillation frequency was
set to 30 Hz and the grinding time to 5 min to reach a particle size of ≤ 5 µm.
Samples were conserved in glass flasks and protected from light.
Trypsin inhibitory activity (TIA)
The determination of the trypsin inhibitory activity followed the method of Kakade et
al. (1974) with modifications made by Smith et al. (1980). Finely ground samples
(0.6 g) were mixed with 30 ml NaOH (0.01 M). The pH of the resulting slurry was
adjusted to the range of 9.4 - 9.6 with either NaOH (0.1 M) or HCl (0.1 M). Samples
were extracted overnight (4 ºC) and the unfiltered and not centrifuged supernatant
was used for analysis. Dilutions were made with deionized water, so that 2 ml of
sample extract produced an inhibition of 40 to 60 % to reduce the relative standard
deviation. Tubes of 10 ml volume were prepared in duplicate as follows:
(a) Reagent blank: 2.0 ml deionized water
(b) Standard trypsin: 2.0 ml standard trypsin solution (from bovine pancreas,
Sigma, T8802, 13000 units·mg protein-1; 4 mg·200 ml-1 0.001 M HCl) + 2.0 ml
deionized water
(c) Sample blank(s): 2.0 ml diluted sample extract
(d) Samples: 2.0 ml diluted sample extract + 2.0 ml standard trypsin solution
A solution of Nα-Benzoyl-DL-arginine 4-nitroanilide hydrochloride (BAPNA; Sigma,
B4875) was prepared dissolving 40 mg of BAPNA in 1 ml of dimethyl sulphoxide and
diluting it to 100 ml with Tris buffer (Sigma 93389) previously warmed to 37 ºC. After
mixing (Vortex, Genie 2, Scientific Industries, USA) and pre-heating to 37 °C for
10 min, 5 ml BAPNA solution was added to each tube, mixed and incubated for
exactly 10 min at 37 ºC. The reaction was stopped by acetic acid (1.0 ml, 30 % v/v).

Materials and methods
47
Standard trypsin (2.0 ml) was then added to tubes (a) and (c). After centrifugation
(5000 rpm, 10 min, 20 ºC), the released p-nitroaniline was measured photometrically
at 410 nm (Spectronic, Genesys 5, Milton Roy, USA). The residual trypsin activity
was measured in mg·g-1 DM of the sample, whereas TIA was calculated as follows:
AI= (Ab-Aa)-(Ad-Ac) A= absorbance of tubes (a) to (d)
% inhibition= 100AI/(Ab-Aa) ( 40 % and 60 %)
TIA= factorDAI/S
(mg pure trypsin inhibited per g sample) factor = [ml (0.01 M NaOH) + ml (0.1M NaOH or 0.1M HCl)]/19
AI = change in absorbance due to trypsin inhibition per ml diluted sample extract
D = dilution
S = sample weight
Hydrogen cyanide (HCN)
Following the acid hydrolysis method developed by Bradbury et al. (1991), 100 mg of
samples were weighed into screw-capped plastic tubes of 10 ml volume in duplicate.
To each tube, 10 ml phosphoric acid (0.1 M) was pipetted in two steps. At first, 3 ml
were added and shaken for 30 seconds. Afterwards, the remaining 7 ml were
pipetted and the extract was placed in an ultrasonic bath for two intervals of 5 min
each with a break of 5 min in between to avoid heating. The supernatant was then
separated by centrifugation (4800 rpm, 15 min, 20 ºC) and conserved in the fridge if
necessary.
Into 10 ml plastic test tubes, 2 ml of the extract and 2 ml H2SO4 (4 M) were pipetted
and cooked in a water bath (100 ºC, 50 min). Depending on necessities, the tubes
were either cooled in an ice bath or overnight in the fridge (4 ºC). After that, 5 ml
NaOH (3.6 M) were pipetted and the solution was left for 5 min. From the mixture,
1 ml was transferred into clean screw-capped test tubes with 7 ml phosphate buffer
(0.2 M, pH 6). Then, 0.4 ml of chloramine-T (5 g·l-1) was added. The tubes were
cooled in ice for 5 min and 1.6 ml of pyridine/barbituric acid solution was pipetted,
which was prepared by dissolving 1 g barbituric acid in 40 ml pyridine and finally
brought to 200 ml with deionized water. For preparing the blank solution, chloramine-
T and the pyridine/barbituric acid solution were substituted by 2 ml deionized water.
After 1 h to let the color develop, the absorbance was measured at 583 nm.

Materials and methods
48
For calculating HCN concentration (mg·100 g-1), a calibration curve was prepared.
From the HCN solution (75 mg brought to 100 ml with 0.2 M NaOH), aliquots (0.2,
0.4, 0.6, 0.8 and 1 ml) were taken and brought to 10 ml with a pre-mixture of
solutions made to contain the same proportions as those ones used in the analyses
(20 ml 0.1 M H3PO4 + 20 ml 4 M H2SO4 + 50 ml 3.6 M NaOH). From each, 1 ml was
taken and the proceeding followed the same steps likewise the samples.
Canavanine
The determination of canavanine followed the method of Makkar et al. (2007) with
modifications of the preparation of the extract suggested in the original protocol
(Cacho et al., 1989). Finely ground samples (0.5 g) were weighed into 50 ml-test
tubes and 15 ml HCl (0.1 M) were added. The mixture was stirred for 2 min with a
homogenizer (Polytron, PT 1600 E, Switzerland) at room temperature and
centrifuged (4000 rpm, 20 min, 20 ºC). The supernatant was saved and a second
extraction was performed with 10 ml HCl (0.1 M). Both the supernatants were
combined and the pH was adjusted to 7.0 with NaOH (0.2 M). The solution was
diluted to 100 ml final volume using phosphate buffer (0.2 M, pH 7.0).
Pentacyanoaminoferate (PCAF) was prepared by dissolving 10 g sodium
nitroprusside in 55 ml of concentrated ammonia solution (32 % purity). To store the
solution at 0 ºC in the darkness as recommended, it was kept in a styrofoam box
filled with crushed ice inside a fridge. After 24 h a yellow-green precipitate (PCAF II
and III) was obtained by filtration through a Büchner funnel using a vacuum pump to
separate ammonia. Ethanol was added to the filtrate and the formed precipitate re-
filtrated and combined with the first one. The pooled precipitate was washed until all
ammonia was eliminated. The precipitate was dehydrated in pure H2SO4 containing
desiccators for one day and afterwards passed into silica-gel pearls containing
desiccators until it was completely dry. Finally, it was passed into an amber-colored
flask covered by aluminum foil and conserved in desiccators in complete darkness
until photoactivated PCAF was needed.
Photoactivated PCAF solution (1 %, w/v) was freshly made every time it was needed
and used within one day. PCFA (1 g) was dissolved in 50 ml deionized water and
then filled to 100 ml. The solution was transferred completely to a 200 ml-beaker and

Materials and methods
49
illuminated by a 60 W table lamp for 1 h. The photoactivated PCFA was stored in a
capped Erlenmeyer flask covered with aluminum foil in dark conditions.
The calibration curve was prepared pipetting 1 ml from five canavanine solutions with
different concentrations (2, 4, 6, 8, 10 µg·ml-1) of canavanine (Sigma C1625, L-
canavanine from Canavalia ensiformis, ≥ 98 % TLC) in 0.2 M potassium phosphate
buffer of pH 7.0) in 10 ml-test tubes. To these solutions, 6.5 ml of the pH 7.0
phosphate buffer, 1 ml of potassium persulfate (1 %) and 0.5 ml of the aqueous
PCAF (1 %) were added and completed to 10 ml with deionized water. A reagent
blank was prepared with phosphate buffer in place of the canavanine solution.
Solutions were thoroughly mixed and after 15 min absorbance measured at 520 nm
against the reagent blank.
For the determination of canavanine in the samples, 1 ml of plant extract was taken
and the same procedure was run as mentioned previously for the canavanine
solutions. The concentration of canavanine was determined using the calibration
curve and results were expressed as g canavanine·100 g-1 DM.
Polyphenols (condensed tannins, total phenols and non-tannin phenols)
For the extract preparation, 100 mg of the finely ground sample was weighed into
screw-capped test tubes in duplicates and shaken for 30 sec with 3 ml previously
cooled acetone (70 %). In a second step, additional 7 ml acetone was added and the
tubes were placed in an ultrasonic bath for two times 5 min with 5 min break in
between. The bath was cooled with crushed ice (the quantity was restricted to avoid
ultrasonic waves´ interference). The supernatant was collected after centrifugation
(4800 rpm, 15 min, 4 ºC) and protected from light inside a fridge. The extract had to
be used within two days.
Condensed tannins
The method for the determination of condensed tannins is based on Porter et al.
(1986). A butanol-HCl solution was prepared mixing 95 ml n-butanol and 5 ml HCl
(37 % of purity), from which 1.5 ml were pipetted into screw-topped plastic tubes.
Immediately after that, 250 µl from the extract was added, whereas for the blanks
250 µl acetone (70 %) was taken. After 10 sec of shaking, 50 µl of a (NH4)Fe(SO4)2
solution (2 g brought to 100 ml 2 N HCl) were added and shaken for 10 more

Materials and methods
50
seconds. The tubes were closed and cooked in a water bath (100 ºC, 1 h), the blanks
remained at room temperature. After cooking, the tubes were cooled in ice for
10 min. The absorbance was measured at 550 nm using the blank as auto zero. The
calculation was made as follows:
Condensed tannins (% DM) = absorbance*156.5*dilution factor/DM (%)
Total phenols
Using the same extract , 250 µl was pipetted into 10 ml-test tubes in addition to
750 µl cold deionized water and 500 µl Folin-Ciocalteus (1 N). After shaking, the
solution was left for 3 min before 2500 µl Na2CO3 solution (88.5 g Na2CO3 x 10 H2O
brought to 500 ml with deionized water) was added, followed by shaking. The
samples were left in darkness (1 h) for the color development and the absorbance
was measured at 725 nm.
For the calculation a calibration curve was produced every time new solutions were
made. Aliquots (10, 20, 40, 60, 80 and 90 µl) were taken from a tannin solution
(12.5 mg tannic acid brought to 25 ml with deionized water) and brought to 1 ml with
cold deionized water. The Folin-Ciocalteus and Na2CO3 solutions were added
following the same procedure described before, whereas for the blanks, deionized
water was used instead of the sample extract or tannin solution.
Non-tannin phenols
In 10 ml-test tubes 200 mg polivinyl-polipirrolidone (PVPP) were weighed in duplicate
for every sample and shaken with 2 ml cold deionized water for 10 sec. From the
same extracts, 2 ml was pipetted into each tube containing PVPP and after shaking
the solutions were left to react for 15 min in an ice bath before shaking once again
followed by centrifugation (4800 rpm, 15 min, 4 ºC). The supernatant (500 µl) was
mixed with 500 µl cooled deionized water, whereas for the blank 1000 µl deionized
water was used. The solution was mixed with 500 µl Folin-Ciocalteus (1 N) and left
for reaction (3 min) after shaking. Afterwards, 2500 µl Na2CO3 solution was pipetted
and the tube was shaken once again. The absorbance was measured at 725 nm
after 1 h of color development at room temperature.

Materials and methods
51
4.6 Calculations
The estimation of the metabolizable energy of the digestible nutrients in the grains
and diets was made in accordance to the recommendations of the German Society of
Nutrition Physiology (GfE, 2008). The used equation was as follows:
ME (MJ·kg-1DM) = CP x 0.021503 (g kg-1 DM)
+ AEE x 0.032497 (g kg-1 DM)
- CF x 0.021071 (g kg-1 DM)
+ Starch x 0.016309 (g kg-1 DM)
+ Organic rest* x 0.014701 (g kg-1 DM)
AEE, acid ether extract; CF, crude fiber; CP, crude protein
*Organic rest calculated as the difference between the OM and the sum of CP, AEE, CF and starch (each in g kg-1
).
No interaction between the feed ingredients wheat and silages or raw mixture was
expected. Therefore, the regression method was selected for the determination of the
standardized ileal digestibility of amino acids (GfE, 2005b). The equations used for
the calculation are described in chapter 4.7.
As the tested ingredient (TIngr), silages or raw mixture, were only part of the tested
diet (TDiet), the digestibility coefficient (DC) of the nutrients supplied by TIngr (DCIngr)
was calculated by difference, whereas wheat was used as basal diet (BD):
DCIngr (%) = DCDiet (%) - DCBD (%)*(1-a)
a
DCDiet and DCBD = Digestibility of nutrient from TDiet and TBD calculated as follow:
DC (%) = Input-Output
Input100
a = Analyzed nutrient content in TIngr (g·kg
-1 DM)*Inclusion rate of TIngr in TDiet (kg·kg
-1 DM)
Analyzed nutrient content in TDiet (g·kg-1 DM)

Materials and methods
52
Hereby, energy intake of the animals was calculated as the 2.5-fold of the
maintenance requirement (MEm) as:
MEm (MJ·d-1) = 0.72 kg BW0.63 (GfE, 1987).
4.7 Statistical analysis
A General Linear Model was run to find significant interactions among soaking time,
grain:water ratio and the BC, DM and CP in JBN and CWP, as well as among the
time and light regime on the WSC, DM and CP and selected ANF during pre-
germination of JBN and CWP, generated by IBM SPSS version 19 (SPSS software
for Windows Inc., Chicago, IL, USA). P-values less than 0.05 were considered to be
significant.
Differences between treatments in RFT fermentation parameters (pH value, lactic
acid, acetic acid, butyric acid, ethanol and ammonia), ROMOS fermentation
parameters (pH value, fermentation losses, lactic acid, acetic acid, butyric acid,
ethanol, propanol, 2,3-butanediol and NH3-N of total N) and minerals in selected
treatments after soaking were analyzed using One-way ANOVA followed by
Duncan’s multiple range test or Dunnett-T3 in case of no variance homogeneity.
P<0.05 was considered to be statistically significant. IBM SPSS version 19 (SPSS
software for Windows Inc., Chicago, IL, USA) was used. Differences in pH among
incubation times within treatments and between treatments for each incubation time
of RFT are presented in the appendix.
The silage data (DM, fermentation losses, pH value, lactic acid, acetic acid, butyric
acid, ethanol, 2,3-butanediol as well as ANF in the selected treatments) were
analyzed by analysis of variance using the GLIMMIX procedure of SAS/STAT and a
model containing the fixed effects pre-ensiling treatment (levels: moisture
reconstitution, soaking, pre-germination), legume (levels: JBN, CWP), additive
(levels: control, molasses, lactobacillus, molasses plus lactobacillus) and sorghum
(levels: mixed, not mixed).
In addition, LS-means (LSM) corresponding to each fixed effect in the model and
their standard errors (SE) were calculated and all LS-means were pair wise tested
using the Tukey-Kramer procedure for pair wise multiple comparisons. The data
analysis for multiple interactions was generated using SAS/STAT software,

Materials and methods
53
Version 9.2 (SAS/STAT, 2009) of the SAS System for Windows. Information was
gathered in graphics made using the same software and every single significant
difference was summarized in tables presented in the appendix.
For comparing standardized ileal digestibility of amino acids, Proc GLIMMIX and a
model with the fixed effect Group (levels: raw mixture and silage), the covariate x and
the interaction Group*x was used to estimate, test and compare the intercepts and
slopes of the regression lines:
ymixture = amixture + bmixture * x
ysilage = asilage + bsilage * x
Test results with P-values less than 0.05 are considered to be significant.
A General Linear Model was used to evaluate the effect of ensiling on the apparent
digestibility of selected nutrients. P-values less than 0.05 were considered to be
significant.
y: the standardized precaecal digestibility of the selected AA in the silage or raw mixture
x: the contribution level of selected AA from wheat to the assay diet
a: the standardized precaecal digestibility of selected AA in fed silage or raw mixture
b: the standardized precaecal digestibility of selected AA in fed wheat

Results
54
5 Results
5.1 Silages of remoistened Jack bean and cowpea grains sole or mixed
with sorghum
5.1.1 Chemical analysis of the plant material
The chemical composition of raw grains is shown in Table 11. As expected, JBN and
CWP are characterized by a high CP and ash content compared to SOR. The CF in
JBN was found to be remarkably higher compared to CWP. This has to be taken into
consideration when used in rations for pigs.
Table 11: Selected chemical parameters of Jack bean, cowpea and sorghum grains
Grain
DM (g kg-1)
CP AEE CF NDFOM ADFOM ADLOM Ash
(g kg-1DM)
JBN 888 287 24.3 106 225 138 3.30 31.7
CWP 902 261 21.8 60.6 170 89.5 5.90 45.1
SOR 866 95.4 35.9 23.7 93.8 36.6 3.20 15.0
ADFOM, acid detergent fiber; ADLOM, acid detergent lignin; AEE, acid ether extract; CF, crude fiber; CP, crude protein; CWP, cowpea; DM, dry matter; JBN, Jack bean; NDFOM, neutral detergent fiber; SOR, sorghum
Water soluble carbohydrates (WSC) were found in not noteworthy contents in the
studied plant material (Table 12). The minimum of 2 % WSC in the fresh matter to
expect a good ensilability (Honig & Pahlow, 1986) was only achieved in CWP.
Furthermore, it can be assumed that the low WSC content in JBN ( 20 g kg-1 DM)
suggests the use of an additional source of WSC for ensiling. The use of SOR will not
contribute to increase WSC content in mixed silages as believed. In SOR, the lowest
WSC quantities (2.0 g kg-1 DM) were found. Although its buffering capacity (BC) was
lowest compared to the legumes, SOR had a WSC/BC ratio of only 0.1.
Table 12: Content of water soluble carbohydrates and buffering capacity, their ratio and the
content of starch of Jack bean, cowpea and sorghum grains
Grain
WSC (g kg
-1 DM)
BC (g LA·kg
-1 DM)
WSC/BC
Starch (g kg
-1 DM)
JBN 18.0 90.0 0.2 359
CWP 23.0 63.0 0.4 387
SOR 2.0 31.0 0.1 739
BC, buffering capacity; CWP, cowpea; DM, dry matter; JBN, Jack bean; LA, lactic acid; SOR, sorghum; WSC, water soluble carbohydrates

Results
55
In the legume grains notable quantities of starch were determined. In SOR, like in
most of the cereals, this nutrient was found approximately the two-fold time
(739 g kg-1 DM) compared to JBN and CWP.
5.1.2 Rostock Fermentation Test using Jack bean and cowpea sole or mixed
with sorghum
In RFT of cowpea, inoculation with LAB had a distinct impact on the decrease of pH
(Figure 8 and Table A1 in the appendix). After 14 h, inoculated treatments were
different (P0.05) to treatments without inoculant, but not among them (P>0.05) until
the last measurement (38 h). By addition of molasses a fast decrease of pH was not
achieved. In inoculated treatments, the proportion in which SOR was mixed did not
have any influence. After 38 h the control showed the highest pH (5.50) and no
differences were observed among the not inoculated treatments (P>0.05).
Figure 8: Change of pH during Rostock Fermentation Test for cowpea grains sole or mixed
with sorghum (n=3)
CWP, cowpea; LAB, lactic acid bacteria; MOL, molasses; SOR, sorghum
The analysis of RFT filtrates after 38 h revealed the inoculated treatments as those
with the highest (P<0.05) lactic acid and lowest volatile fatty acids production
compared to the not inoculated variants (Table 13). By contrast, production of ethanol
and NH3 was more pronounced in treatments without inoculation. An additional
source of fermentable carbohydrates did not seem to be compulsory to initiate lactic
acid fermentation, though was the addition of LAB.
3,00
4,00
5,00
6,00
7,00
0 10 20 30 40
pH
(-)
Time (h)
CWP
CWP+MOL
CWP+SOR (20%)
CWP+SOR (24%)
CWP+LAB
CWP+LAB+MOL
CWP+LAB+SOR (20%)
CWP+LAB+SOR (24%)0

Results
56
Table 13: Fermentation parameters of different treatments with cowpea in filtrates of RFT after
38 h incubation (n=3)
Lactic acid Acetic acid Butyric acid Ethanol NH3
(% DM)
1 0.00a ±0.00 1.76f
±0.00 1.64c ±0.16 1.53f
±0.19 0.30f ±0.03
2 2.40c ±0.41 1.41e
±0.11 1.20b ±0.30 0.99e
±0.00 0.24e ±0.01
3 0.22a ±0.12 1.04c
±0.01 1.85c ±0.16 0.52c
±0.06 0.14c ±0.01
4 1.95b ±0.22 1.21d
±0.03 0.93b ±0.26 0.74d
±0.04 0.18d ±0.00
5 6.83f ±0.04 0.67a
±0.00 0.00a ±0.00 0.16a
±0.00 0.07a ±0.00
6 6.85f ±0.14 0.64a
±0.05 0.00a ±0.00 0.15a
±0.00 0.08a ±0.01
7 4.34d ±0.04 0.62a
±0.01 0.00a ±0.00 0.30b
±0.01 0.11b ±0.00
8 4.75e ±0.13 0.81b
±0.05 0.00a ±0.00 0.34b
±0.03 0.14c ±0.00
a,b Mean values with different superscripts in the same column differ significantly (P<0.05).
Treatments: 1, CWP; 2, CWP+MOL; 3, CWP+SOR (20% CP); 4, CWP+SOR (24% CP); 5, CWP+LAB; 6, CWP+MOL+LAB; 7, CWP+SOR+LAB (20% CP); 8, CWP+SOR+LAB (24% CP)
CP, crude protein; CWP, cowpea; LAB, lactic acid bacteria (3·105 cfu·g
-1); MOL, molasses (4 %);
SOR, sorghum
Contrary to cowpea, the effect of an inoculant on the reduction of pH was not
remarkable in Jack bean (Figure 9 and Table A2 in the appendix). Only in the case of
JBN+LAB+SOR a faster (P0.05) pH drop at 14 and 18 h was determined in contrast
to the rest. At the other measurement times no differences (P>0.05) were observed
among treatments until the end of RFT (38 h). Molasses had no effect on the
reduction of pH. Why the expected influence of LAB and molasses on pH reduction
was not observed for JBN deserves further discussion.
Figure 9: Change of pH during Rostock Fermentation Test for Jack bean grains sole or mixed
with sorghum (n=3)
JBN, Jack bean; LAB, lactic acid bacteria; MOL, molasses; SOR, sorghum
3,00
4,00
5,00
6,00
7,00
0 10 20 30 40
pH
(-)
Time (h)
JBN
JBN+MOL
JBN+SOR (20%)
JBN+SOR (24%)
JBN+LAB
JBN+LAB+MOL
JBN+LAB+SOR (20%)
JBN+LAB+SOR (24%)0

Results
57
The lactic acid content in the analyzed filtrates corresponded to the pH curves, as no
outstanding differences were observed among treatments. However, the lactic acid
production was significantly high when LAB was used. The highest content was
measured in JBN+LAB and JBN+MOL+LAB with 3.71 and 4.63 % DM, respectively
(Table 14). Although no LAB was added in JBN+MOL, this treatment produced as
much lactic acid as JBN+LAB+SOR (24 %) with 2.80 and 2.86 % DM, respectively.
The production of unfavorable fermentation parameters like acetic acid, butyric acid,
ethanol and NH3 was generally marginal.
Table 14: Fermentation parameters of different treatments with Jack bean in filtrates of RFT
after 38 h incubation (n=3)
Lactic acid Acetic acid Butyric acid Ethanol NH3
(% DM)
1 2.26a ±0.24 1.14bc
±0.26 0.05 ±0.04 0.34b
±0.04 0.11e ±0.01
2 2.80c ±0.00 1.28c
±0.06 0.01 ±0.03 0.36b
±0.04 0.18f ±0.08
3 2.23a ±0.02 0.83b
±0.03 0.05 ±0.01 0.19a
±0.03 0.07b
±0.01
4 2.36ab ±0.09 0.90b
±0.05 0.03 ±0.01 0.25ab
±0.01 0.08c ±0.00
5 3.71d ±0.06 0.93b
±0.09 ND 0.18a ±0.07 0.09d
±0.00
6 4.63e ±0.07 0.45a
±0.36 0.01 ±0.00 0.15a
±0.00 0.09d ±0.00
7 2.52b ±0.01 0.84b
±0.00 ND 0.19a ±0.02 0.06a
±0.00
8 2.86c ±0.01 1.01bc
±0.00 ND 0.22a ±0.00 0.07b
±0.00
a,b Mean values with different superscripts in the same column differ significantly (P<0.05).
Treatments: 1, JBN; 2, JBN+MOL; 3, JBN+SOR (20% CP); 4, JBN+SOR (24% CP); 5, JBN+LAB; 6, JBN+MOL+LAB; 7, JBN+SOR+LAB (20% CP); 8, JBN+SOR+LAB (24% CP);
CP, crude protein; JBN, Jack bean; LAB, lactic acid bacteria (3·105 cfu·g
-1); MOL, molasses (4 %),
ND, not detected; SOR, sorghum
Results of RFT suggested that LAB should be used for an adequate fermentation in
silages using JBN and CWP. The high DM of the seeds surely limits the growth of the
epiphytic flora that commonly grows in other fresh plant materials with higher
moisture. Mixing with SOR reduced lactic acid production but did not interfere with pH
reduction, which could be attributed to the lower BC of SOR (Table 12). No
appreciable differences were observed due to the different SOR proportions.

Results
58
5.1.3 Model silages with remoistened grains
During the storage period, DM content in JBN silages was slightly reduced with
increasing storage time (P<0.05) but the differences were only marginal among
treatments (Table 15). The pH value was remarkably reduced (P<0.05) in treatments
inoculated with LAB. In general, JBN silages did not show considerable fermentation
losses during storage. However, losses increased (P<0.05) with storage time (0.8,
1.3 and 2.4 % at days 5, 20 and 60, respectively). In general, silages without additive
(JBN and JBN+SOR) showed the highest pH values and fermentation losses.
Outstanding was the case of JBN+SOR with 3.5 % of losses compared to other
treatments.
Table 15: Influence of storage time and treatment on dry matter, pH and fermentation losses of
ensiled remoistened Jack bean grains sole or mixed with sorghum (n=3)
DM
(g kg-1
) pH (-)
Losses1 (%)
Storage time (d)
5 652a 4.99a 0.8a
20 647b 4.68b 1.3b
60 644c 4.56c 2.4c
Ensiling treatment
JBN 649c 5.54a 1.5c
JBN+MOL 653b 5.29b 0.9a
JBN+LAB 641f 4.46d 1.3b
JBN+MOL+LAB 644e 4.38e 1.2b
JBN+SOR 642ef 5.29b 3.5d
JBN+SOR+MOL 657a 4.61c 1.3b
JBN+SOR+LAB 647d 4.20f 1.3b
JBN+SOR+MOL+LAB 651bc 4.19f 1.0a
pooled SD ±2.51 ±0.032 ±0.19
P-values
Storage time (ST) 0.001 0.001 0.001
Ensiling treatment (ET) 0.001 0.001 0.001
ST*ET 0.001 0.001 0.009 a,b
Mean values with different superscripts in the same column differ significantly within each factor (P<0.05). 1 Weight losses in respect to the initial weight.
DM, dry matter; JBN, Jack bean; LAB, lactic acid bacteria; MOL, molasses; SOR, sorghum
There was a similar tendency in the results observed in silages of remoistened CWP
(Table 16). Like in JBN, the addition of LAB resulted in lower pH values after 5, 20

Results
59
and 60 days of storage compared to treatments without inoculant (P<0.05). However,
the lowest pH was achieved when SOR was mixed with CWP (CWP+SOR+LAB and
CWP+SOR+MOL+LAB with 4.18 each, P<0.05). The use of additives reduced
fermentation losses, so that CWP and CWP+SOR showed the highest losses with
2.2 and 3.4 %, respectively (P<0.05).
Table 16: Influence of storage time and treatment on dry matter, pH and fermentation losses of
ensiled remoistened cowpea grains sole or mixed with sorghum (n=3)
DM
(g kg-1
) pH (-)
Losses1 (%)
Storage time (d)
5 647a 5.1a 0.9a
20 643b 4.8b 1.4b
60 647a 4.7c 2.5c
Ensiling treatment
CWP 642b 5.7b 2.4b
CWP+MOL 652e 5.8a 1.0de
CWP+LAB 645c 4.3e 1.0de
CWP+MOL+LAB 644c 4.3e 1.0de
CWP+SOR 638a 5.6c 3.4a
CWP+SOR+MOL 652e 4.9d 1.9c
CWP+SOR+LAB 645c 4.2f 1.1d
CWP+SOR+MOL+LAB 648d 4.2f 0.9e
pooled SD ±2.14 ±0.032 ±0.17
P-values
Storage time (ST) 0.001 0.001 0.001
Ensiling treatment (ET) 0.001 0.001 0.001
ST*ET 0.002 0.001 0.001 a,b
Mean values with different superscripts in the same column differ significantly within each factor (P<0.05). 1 Weight losses in respect to the initial weight.
CWP, cowpea; DM, dry matter; LAB, lactic acid bacteria; MOL, molasses; SOR, sorghum
As shown in Table 17, the content of fermentation products in the filtrates of JBN
silages after 60 days of storage confirm the necessity of LAB to achieve a good
fermentation quality. The highest levels of lactic acid were found in JBN+MOL+LAB,
JBN+LAB and JBN+SOR+MOL+LAB with 5.2, 4.6 and 4.1 % DM, respectively.
Butyric, propionic, valeric and iso-valeric acids were found only in traces ( 1 % DM).

Results
60
Table 17: Fermentation products in model silages of remoistened Jack bean grains after
60 days of storage (n=3)
DM pH LA AC Ethanol Butanediol NH3-N/Ntotal
(%) (-) (% DM) (%)
1 64.2 ±0.08 5.02ab ±0.08 2.1a ±0.05 0.5ab
±0.02 0.8a ±0.07
ND 1.5b ±0.09
2 65.0 ±0.10 4.81a ±0.02 2.5ab ±0.17 0.4b
±0.01 0.2c ±0.02 ND 1.4ab
±0.04
3 64.3 ±0.06 4.44c
±0.03 4.6c ±0.12 0.8c ±0.04 0.2c
±0.01 ND 1.2a ±0.21
4 64.3 ±0.07 4.36cd
±0.05 5.2c ±0.22 0.7ac ±0.05 0.2c
±0.03 ND 1.2a
±0.15
5 63.2 ±0.40 4.96b
±0.02 1.0d ±0.05 0.3b ±0.04 1.1a
±0.02 2.7b ±0.50 3.7d
±0.10
6 64.9 ±0.07 4.49c
±0.00 3.1b ±0.01 0.6acd ±0.01 0.4b
±0.02 0.3ab ±0.02 4.2e
±0.24
7 64.2 ±0.25 4.21d
±0.02 3.6e ±0.01 0.5b ±0.02 0.3bc
±0.06 0.2a ±0.02 1.8c
±0.22
8 64.8 ±0.16 4.19d
±0.02 4.1c ±0.06 0.5bd ±0.03 0.2c
±0.01 0.0a ±0.01 1.5b
±0.01
a,b Mean values with different superscripts in the same column differ significantly (P<0.05).
Treatments: 1, JBN; 2, JBN+MOL; 3, JBN+LAB; 4, JBN+MOL+LAB; 5, JBN+SOR; 6, JBN+SOR+MOL; 7, JBN+SOR+LAB; 8, JBN+SOR+MOL+LAB;
AC, acetic acid; DM, dry matter; JBN, Jack bean; LA, lactic acid; LAB, lactic acid bacteria; MOL, molasses; ND, not detected
In JBN+SOR considerable amounts of ethanol (1.1 % DM) and butanediol (2.7 %
DM) were analyzed, whereas in other treatments contents were much lower ( 1%
DM). The production of N-NH3/Ntotal was only marginal, except in JBN+SOR and
JBN+SOR+MOL with 3.7 and 4.2 % N-NH3/Ntotal, respectively (P<0.05, Table 17).
In CWP silages the use of LAB increased (P0.05) lactic acid as expected (Table
18), whereas in CWP+LAB and CWP+MOL+LAB the highest amounts were
produced with 4.9 and 5.8 % DM, respectively. The content of acetic acid was
generally low ( 0.5 % DM) and butyric acid was detected only in traces in
CWP+MOL, CWP+SOR+MOL and CWP. Propionic, valeric and iso-valeric acids
were not detected.
The production of alcohols was negligible throughout. However, the lowest contents
were found in treatments with addition of LAB. Like JBN+SOR, CWP+SOR showed
the highest production of ethanol and butanediol (1.3 and 2.5 % DM, respectively).
The use of LAB reduced the formation of N-NH3/Ntotal, whereas there was no impact
(P>0.05) if MOL or SOR were included (Table 18). The treatment CWP+SOR
showed the highest proportion of NH3-N of the total N (4.5 %).

Results
61
Table 18: Fermentation products in model silages of remoistened cowpea grains after 60 days
of storage (n=3)
DM pH LA AC Ethanol Butanediol NH3-N/Ntotal
(%) (-) (% DM) (%)
1 64.0 ±0.40 5.28a ±0.05 1.8abe ±0.02 0.2a
±0.04 0.6ab ±0.18
0.7a ±0.08 3.2a
±0.07
2 65.2 ±0.32 5.27a ±0.03 1.7b ±0.09 0.3a
±0.03 0.5a ±0.15 0.1b
±0.03 2.3b ±0.06
3 64.9 ±0.03 4.28bd ±0.02 4.9c ±0.08 0.4b
±0.03 0.2a ±0.00 0.0b
±0.00 1.0cd ±0.03
4 64.6 ±0.30 4.31b ±0.01 5.8d ±0.17 0.5ab
±0.07 0.2a ±0.03 0.0b
±0.00 1.0d ±0.07
5 63.8 ±0.25 5.26a ±0.05 1.4ab ±0.11 0.2a
±0.04 1.3b ±0.14 2.5c
±0.27 4.5e ±0.20
6 65.1±0.39 4.67c ±0.02 2.8e ±0.19 0.3a
±0.03 0.4a ±0.10 0.9a
±0.12 3.9ae ±0.19
7 64.8 ±0.44 4.19d ±0.00 3.6f ±0.16 0.4ab
±0.04 0.3a ±0.03 0.1b
±0.02 1.7c ±0.13
8 65.2 ±0.04 4.18d ±0.01 3.7f ±0.19 0.3ab
±0.03 0.2a ±0.02 0.0b
±0.01 1.4cd ±0.12
a,b Mean values with different superscripts in the same column differ significantly (P<0.05).
Treatments: 1, CWP; 2, CWP+MOL; 3, CWP+LAB; 4, CWP+MOL+LAB; 5, CWP+SOR; 6, CWP+SOR+MOL; 7, CWP+SOR+LAB; 8, CWP+SOR+MOL+LAB
AC, acetic acid; CWP, cowpea; DM, dry matter; LA, lactic acid; LAB, lactic acid bacteria; MOL, molasses
5.1.4 Anti-nutritional factors in silages of remoistened grains
For the determination of selected ANF only the four treatments with the best
fermentation results were selected (LEG+LAB, LEG+MOL+LAB, LEG+SOR+LAB
and LEG+SOR+MOL+LAB), as in those treatments a reduction of ANF was
expected.
5.1.4.1 Trypsin inhibitory activity (TIA)
After 60 days of storage, TIA in JBN silages was reduced (P0.05) compared to the
raw (not ensiled) plant material (Table 19). However, a slight increase was observed
from day 5 to 60 (except JBN+MOL+LAB), suggesting that the highest reduction
takes place during the first 5 days of ensiling. In JBN+LAB and JBN+MOL+LAB after
5 days a reduction of 44 and 29 %, respectively, was observed. Between day 5 and
60 TIA increased by 4 % in JBN+LAB but not in JBN+MOL+LAB, where a
subsequent reduction of 17 % was observed. In silages mixed with SOR, the highest
reduction of TIA likewise took place in the first 5 storage days (25 % for
JBN+SOR+LAB and 29 % for JBN+SOR+MOL+LAB). An increase of approximately
11 % was detected between day 5 and 60 in both treatments (Table 19).

Results
62
Table 19: Trypsin inhibitory activity (mg TI·g-1
DM) in silages of remoistened Jack bean and
cowpea sole or mixed with sorghum (n=3)
Grain
Storage
Time*
(d)
Treatments
3 4 7 8
JBN
01 59.73
a ±0.52 59.73
a ±0.52 25.98
a ±0.39 25.98
a ±0.39
5 33.51b ±0.38 42.65
b ±0.55 19.53
b ±0.38 18.55
b ±0.96
20 35.95c ±0.08 34.32
c ±1.21 22.49
c ±0.58 21.88
c ±1.07
60 35.06c ±0.99 35.27
c ±0.60 22.03
c ±0.49 20.78
c ±1.37
CWP
01 140.55
a ±0.30 140.55
a ±0.30 71.98
a ±0.16 71.98
a ±0.16
5 79.06b ±0.66 75.19
b ±0.71 36.61
b ±1.16 36.05
b ±0.74
20 47.76c ±0.39 47.43
c ±0.76 18.17
c ±0.63 17.21
c ±0.20
60 32.35d ±0.19 35.79
d ±1.39 15.36
d ±0.67 14.16
d ±0.15
a,b Mean values with different superscripts in the same column differ significantly for each grain (P<0.05).
1 Raw legume (JBN or CWP) for treatments 3 and 4, raw legume and sorghum mixture to reach 18 % CP
in the DM for treatments 7 and 8. Treatments: 3, LEG+LAB; 4, LEG+MOL+LAB; 7, LEG+SOR+LAB; 8, LEG+SOR+MOL+LAB CP, crude protein; CWP, cowpea; DM, dry matter; JBN, Jack bean; LAB, lactic acid bacteria; MOL, molasses; SOR, sorghum; TI, trypsin inhibited *Storage times set in correspondence to silage phases.
A marked reduction (P0.05) in TIA was observed in silages with CWP (Table 19),
whereas in CWP+LAB and CWP+MOL+LAB the reduction reached 77 and 75 %,
respectively. A reduction of 79 and 80 % was detected in CWP+SOR+LAB and
CWP+SOR+MOL+LAB, respectively. Contrary to JBN silages, the progressive
increase of the storage time corresponds to a decreasing TIA.
5.1.4.2 Hydrogen cyanide (HCN)
In contrast to the expected effect of ensilage, HCN increased from day 0 to day 60 of
storage in all treatments under evaluation in both legumes (Table 20) except in
JBN+LAB and JBN+MOL+LAB, where a reduction of 17 and 25 %, respectively, was
achieved (P0.05).

Results
63
Table 20: Hydrogen cyanide (mg·100 g-1
DM) in silages of remoistened Jack bean or cowpea
sole or mixed with sorghum (n=3)
Grain
Storage
time
(d)
Treatments
3 4 7 8
JBN
01 80.48
a ±0.28 80.48
a ±0.28 39.58
a ±0.20 39.58
a ±0.20
60 66.85b ±0.76 60.51
b ±0.56 48.95
b ±0.65 47.74
b ±0.54
CWP
01 8.57
a ±0.18 8.57
a ±0.18 7.47
a ±0.02 7.47
a ±0.02
60 25.46b ±0.37 26.87
b ±0.94 33.03
b ±0.60 32.16
b ±0.58
a,b Mean values with different superscripts in the same column differ significantly for each grain (P<0.05).
1 Raw legume (JBN or CWP) for treatments 3 and 4, raw legume and SOR mixture to reach 18 % crude protein in DM for treatments 7 and 8.
Treatments: 3, LEG+LAB; 4, LEG+MOL+LAB; 7, LEG+SOR+LAB; 8, LEG+SOR+MOL+LAB CP, crude protein; CWP, cowpea; DM, dry matter; JBN, Jack bean; LAB, lactic acid bacteria; MOL, molasses; SOR, sorghum
5.1.4.3 Canavanine
Increasing the storage time contributed to a reduction of canavanine in silages
compared to the not ensiled plant material (P0.05). The lower content of canavanine
at day 0 in JBN+SOR+LAB and JBN+SOR+MOL+LAB compared to the other two
treatments was due to the absence of this ANF in SOR. After 60 days of ensilage, a
reduction of 9 and 22 % was achieved in JBN+LAB and JBN+MOL+LAB,
respectively. In the treatments JBN+SOR+LAB and JBN+SOR+MOL+LAB
canavanine was reduced by 23 and 25 %, respectively (Table 21).
Table 21: Canavanine (g·100 g-1
DM) in silages of remoistened Jack bean sole or mixed with
sorghum (n=3)
Storage time
(d)
Treatments
3 4 7 8
01 3.91
a ±0.04 3.91
a ±0.04 1.87
a ±0.02 1.87
a ±0.02
5 3.97a ±0.04 3.65
b ±0.04 1.55
b ±0.04 1.49
c ±0.02
20 3.83b ±0.04 3.48
c ±0.03 1.52
b ±0.02 1.54
b ±0.00
60 3.55c ±0.01 3.07
d ±0.04 1.45
c ±0.01 1.41
d ±0.02
a,b Mean values with different superscripts in the same column differ significantly (P<0.05).
1 Raw JBN for treatments 3 and 4, raw JBN and sorghum mixture to reach 18 % CP in DM for treatments 7 and 8.
Treatments: 3, JBN+LAB; 4, JBN+MOL+LAB; 7, JBN+SOR+LAB; 8, JBN+SOR+MOL+LAB CP, crude protein; DM, dry matter; JBN, Jack bean; LAB, lactic acid bacteria; MOL, molasses; SOR, sorghum

Results
64
5.2 Silages of soaked Jack bean and cowpea grains sole or mixed with
sorghum
Although it was proved that selected silage treatments of remoistened grains of JBN
and CWP have the potential for a good fermentation quality, it was assumed that
those results could still be improved. For that reason, soaking was tested as a pre-
ensiling treatment. The main focus was on the possibility to reduce the buffering
capacity or to increase water soluble carbohydrates, which would have a direct
influence on the ensilability and hence on the fermentation quality. Furthermore, an
effect on the reduction of the assessed ANF was expected.
5.2.1 Soaking
In JBN (Table 22), soaking time influenced (P0.001) the BC of the grains, whereas
BC decreased with increasing soaking time.
Table 22: Effect of soaking time and grain:water ratio (w/v) on buffering capacity, dry matter,
crude protein and ash in Jack bean grains (n=3)
BC
(g LA·kg-1
DM) DM
(g kg-1
) CP
(g kg-1
DM) Ash
(g kg-1
DM)
Soaking time (h)
0 84.9a 872
a 274 33.0
a
18 59.0b 386
b 294 31.2
b
24 58.2c 379
c 293 33.1
a
30 57.7d 376
d 294 31.0
b
Ratio (grain:water [w/v)
01 84.9
a 872
a 274
a 33.1
a
1:2 61.6b 385
b 290
b 32.2
b
1:3 60.3c 380
c 297
b 31.7
bc
1:4 54.8d 378
cd 297
b 31.2
c
1:5 56.4e 377
d 291
b 33.3
a
pooled SD ±0.316 ±2.28 ±0.623 ±0.84
P-values
Soaking time 0.001 0.001 0.819 0.001
Ratio 0.001 0.001 0.023 0.001
Soaking time*Ratio 0.001 0.814 0.335 0.001 a,b
Mean values with different superscripts in the same column differ significantly within each factor (P<0.05). 1 Not soaked Jack bean grains.
BC, buffering capacity; CP, crude protein; DM, dry matter; LA, lactic acid

Results
65
There was as well an effect of the grain:water ratio (P<0.001) on the BC, as BC was
reduced gradually from 0 to 1:4, although it slightly increased again for the ratio 1:5.
At all soaking times DM was drastically reduced. Presumably, the water passing
through the testa was trapped in the interstitial tissue and cells increased moisture,
as there was an obvious increase of the seeds’ volume.
The CP was increased after soaking (P<0.05), independent of the soaking time and
grain:water ratio. In the case of ash there was a contrary effect. Likewise BC, the
longer the time of soaking, the more the content of total ash was reduced with the
exception that after 24 h a small increase (P0.05) was observed compared to 18 h.
The highest reduction (32 %) occurred after 30 h. The grain:water ratio as well
caused changes in the content of ash. The more water was added the lower was the
ash content in the seeds, although this was observed only until a grain:water ratio of
1:4. At the ratio of 1:5 ash increased (33.3 g kg-1 DM) to the same values determined
in the raw material (33.0 g kg-1 DM).
The influence of soaking in CWP followed a similar tendency like in JBN (Table 23).
Table 23: Effect of soaking time and grain:water ratio (w/v) on buffering capacity, dry matter,
crude protein and ash in cowpea (n=3)
BC
(g LA·kg-1
DM) DM
(g kg-1
) CP
(g kg-1
DM) Ash
(% DM)
Soaking time (h)
0 61.2a 890
a 243 38.2
a
18 34.7b 411
b 255 27.1
b
24 33.2c 415
c 256 25.2
c
30 32.7d 416
c 255 23.4
d
Ratio (grain:water [w/v)
01 61.2
a 890
a 243
a 38.2
a
1:2 38.9b 416
b 257
b 29.1
b
1:3 32.8c 417
b 254
c 24.2
c
1:4 31.7d 411
c 254
c 24.4
c
1:5 30.5e 411
c 255
c 22.0
d
pooled SD ±0.316 ±2.98 ±1.55 ±0.84
P-values
Soaking time 0.001 0.001 0.164 0.001
Ratio 0.001 0.001 0.001 0.001
Soaking time*Ratio 0.001 0.492 0.444 0.001 a,b
Mean values with different superscripts in the same column differ significantly within each factor (P<0.05). 1 Not soaked cowpea grains.
BC, buffering capacity; DM, dry matter; CP, crude protein; LA, lactic acid

Results
66
With increasing soaking time of CWP the DM content decreased (P<0.001), whereas
CP increased (P>0.05). Likewise, BC and the content of ash were reduced (P0.001)
with increasing soaking time and grain:water ratio. From 0 to 30 h soaking, BC and
ash were reduced from 61.2 to 32.7 g LA·kg-1 DM and 38.2 to 23.4 g kg-1 DM,
respectively. With increasing grain:water ratio (from 0 to 1:5), BC and ash were
decreased (P0.001) from 61.2 to 30.5 g LA·kg-1 DM and 38.2 to 22.0 g kg-1 DM,
respectively.
It was feared that soaking would have a negative effect on the content of key
minerals. Indeed, this pre-ensiling treatment affected most of the selected minerals in
soaked grains compared to the unprocessed plant material (Table 24).
Table 24: Content of selected minerals in raw and soaked beans after different soaking
treatments (n=4)
Ca P Na K Cl Mg
(g·kg
-1 DM)
JBN (raw, n=1) 1.70 4.65 0.93 12.26 0.64 1.51
JBN (1:4/24h)1 1.63 ±0.01
4.27 ±0.07
1.01 ±0.01
11.04a ±0.09
0.76a ±0.06
1.44a ±0.09
JBN (1:4/30h)1 1.67 ±0.07
4.25 ±0.29
1.00 ±0.06
10.43b ±0.25
0.65b ±0.05
1.41b ±0.03
CWP (raw, n=1) 0.93 5.76 1.00 13.90 0.32 2.26
CWP (1:4/24h)1 0.76 ±0.01
4.06 ±0.18
0.98a ±0.02
7.14a ±0.06
0.12 ±0.00
1.40a ±0.02
CWP (1:5/30h)1 0.75 ±0.02
3.88 ±0.29
0.92b ±0.05
5.73b ±0.15
0.12 ±0.00
1.31b ±0.06
a,b Mean values with different superscripts in the same column differ significantly within each grain (P<0.05).
1grain:water ratio (w/v) and soaking time (h)
CWP, cowpea; JBN, Jack bean
Soaking treatments were selected in accordance to their impact on the buffering capacity reduction.
5.2.2 Model silages with soaked legume grains
In accordance with the results obtained in the soaking trial (see 5.2.1), JBN and CWP
grains were soaked for 24 h at a grain:water ratio of 1:4, although a higher reduction
of the BC was achieved at 30 h and a ratio of 1:5. However, the conditions were
selected following practical reasons and with respect to a future on-farm application,
mainly in order to save time and water.
Selected chemical characteristics of JBN and CWP after soaking in tap water and
their mixtures with SOR are presented in Table 25.

Results
67
Table 25: Selected chemical characteristics of soaked (24 h at 1:4 [w/v) Jack bean and
cowpea grains sole or mixed with sorghum used for model silages
Grains
DM
(g kg-1)
CP
(g kg-1 DM)
BC
(g LA·kg-1
DM)
JBN 426.0 280.5 53.8
CWP 445.6 253.5 41.5
JBN+SOR1 592.8 178.3 34.0
CWP+SOR1 585.3 175.7 28.0
1 Mixtures were prepared from soaked beans and not soaked SOR to reach 180 g kg
-1 CP in DM.
BC, buffering capacity; CP, crude protein; CWP, cowpea; DM, dry matter; JBN, Jack bean; LA, lactic acid; SOR, sorghum
The contamination of the grains with harvest residues, which could not be removed
completely due to the high amounts needed for the experiment and the quality of the
water (tap water) used compared to the deionized water used in the soaking trials
could be among the reasons why BC differs from the soaking experiment (see 5.2.1).
The DM of soaked JBN silages was not affected by the storage time and the
differences observed among treatments were mainly associated to the use of SOR in
mixed silages, which increased DM (Table 26).
Table 26: Influence of storage time and treatment on dry matter, pH and fermentation losses of
ensiled soaked Jack bean grains sole or mixed with sorghum (n=3)
DM
(g kg-1
) pH (-)
Losses1 (%)
Storage time (d)
5 480 4.40a 0.6a
20 480 4.41a 1.3b
60 481 4.61b 2.7c
Ensiling treatment
JBN 403b 5.04a 1.8b
JBN+MOL 415c 4.37d 1.6c
JBN+LAB 398a 4.95b 2.0a
JBN+MOL+LAB 413c 4.22e 1.6c
JBN+SOR 575d 4.54c 1.4d
JBN+SOR+LAB 575d 4.09f 1.3e
JBN+SOR+MOL+LAB 583e 4.11f 1.1f
pooled SD ±5.64 ±0.032 ±0.19
P-values
Storage time (ST) 0.873 0.001 0.001
Ensiling treatment (ET) 0.001 0.001 0.001
ST*ET 0.014 0.001 0.001 a,b
Mean values with different superscripts in the same column differ significantly within each factor (P<0.05). 1 Weight losses in respect to the initial weight. DM, dry matter; JBN, Jack bean; LAB, lactic acid bacteria; MOL, molasses; SOR, sorghum
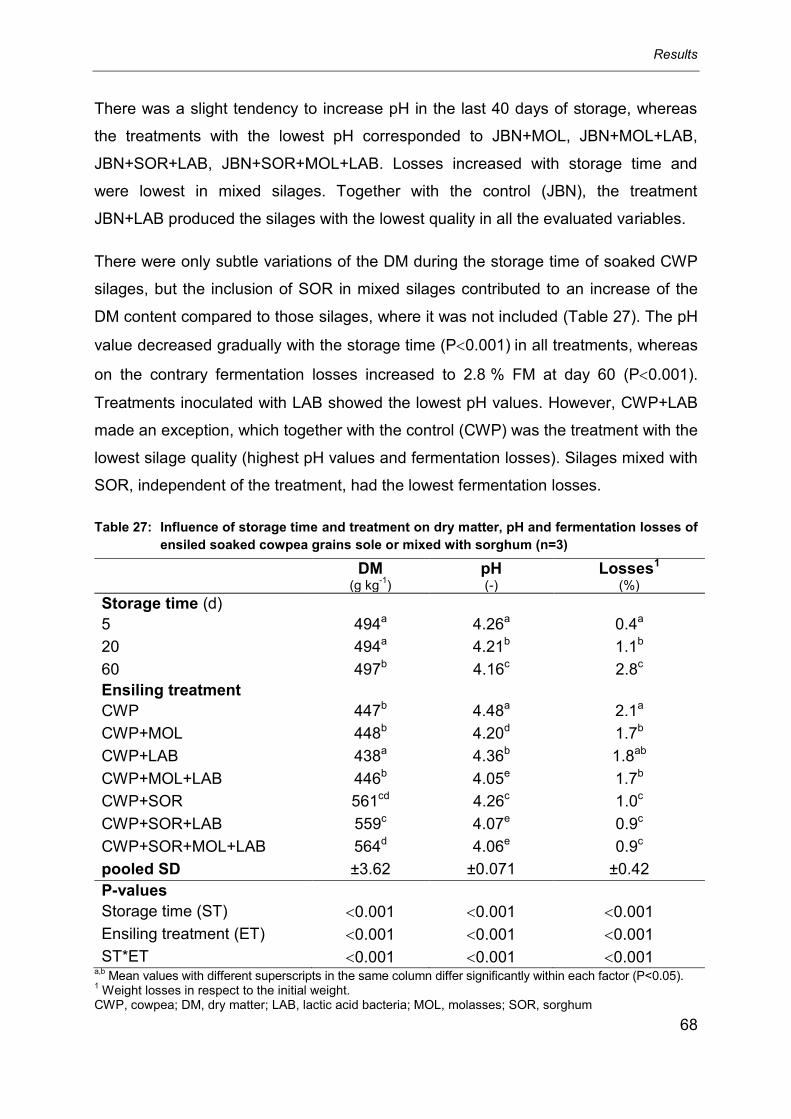
Results
68
There was a slight tendency to increase pH in the last 40 days of storage, whereas
the treatments with the lowest pH corresponded to JBN+MOL, JBN+MOL+LAB,
JBN+SOR+LAB, JBN+SOR+MOL+LAB. Losses increased with storage time and
were lowest in mixed silages. Together with the control (JBN), the treatment
JBN+LAB produced the silages with the lowest quality in all the evaluated variables.
There were only subtle variations of the DM during the storage time of soaked CWP
silages, but the inclusion of SOR in mixed silages contributed to an increase of the
DM content compared to those silages, where it was not included (Table 27). The pH
value decreased gradually with the storage time (P0.001) in all treatments, whereas
on the contrary fermentation losses increased to 2.8 % FM at day 60 (P0.001).
Treatments inoculated with LAB showed the lowest pH values. However, CWP+LAB
made an exception, which together with the control (CWP) was the treatment with the
lowest silage quality (highest pH values and fermentation losses). Silages mixed with
SOR, independent of the treatment, had the lowest fermentation losses.
Table 27: Influence of storage time and treatment on dry matter, pH and fermentation losses of
ensiled soaked cowpea grains sole or mixed with sorghum (n=3)
DM
(g kg-1
) pH (-)
Losses1 (%)
Storage time (d)
5 494a 4.26a 0.4a
20 494a 4.21b 1.1b
60 497b 4.16c 2.8c
Ensiling treatment
CWP 447b 4.48a 2.1a
CWP+MOL 448b 4.20d 1.7b
CWP+LAB 438a 4.36b 1.8ab
CWP+MOL+LAB 446b 4.05e 1.7b
CWP+SOR 561cd 4.26c 1.0c
CWP+SOR+LAB 559c 4.07e 0.9c
CWP+SOR+MOL+LAB 564d 4.06e 0.9c
pooled SD ±3.62 ±0.071 ±0.42
P-values
Storage time (ST) 0.001 0.001 0.001
Ensiling treatment (ET) 0.001 0.001 0.001
ST*ET 0.001 0.001 0.001 a,b
Mean values with different superscripts in the same column differ significantly within each factor (P<0.05). 1 Weight losses in respect to the initial weight.
CWP, cowpea; DM, dry matter; LAB, lactic acid bacteria; MOL, molasses; SOR, sorghum

Results
69
Analysis of the fermentation quality of soaked JBN silages (Table 28) showed, that
the lowest pH values for silages without SOR in the mix were achieved in the
treatments JBN+MOL (4.36) and JBN+MOL+LAB (4.23). A pH value above 5 was
found in JBN+LAB (5.40), which was similar to the control (JBN, 5.51). In silages
mixed with SOR, the lowest pH values were determined in JBN+SOR+LAB (4.08)
and JBN+SOR+MOL+LAB (4.10).
Table 28: Fermentation products determined in model silages of soaked jack bean grains after
60 days of storage (n=3)
DM
(%)
pH
(-)
LA AC BA Ethanol Propanol
(% DM)
1 40.1a
±0.57 5.51c
±0.39 0.7a
±1.46 1.1b
±0.62 2.2b
±1.50 0.7d
±0.02 0.04d
±0.01
2 41.8b
±0.14 4.36b
±0.03 5.7d
±0.14 0.7a
±0.05 0.0a
±0.02 0.7d
±0.08 0.00a
±0.00
3 39.4a
±0.09 5.40c
±0.09 0.1a
±0.09 0.9ab
±0.26 2.9b
±0.31 0.7cd
±0.05 0.07e
±0.01
4 42.1b
±0.11 4.23ab
±0.01 6.6e
±0.13 0.8ab
±0.04 0.0a
±0.01 0.6bc
±0.03 0.03c
±0.00
5 57.2c
±0.42 4.45b
±0.05 2.6b
±0.25 0.9ab
±0.07 0.0a
±0.00 0.8e
±0.02 0.03c
±0.00
6 57.6cd
±0.33 4.08a
±0.01 3.9c
±0.15 0.5a
±0.03 0.0a
±0.00 0.6b
±0.03 0.02c
±0.00
7 58.0d
±1.00 4.10a
±0.00 4.2c
±0.06 0.6a
±0.07 0.0a
±0.00 0.3a
±0.03 0.01b
±0.00 a,b
Mean values with different superscripts in the same column differ significantly (P<0.05). Treatments: 1, JBN; 2, JBN+MOL; 3, JBN+LAB; 4, JBN+MOL+LAB; 5, JBN+SOR; 6, JBN+SOR+LAB;
7, JBN+SOR+MOL+LAB AC, acetic acid; BA, butyric acid; DM, dry matter; JBN, Jack bean; LA, lactic acid; LAB, lactic acid bacteria; MOL, molasses; SOR, sorghum
The highest lactic acid production was generally associated with the treatments with
the lowest pH values. Interestingly, JBN+MOL and JBN+MOL+LAB showed the
highest lactic acid production among all treatments with 5.7 and 6.6 % DM,
respectively, although in JBN+SOR+LAB and JBN+SOR+MOL+LAB with only 3.91
and 4.2 % lactic acid in the DM, respectively, the lowest pH values were determined
among all treatments (4.08 and 4.10, respectively). This finding could be attributed to
the differences in the increase of DM and BC reduction by the addition of SOR.
The production of volatile fatty acids (VFA) and alcohols was meager for most of the
treatments. However, apart from the control treatment (JBN), JBN+LAB was
characterized by a low fermentation quality due to its high content of butyric acid
(2.9 % DM). Butanediol, propionic, valeric and iso-valeric acids were not detected in
any treatment.
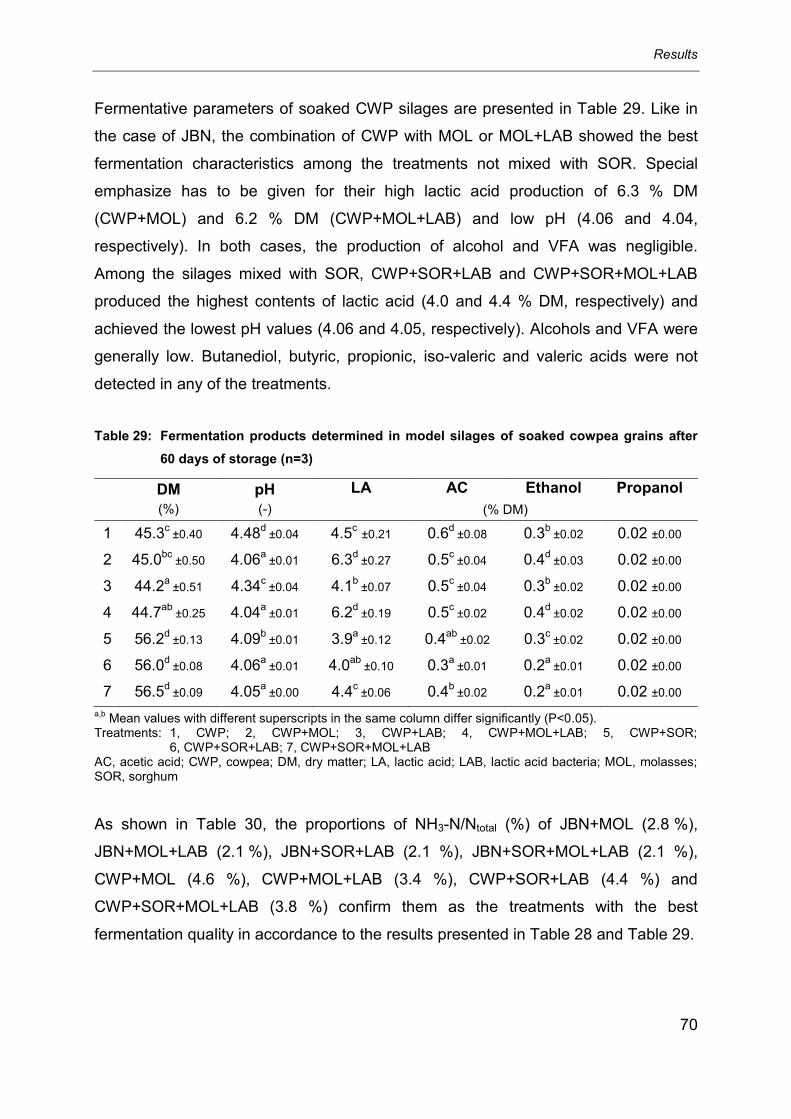
Results
70
Fermentative parameters of soaked CWP silages are presented in Table 29. Like in
the case of JBN, the combination of CWP with MOL or MOL+LAB showed the best
fermentation characteristics among the treatments not mixed with SOR. Special
emphasize has to be given for their high lactic acid production of 6.3 % DM
(CWP+MOL) and 6.2 % DM (CWP+MOL+LAB) and low pH (4.06 and 4.04,
respectively). In both cases, the production of alcohol and VFA was negligible.
Among the silages mixed with SOR, CWP+SOR+LAB and CWP+SOR+MOL+LAB
produced the highest contents of lactic acid (4.0 and 4.4 % DM, respectively) and
achieved the lowest pH values (4.06 and 4.05, respectively). Alcohols and VFA were
generally low. Butanediol, butyric, propionic, iso-valeric and valeric acids were not
detected in any of the treatments.
Table 29: Fermentation products determined in model silages of soaked cowpea grains after
60 days of storage (n=3)
DM
(%)
pH
(-)
LA AC Ethanol Propanol
(% DM)
1 45.3c
±0.40 4.48d
±0.04 4.5c ±0.21 0.6
d ±0.08 0.3
b ±0.02 0.02 ±0.00
2 45.0bc
±0.50 4.06a
±0.01 6.3d
±0.27 0.5c
±0.04 0.4d
±0.03 0.02 ±0.00
3 44.2a
±0.51 4.34c
±0.04 4.1b
±0.07 0.5c
±0.04 0.3b
±0.02 0.02 ±0.00
4 44.7ab
±0.25 4.04a
±0.01 6.2d
±0.19 0.5c
±0.02 0.4d
±0.02 0.02 ±0.00
5 56.2d
±0.13 4.09b
±0.01 3.9a
±0.12 0.4ab
±0.02 0.3c
±0.02 0.02 ±0.00
6 56.0d
±0.08 4.06a
±0.01 4.0ab
±0.10 0.3a
±0.01 0.2a
±0.01 0.02 ±0.00
7 56.5d
±0.09 4.05a
±0.00 4.4c
±0.06 0.4b
±0.02 0.2a
±0.01 0.02 ±0.00
a,b Mean values with different superscripts in the same column differ significantly (P<0.05).
Treatments: 1, CWP; 2, CWP+MOL; 3, CWP+LAB; 4, CWP+MOL+LAB; 5, CWP+SOR; 6, CWP+SOR+LAB; 7, CWP+SOR+MOL+LAB
AC, acetic acid; CWP, cowpea; DM, dry matter; LA, lactic acid; LAB, lactic acid bacteria; MOL, molasses; SOR, sorghum
As shown in Table 30, the proportions of NH3-N/Ntotal (%) of JBN+MOL (2.8 %),
JBN+MOL+LAB (2.1 %), JBN+SOR+LAB (2.1 %), JBN+SOR+MOL+LAB (2.1 %),
CWP+MOL (4.6 %), CWP+MOL+LAB (3.4 %), CWP+SOR+LAB (4.4 %) and
CWP+SOR+MOL+LAB (3.8 %) confirm them as the treatments with the best
fermentation quality in accordance to the results presented in Table 28 and Table 29.

Results
71
Table 30: Ammonia production (% NH3-N/Ntotal) in model silages with soaked grains after 60
days of storage (n=3)
Grain Treatments
1 2 3 4 5 6 7
JBN 7.7e
±0.14 2.8b
±0.19 7.1d
±0.20 2.1a
±0.11 4.0c
±0.40 2.1a
±0.10 2.1a
±0.03
CWP 6.7e
±0.36 4.6c
±0.13 5.8d
±0.13 3.4a
±0.08 5.8d
±0.24 4.4c
±0.10 3.8b
±0.06 a,b
Mean values with different superscripts in the same row differ significantly (P<0.05). Treatments: 1, LEG; 2, LEG+MOL; 3, LEG+LAB; 4, LEG+MOL+LAB; 5, LEG+SOR; 6, LEG+SOR+LAB;
7, LEG+SOR+MOL+LAB CWP, cowpea; DM, dry matter; JBN, Jack bean; LAB, lactic acid bacteria; LEG, legume grain (CWP or JBN); MOL, molasses; SOR, sorghum
5.2.3 Anti-nutritional factors in silages of soaked legume grains
5.2.3.1 Trypsin inhibitory activity (TIA)
The combination of soaking and ensiling did not produce the expected effect on TIA
in silage treatments of JBN. In the case of JBN+MOL and JBN+MOL+LAB the TIA
was significantly reduced during soaking by 22 %. However, an increase was found
afterwards during ensiling. At day 60, in both treatments TIA was increased by
approximately 30 % compared to the raw grains. Soaking followed by ensiling
increased as well TIA in JBN+SOR+LAB and JBN+SOR+MOL+LAB (Table 31).
Table 31: Trypsin inhibitory activity (mg TI·g
-1 DM) in four silage treatments of soaked Jack
bean and cowpea sole or mixed with sorghum during three storage periods (n=3)
Grain
Storage time (d)
Treatments
2 4 6 7
JBN
Raw1 35.35a ±0.28 35.35a ±0.28 19.93a ±0.00 19.93a ±0.00
Soaked2 27.44b ±0.08 27.44b ±0.08 23.16b ±0.77 23.16b ±0.77
5 31.09c ±0.59 39.01c ±0.69 21.35c ±0.50 22.94b ±0.53
20 32.97d ±0.94 32.61d ±1.23 25.48d ±0.43 25.07c ±0.10
60 45.81e ±0.57 41.58e ±0.78 28.08e ±0.47 23.08b ±0.47
CWP
Raw1 58.16a ±0.28 58.16a ±0.28 35.89a ±0.00 35.89a ±0.00
Soaked2 42.27b ±0.53 42.27b ±0.53 31.90b ±0.19 31.90b ±0.19
5 42.55b ±1.74 60.77c ±0.30 33.03c ±0.48 29.68c ±1.10
20 37.41c ±1.30 39.99b ±0.80 21.71d ±0.34 22.85d ±1.10
60 28.63d ±1.26 29.91d ±1.38 23.14e ±0.22 23.16d ±0.31 a,b
Mean values with different superscripts in the same column differ significantly within each grain (P<0.05). 1
Raw LEG for treatments 2 and 4, raw LEG and sorghum mixture to reach 18 % CP in the DM for treatments 6 and 7.
2 Soaked LEG for 24 h and 1:4 grain:water ratio for treatments 2 and 4, soaked LEG for 24 h and 1:4 grain:water ratio mixed with SOR to reach 18 % CP in DM for treatments 6 and 7.
Treatments: 2, LEG+MOL; 4, LEG +MOL+LAB; 6, LEG+SOR+LAB; 7, LEG+SOR+MOL+LAB CWP, cowpea; DM, dry matter; JBN, Jack bean; LAB, lactic acid bacteria; LEG, legume grain (CWP or JBN); MOL, molasses; SOR, sorghum; TI, trypsin inhibited

Results
72
The effect of soaking in combination with ensiling produced a reduction of TIA by
approximately 50 % in the treatments CWP+MOL and CWP+MOL+LAB after 60 days
of storage time. However, the increase of TIA (approx. 5 %) in CWP+MOL+LAB after
5 days of ensilage compared to raw CWP was unexpected. In CWP+SOR+LAB and
CWP+SOR+MOL+LAB TIA was reduced by 35 % after 60 days of storage. Thereby,
there was no significant TIA reduction in CWP+SOR+MOL+LAB between days 20
and 60 (Table 31).
5.2.3.2 Hydrogen cyanide (HCN)
Ensiling of soaked JBN had a significant (P<0.05) effect on the HCN content (Table
32). In every studied treatment soaking had a negative effect on this parameter.
Although the content of HCN increased during soaking ensiling produced a reduction
after the first 5 days of storage with the highest reduction in JBN+MOL (23 %) and
JBN+MOL+LAB (27 %). Between day 5 and 60 of ensilage differences were only
small.
Table 32: Hydrogen cyanide (mg·100 g-1
DM) in four silage treatments of soaked Jack bean
and cowpea sole or mixed with sorghum during three storage periods (n=3)
Grain
Storage time
(d)
Treatments
2 4 6 7
JBN
Raw1 104.24a ±0.80 104.24a ±0.80 56.82a ±0.00 56.82a ±0.00
Soaked2 109.07b ±2.78 109.07b ±2.78 77.95b ±0.11 77.95b ±0.11
5 80.21c ±1.84 76.65c ±1.13 64.94c ±2.47 76.34b ±2.06
20 75.06d ±1.46 87.86d ±1.22 63.16c ±1.13 83.48c ±1.24
60 76.76d ±1.59 77.13c ±0.89 62.29c ±2.30 60.94d ±3.22
CWP
Raw1 34.02a ±1.29 34.02a ±1.29 24.72a ±0.00 24.72a ±0.00
Soaked2 41.31b ±1.05 41.31b ±1.05 36.08b ±0.13 36.08b ±0.13
5 37.63c ±2.57 38.11c ±0.39 32.66c ±0.69 25.55a ±0.64
20 38.63c ±0.73 34.53d ±1.63 32.33cd ±2.03 23.98a ±1.68
60 37.08c ±0.96 30.49e ±1.25 30.55d ±0.72 25.03a ±0.82 a,b
Mean values with different superscripts in the same column differ significantly within each grain (P<0.05). 1
Raw LEG for treatments 2 and 4, raw LEG and sorghum mixture to reach 18 % CP in the DM for treatments 6 and 7.
2 Soaked LEG for 24 h and 1:4 grain:water ratio for treatments 2 and 4, soaked LEG for 24 h and 1:4 grain:water ratio mixed with SOR to reach 18 % CP in DM for treatments 6 and 7.
Treatments: 2, LEG+MOL; 4, LEG +MOL+LAB; 6, LEG+SOR+LAB; 7, LEG+SOR+MOL+LAB CWP, cowpea; DM, dry matter; JBN, Jack bean; LAB, lactic acid bacteria; LEG, legume grain (CWP or JBN); MOL, molasses; SOR, sorghum
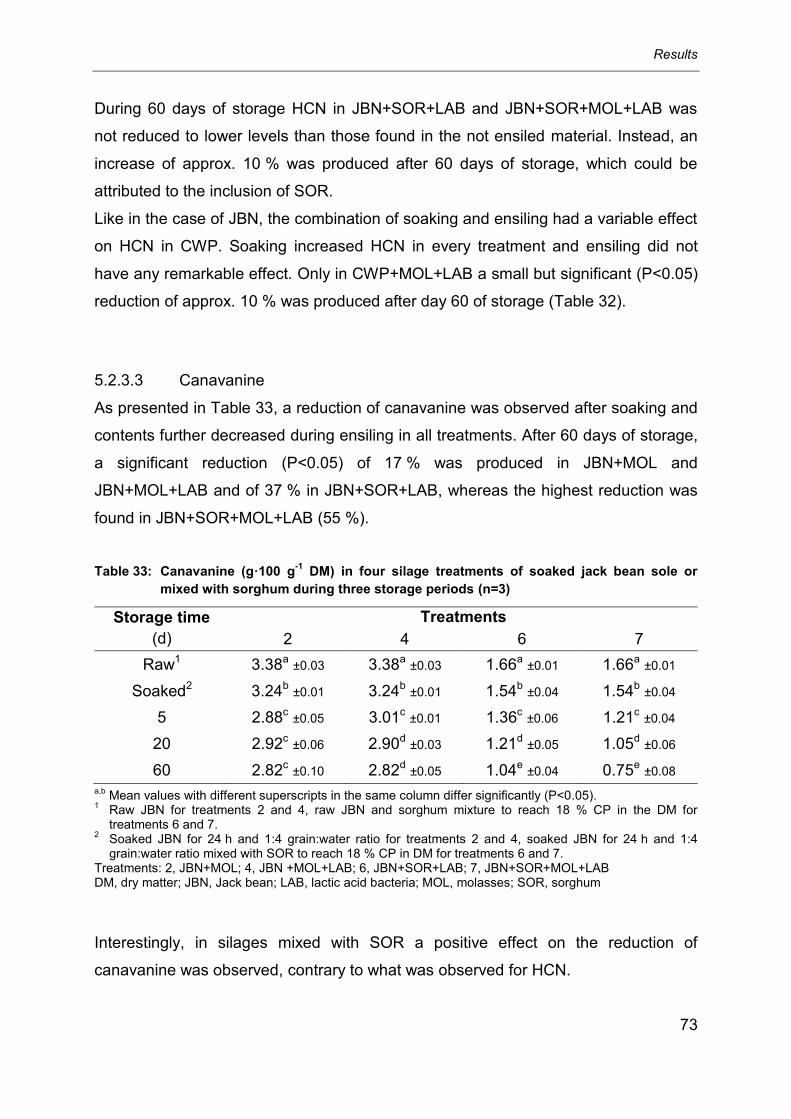
Results
73
During 60 days of storage HCN in JBN+SOR+LAB and JBN+SOR+MOL+LAB was
not reduced to lower levels than those found in the not ensiled material. Instead, an
increase of approx. 10 % was produced after 60 days of storage, which could be
attributed to the inclusion of SOR.
Like in the case of JBN, the combination of soaking and ensiling had a variable effect
on HCN in CWP. Soaking increased HCN in every treatment and ensiling did not
have any remarkable effect. Only in CWP+MOL+LAB a small but significant (P<0.05)
reduction of approx. 10 % was produced after day 60 of storage (Table 32).
5.2.3.3 Canavanine
As presented in Table 33, a reduction of canavanine was observed after soaking and
contents further decreased during ensiling in all treatments. After 60 days of storage,
a significant reduction (P<0.05) of 17 % was produced in JBN+MOL and
JBN+MOL+LAB and of 37 % in JBN+SOR+LAB, whereas the highest reduction was
found in JBN+SOR+MOL+LAB (55 %).
Table 33: Canavanine (g·100 g-1
DM) in four silage treatments of soaked jack bean sole or
mixed with sorghum during three storage periods (n=3)
Storage time
(d)
Treatments
2 4 6 7
Raw1 3.38a ±0.03 3.38a ±0.03 1.66a ±0.01 1.66a ±0.01
Soaked2 3.24b ±0.01 3.24b ±0.01 1.54b ±0.04 1.54b ±0.04
5 2.88c ±0.05 3.01c ±0.01 1.36c ±0.06 1.21c ±0.04
20 2.92c ±0.06 2.90d ±0.03 1.21d ±0.05 1.05d ±0.06
60 2.82c ±0.10 2.82d ±0.05 1.04e ±0.04 0.75e ±0.08
a,b Mean values with different superscripts in the same column differ significantly (P<0.05).
1 Raw JBN for treatments 2 and 4, raw JBN and sorghum mixture to reach 18 % CP in the DM for treatments 6 and 7.
2 Soaked JBN for 24 h and 1:4 grain:water ratio for treatments 2 and 4, soaked JBN for 24 h and 1:4 grain:water ratio mixed with SOR to reach 18 % CP in DM for treatments 6 and 7.
Treatments: 2, JBN+MOL; 4, JBN +MOL+LAB; 6, JBN+SOR+LAB; 7, JBN+SOR+MOL+LAB DM, dry matter; JBN, Jack bean; LAB, lactic acid bacteria; MOL, molasses; SOR, sorghum
Interestingly, in silages mixed with SOR a positive effect on the reduction of
canavanine was observed, contrary to what was observed for HCN.

Results
74
5.3 Silages of pre-germinated Jack bean and cowpea grains sole or
mixed with sorghum
Considering that the content of water soluble carbohydrates (WSC) was found to be
meager in both legume grains under evaluation, pre-germination was thought to
improve ensilability by increasing WSC.
5.3.1 Pre-germination
The water application during the experiment and the moisture increase as a
consequence of the germination itself caused significant changes in the DM in both
legume grains. In general, DM was lower (P<0.05) by 1 % in JBN (Table 34) and 5 %
in CWP (Table 35) when pre-germination took place in the darkness compared to the
light regime. Furthermore, the DM was reduced (P<0.001) as the germination time
was extended.
Table 34: Effect of illumination regime and germination time on dry matter, water soluble
carbohydrates and crude protein in Jack bean (n=3)
DM
(g kg-1
) WSC
(g kg-1
DM) CP
(g kg-1
DM)
Illumination regime
Light 394b 38.3b 293
Darkness 390a 37.0a 292
Germination time (h)
Raw 888 38.0 287
Soaked1 460 NA 290
12 454a 16.4a 289a
24 406b 42.2c 289a
48 380c 38.1b 290a
72 367d 43.4c 295ab
96 352e 47.6d 300b
pooled SD ±5.56 ±1.90 ±3.94
P-values
Illumination regime (IR) 0.029 0.022 0.581
Germination time (GT) 0.001 0.001 0.001
IR*GT 0.080 0.529 0.349 a,b
Mean values with different superscripts in the same column differ significantly within each factor (P<0.05). 1 According to the germination trial: after disinfection seeds were soaked for 9 h (see 4.3.3.2).
CP, crude protein; DM, dry matter; NA, not analyzed; WSC, water soluble carbohydrates

Results
75
In JBN (Table 34), the WSC content was reduced by 57 % (P0.05) after 12 h of
germination compared to the raw (not treated) grain. In the following, after 96 h a
gradual increase by up to 25 % (compared to the raw grain) was observed. Under
light regime of germination the WSC production was slightly higher (P<0.05) than
under darkness, whereas the illumination regime did not affect the CP content
(P>0.05). Only a slight increase was detected comparing the CP content of the raw
grain (287 g kg-1 DM) with the contents after 72 h (295 g kg-1 DM) and
96 h (300 g kg-1 DM).
After 12 h of germination, no decrease of WSC was found in CWP as was in JBN
(Table 35). On the contrary, a gradual increase was produced reaching the highest
value after 72 h (54.4 g kg-1 DM). Unlike JBN, the content of WSC was higher
(P<0.05) during germination under darkness (40.4 g kg-1 DM) than under
light (38.3 g kg-1 DM).
The CP content was not affected by the illumination regime (P>0.05) and only a
marginal increase (P<0.05) was observed after 48 h.
Table 35: Effect of illumination regime and germination time on dry matter, water soluble
carbohydrates and crude protein in cowpea (n=3)
DM
(g kg-1
) WSC
(g kg-1
DM) CP
(g kg-1
DM)
Illumination regime
Light 389b 38.3a 270
Darkness 372a 40.4b 271
Germination time (h)
Raw 902 12.8 261
Soaked1 423 NA 262
12 419a 13.3a 262a
24 392b 44.4b 267b
48 353c 44.7b 274c
72 358c 54.4c 278d
pooled SD ±16.2 ±1.73 ±1.26
P-values
Illumination regime (IR) 0.018 0.044 0.887
Germination time (GT) 0.001 0.001 0.001
IR*GT 0.498 0.062 0.001 a,b
Mean values with different superscripts in the same column differ significantly within each factor (P<0.05). 1 According to the germination trial: after disinfection seeds were soaked for 9 h (see 4.3.4.2).
CP, crude protein; CWP, cowpea; DM, dry matter; NA, not analyzed; WSC, water soluble carbohydrates
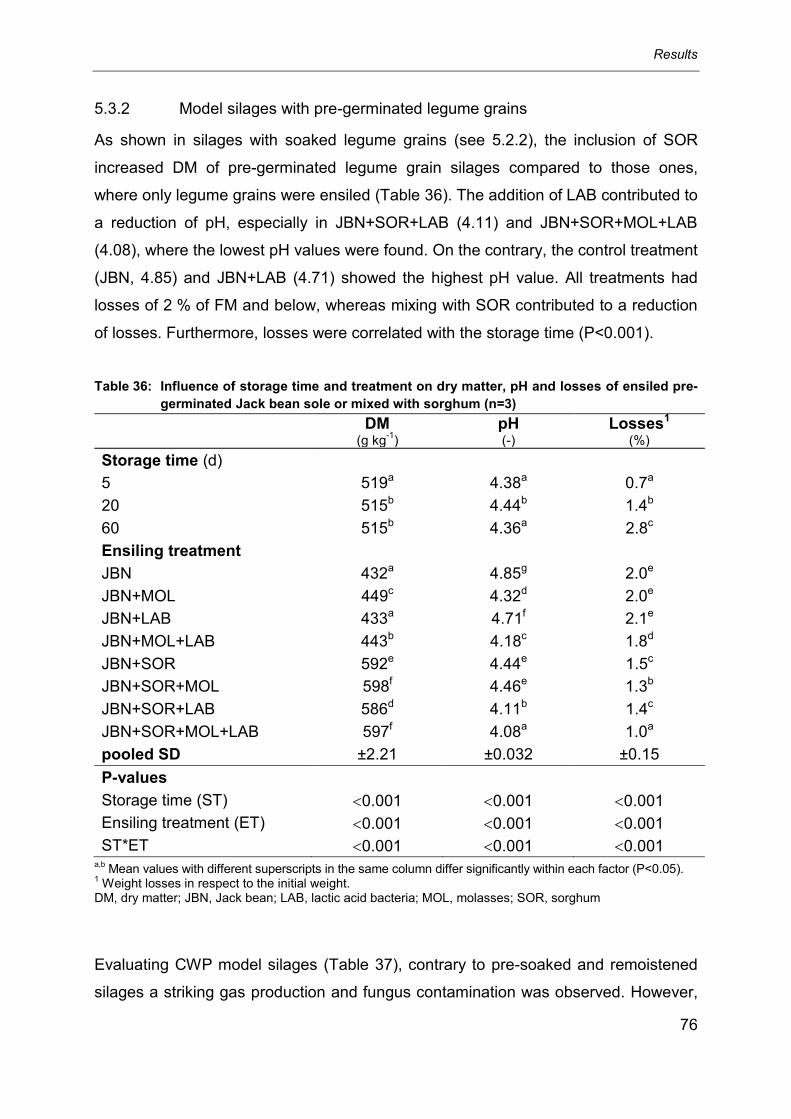
Results
76
5.3.2 Model silages with pre-germinated legume grains
As shown in silages with soaked legume grains (see 5.2.2), the inclusion of SOR
increased DM of pre-germinated legume grain silages compared to those ones,
where only legume grains were ensiled (Table 36). The addition of LAB contributed to
a reduction of pH, especially in JBN+SOR+LAB (4.11) and JBN+SOR+MOL+LAB
(4.08), where the lowest pH values were found. On the contrary, the control treatment
(JBN, 4.85) and JBN+LAB (4.71) showed the highest pH value. All treatments had
losses of 2 % of FM and below, whereas mixing with SOR contributed to a reduction
of losses. Furthermore, losses were correlated with the storage time (P<0.001).
Table 36: Influence of storage time and treatment on dry matter, pH and losses of ensiled pre-
germinated Jack bean sole or mixed with sorghum (n=3)
DM
(g kg-1
) pH (-)
Losses1 (%)
Storage time (d)
5 519a 4.38a 0.7a
20 515b 4.44b 1.4b
60 515b 4.36a 2.8c
Ensiling treatment
JBN 432a 4.85g 2.0e
JBN+MOL 449c 4.32d 2.0e
JBN+LAB 433a 4.71f 2.1e
JBN+MOL+LAB 443b 4.18c 1.8d
JBN+SOR 592e 4.44e 1.5c
JBN+SOR+MOL 598f 4.46e 1.3b
JBN+SOR+LAB 586d 4.11b 1.4c
JBN+SOR+MOL+LAB 597f 4.08a 1.0a
pooled SD ±2.21 ±0.032 ±0.15
P-values
Storage time (ST) 0.001 0.001 0.001
Ensiling treatment (ET) 0.001 0.001 0.001
ST*ET 0.001 0.001 0.001 a,b
Mean values with different superscripts in the same column differ significantly within each factor (P<0.05). 1 Weight losses in respect to the initial weight.
DM, dry matter; JBN, Jack bean; LAB, lactic acid bacteria; MOL, molasses; SOR, sorghum
Evaluating CWP model silages (Table 37), contrary to pre-soaked and remoistened
silages a striking gas production and fungus contamination was observed. However,

Results
77
in silages mixed with sorghum, those undesired processes were reduced compared
to solely ensiled CWP.
The pH value remained unaltered from day 5 to 60 of storage time (P>0.05), whereas
in the control and CWP+LAB the highest pH values were found with 4.61 and 5.24,
respectively. Mixed CWP+SOR silages produced the lowest pH, as well as
CWP+MOL and CWP+MOL+LAB. In CWP+LAB the highest percentage of losses
was determined (4.2 % of FM).
Table 37: Influence of storage time and treatment on dry matter, pH and losses of ensiled pre-
germinated cowpea sole or mixed with sorghum (n=3)
DM
(g kg-1
) pH (-)
Losses1 (%)
Storage time (d)
5 482a 4.37 1.0a
20 488b 4.37 2.0b
60 491b 4.48 4.8c
Ensiling treatment
CWP 404b 4.61a 3.4b
CWP+MOL 418c 4.33c 3.4b
CWP+LAB 392a 5.24b 4.2a
CWP+MOL+LAB 410c 4.34c 3.3b
CWP+SOR 565e 4.21c 1.8c
CWP+SOR+MOL 575f 4.22c 1.8c
CWP+SOR+LAB 560e 4.20c 1.5c
CWP+SOR+MOL+LAB 571f 4.14c 1.6c
pooled SD ±5.41 ±0.25 ±0.40
P-values
Storage time (ST) 0.001 0.189 0.001
Ensiling treatment (ET) 0.001 0.001 0.001
ST*ET 0.635 0.121 0.001 a,b
Mean values with different superscripts in the same column differ significantly within each factor (P<0.05). 1 Weight losses in respect to the initial weight.
CWP, cowpea; DM, dry matter; LAB, lactic acid bacteria; MOL, molasses; SOR, sorghum
The determination of fermentation products in the filtrates of pre-germinated JBN
model silages (Table 38) revealed JBN+MOL, JBN+MOL+LAB, JBN+SOR+LAB and
JBN+SOR+MOL+LAB as the treatments with the best fermentation quality. They
showed the lowest pH values (4.32, 4.18, 4.08 and 4.06, respectively), the highest

Results
78
lactic acid production (6.5, 7.5, 4.8 and 4.7 % DM, respectively) and the lowest acetic
acid production (1.7, 1.1, 0.6 and 0.6 % DM, respectively). The content of alcohols
was generally below 1 % DM and butyric, propionic, valeric and iso-valeric acids
were not detected in any treatment.
Table 38: Fermentation products determined in model silages of pre-germinated Jack bean
grains after 60 days of storage (n=3)
DM (%)
pH (-)
LA AC Ethanol Butanediol
(% DM)
1 43.0a ±0.24 4.86
e ±0.13 4.5
b ±0.18 2.5
d ±0.40 0.8
f ±0.02 0.07
a ±0.02
2 45.2b ±0.03 4.32
c ±0.03 6.5
c ±0.02 1.7
c ±0.06 0.5
d ±0.06 0.15
b ±0.05
3 43.5c ±0.10 4.66
d ±0.01 4.7
b ±0.11 1.9
c ±0.04 0.7
e ±0.03 0.19
bc ±0.04
4 44.5d ±0.22 4.18
b ±0.01 7.5
d ±0.25 1.1
b ±0.07 0.4
c ±0.03 0.23
c ±0.06
5 58.8e ±0.07 4.35
c ±0.01 3.4
a ±0.28 0.9
b ±0.05 0.5
d ±0.04 0.24
c ±0.02
6 59.2f ±0.09 4.40
c ±0.01 3.5
a ±0.17 1.1
b ±0.02 0.3
b ±0.02 0.07
a ±0.01
7 58.5e ±0.36 4.08
a ±0.04 4.8
b ±0.15 0.6
a ±0.02 0.4
c ±0.02 0.23
c ±0.02
8 59.4f ±0.31 4.06
a ±0.01 4.7
b ±0.08 0.6
a ±0.01 0.1
a ±0.01 0.03
a ±0.01
a,b Mean values with different superscripts in the same column differ significantly (P<0.05).
Treatments: 1, JBN; 2, JBN+MOL; 3, JBN+LAB; 4, JBN+MOL+LAB; 5, JBN+SOR; 6, JBN+SOR+MOL; 7, JBN+SOR+LAB; 8, JBN+SOR+MOL+LAB
AC, acetic acid; DM, dry matter; JBN, Jack bean; LA, lactic acid; LAB, lactic acid bacteria; MOL, molasses; SOR, sorghum
In CWP model silages (Table 39), the lowest pH was measured in CWP+MOL and
CWP+MOL+LAB, as well as in CWP+SOR+LAB and CWP+SOR+MOL+LAB. Among
these treatments, the ones with solely ensiled CWP produced more lactic acid (6.7
and 6.7 % DM, respectively) than those ones mixed with SOR (4.6 and 5.0 % DM,
respectively), although the latter showed the lowest pH values (4.15 in
CWP+SOR+LAB and 4.13 in CWP+SOR+MOL+LAB). Butyric acid was not detected
in any of the CWP+SOR mixed silages, but in those of sole CWP. Contents of acetic
acid remained below 1 % DM in the CWP+SOR mixed silages, but more than double
the amount was produced in solely CWP silages. Neither propionic nor valeric or iso-
valeric acids were detected in any treatment. With the exception of the control (CWP)
the content of ethanol was below 0.5 % DM in all treatments, which also applied for
the content of butanediol, including the control treatment.

Results
79
Table 39: Fermentation products determined in model silages of pre-germinated cowpea
grains after 60 days of storage (n=3)
DM (%)
pH (-)
LA AC BA Ethanol Butanediol
(% DM)
1 40.9a ±0.41 4.71
b ±0.17 3.8
a ±1.15 2.2
c ±0.44 0.6 ±0.92 0.75
c ±0.02 0.31
ab ±0.04
2 42.1b ±0.19 4.43
ab ±0.17 6.7
b ±0.39 1.5
b ±0.33 0.2 ±0.18 0.34
ab ±0.03 0.45
cd ±0.05
4 41.5ab
±0.67 4.73b
±0.52 6.7b ±1.69 1.7
bc ±0.61 0.4 ±0.34 0.43
b ±0.20 0.54
d ±0.12
5 57.1cd
±0.17 4.11a
±0.01 5.3a ±0.22 0.6
a ±0.02 ND 0.39
b ±0.01 0.29
ab ±0.03
6 58.0e ±0.19 4.13
a ±0.01 5.1
a ±0.11 0.9
a ±0.08 ND 0.23
a ±0.01 0.24
a ±0.03
7 56.6c ±0.27 4.15
a ±0.03 4.6
a ±0.15 0.5
a ±0.02 ND 0.36
ab ±0.02 0.36
bc ±0.02
8 57.6de
±0.25 4.13a
±0.01 5.0a ±0.13 0.6
a ±0.04 ND 0.23
a ±0.00 0.21
a ±0.02
a,b Mean values with different superscripts in the same column differ significantly (P<0.05).
Treatments: 1, CWP; 2, CWP+MOL; 4, CWP+MOL+LAB; 5, CWP+SOR; 6, CWP+SOR+MOL; 7, CWP+SOR+LAB; 8, CWP+SOR+MOL+LAB
Treatment 3 (CWP+LAB) was lost during sampling. AC, acetic acid; BA, butyric acid; CWP, cowpea; DM, dry matter; LA, lactic acid; LAB, lactic acid bacteria; MOL, molasses; ND, not detected
According to the fermentation pattern of pre-germinated JBN silages (Table 38),
JBN+MOL, JBN+MOL+LAB, JBN+SOR+LAB and JBN+SOR+MOL+LAB showed the
best fermentation quality when evaluating ammonia with 2.2, 1.1, 1.6 and 1.1 % NH3-
N/Ntotal, respectively (Table 40). Like in JBN, the treatments CWP+MOL,
CWP+MOL+LAB, CWP+SOR+LAB and CWP+SOR+MOL+LAB had the lowest
ammonia production (P0.05).
Table 40: Ammonia production (% NH3-N/Ntotal) in model silages with pre-germinated beans
after 60 days of storage (n=3)
Grain
Treatments
1 2 3 4 5 6 7 8
JBN 5.5a ±0.40
2.2b ±0.11
2.9c ±0.11
1.1d ±0.08
3.1c ±0.06
2.8bc ±0.01
1.6e ±0.11
1.1de ±0.03
CWP 6.2e ±0.62
4.0bc ±0.23 *
2.5a ±0.07
3.7d ±0.09
3.1c ±0.03
3.0bc ±0.07
2.6ab
±0.01 a,b
Mean values with different superscripts in the same row differ significantly (P<0.05). Treatments: 1, LEG; 2, LEG+MOL; 3, LEG+LAB; 4, LEG+MOL+LAB; 5, LEG+SOR; 6, LEG+SOR+MOL;
7, LEG+SOR+LAB; 8, LEG+SOR+MOL+LAB * CWP+LAB was lost during sampling. CWP, cowpea; DM, dry matter; JBN, Jack bean; LAB, lactic acid bacteria; LEG, legume grain (CWP or JBN); MOL, molasses; SOR, sorghum

Results
80
5.3.3 Anti-nutritional factors
5.3.3.1 Effect of pre-germination on selected anti-nutritional factors in not ensiled
legume grains
Due to controversial results found in literature about the effect of pre-germination on
TIA and canavanine the influence of this pre-ensiling treatment should be
investigated.
Only in CWP there was an influence of the illumination regime on TIA. Grains pre-
germinated under light regime showed a lower TIA (60.44 mg TI·g-1 DM) than those
germinated in darkness (66.85 mg TI·g-1 DM). In both grains, an interaction between
the illumination regime and pre-germination time was observed (Table 41).
Table 41: Effect of illumination regime and pre-germination time on trypsin inhibitory activity
and canavanine in Jack bean and cowpea (n=3)
Jack bean Cowpea
TIA (mg TI·g
-1 DM)
Canavanine (g·100 g
-1 DM)
TIA (mg TI·g
-1 DM)
Illumination regime
Light 41.43 3.54 60.44a
Darkness 41.07 3.56 66.85b
Pre-germination time (h)
Raw grain 59.39 3.91 140.55
Soaked1 57.73 ND 86.23
12 24.53a 3.35a 39.29a
24 37.93b 3.62b 64.40b
48 47.57c 3.64b 74.00c
72 47.98c 3.58b 76.88d
96 48.23c 3.57b -
pooled SD ±0.809 ±0.095 ±1.021
P-values
Illumination regime (IR) 0.228 0.702 0.001
Pre-germination time (GT) 0.001 0.001 0.001
IR*GT 0.007 0.119 0.001 a,b
Mean values with different superscripts in the same column differ significantly within each factor (P<0.05). 1 According to the germination trial: after disinfection seeds were soaked for 9 h (see 4.3.4.2).
DM, dry matter; ND, not determined; TIA, trypsin inhibitory activity; TI, trypsin inhibited
The methodically necessary soaking proceeding previous to pre-germination
apparently did not have an effect on TIA in JBN but led to a reduction of 39 % in pre-
germinated CWP compared to the raw grain. Interestingly, already after 12 h of
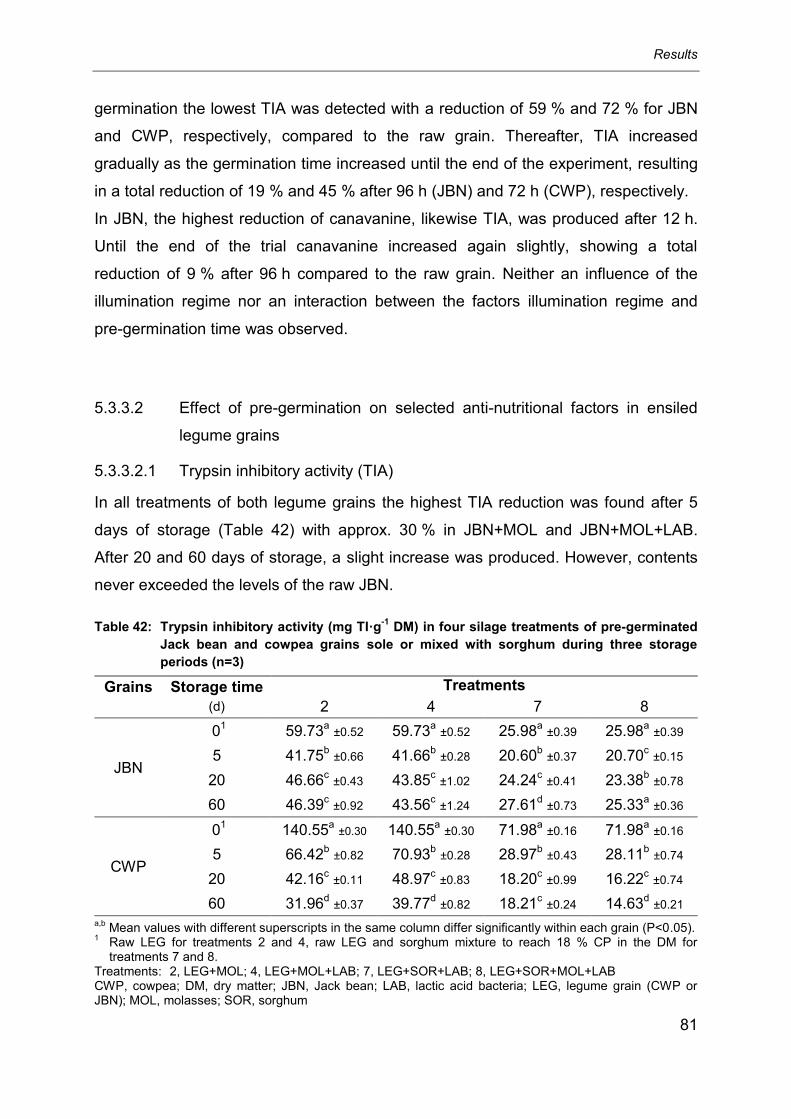
Results
81
germination the lowest TIA was detected with a reduction of 59 % and 72 % for JBN
and CWP, respectively, compared to the raw grain. Thereafter, TIA increased
gradually as the germination time increased until the end of the experiment, resulting
in a total reduction of 19 % and 45 % after 96 h (JBN) and 72 h (CWP), respectively.
In JBN, the highest reduction of canavanine, likewise TIA, was produced after 12 h.
Until the end of the trial canavanine increased again slightly, showing a total
reduction of 9 % after 96 h compared to the raw grain. Neither an influence of the
illumination regime nor an interaction between the factors illumination regime and
pre-germination time was observed.
5.3.3.2 Effect of pre-germination on selected anti-nutritional factors in ensiled
legume grains
5.3.3.2.1 Trypsin inhibitory activity (TIA)
In all treatments of both legume grains the highest TIA reduction was found after 5
days of storage (Table 42) with approx. 30 % in JBN+MOL and JBN+MOL+LAB.
After 20 and 60 days of storage, a slight increase was produced. However, contents
never exceeded the levels of the raw JBN.
Table 42: Trypsin inhibitory activity (mg TI·g-1
DM) in four silage treatments of pre-germinated
Jack bean and cowpea grains sole or mixed with sorghum during three storage
periods (n=3)
Grains
Storage time
(d)
Treatments
2 4 7 8
JBN
01 59.73
a ±0.52 59.73
a ±0.52 25.98
a ±0.39 25.98
a ±0.39
5 41.75b ±0.66 41.66
b ±0.28 20.60
b ±0.37 20.70
c ±0.15
20 46.66c ±0.43 43.85
c ±1.02 24.24
c ±0.41 23.38
b ±0.78
60 46.39c ±0.92 43.56
c ±1.24 27.61
d ±0.73 25.33
a ±0.36
CWP
01 140.55
a ±0.30 140.55
a ±0.30 71.98
a ±0.16 71.98
a ±0.16
5 66.42b ±0.82 70.93
b ±0.28 28.97
b ±0.43 28.11
b ±0.74
20 42.16c ±0.11 48.97
c ±0.83 18.20
c ±0.99 16.22
c ±0.74
60 31.96d ±0.37 39.77
d ±0.82 18.21
c ±0.24 14.63
d ±0.21
a,b Mean values with different superscripts in the same column differ significantly within each grain (P<0.05).
1 Raw LEG for treatments 2 and 4, raw LEG and sorghum mixture to reach 18 % CP in the DM for treatments 7 and 8.
Treatments: 2, LEG+MOL; 4, LEG+MOL+LAB; 7, LEG+SOR+LAB; 8, LEG+SOR+MOL+LAB CWP, cowpea; DM, dry matter; JBN, Jack bean; LAB, lactic acid bacteria; LEG, legume grain (CWP or JBN); MOL, molasses; SOR, sorghum

Results
82
In pre-germinated CWP silages TIA was reduced in all treatments under evaluation
and was directly influenced by the storage time. After 60 days of storage, the lowest
TIA (P<0.05) was found in CWP+MOL, CWP+MOL+LAB, CWP+SOR+LAB and
CWP+SOR+MOL+LAB with reductions of 77, 72, 73 and 80 %, respectively,
compared to the raw cowpea.
5.3.3.2.2 Hydrogen cyanide (HCN)
A reduction of HCN was mainly detected in sole JBN treatments with a reduction of
30 and 60 % (P<0.05) in JBN+MOL and JBN+MOL+LAB, respectively (Table 43). In
contrast, JBN+SOR+LAB showed a slight increase of HCN after 60 days of storage
(42.43 mg·100 g-1 DM) with respect to the raw grain (39.58 mg·100 g-1 DM). In
JBN+SOR+MOL+LAB HCN was reduced by approx. 5 % (P<0.05) after 60 days
storage time. The inclusion of SOR in the silages might have had an influence on the
different extents of reduction of HCN compared to solely ensiled JBN.
Table 43: Hydrogen cyanide (mg·100g-1
DM) in four silage treatments of pre-germinated Jack
bean and cowpea grains sole or mixed with sorghum (n=3)
Grain
Storage time
(d)
Treatments
2 4 7 8
JBN 01 80.48a ±0.28 80.48a ±0.28 39.58a ±0.20 39.58a ±0.20
60 56.63b ±0.32 47.85b ±0.28 42.43b ±0.35 37.69b ±0.13
CWP 01 8.57a ±0.18 8.57a ±0.18 7.47a ±0.02 7.47a ±0.02
60 15.98b ±0.46 12.86b ±0.34 21.91b ±0.04 20.13b ±0.44
a,b Mean values with different superscripts in the same column differ significantly within each grain (P<0.05).
1 Raw LEG for treatments 2 and 4, raw LEG and sorghum mixture to reach 18 % CP in the DM for treatments 7 and 8.
Treatments: 2, LEG+MOL; 4, LEG +MOL+LAB; 7, LEG+SOR+LAB; 8, LEG+SOR+MOL+LAB CWP, cowpea; DM, dry matter; JBN, Jack bean; LAB, lactic acid bacteria; LEG, legume grain (CWP or JBN); MOL, molasses; SOR, sorghum
Analyzing CWP silages, no reduction of HCN was observed after 60 days of storage.
On the contrary, an increase (P<0.05) of approximately 46, 33, 66 and 63 % was
found in CWP+MOL, CWP+MOL+LAB, CWP+SOR+LAB and
CWP+SOR+MOL+LAB, respectively (Table 43). However, as HCN was not

Results
83
determined during the pre-germination trial, there is no certainty if the increase was
really produced during silage. The addition of SOR in treatments of mixed
CWP+SOR silages was associated to even higher HCN levels in the silages after 60
days of storage.
5.3.3.2.3 Canavanine
The content of canavanine was reduced in every evaluated treatment, whereas the
highest reduction (P<0.05) compared to the raw grain was produced after 60 days in
JBN+MOL with 24 % and JBN+MOL+LAB with 7 % of reduction (Table 44).
Table 44: Canavanine (g·100 g-1
DM) in four silage treatments of pre-germinated Jack bean
grains sole or mixed with sorghum during three storage periods (n=3)
Storage time
(d)
Treatments
2 4 7 8
0* 3.91a ±0.04 3.91a ±0.04 1.87a ±0.02 1.87a ±0.02
5 3.68b ±0.03 3.77b ±0.00 1.76c ±0.02 1.58d ±0.02
20 3.17c ±0.03 3.71b ±0.02 1.86b ±0.03 1.65c ±0.03
60 2.98d ±0.05 3.63c ±0.05 1.51d ±0.00 1.78b ±0.04 a,b
Mean values with different superscripts in the same column differ significantly (P<0.05). 1
Raw JBN for treatments 2 and 4, raw JBN and sorghum mixture to reach 18 % CP in the DM for treatments 7 and 8.
Treatments: 2, JBN+MOL; 4, JBN+MOL+LAB; 7, JBN+SOR+LAB; 8, JBN+SOR+MOL+LAB CP, crude protein; DM, dry matter; JBN, Jack bean; LAB, lactic acid bacteria; MOL, molasses; SOR, sorghum
In JBN+SOR+LAB after 60 days storage and in JBN+SOR+MOL+LAB after 5 days
storage, the highest reduction of the canavanine content was produced with 19 %
and 15 % difference, respectively, compared to the raw grain. In those treatments, no
progressive influence of the storage time on the canavanine decrease was observed.
Nevertheless, after every evaluated storage period, the content of canavanine was
always lower (P<0.05) compared to the raw material.

Results
84
5.4 Silages of Jack bean and cowpea mixed with sorghum as feedstuffs
for growing pigs
5.4.1 Evaluation of feedstuffs used in the animal trials
In order to evaluate the nutritional value of legume grain silages mixed with sorghum
as a feedstuff for growing pigs the best treatment of legume grain-sorghum silages in
correspondence with the results shown in the chapters 5.1, 5.2 and 5.3 was chosen.
Therefore, the addition of a lactic acid bacteria inoculant (3·105 cfu·g-1 FM) and
molasses (4 % FM) was favored. As a pre-ensiling treatment, a soaking of 24 h with
a grain:water ratio of 1:4 (w/v) was selected prior to ensiling, not only considering its
effect on ensilability and ANF reduction, but as well factors like the efficient use of
water and storage space.
As expected, the different chemical composition of JBN and CWP affected the
estimated metabolizable energy (ME), as ME was higher in CWP (14.88 MJ·kg-1 DM)
than in JBN (13.39 MJ·kg-1 DM) (Table 45). However, the ME of the raw mixture used
for ensiling was rather similar, being 15.52 MJ·kg-1 DM and 15.11 MJ·kg-1 DM in
CWP+SOR and JBN+SOR, respectively (Table 46). Due to the higher CP content in
JBN, more SOR was mixed to achieve 18 % CP in the mix, which increased ME as a
consequence mainly because the high starch and low CF content in SOR.
Table 45: Chemical composition of feedstuffs under evaluation in the feeding trials
Grain
DM
(g kg-1)
OM CP AEE CF Starch Ash ME*
(MJ kg-1
DM) (g kg-1 DM)
JBN 888 963 287 27.4 106 378 37.1 13.39
CWP 902 955 261 24.2 58.7 456 45.1 14.88
Wheat 881 984 134 25.6 34.7 708 16.1 15.73
SOR 866 985 95.4 41.4 26.2 760 15.0 16.15
AEE, acid ether extract; CF, crude fiber; CP, crude protein; CWP, cowpea; DM, dry matter; JBN, Jack bean; OM, organic matter; SOR, sorghum *Metabolizable energy estimated following GfE (2008) recommendations.
During the silage fermentation a drastic reduction of starch by 58 % and 50 % in
JBN+SOR in CWP+SOR mixtures, respectively, was observed. As a consequence,
the calculated ME was reduced in JBN+SOR and CWP+SOR silages to 14.61 and
14.90 MJ·kg-1 DM, respectively (Table 46).

Results
85
Table 46: Chemical composition of ensiled and not ensiled legume-sorghum mixtures under
evaluation in the feeding trials
JBN+SOR CWP+SOR
RMI SIL RMI SIL
DM (g kg-1) 607 596 882 540
OM
(g kg-1 DM)
974 973 973 969
CP 182 182 174 177
AEE 31.5 32.5 28.8 28.2
CF 52.4 52.6 41.4 43.6
NDFOM 237 183 208 98.7
ADFOM 97.1 91.7 78.6 66.4
ADLOM 7.5 5.3 20.6 18.9
Starch 548 228 620 312.
Ash 26.4 27.0 27.0 30.6
ME* (MJ·kg-1 DM) 15.11 14.61 15.52 14.90
ADFOM, acid detergent fiber; ADLOM, acid detergent lignin; AEE, acid ether extract; CF, crude fiber; CP, crude protein; CWP, cowpea; DM, dry matter; JBN, Jack bean; NDFOM, neutral detergent fiber; OM, organic matter; RMI, raw mixture; SIL, silage; SOR, sorghum *Metabolizable energy estimated following GfE (2008) recommendations.
It has to be emphasized that the NDFOM content in CWP+SOR silage (SIL) was
extremely reduced (by 52 %) compared to its corresponding raw mixture (RMI).
Considering that only a small reduction of ADFOM (15 %) and ADLOM (8 %) was
observed, obviously hemicelluloses (Hcell; NDF-ADF) were the most affected
fraction, being degraded by more than 75 % in SIL compared to RMI in CWP+SOR
mixtures. In JBN+SOR mixtures, ensiling reduced Hcell by 35 %.
The high quality of fermentation in silages can be evaluated by the parameters
presented in Table 47. The lactic acid production was rather high and undesired
fermentation products occurred in only little amounts. The pH value remained inside
the wished range (≤ 4.0) at the silage opening.
Table 47: Selected fermentation parameters of legume-sorghum silages used in the feeding
trials after 60 days storage (n=3)
Silage
pH
(-)
LA AC Ethanol Bdiol Propanol NH3-N/Ntotal
(%) (% DM)
JBN+SOR 4.0 4.9 0.4 0.3 0.1 0.02 1.0
CWP+SOR 4.0 5.7 0.4 0.5 0.2 0.02 2.0
AC, acetic acid; Bdiol, 2,3-butanediol; CWP, cowpea; LA, lactic acid; JBN, Jack bean; SOR, sorghum
Butyric, propionic, valeric and iso-valeric acids where not detected.
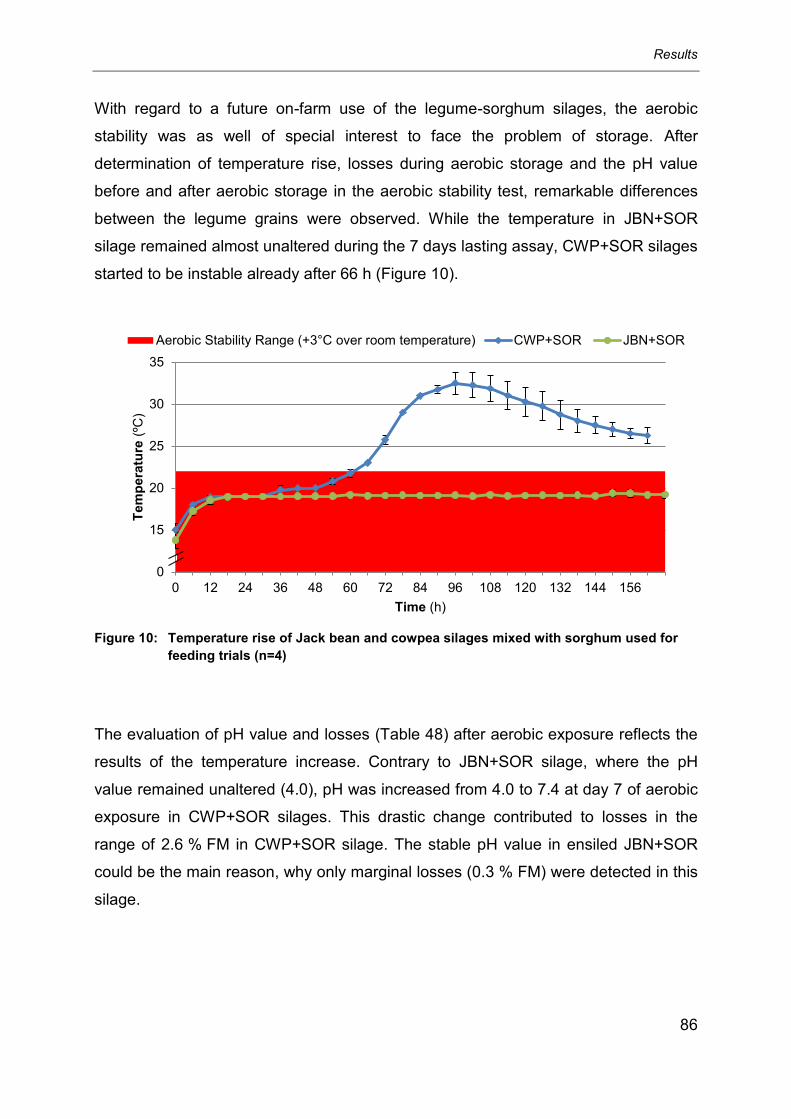
Results
86
With regard to a future on-farm use of the legume-sorghum silages, the aerobic
stability was as well of special interest to face the problem of storage. After
determination of temperature rise, losses during aerobic storage and the pH value
before and after aerobic storage in the aerobic stability test, remarkable differences
between the legume grains were observed. While the temperature in JBN+SOR
silage remained almost unaltered during the 7 days lasting assay, CWP+SOR silages
started to be instable already after 66 h (Figure 10).
Figure 10: Temperature rise of Jack bean and cowpea silages mixed with sorghum used for
feeding trials (n=4)
The evaluation of pH value and losses (Table 48) after aerobic exposure reflects the
results of the temperature increase. Contrary to JBN+SOR silage, where the pH
value remained unaltered (4.0), pH was increased from 4.0 to 7.4 at day 7 of aerobic
exposure in CWP+SOR silages. This drastic change contributed to losses in the
range of 2.6 % FM in CWP+SOR silage. The stable pH value in ensiled JBN+SOR
could be the main reason, why only marginal losses (0.3 % FM) were detected in this
silage.
10
15
20
25
30
35
0 12 24 36 48 60 72 84 96 108 120 132 144 156
Tem
pera
ture
(ºC
)
Time (h)
Aerobic Stability Range (+3°C over room temperature) CWP+SOR JBN+SOR

Results
87
Table 48: Changes in selected variables before and after the aerobic stability test in silages
prepared for feeding trials
Silage
Moment of evaluation
(with respect to aerobic stability test)
DM
(g kg-1
)
pH
(-)
Losses
(% FM)
JBN+SOR day 0 596 4.00 -
day 7 596 4.00 0.3
CWP+SOR day 0 540 4.01 -
day 7 529 7.44 2.6
CWP, cowpea; DM, dry matter; FM, fresh matter; JBN, Jack bean; SOR, sorghum
The AA composition of grains used in the preparation of the diets for the feeding trials
is shown in Table 49.
Table 49: Amino acid composition of not ensiled feedstuffs used in the feeding trials
Amino
acids
Jack bean Cowpea Sorghum Wheat
(g·kg-1 DM) (g·16 g
-1 N) (g·kg
-1 DM) (g·16 g
-1 N) (g·kg
-1 DM) (g·16 g
-1 N) (g·kg
-1 DM) (g·16 g
-1 N)
ASP 25.53 8.89 27.85 10.69 6.33 6.63 6.34 4.74
THR 10.56 3.68 9.48 3.64 3.10 3.25 3.71 2.77
SER 12.98 4.52 11.89 4.56 4.13 4.33 6.13 4.59
GLU 28.50 9.93 41.28 15.84 18.63 19.53 42.55 31.82
GLY 9.52 3.31 10.32 3.96 3.00 3.14 5.14 3.84
ALA 10.53 3.67 10.98 4.21 8.55 8.97 4.52 3.38
VAL 11.07 3.86 12.23 4.69 4.49 4.71 5.66 4.23
ILE 9.64 3.36 10.67 4.09 3.75 3.93 4.48 3.35
LEU 18.43 6.42 19.20 7.37 12.36 12.96 8.91 6.66
TYR 6.22 2.17 5.79 2.22 2.77 2.90 2.09 1.56
PHE 11.17 3.89 14.46 5.55 4.99 5.24 6.09 4.56
HIS 26.49 9.23 8.00 3.07 2.29 2.40 3.21 2.40
LYS 13.94 4.85 16.79 6.44 1.99 2.09 3.32 2.49
ARG 12.17 4.24 15.55 5.97 3.35 3.51 5.49 4.11
PRO 9.48 3.30 5.17 1.98 7.00 7.34 13.33 9.97
CYS 2.56 0.89 2.73 1.05 1.76 1.85 3.08 2.30
MET 3.00 1.04 3.74 1.44 1.67 1.75 1.98 1.48
Differences between JBN and CWP were observed mainly for glutamic acid with
41.28 g·kg-1 DM in CWP and 28.5 g·kg-1 DM in JBN. The content of histidine was
more than three times higher in JBN (26.49 g·kg-1 DM) than in CWP (8.00 g·kg-1
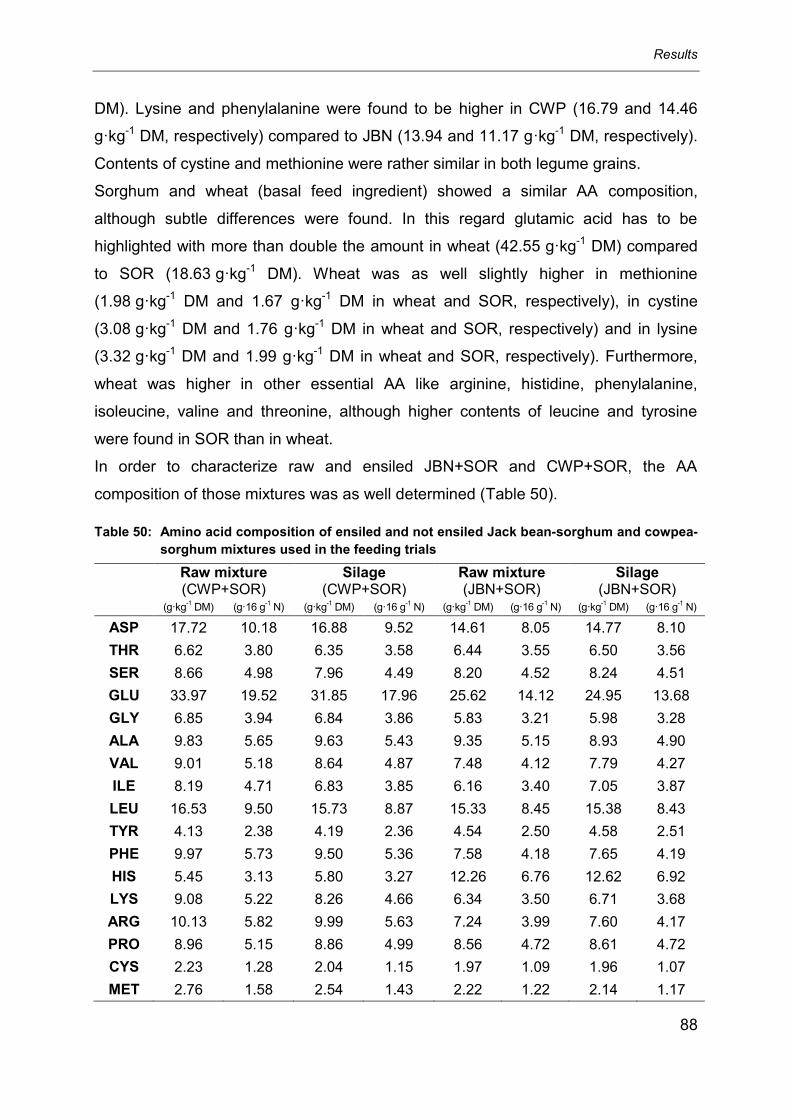
Results
88
DM). Lysine and phenylalanine were found to be higher in CWP (16.79 and 14.46
g·kg-1 DM, respectively) compared to JBN (13.94 and 11.17 g·kg-1 DM, respectively).
Contents of cystine and methionine were rather similar in both legume grains.
Sorghum and wheat (basal feed ingredient) showed a similar AA composition,
although subtle differences were found. In this regard glutamic acid has to be
highlighted with more than double the amount in wheat (42.55 g·kg-1 DM) compared
to SOR (18.63 g·kg-1 DM). Wheat was as well slightly higher in methionine
(1.98 g·kg-1 DM and 1.67 g·kg-1 DM in wheat and SOR, respectively), in cystine
(3.08 g·kg-1 DM and 1.76 g·kg-1 DM in wheat and SOR, respectively) and in lysine
(3.32 g·kg-1 DM and 1.99 g·kg-1 DM in wheat and SOR, respectively). Furthermore,
wheat was higher in other essential AA like arginine, histidine, phenylalanine,
isoleucine, valine and threonine, although higher contents of leucine and tyrosine
were found in SOR than in wheat.
In order to characterize raw and ensiled JBN+SOR and CWP+SOR, the AA
composition of those mixtures was as well determined (Table 50).
Table 50: Amino acid composition of ensiled and not ensiled Jack bean-sorghum and cowpea-
sorghum mixtures used in the feeding trials
Raw mixture (CWP+SOR)
Silage (CWP+SOR)
Raw mixture (JBN+SOR)
Silage (JBN+SOR)
(g·kg-1 DM) (g·16 g
-1 N) (g·kg
-1 DM) (g·16 g
-1 N) (g·kg
-1 DM) (g·16 g
-1 N) (g·kg
-1 DM) (g·16 g
-1 N)
ASP 17.72 10.18 16.88 9.52 14.61 8.05 14.77 8.10
THR 6.62 3.80 6.35 3.58 6.44 3.55 6.50 3.56
SER 8.66 4.98 7.96 4.49 8.20 4.52 8.24 4.51
GLU 33.97 19.52 31.85 17.96 25.62 14.12 24.95 13.68
GLY 6.85 3.94 6.84 3.86 5.83 3.21 5.98 3.28
ALA 9.83 5.65 9.63 5.43 9.35 5.15 8.93 4.90
VAL 9.01 5.18 8.64 4.87 7.48 4.12 7.79 4.27
ILE 8.19 4.71 6.83 3.85 6.16 3.40 7.05 3.87
LEU 16.53 9.50 15.73 8.87 15.33 8.45 15.38 8.43
TYR 4.13 2.38 4.19 2.36 4.54 2.50 4.58 2.51
PHE 9.97 5.73 9.50 5.36 7.58 4.18 7.65 4.19
HIS 5.45 3.13 5.80 3.27 12.26 6.76 12.62 6.92
LYS 9.08 5.22 8.26 4.66 6.34 3.50 6.71 3.68
ARG 10.13 5.82 9.99 5.63 7.24 3.99 7.60 4.17
PRO 8.96 5.15 8.86 4.99 8.56 4.72 8.61 4.72
CYS 2.23 1.28 2.04 1.15 1.97 1.09 1.96 1.07
MET 2.76 1.58 2.54 1.43 2.22 1.22 2.14 1.17

Results
89
Some changes were observed in the AA composition between raw mixtures and their
corresponding silages. In CWP+SOR the losses due to ensiling in aspartic acid
(4.7%), glutamic acid (6.2%), lysine (9.0%), glutamic acid (6.2%) and isoleucine
(16.6%) contradict with what was observed between raw mixtures and silages of
JBN+SOR.
As previously shown, ensiling had an effect on the reduction of TIA in both legume
grain silages (Table 51).
Table 51: Content of selected anti-nutritional factors of ensiled or not ensiled legume-sorghum
mixtures used in the feeding trials
Grain
TIA (mg TI·g
-1 DM)
Canavanine (g·100 g
-1 DM)
CT TP NTP
(% DM)
JBN RMI 25.98 1.58 0.33 0.98 0.62
SIL 17.94 1.62 0.04 1.32 1.21
CWP RMI 71.98 - 0.24 1.08 0.40
SIL 31.08 - 0.15 1.50 0.99
CT, condensed tannins, CWP, cowpea; NTP, non-tannin phenols; RMI, raw mixture; SIL, silage; TP, tannin phenols; TIA, trypsin inhibitory activity
While the content of canavanine was not affected during the silage process, a
reduction in the fraction of condensed tannins by 88 and 38 % in JBN+SOR and
CWP+SOR silages, respectively, was observed. However, total phenols and non-
tannin phenols increased considerably during ensilage by 35 and 95 % in JBN+SOR
and by 39 and 148 % in CWP+SOR silages, respectively.
During the adaptation to the diets containing JBN+SOR silages, the animals under
experiment reacted differently. Some pigs consumed the offered amounts without
apparent reaction, others consumed it followed by vomiting and others refused it in
any case. For CWP+SOR silages nothing similar was observed. In this case, every
animal consumed the offered portions without any apparent negative reaction.
Considering the reaction of the animals to the JBN+SOR silage diets, a possible
contamination with mycotoxins was assumed. In correspondence to the specific
symptoms, deoxynivalenol (DON) was determined in the feedstuffs (Table 52).

Results
90
Table 52: Content of deoxynivalenol in raw grains and mixed silages used in the feeding trials
with pigs
Feedstuff Deoxynivalenol (ng·g-1
DM)
Jack bean (JBN) 0.0
Cowpea (CWP) 0.0
Sorghum (SOR) 57.3
Silage (JBN+SOR) 0.0
Silage (CWP+SOR) 0.0
In the grains analyzed, only SOR was found to be contaminated with DON, showing
a value that presumably is not high enough to hamper the animal’s intake. Hence, the
reason why the animals reacted in the described way to JBN containing diets has to
be found elsewhere.
5.4.2 Standardized ileal digestibility of essential amino acids and apparent
digestibility of proximate nutrients in raw cowpea-sorghum mixtures and
corresponding silages
Only for methionine the standardized ileal digestibility (SID) was improved (P<0.05)
by ensiling (Table 53), being approx. 24 % higher in silages compared to the raw
mixture.
Table 53: Standardized ileal digestibilities (%) of N and essential amino acids of raw or ensiled
cowpea-sorghum mixture
Raw mixture Silage pooled SD P
N 63.5 70.0 ±6.44 0.204
THR 70.3 74.8 ±4.03 0.165
VAL 66.0 71.8 ±1.91 0.105
ILE 65.3 68.5 ±3.91 0.284
LEU 72.5 76.5 ±2.45 0.060
TYR 70.0 73.0 ±3.42 0.261
PHE 70.8 73.3 ±3.40 0.339
HIS 66.8 72.0 ±4.18 0.126
LYS 72.0 71.5 ±4.14 0.870
ARG 73.8 76.0 ±3.29 0.370
CYS 64.8 63.0 ±8.05 0.769
MET 56.5b 70.3a ±3.05 0.001 a,b
Mean values with different superscripts show significant differences between the raw mixture and the silage (P<0.05).

Results
91
For all other essential AA, SID increased likewise after ensiling (P>0.05), although
not significant, which was as well the case for total N. Contrary to what was observed
for methionine, SID in the other sulphurated AA cystine seemed to be unaffected by
ensiling. It remains unclear why ensilage affected the AA in different ways.
Comparing silage and raw material of cowpea-sorghum mixtures, the apparent
digestibility (AD) for OM, CP and CF was found not to be statistically different (Table
54). Worth mentioning, although not significant, AD of CF in silage was increased by
approx. 25 % in respect to the raw mixture. Starch was considered to be completely
digested in the raw mixture as well as in the silage. The AD of AEE was significantly
increased through ensiling by approx. 26 %, so was the AD of ADFOM (by 17 %) with
respect to the raw material. Crude ash (CA) was the parameter, for which ensiling
contributed most to increase (P<0.05) its AD by approx. 48 %. Contrary to what was
assumed, the AD of NDFOM was slightly depressed by approx. 18 %.
Table 54: Apparent fecal digestibilities (%) of selected nutrients of raw or ensiled cowpea-
sorghum mixture
Raw mixture Silage pooled SD P
OM 86.3 89.8 ±2.00 0.101
CA 44.6b 66.1a ±5.74 0.010
CP 75.9 77.0 ±1.78 0.501
AEE 42.9a 54.1b ±2.83 0.009
CF 54.9 68.6 ±7.12 0.078
NDFOM 75.5b 61.8a ±3.63 0.010
ADFOM 51.1a 59.7b ±1.58 0.003
Starch 99.9 100 ±0.35 0.554 a,b
Mean values with different superscripts show significant differences between the raw mixture and the
silage (P<0.05).
ADFOM, acid detergent fiber; AEE, acid ether extract; CA, crude ash; CF, crude fiber; CP, crude protein;
OM, organic matter; NDFOM, neutral detergent fiber

Discussion
92
6 Discussion
6.1 Soaking and pre-germination as silage pre-treatments
6.1.1 Soaking
The buffering substances are primarily affected by the alkalinity of the minerals in the
ash rather than by the protein and can be described through the following equation
(Weissbach, 2011):
BC = 0.092 a + 0.442 b – 19.5 (5.88 – c) r2 = 0.842
a = N content (meq·100 g-1
DM)
b = ash alkalinity (meq·100 g-1
DM)
c = pH of the herbage
Playne & McDonald (1966) as well reported the incidence of the anion fractions on
the total BC (influence of 68 – 80 % in fresh material and 73 – 88 % in silages). The
higher the BC, the more lactic acid is needed to achieve the optimal silage acidity.
Hence, a low BC is favored. Wilting for example is known to reduce the BC, probably
by the reduction of organic acids (Playne & McDonald, 1966). But in ripe beans,
where DM is above 85 %, wilting seems to be useless.
It is known that water soluble anion fractions can be leached out by gradient
concentration through the highly permeable seed coat into the soaking water (Lee &
Karunanithy, 1990; Bau et al., 1997; Kaushik et al., 2010). However, no previous
experiments in literature were found, where soaking was used to reduce BC.
In the present study soaking was proved to reduce BC (see Table 22 and Table 23)
and regression equations were produced to predict the BC in JBN and CWP in
accordance to soaking time and grain:water ratio:
BC(JBN) = 0.804a – 0.180b r2 = 0.678 SE = 0.175 n = 48
BC(CWP) = 0.892a – 0.177b r2 = 0.827 SE = 0.151 n = 48
a = grain:water ration (g fresh beans·l
-1)
b = soaking time (h)
BC = (g lactic acid·g-1
dry matter)

Discussion
93
Unfortunately, other variables that might have an influence in how soaking affects BC
were not considered for these equations. The hardness, acidity or temperature of the
soaking water should be considered in future experiments. This would help to explain
the process in a better way.
Soaking might cause as well undesired leaching of most of the water soluble
nutrients. According to Kaushik et al. (2010) soaking soybeans for 12 h at room
temperature in deionized water (1:5, w/v) resulted in a decrease of 9 % in K, 4 % in
Ca, 5 % in Mg, 7 % in P and 3 % in Fe. Luo et al. (2009) concluded, that mineral
losses due to soaking in faba beans can vary in a wide range (Ca: 20 - 61 %, Fe: 33 -
61 % and Zn: 8 - 51 %), depending of soaking conditions (water quality, acidity or
temperature).
In the present study, soaking was found to affect the content of selected minerals of
legume grains, compared to the corresponding raw and not soaked JBN or CWP
(see Table 24). A reduction of 19, 33, 8, 59, 42 and 67 % was observed in CWP after
30 h and a grain:water ratio of 1:5 (w/v) for Ca, P, Na, K, Mg and Cl, respectively. In
JBN, reductions of 4, 9, 15 and 7 % of Ca, P, K and Mg, respectively, occurred. Only
in JBN, an apparent increase of 9 and 25 % for Na and Cl, respectively, was
determined. Other studies reported similar apparent increases of Na. When soaking
9 h in 0.5 % NaHCO3 solution, El-Adawy et al. (2000) found an apparent gain of 25 %
in soaked soybean and lupin and 33 % in common bean, when the rest of macro-
and microelements was reduced. An apparent increase was detected as well for Zn,
Fe, Cu and Mn, when faba bean (Luo et al., 2009) and soybean (Kaushik et al.,
2010) were soaked under different conditions. The reduction of other minerals could
increase the percentage in relation to the total ash content of those ones presumably
not leached like Na and Cl.
The WSC as well are susceptible to washing during soaking. Longland et al. (2011)
soaked 7 different kind of hays for up to 16 h in water (8º C) and 27 % in average
(ranging from 6 to 54 %) of the hay´s WSC were leached into the soaking water. In
beans like cowpea, Akinlosotu & Akinyele (1991) proved that soaking in water led to
a decrease of verbascose (49.4 %), stachyose (29.8 %) and raffinose (1.0 %).
Nevertheless, sucrose and fructose increased by 41.9 % resp. 43.0 %, and glucose
and galactose decreased by 55 %. When grains were dehulled, a further decrease of
verbascose (76.4 %) and raffinose (56 %) as well as an increase of sucrose (45.9 %)
Discussion
94
and glucose and galactose (63.6 %) was observed. In the present study, the effect of
soaking on WSC was not evaluated mainly for the low levels observed in these
grains (see Table 12). As it is reported by literature, soaking could contribute to
increase certain WSC fractions. Soaking involves the entry of water into the legume
kernels, wetting and dissolving of soluble nutrients, which makes all starch fractions
more susceptible to enzymatic hydrolysis (Eyaru et al., 2009). Further experiments
should be conducted in this sense.
Protein (N x 6.25) was not found to be lost during the soaking experiment, which is in
accordance to other studies (El-Adawy et al., 2000; Longland et al., 2011).
Fernandes et al. (2010) cited authors that confirmed that the protein content in lentils,
chick peas, red kidney beans, white kidney beans and black grams (Vigna mungo)
may not be affected by soaking, discarding the soaking water and cooking.
Special attention should be paid to other variables that could affect soaking effects on
the chemical composition of the beans. Not only their intrinsic physical characteristics
(e.g. hull thickness and permeability), but their chemical composition itself: the
distribution in the seed and the enzyme battery. Other variables, like ANF, are known
to influence minerals and enzyme activity. Phytic acid, dietary fiber and polyphenols,
among others, are affected by soaking (Ekholm et al., 2000; El-Adawy et al., 2000;
Lestienne et al., 2005a; Eyaru et al., 2009). This could explain why JBN and CWP
had a different performance during soaking.
The negative influence of soaking on water soluble nutrients like minerals could be
assumed to overshadow its real effectiveness on BC. But the loss of certain minerals
can be compensated by increasing bioavailability of the remaining ones (Lestienne et
al., 2005b; Fernandes et al., 2010).
Moreover, soaking reduces ANF in the plant material (see 2.3.2) by the activation of
preexisting enzymes in the seeds and/or the diffusion through the grain endosperm
(Vijayakumari et al., 1998). Similar explanations gave Khokhar & Chauhan (1986),
highlighting the influence of the gradient´s concentration mediated by a change in the
permeability of the seed coat. For example, the activity of ANF decreased as soaking
time was increased in JBN (Belmar et al., 1999).

Discussion
95
6.1.2 Pre-germination
Changes in the chemical compositions during germination of JBN and CWP have
been extensively reported (Ibrahim et al., 2002; Camargos et al., 2004; Ghavidel &
Prakash, 2007; Martin-Cabrejas et al., 2008). Diaz et al. (2007), when germinating
CWP under different conditions observed no influence for CP, exceptionally in total
darkness, where CP increased up to 34.5 % DM, representing 25 % more compared
to the control. Under total darkness NDFOM increased (57 % compared with the
control), as well as ADFOM, cellulose, and lignin as the germination process advanced
in the different trials. As the most abundant element, K increased by 25 % followed
by P, Mg and Ca. It was concluded that total darkness was superior to the light
variants. In contradiction to these authors, no influence of the illumination regime was
observed in the CP content for JBN and CWP, but an effect was found for the
germination time. After 72 h of germination an increase (P0.001) of nearly 7 % CP
of the DM was observed for CWP, much less than observed by Diaz et al. (2007) in
the same CWP variety (25 %). Akinlosotu & Akinyele (1991) reported a rise of 12 %,
which is more in accordance with our results. In JBN, an increment of 3 and 4 % CP
of the DM after 72 and 96 h was observed, respectively. Akpapunam & SefaDedeh
(1997b) reported for germinated JBN a reduction in CP after 72 h from 23 to 20 %.
As assumed, germination increased the WSC content. But the drastic
reduction after 12 h of germination in JBN (57 %) compared to raw JBN was not
observed in CWP. At the end of the experiment WSC increased (P0.05) in JBN
(25 %) and CWP (321 %) after 96 and 72 h, respectively. Akinlosotu & Akinyele
(1991) observed nearly the same WSC increase (294 %) in CWP after 72 h.
6.1.3 Pre-ensiling treatments and selected anti-nutritional factors
The amount of trypsin inhibitors detected in different legume seeds varies with
legume species and variety (Guillamon et al., 2008). During germination they are
transformed in a different way from one legume to another (Muzquiz et al., 2004).
Furthermore, comparisons between results of different authors are frequently limited
by the different inhibition units used. There is a general consensus that TIA can be
reduced through germination. Akpapunam & SefaDedeh (1997b) reported after 72 h
of germination a reduction of 79 % in JBN. In the present work the highest reduction

Discussion
96
of TIA was detected after 12 h (59 %). A higher pre-germination temperature of 29 ºC
vs. 25 ºC and oven temperature of 100 ºC (6 h) vs. only 60 ºC in the referred study
could be among the reasons for such a high TIA reduction. In CWP, 12 h of
germination produced as well the highest reduction of TIA (72 %), which was higher
than reported by Ibrahim et al. (2002) after 48 h (54 %). The reduction of TIA can be
associated with enzymatic degradation (Khokhar & Chauhan, 1986), which seems to
be higher in the first 12 h.
Definite conclusions are difficult to draw, when still there is not a specific and reliable
method to determine canavanine. Dmello et al. (1988) stated, that alternatives to the
PCAF technique like HPLC or IEC have to be improved. Some reports refer to the
use of HPLC with this purpose (Acamovic & Dmello, 1990; Viroben &
MichelangeliVargas, 1997; Ekanayake et al., 2007), but still there remains uncertainty
due to the cross-reactivity with histidine or products of the canavanine hydrolysis,
which hardly can be avoided even with advanced techniques (Viroben &
MichelangeliVargas, 1997).
After Bell (1960) suggested germination to reduce canavanine, different variants like
in our experiment (illumination regime, germination time) have been tested by several
authors. In addition, metabolism of canavanine and its distribution across the plant
during its growth have been studied (Rosenthal, 1970; 1972; Rosenthal, 1982;
Rosenthal & Berge, 1989; Hwang et al., 1996). Dmello et al. (1988) reported a
reduction of 24 % compared to the not germinated variant after 24 h of germination in
the darkness. In the present work, no influence of the illumination regime was
detected. However, after 12 h a pronounced reduction was determined (14 %) with a
further increase after 24 h.
6.2 Effect of different pre-ensiling treatments, additives and mixing with
sorghum on selected fermentation parameters in Jack bean and
cowpea silages
There are many reasons why silages with high DM contents are preferred. Apart from
using storage space more efficiently in silos, it is even of more relevance, that the DM
of the ensiled crop is inversely proportional to the fermentation losses (McDonald et
al., 1991).

Discussion
97
As a methodically consequence, the DM of soaked (SOK) and pre-germinated (PRG)
grains was considerably reduced, which influenced the silage DM. Compared to
moisture re-constituted (to approx. 65 % DM, MOR) silages, the DM of SOK and
PRG silages was lower (P0.05), independent of the type of grain and the additive
used. When SOK and PRG silages were mixed with SOR, the DM was increased and
no differences (P>0.05) were found with MOR silages (Figure 11). Nevertheless,
there remained the differences (P0.05) with those treatments when SOR was not
mixed independent of the additive and bean used (see Table A3 in the appendix).
Figure 11: Dry matter content in grain model silages sole or mixed with sorghum after 60 days
of storage submitted to different pre-ensiling treatments and additives (n=3)
CON, control; CWP, cowpea; MOL, molasses; MOR, moisture reconstituted; LAB, lactic acid bacteria;
PRG, pre-germinated; SOK, soaked; SOR, sorghum
Each error bar is constructed using 1 standard deviation from the mean.
Several studies, summarized by Jones (1988), reported about the effect of different
cereals when added to grass silages. In every case, DM was increased and lower
amounts of VFA, ammonia and losses were reported. In Figure 12 (see as well Table
A4 in the appendix) losses for every treatment of grain model silages are shown.
Outstanding is the amount of losses observed in PRG silages of CWP when no SOR
was mixed. Unfortunately, a detailed study during germination, if CWP was
contaminated with microbes, which might have had an effect on fermentation losses,
was not conducted.
CWP JBN
Dry
matt
er
(%)
0
10
20
30
40
50
60
0
10
20
30
40
50
60
not m
ixe
d
mix
ed
SO
R
LAB MOL MOL+LAB CON LAB MOL MOL+LAB CON
Additive
PRG
MOR
SOK

Discussion
98
Figure 12: Losses in grain model silages sole or mixed with sorghum after 60 days of storage
submitted to different pre-ensiling treatments and additives (n=3)
CON, control; CWP, cowpea; MOL, molasses; MOR, moisture reconstituted; LAB, lactic acid bacteria;
PRG, pre-germinated; SOK, soaked; SOR, sorghum
Each error bar is constructed using 1 standard deviation from the mean.
Silage fermentation reaches its climax not only when the supply of available
substrate has been exhausted or the pH of the crop mass has decreased to the point
at which microbial growth is inhibited, but also when there is a lack of available water
in the crop (aw), which hampers the growth of microbes (Wilkinson & Davies, 2013).
The lower the DM and the higher the yeast counts (> 105·g-1 FM), the more
likely is the increase of DM losses (Muck, 1988; McDonald et al., 1991; Borreani &
Tabacco, 2010). The DM affects as well the plant enzymes’ activity, depending of the
silage conditions. Enzymes can remain active during ensilage, hence contributing to
its deterioration. The activity of proteolytic enzymes correlates linearly and negatively
with a silage DM > 50 % and almost no activity is detected > 75 % DM (Muck, 1988).
In most of the pre-treated silages where SOR was not mixed, DM was < 50 %, which
increased losses compared to the rest.
The pre-treating conditions can contribute as well to an increase of the microbial
population. In nature, seeds are colonized by several bacteria (Darrasse et al., 2010)
and fungi (Houssou et al., 2009) and they persist during all plant vegetative stages
(Darrasse et al., 2010). Remains of soil and crop often appear mixed with grains after
harvesting, like it was found in CWP and JBN. This is a common way soil-borne
CWP JBN
Fe
rmen
tati
on
lo
sses (
% F
M)
0
1
2
3
4
5
6
7
0
1
2
3
4
5
6
7
not m
ixe
d
mix
ed
SO
R
LAB MOL MOL+LAB CON LAB MOL MOL+LAB CON
Additive
PRG
MOR
SOK
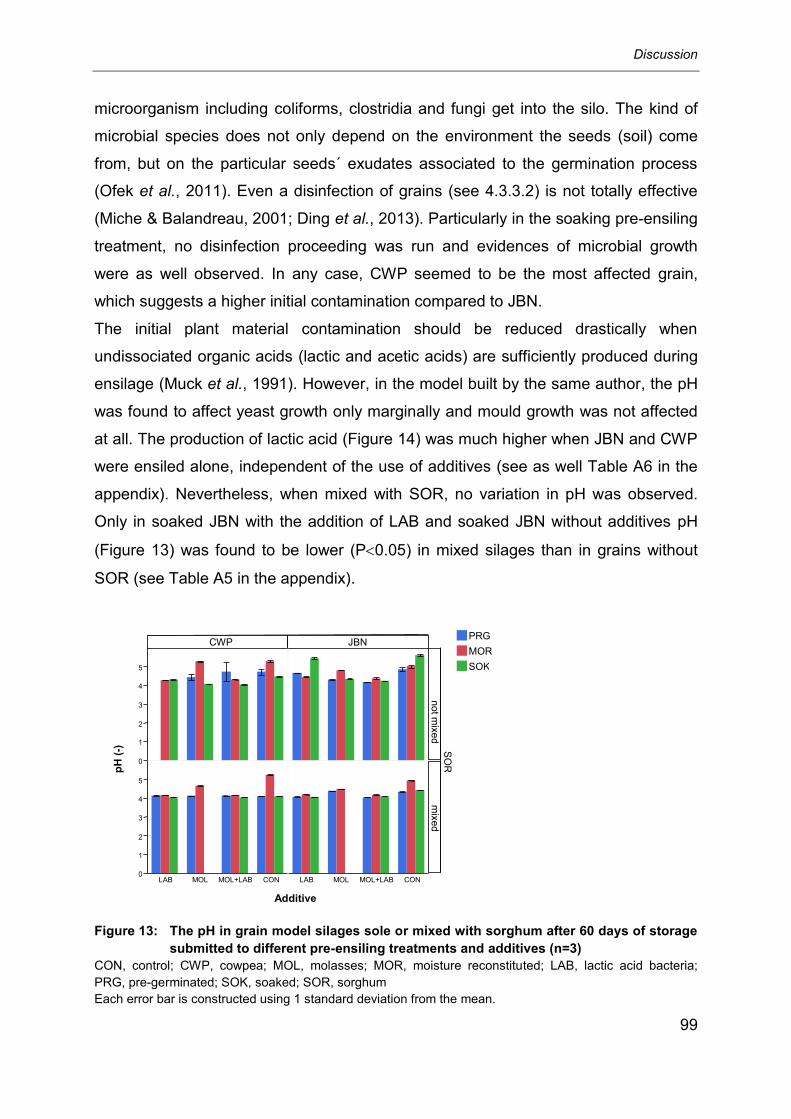
Discussion
99
microorganism including coliforms, clostridia and fungi get into the silo. The kind of
microbial species does not only depend on the environment the seeds (soil) come
from, but on the particular seeds´ exudates associated to the germination process
(Ofek et al., 2011). Even a disinfection of grains (see 4.3.3.2) is not totally effective
(Miche & Balandreau, 2001; Ding et al., 2013). Particularly in the soaking pre-ensiling
treatment, no disinfection proceeding was run and evidences of microbial growth
were as well observed. In any case, CWP seemed to be the most affected grain,
which suggests a higher initial contamination compared to JBN.
The initial plant material contamination should be reduced drastically when
undissociated organic acids (lactic and acetic acids) are sufficiently produced during
ensilage (Muck et al., 1991). However, in the model built by the same author, the pH
was found to affect yeast growth only marginally and mould growth was not affected
at all. The production of lactic acid (Figure 14) was much higher when JBN and CWP
were ensiled alone, independent of the use of additives (see as well Table A6 in the
appendix). Nevertheless, when mixed with SOR, no variation in pH was observed.
Only in soaked JBN with the addition of LAB and soaked JBN without additives pH
(Figure 13) was found to be lower (P0.05) in mixed silages than in grains without
SOR (see Table A5 in the appendix).
Figure 13: The pH in grain model silages sole or mixed with sorghum after 60 days of storage
submitted to different pre-ensiling treatments and additives (n=3)
CON, control; CWP, cowpea; MOL, molasses; MOR, moisture reconstituted; LAB, lactic acid bacteria;
PRG, pre-germinated; SOK, soaked; SOR, sorghum
Each error bar is constructed using 1 standard deviation from the mean.
CWP JBN
pH
(-)
0
1
2
3
4
5
0
1
2
3
4
5
not m
ixe
d
mix
ed
SO
R
LAB MOL MOL+LAB CON LAB MOL MOL+LAB CON
PRG
MOR
SOK
Additive

Discussion
100
The inclusion of SOR increased the DM in pre-treated silages. At a higher
concentration of DM there is restricted lactic acid fermentation (Pieper et al., 2010;
Inoue et al., 2013; Wilkinson & Davies, 2013). The higher BC of sole JBN and CWP
compared with mixed SOR silages could be among the reasons, why solely ensiled
grains, even with a higher lactic acid production, showed much lower pH values.
Figure 14: Lactic acid content in grain model silages sole or mixed with sorghum after 60
days of storage submitted to different pre-ensiling treatments and additives (n=3)
CON, control; CWP, cowpea; MOL, molasses; MOR, moisture reconstituted; LAB, lactic acid bacteria;
PRG, pre-germinated; SOK, soaked; SOR, sorghum
Each error bar is constructed using 1 standard deviation from the mean.
The high BC of legumes implies a higher risk of butyric acid fermentation during
ensiling. Studies made in Germany, Sweden and Finland achieved only slight
fermentation improvements when wilting lucerne, galega, and red clover to 25 % DM.
However, when wilted to 40 % DM butyric acid fermentation was prevented
(Huhtanen et al., 2012). Furthermore, mixing legumes with cereals seems to alleviate
the negative effect on fermentation quality (Pursiainen & Tuori, 2008). In the present
study, mixing with SOR prevented butyric acid fermentation, as butyric acid could not
be detected in any of the treatments for both legumes. The use of SOR increased the
DM which seemed to enhance fermentation quality in pre-treated silages. The
depressing effect of DM on butyrogenesis was proved in MOR silages. As the DM
was set to approx. 65 %, neither in mixed nor in not mixed silages, butyric acid was
detected in any case, which is in accordance with ensiled peas, beans and lupines
CWP JBN
La
cti
c a
cid
(%
DM
)
-1 0 1 2 3 4 5 6 7 8
-1 0 1 2 3 4 5 6 7 8
not m
ixe
d
mix
ed
SO
R
LAB MOL MOL+LAB CON LAB MOL MOL+LAB CON
Additive
PRG
MOR
SOK

Discussion
101
with a similar DM (Gefrom et al., 2013) and ensiled triticale, barley and wheat grains
with 65 and 75 % DM (Pieper et al., 2010). The DM in silages is negatively correlated
to clostridal development, which is usually inhibited in silages > 45 % DM (Pahlow et
al., 2003).
As expected, ethanol was found in ensiled grains in levels not higher than 2 % of the
DM (Buchanan-Smith et al., 2003). Ethanolic fermentation was as well detected in
most of the silages in the present study, but barely exceeded 1 % of the DM (Figure
15). Therefore, the risk of yeast contamination during pre-ensiling treatments that
could affect the silage quality was minor. Only in silages without additive ethanol was
higher (P<0.05) compared to the rest (see Table A7 in the appendix).
The high DM of the silages did not inhibit ethanolic fermentation to the same extend
like in the case of butyrate. Although Pieper et al. (2010) found in their experiments a
correlation between the DM (65 and 75 %) and ethanol, they reported that ethanol
never exceeded 1 % of the DM. A low ethanol production was as well observed when
ensiling legume grains (Gefrom et al., 2013). Presumably, apart from the DM more
variables have to be considered, when acidic and alcoholic fermentation in grain
silages shall be explained, as grains have not only a different chemical structure than
forages, but as well a different epiphytic micro-flora.
Figure 15: Ethanol content in grain model silages sole or mixed with sorghum after 60 days of
storage submitted to different pre-ensiling treatments and additives (n=3)
CON, control; CWP, cowpea; MOL, molasses; MOR, moisture reconstituted; LAB, lactic acid bacteria;
PRG, pre-germinated; SOK, soaked; SOR, sorghum
Each error bar is constructed using 1 standard deviation from the mean.
CWP JBN
Eth
an
ol
(% D
M)
0.00
0.25
0.50
0.75
1.00
1.25
0.00
0.25
0.50
0.75
1.00
1.25
not m
ixed
mix
ed
SO
R
LAB MOL MOL+LAB CON LAB MOL MOL+LAB CON
Additive
PRG
MOR
SOK

Discussion
102
Enterobacteria are usually the second most numerous bacterial group in the epiphytic
microflora (Pahlow et al., 2003). They ferment carbohydrates, producing a wide
range of final products (e.g. 2,3-butanediol). The 2,3-butanediol is part of the so
called neutral fermentation, and therefore not desired in silage fermentation, what
Rooke & Hatfield (2003) described through the following stoichiometric equation:
4 pyruvate + 4 NADH 1 (2,3-butanediol) + 1 lactate + 1 ethanol + NAD + 3 CO2
In the present study, 2,3-butanediol was determined in meager quantities and only in
the case of the control treatments without any pre-ensiling treatment it was found to
be higher (> 2 % DM). In silages without any additive alcohols can be found in much
higher amounts like in untreated Italian ryegrass silage, for example, where the sum
of ethanol and 2,3-butanediol content at day 14 was about 7 times higher than that of
lactic and volatile fatty acids (Yan-bing & Nishino, 2012).
Furthermore, the differences in contents of this fermentation products are remarkable
comparing our silages with whole plant legume silages. Eriksson & Ericson (2012)
reported values between 0 and 4.1 % of the DM in 60 different not treated silages of
timothy grass and red clover, where DM ranged between 13 and 75 %. Other studies
report about higher amounts in lucerne (7.5 % DM) and red clover (5.4 % DM)
(Hymes-Fecht et al., 2012).
We observed that in general additives depressed 2,3-butanediol production. The
addition of LAB contributes to suppress alcoholic fermentation when acetates or
lactates are mainly produced (Yan-bing & Nishino, 2012). Presumably, the possible
contamination with enterobacteria was not produced by the pre-ensiling treatments
that far as it was feared.
Except ethanol, other alcohols are seldom referred to in literature about silage. One
reason could be their low contents and toxicity, like it is the case for propanol. Like
ethanol, propanol is produced mainly by yeasts and interferes with the lactic acid
production due to its neutral nature and aerobic stability (Rooke & Hatfield, 2003). In
the present study contents of propanol were generally negligible.
Table 55 summarizes the source of variation of the main parameters affecting
fermentation quality. As just discussed, ethanol was not affected by the pre-ensiling
treatment, neither it was by the interactions LEG*SOR, PET*LEG*SOR and
LEG*ADT*SOR. The pH value varies in relation to PET, LEG, ADT and if SOR was

Discussion
103
mixed or not, which was as well the case for every presented interaction (P<0.001).
Similar effects were observed for DM, lactic acid and NH3-N/Ntotal, although, like in
the case of ethanol, the interaction LEG*SOR did not produce any effect on lactic
acid. The losses in ROMOS were closely and significantly related to every factor
(PET, LEG, ADT, SOR) and their interactions, except the not significant interactions
PET*LEG*ADT and PET*LEG*ADT*SOR.
Table 55: Source of variation in fermentation parameters after 60 days storage in Jack bean
and cowpea model silages using a model with pre-ensiling treatment, grain type,
additive and sorghum inclusion as fixed effects
DM Losses pH LA AC Ethanol NH3-N/Ntotal
PET *** *** *** *** *** n.s. ***
LEG ** *** *** *** *** *** ***
ADT *** *** *** *** * *** ***
SOR *** *** *** *** *** *** ***
PET*LEG *** *** *** *** ** *** ***
PET*ADT *** *** *** *** *** *** ***
PET*SOR *** *** *** *** *** *** ***
LEG*ADT *** *** *** *** n.s. *** ***
LEG*SOR *** *** *** n.s. n.s. n.s. ***
ADT*SOR * ** *** *** *** *** ***
PET*LEG*ADT *** n.s. *** *** ** *** ***
PET*LEG*SOR *** *** *** *** n.s. n.s. ***
PET*ADT*SOR *** *** *** *** ** *** ***
LEG*ADT*SOR ** * *** *** n.s. n.s. ***
PET*LEG*ADT*SOR *** n.s. *** *** n.s. *** ***
AC, acetic acid; ADT, additive, DM, dry matter; PET, pre-ensiling treatment; LA, lactic acid;
LEG, legume (Jack bean or cowpea); SOR, sorghum
n.s. = not significant, * P<0.05, ** P<0.01, *** P<0.001
6.3 Effect of different pre-ensiling treatments and additives on selected
anti-nutritional factors in Jack bean and cowpea silages mixed or not
mixed with sorghum
The most commonly studied Trypsin inhibitor (TI, Kunitz) was described in soybean
as a protein globulin type (Kunitz, 1945; 1946). Other protein-like molecules, but with
less active inhibitory capacity (Bowman-Birk), were later isolated (Bowman, 1948;
Birk, 1985). Irrespective of whether a TI is classified as the Kunitz or Bowman-Birk

Discussion
104
family, they vary from one bean to another (Gatehouse et al., 1980), even in relation
to stress conditions and maturity stage (Benjakul et al., 2000). Nowadays, heat
treatment remains as the most efficient TIA deactivation method. But even the
expected thermolability of TI is strongly connected to the grain’s origin (Benjakul et
al., 2000). Some TI are extremely thermostable, like those in lima bean (Phaseolus
lunatus), keeping 95 % of the inhibitory capacity after 30 min autoclaving (15 lb)
(Sohonie & Ambe, 1955). Others like in chick pea retained all of their activity after
being heated (80 °C, 5·min-1) and only 50 % were inactivated by boiling (100 °C,
5·min-1) or roasting (130 °C, 8·min-1). The TI in faba beans still kept 20 % of their
original activity after boiling in water for 60 min (Richardson, 1981), while in soybean
it was destroyed completely at 92 °C (5·min-1) (Benjakul et al., 2000). Hence,
differences in the origin of the TI could have caused the different effects of ensilage
on TIA, which were more pronounced in CWP silages than in JBN (Figure 16).
Figure 16: Trypsin inhibitory activity (TIA) measured after 5, 20 and 60 days of storage in four
model silage treatments of Jack bean and cowpea after three pre-ensiling
treatments (n=3)
CWP, cowpea; MOL, molasses; LAB, lactic acid bacteria; SOR, sorghum
Each error bar is constructed using 1 standard deviation from the mean
CWP JBN
TIA
(m
g T
I·g
-1 D
M)
0 25 50 75
100 125
0 25 50 75
100 125
0 25 50 75
100 125
MO
R
PR
G
SO
K P
re-e
nsilin
g T
reatm
ents
0 10 20 30 40 50 60 0 10 20 30 40 50 60 Storage time (d)
Treatments MOL
MOL+LAB
SOR+LAB
SOR+MOL+LAB
Discussion
105
Figure 16 shows that TIA was affected (P<0.05) as the storage time was prolonged
for every treatment, independent of JBN and CWP pre-ensiling treatment. In JBN,
TIA was lower (P<0.05) after 60 days in MOR compared to SOK and PRG silages for
every treatment, but not between SOK and PRG silages. Only in the case of
treatments MOL and SOR+MOL+LAB, MOR was not different to SOK. No influence
of the pre-ensiling treatment was noticed in the case of CWP silages after 60 days of
storage (see Tables A8 and A9 in the appendix).
The activity of proteases in LAB is known to play a relevant role in transforming
proteins during fermentation (Arendt et al., 2011; Moslehishad et al., 2013). However,
other workers found that the transformation is more associated to a pH-induced
protein shift rather than to protein hydrolysis (Loponen et al., 2007), whereas LAB
fermentation is generally associated to TIA reduction (Azeke et al., 2005; Granito &
Alvarez, 2006; Khalil, 2006; Fernandez-Orozco et al., 2007; Silva et al., 2013;
Starzynska-Janiszewska et al., 2014). However, the references about the role of
silages on TIA reduction are meager.
Unexpectedly, HCN increased in every evaluated silage treatment where CWP was
used (Figure 17). In silages using JBN, HCN content varied (P<0.001) after 60 days
of storage in close relation to the pre-ensiling treatment used (see Table 56). In JBN
silages, HCN was reduced by approx. 17 % in the treatment JBN+LAB in moisture
reconstituted (65 % DM) silages and by approx. 41 % in JBN+MOL+LAB in pre-
germinated silages. For every pre-ensiling treatment, the addition of SOR increased
HCN by 10 - 25 %. Only in JBN+SOR+MOL+LAB, with pre-germinated JBN, HCN
was slightly reduced (5 %). It was in silages with pre-germinated JBN sole or mixed
with SOR with the addition of MOL+LAB, where the lowest HCN was measured with
47.85 and 37.69 mg·100 g-1, respectively. For all detected differences see as well
Tables A10 and A11 in the appendix.

Discussion
106
Figure 17: Hydrogen cyanide content after 5, 20 and 60 days of storage in four model silage
treatments of Jack bean and cowpea after three pre-ensiling treatments (n=3)
CWP, cowpea; MOL, molasses; LAB, lactic acid bacteria; SOR, sorghum
Each error bar is constructed using 1 standard deviation from the mean
Literature refers to a HCN reduction, when fermentation takes place (Reddy &
Pierson, 1994; Azeke et al., 2005; Azeke et al., 2007). As previously reported in
2.3.1, HCN is liberated from CG after enzymatic reaction by naturally occurring plant
enzymes or preferably basic hydrolysis over acid. Furthermore, Lactobacillus spp.
has been reported to synthesize β-glycosidase related to HCN releasing from CG
(Lei et al., 1999; Kostinek et al., 2005; Nwokoro & Anya, 2011). However, it remains
unclear what the necessary conditions in silages to favor LAB detoxifying capacity
are. Contradictory appears the fact that there is a -glucosidase activity peak at pH
4.0 - 6.2, which seems to be not affected under acid silage conditions. But, in the
case of -hydroxy nitrile lyase with an optimum at pH 5 - 6.5, silages are not the best
environment. Considering that non-enzymatic detoxification is fast at alkaline pH and
negligible below pH 5.5, the role of silages and LAB inoculants on the HCN reduction
should be further investigated.
CWP JBN
HC
N (
mg
·100 g
-1 D
M) 0
20
40 60 80
100
0 20
40 60 80
100
0 20
40 60 80
100
MO
R
PR
G
SO
K
Pre
-en
silin
g T
reatm
en
ts
0 10 20 30 40 50 60 0 10 20 30 40 50 60
Storage Time (d)
Treatment
s MOL
MOL+LAB
SOR+LAB
SOR+MOL+LAB
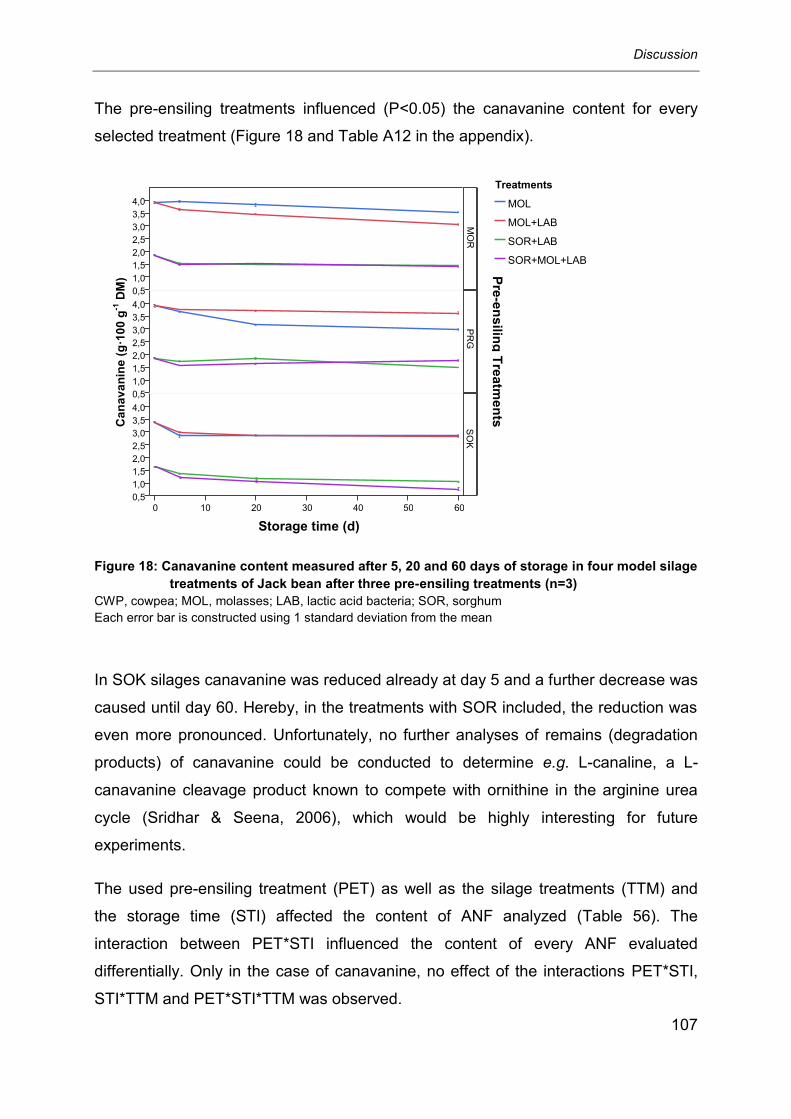
Discussion
107
The pre-ensiling treatments influenced (P<0.05) the canavanine content for every
selected treatment (Figure 18 and Table A12 in the appendix).
Figure 18: Canavanine content measured after 5, 20 and 60 days of storage in four model silage
treatments of Jack bean after three pre-ensiling treatments (n=3)
CWP, cowpea; MOL, molasses; LAB, lactic acid bacteria; SOR, sorghum
Each error bar is constructed using 1 standard deviation from the mean
In SOK silages canavanine was reduced already at day 5 and a further decrease was
caused until day 60. Hereby, in the treatments with SOR included, the reduction was
even more pronounced. Unfortunately, no further analyses of remains (degradation
products) of canavanine could be conducted to determine e.g. L-canaline, a L-
canavanine cleavage product known to compete with ornithine in the arginine urea
cycle (Sridhar & Seena, 2006), which would be highly interesting for future
experiments.
The used pre-ensiling treatment (PET) as well as the silage treatments (TTM) and
the storage time (STI) affected the content of ANF analyzed (Table 56). The
interaction between PET*STI influenced the content of every ANF evaluated
differentially. Only in the case of canavanine, no effect of the interactions PET*STI,
STI*TTM and PET*STI*TTM was observed.
Ca
na
va
nin
e (
g·1
00
g-1
DM
)
0,5 1,0 1,5 2,0 2,5 3,0 3,5 4,0
0,5 1,0 1,5 2,0 2,5 3,0 3,5 4,0
0,5 1,0 1,5 2,0 2,5 3,0 3,5 4,0
MO
R
PR
G S
OK
Pre
-en
silin
g T
reatm
en
ts
0 10 20 30 40 50 60
Storage time (d)
Treatments
MOL
MOL+LAB
SOR+LAB
SOR+MOL+LAB

Discussion
108
Table 56: Source of variation in anti-nutritional factors in Jack bean and cowpea model silages
using a model with pre-ensiling treatment, treatment and storage time as fixed
effects
TIA HCN
Canavanine1 JBN CWP JBN CWP
PET *** ** *** *** **
TTM *** * *** *** **
STI *** ** *** *** *
PET*TTM *** * *** *** *
PET*STI *** ** *** *** n.s.
STI*TTM *** * *** *** n.s.
PET*STI*TTM *** n.s. *** *** n.s.
CWP, cowpea; HCN, hydrogen cyanide; JBN, Jack bean; PET, pre-ensiling treatment; LEG, legume (Jack
bean or cowpea); STI, storage time; TIA, trypsin inhibitory activity; TTM, treatment
n.s. = not significant, * P<0.05, ** P<0.01, *** P<0.001 1 Corresponding only to model silages (ROMOS) where JBN was used as grain.
6.4 Silages of Jack bean-sorghum and cowpea-sorghum mixtures as
feedstuffs for pigs
The refusal of the pigs to eat the diets containing Jack bean has given rise to the
question for possible explanations. An approach was that the grains might have been
contaminated with mycotoxins, especially with deoxynivalenol (DON). Pigs react
highly sensitive to this mycotoxin, decreasing drastically the food intake. From the
practical point of view it is commonly detected at levels high enough to cause
adverse effects. Furthermore, the trivial name “vomitoxin” has also been assigned to
DON because of its acute ability to induce vomiting (Pestka, 2007; Döll & Dänicke,
2011).
Surprisingly, no DON was detected in the beans or in any of their corresponding
silages (Table 52). Only in SOR a small amount (57.3 ng·g-1 DM) was found, which
was far below the critical value of 400 µg·kg-1 DM in feed materials and feedstuffs
accepted by the European Union (EFSA, 2004).
In the literature reviewed, there were no reports about JBN or CWP contaminated
with DON. This mycotoxin occurs predominantly in cereals, but SOR is excluded from
reports of contamination with Fusarium mycotoxins (Placinta et al., 1999; Döll &
Dänicke, 2011). The European Food Safety Authority (2013) cited, that it is less often
reported. Some workers refer to the effect of LAB fermentation on DON and binding
as the most probable removal mechanism, which leads to a nearly 100 % reduction

Discussion
109
(Niderkorn et al., 2006; Niderkorn et al., 2007; Boudra & Morgavi, 2008; Arendt et al.,
2011). Other workers observed an increase or no effect on DON during silage
(Kristensen et al., 2010; Teller et al., 2012). They considered that factors like silage
DM, level of pre-harvest mycotoxin contamination or LAB strain could influence the
effects on DON so that it is not possible to rely on ensilage completely.
The real cause why the inclusion of JBN in diets reduced so drastically the pigs’
intake remains unclear. It has been proved that only 5 % of raw JBN in diets for pigs
hamper the intake extremely (Michelangeli et al., 2004b; Torres et al., 2013). The
single action of an ANF or the combination of some of them remains as strong
argument. Authors like Enneking et al. (1993) observed intake suppressions when
fed canavanine dihydrochloride to pigs mixed in a canavanine free diet. Belmar &
Morris (1994a) reported about a decrease in feed intake when canavanine was
added to a maize-soybean diet at only 0.8 g·kg-1. The inactivation (toasting: 194 °C
for 18 min) of canavanine (95 % compared to that in raw beans) improved intake in
pigs, but with a lower performance compared to the control (Michelangeli et al.,
2004a; Michelangeli et al., 2004b). The same authors considered that an acceptable
intake can be achieved when the content of canavanine is 0.06 % of the DM or lower.
From that point of view, the canavanine content is still too high (1.62 % DM) in
JBN+SOR mix silages (see Table 51), explaining why some animals refused JBN
containing diets. Contradictory appear other experiments (Yin et al., 1993; Yin et al.,
2002). Among many other feedstuffs, they offered raw or autoclaved JBN. No
negative pig behavior was reported and a rather exceptional ileal and fecal
digestibility of proximate nutrients and AA was shown.
6.4.1 Standardized ileal digestibility of essential amino acids in raw cowpea-
sorghum mixtures and corresponding silages
Due to their high BC and protein content, legumes are especially susceptible to
proteolysis during silage. The combined action of both, plant and silage microbial
enzymes, can reduce the true protein content of the original herbage by up to 80 %
by the end of the conservation period (Borreani et al., 2006). Furthermore, this can
change from one plant species to another. In tannin-containing species, the protein
degradation process during ensiling is reduced in comparison to non-tannin

Discussion
110
containing species (Albrecht & Muck, 1991). As in JBN and CWP not only tannins but
other ANF were observed in different quantities (see Table 51), the effect on protein
conservation was expected to have some variations.
The AA composition of mixed silages is shown in Table 57. In CWP+SOR, losses
affected most of the essential AA under evaluation, only TYR (+1.5 %) and HIS
(+6.4 %) were observed to increase relatively compared to the raw mixture. In
contradiction, higher amounts of most AA were observed in JBN+SOR silages than in
the not ensiled mixture. Only for GLU (-2.6 %), ALA (-4.5 %), CYS (-0.5 %) and MET
(-3.6 %) a reduction was observed.
Table 57: Losses and gains of amino acids comparing raw and ensiled mixtures of cowpea or
Jack bean with sorghum
AA
CWP+SOR JBN+SOR
Raw
mixture
Silage
Losses (-) or
gains (+)
Raw
mixture
Silage
Losses (-) or
gains (+)
(g·kg-1 DM) (g·kg
-1 DM) (%) (g·kg
-1 DM) (g·kg
-1 DM) (%)
ASP 17.72 16.88 -4.7 14.61 14.77 +1.1
THR 6.62 6.35 -4.1 6.44 6.50 +0.9
SER 8.66 7.96 -8.1 8.20 8.24 +0.5
GLU 33.97 31.85 -6.2 25.62 24.95 -2.6
GLY 6.85 6.84 -0.1 5.83 5.98 +2.6
ALA 9.83 9.63 -2.0 9.35 8.93 -4.5
VAL 9.01 8.64 -4.1 7.48 7.79 +4.1
ILE 8.19 6.83 -16.6 6.16 7.05 +14.4
LEU 16.53 15.73 -4.8 15.33 15.38 +0.3
TYR 4.13 4.19 +1.5 4.54 4.58 +0.9
PHE 9.97 9.50 -4.7 7.58 7.65 +0.9
HIS 5.45 5.80 +6.4 12.26 12.62 +2.9
LYS 9.08 8.26 -9.0 6.34 6.71 +5.8
ARG 10.13 9.99 -1.4 7.24 7.60 +5.0
PRO 8.96 8.86 -1.1 8.56 8.61 +0.6
CYS 2.23 2.04 -8.5 1.97 1.96 -0.5
MET 2.76 2.54 -8.0 2.22 2.14 -3.6
The addition of tannic acid to alfalfa silages by Guo et al. (2008) resulted in a
reduction (P<0.05) of ARG (-67.4 %), HIS (-3.9 %), LYS (-5.6 %) and THR
Discussion
111
(-48.0%), but showed an increase of ILE (+21.7 %), LEU (+9.8 %) and VAL
(+11.7 %), whereas MET and PHE remained unaltered. The authors stated that the
silage quality (low pH) corresponded to a higher AA protection. But as the pH values
in JBN+SOR and CWP+SOR mix silages were rather similar (4.01 and 4.00,
respectively), ANF could play a decisive role.
Several workers claim that legume silages are typically more stable on exposure to
air compared to grass silage, because they might contain a natural compound that
inhibits the growth of spoilage microorganisms (Wilkinson & Davies, 2013). Further
researches should be conducted in order to test the role of other ANF than tannins on
the preservation of proximate nutrients during silage fermentation.
Paradoxically, what could be seen as beneficial during silage fermentation and
aerobic stability represents a drawback, when silages with remains of naturally
occurring ANF are fed to the animals. Certainly, it is the inactivation of naturally
occurring ANF what improves animal performance.
The content of ANF in the diet depresses ileal CP and AA digestibility (Schulze et al.,
1997; Myrie et al., 2008; Jezierny et al., 2010; Jezierny et al., 2011; Gilani et al.,
2012). Yin et al. (2002) observed an increase of the apparent ileal digestibility of CP
and AA (P<0.01) as a result of heat treatment in both common soybean and black
soybean varieties. They stated that the trypsin inhibitor deactivation was the main
cause. In the present work, it was expected that most essential AA will improve SID
in CWP+SOR mix silages. Unexpectedly, only for MET a significantly increased
(P<0.01) SID was observed (see Table 53). However, most of the other essential AA
under evaluation showed an increase of SID as a tendency. The reduction of TIA
(56.8 %) and CT (37.5 %) throughout fermentation could be among the reasons.
Contradictory, not always a reduction of ANF improves ileal AA digestibility. Other
authors were unsatisfied when no positive effect on the coefficients of the SID of
proteins and AA in germinated yellow and blue lupines was observed, despite a
decrease of the concentrations of the raffinose family oligosaccharides and alkaloids
in the sprouts (Chilomer et al., 2013). When ensiling wheat and barley grains, Hackl
et al. (2010) speculated that the increase (P<0.05) of SID for LYS, MET, THR, LEU,
PHE and ARG in wheat was due to the breakdown of non-starch-polysaccharides
during ensiling, but they failed to explain the reduction of SID for LYS and HIS in the
case of barley.

Discussion
112
Apparently, several variables are influenced while naturally occurring ANF are
deactivated by any method (see 2.3.2). The variation produced by a certain
deactivation method in SID of AA seems to be multifactorial. Some particular
examples are presented by Gilani et al. (2012). Furthermore, the individual animal
response plays a relevant role, which is rarely mentioned in the literature. This factor
could lead to considerable differences (Qin et al., 1996). In a certain way, this
explains the inhomogeneous reaction of the animals observed when consuming
JBN+SOR silage.
6.4.2 Apparent digestibility of proximate nutrients in raw cowpea-sorghum
mixtures and corresponding silages
As presented in Table 54, ensiling increased (P0.05) the apparent digestibility (AD)
of AEE (26.0%), ADFOM (16.8%) and CA (48.2%), whereas the digestibility of NDFOM
decreased (18.2%, P0.05).
The AD of AEE was increased (P<0.05) after ensiling grains of wheat (51.6 %),
triticale (46.0 %) and rye (19.3 %) (Hackl et al., 2010) and in high moisture content
silages of triticale and wheat (Pieper et al., 2010), although the authors could not
explain the reasons. Presumably, the AD of AEE was affected by the fatty acid
transformation that may occur during ensiling (Alves et al., 2011). It is known that
LAB play an active role in the isomerization, hydration, dehydration, saturation and
free fatty acid production (Ogawa et al., 2005; Yadav et al., 2007). However, the
increase of free fatty acids corresponds to a linear decrease of fat digestibility in the
same way when saturated fatty acids increase in relation to unsaturated fatty acids
(NRC, 2012). About 1 % of additional CF in the diet decreases the AD of AEE from
1.3 to 1.5 % (NRC, 2012), but CF was rather the same in the raw mixture and in
silages.
The reduction of ANF (see Table 51) during ensiling, particularly CT, seems to
explain better the increase of AD for AEE. As it was previously documented in the
present work, polyphenols (tannins) play a relevant role in interfering enzymatic
activity. Tea polyphenols produce an inhibition of lipase (Gondoin et al., 2010)
reaching up to 54 % in a concentration of 0.05 mg·ml-1 tea (He et al., 2007).
Recently, Wang et al. (2014) reported a 34 % inhibitory rate of proanthocyanidins

Discussion
113
(PC) on porcine lipase with a tendency to increase in proportion to PC concentration.
The hydrolysis of CT when ensiling concerns not only polyphenol oxidase activity but
as well microbial enzymes. Lactobacillus is well known as silage inoculant to improve
lactic acid production. However, limited is the information concerning the role of LAB
on ANF deactivation. The detanification capacity of L. plantarum (Rodriguez et al.,
2009; Natarajan & Rajendran, 2012; Ren et al., 2013), for example, could be of better
use. The influence of other ANF, not determined in the present study but known to
affect enzymatic activity, could contribute to improve AD of AEE. Since they are
expected to be reduced when ensiling, further researches should be conducted in
this direction.
The increase of the ADF/NDF ratio due to hemicelluloses (Hcell) breakdown might
explain the decrease of NDF digestibility in the silage compared to the raw mixture.
Jaurena & Pichard (2001) agree with our report assuming Hcell as the most widely
hydrolyzed fiber fraction when ensiling lucerne with the addition of barley or maize.
They found NDF to reduce digestibility and assume the increase of ADF/NDF ratio as
the main reason. McDonald et al. (1991) cited several authors that found as much as
half of Hcell could be degraded during ensilage. They were persuaded that the
hemicellulases present in the original herbage or in bacteria, as well as the hydrolysis
by organic acids produced during fermentation are the possible reasons for Hcell
breakdown. However, since it has been failed to demonstrate hemicellulase activity in
bacteria isolated from silages and the sensibility of plant hemicellulases to low pH
and temperature, the acid hydrolysis seems the most appropriate explanation.
Whether the concentration of natural occurring acids in silages produce any Hcell
breakdown could not be sustained (McDonald et al., 1991). The capacity of
Lactobacillus spp. to use the most common occurring Hcell (e.g. xylan, arabinoxylan
and β-glucan) seems less probable (Crittenden et al., 2002). However, it has been
proved that they can metabolize hydrolysis products of hemicelluloses, e.g
xylooligosaccharides and β-glucooligosaccharides, but not arabinoxylooligo-
saccharides (Crittenden et al., 2002; Falck et al., 2013). More studies should be
conducted to understand Hcell fermentation in silages.
Ensilage did not produce any effect (P<0.05) on OM digestibility. It is possible that
labile fractions in NDF after hydrolysis during silage fermentation were conserved
and later recovered as cellular content (Jaurena & Pichard, 2001).

Discussion
114
Starch was highly digestible in the raw mixture and in the silage. It was remarkable
how much starch was fermented during ensilage. In JBN+SOR and CWP+SOR
silages were found about half the amount than in the raw mixture (Table 46). Other
studies reported similar occurrences in cereal and grain silages (Hackl et al., 2010;
Pieper et al., 2010; Gefrom et al., 2013). Gefrom et al. (2013) assumed that LAB
were the main responsible due to the significant starch reduction in inoculated
treatments compared to not inoculated variants. Indeed, apart of plant amylases
being involved in starch hydrolysis (Muck, 1988), amylolytic LAB have been
identified, specifically L. plantarum (Reddy et al., 2008). Paradoxically, Pieper et al.
(2010) stated that the strains of L. plantarum used, which were the same used by
Gefrom et al. (2013) and Hackl et al. (2010) and in the present study, have not a
proved starch hydrolytic capacity. Natural occurring fermentations in common beans
and lentils report that starch reduction is associated to lower pH values (Granito et
al., 2002). Further studies should be conducted to identify natural occurring starch
hydrolytic enzymes in JBN, CWP and SOR or in the associated epiphytic flora in
JBN+SOR and CWP+SOR mixed silages.

Conclusions
115
7 Conclusions
Based on the methodological studies about ensiling tropical legume grains sole or
mixed with sorghum, the following conclusions can be drawn, that are of special
relevance for the future use of these feedstuffs for growing-finishing pigs:
1. The grains of Jack bean (JBN, Canavalia ensiformis [L.] DC) and cowpea (CWP,
Vigna unguiculata [L.] Walp) var. INIFAT-93 have good nutritional characteristics
but like most legumes they are high in buffering capacity (BC) and low in water
soluble carbohydrates (WSC), which makes them difficult to ensile. Sorghum
(SOR, Sorghum bicolor [L.] Moench) as a cereal grain has a more favorable
ensilability due to a low BC, but the amount of WSC is apparently not high enough
to obtain a sufficient WSC content in the tested mixtures of legume grains and
SOR for achieving good ensilability characteristics.
2. According to the Rostock Fermentation Test (RFT), an in vitro test on ensilability,
and Rostock model silages (ROMOS) JBN and CWP, either alone or mixed with
SOR, show good fermentation qualities and can therefore be conserved as
silages. However, the addition of LAB is decisive to improve silage quality,
independent of the used pre-ensiling treatment.
3. Soaking as a pre-ensiling treatment reduces the BC in JBN as well as in CWP.
Thereby, the values for BC are lower the longer the soaking time is and the bigger
the soaking water volume is in respect of the grains. What remains unclear is the
entire effect of the BC reduction on the ensilability provoked by soaking. As grains
increase their moisture content passing the pre-ensiling treatment of soaking, high
moisture silages are produced (DM < 65 %), what in general might be beneficial
for ensilage due to a higher water activity compared to remoistened silages with a
DM of 65 %.
4. Soaking leads to an undesired reduction of minerals. In both legume grains Ca, P,
K and Mg are slightly leached by soaking, whereas Na and Cl apparently only
decrease in CWP, but increase in JBN. As soaking is commonly reported to
increase the bioavailability of minerals, the apparent drawbacks of soaking on the
content of minerals should be studied more exactly.
5. Pre-germination prior to ensiling increases the content of water soluble
carbohydrates (WSC), reaching a peak after 96 h in JBN and after 72 h in CWP.
The illumination regime produces marginal differences in the WSC content and no

Conclusions
116
differences in the trypsin inhibitory activity (TIA) and the content of canavanine.
The highest reduction of TIA and canavanine in the legume grains is observed
already after 12 h and independent of the illumination regime.
6. Although a general reduction of anti-nutritional factors (ANF) due to the silage
process can be expected, ensiling affects the content of the selected analyzed
ANF in different ways. While a reduction of TIA is accompanied by an increasing
storage time in CWP silages, the effect of ensilage on a TIA decrease is meager in
JBN silages. On the contrary, HCN is reduced in JBN silages, but increased in
every evaluated treatment of CWP silage after 60 days of storage. Canavanine is
reduced in JBN silages with soaking as pre-ensiling treatment, whereas the effects
of remoistening or pre-germination on the canavanine content are only marginal.
7. It is known that due to a wide range of ANF present in the grains of JBN the
proportion of this legume has to be restricted in the diet in particular for
monogastrics. However, it is expected that ensilage has a positive effect on the
reduction of several ANF. Thus the rejection of the silages of soaked JBN mixed
with sorghum by the pigs of the digestibility trials could indicate, that the extent of
reduction of ANF in JBN through ensiling was insufficient.
8. In silages of soaked CPW mixed with SOR (to achieve 18 % CP of DM in the mix)
ensiled with additives (MOL+LAB), only methionine showed a significantly higher
(P<0.05) standardized ileal digestibility (SID) compared to the corresponding raw
mixture. For the majority of the other tested amino acids and nitrogen an increase
of SID was observed as a tendency (P>0.05), whereas lysine and cystine seemed
to be unaffected.
9. Ensiling a mixture of pre-soaked CWP and SOR causes a remarkable increase of
the digestibility of crude ash as well as AEE and ADFOM, whereas the digestibility
of OM and CP remains fairly unaffected. The contradictory effect of ensilage on
the digestibility of NDFOM needs to be further clarified.
Summary
117
8 Summary
8.1 Summary
The developing countries in tropical regions face a feed scarcity that negatively
affects their livestock industry. The necessity to import most of the feedstuffs
represents a barrier against the sustainability of the animal production. Many
alternative feedstuffs have been widely studied, but until now they are only partial
solutions.
Due to their agro-technical and nutritional characteristics, grains of Jack bean (JBN),
cowpea (CWP) and sorghum (SOR) are assumed to be alternatives to conventional
feedstuffs in pig feeding. However, as they are well known to contain anti-nutritional
factors (ANF), their efficient use in diets for pigs is hampered. To face the problem of
feed storage, cost-effective methods like ensilage are preferred, but are limited due
to the generally low ensilability especially of the legume grains. For that reason, the
aim of the present study was to find out if ensiling JBN and CWP grains sole or mixed
with SOR would be an effective method, not only to guarantee that the nutritional
value is preserved but moreover is improved for pig feeding by reducing the main
ANF they contain.
Therefore, the ensilability of JBN and CWP grains was, as a first step, evaluated
through an in vitro rapid fermentation test (RFT). Two mixtures with sorghum (to
reach 20 or 24 % crude protein [CP] in the dry matter [DM]) were used and the effect
of additives (lactic acid bacteria inoculant [LAB] and molasses [MOL]) was tested.
It was assumed that increasing the low content of water soluble carbohydrates
(WSC) and decreasing the high buffering capacity (BC) in JBN and CWP would
improve ensilability, whereas pre-germination (PGR) and soaking (SOK) as pre-
ensiling treatment (PET) were thought to increment WSC and to reduce BC,
respectively. The illumination regime and PGR time, in the case of PGR and soaking
time and grain:water ratio (w/v) in the case of SOK were used as fixed factors.
Lab scale silages (ROMOS) were prepared to measure the effect of additives and
mixing with SOR (18 % CP of DM) on the pH value and the main fermentation
products (lactic acid, volatile fatty acids, alcohols and ammonia). As PET, moisture
reconstitution to 65 % DM (MOR) as well as PGR and SOK were evaluated.
Furthermore, the impact of storage time (STI) on the reduction of trypsin inhibitory
activity (TIA), HCN (hydrogen cyanide) and canavanine (only for JBN-containing
Summary
118
silages) was determined in selected treatments with the best fermentation quality
after 60 days.
Considering the results of model silages and some relevant issues under practical
conditions, soaked grains (grain:water ratio of 1:4 [w/v]) and 24 h soaking) of JBN or
CWP mixed with SOR (18 % CP of DM) with the addition of MOL and LAB were
ensiled in plastic tons (120 l volume) for 60 days to be used in animal feeding trials to
determine the standardized ileal digestibility (SID) and the apparent digestibility. For
SID, minipigs with an ileal-rectal anastomosis were allocated in a Latin square
design. The SID of essential amino acids in silages was calculated through a
regression method and compared with the corresponding raw mixture. The
determination of the apparent digestibility (AD) of selected nutrients (organic matter
[OM], crude ash [CA], crude protein [CP], acid ether extract [AEE], crude fiber [CF],
neutral detergent fiber [NDFOM], acid detergent fiber [ADFOM] and starch) was
conducted with growing-finishing pigs, as well allocated in a Latin square design.
The main results can be summarized as follows:
1. The content of WSC increased as PGR time increased, independent of the
illumination regime. After 96 h in JBN and 72 h in CWP, WSC contents were
increased by 25 and 321 %, respectively. SOK reduced the BC in both JBN and
CWP, which was most pronounced the longer the time and the higher the water
volume for SOK were.
2. As a consequence of soaking both legume grains, Ca, P, K and Mg were slightly
leached, whereas Na and Cl apparently only decreased in CWP, but increased in
JBN. The apparent drawbacks of SOK on the content of minerals should be
studied in more detail.
3. Analyzing the effect of PGR on TIA and canavanine, the highest reduction of TIA
and canavanine occurred after 12 h independent of the illumination regime, which
was in contrast to the WSC content.
4. The evaluated fermentation parameters in RFT and ROMOS revealed a good
fermentation quality of JBN and CWP either alone or mixed with SOR,
independent of the PET used. However, the use of LAB is recommended to
guarantee an optimal fermentation.

Summary
119
5. In CWP silages an increasing STI was accompanied by a reduction of TIA, but the
effect of ensilage on a TIA decrease was meager in JBN silages. On the contrary,
HCN was reduced in JBN silages, but increased in every evaluated treatment of
CWP silages after 60 days of storage. Canavanine was reduced in JBN silages
with soaking as pre-ensiling treatment, whereas the effects of remoistening or pre-
germination on the canavanine content were only marginal.
6. It is assumed that the extent of ANF reduction through ensiling JBN on larger
scale in plastic tons was insufficient compared to model silages, as the animals
refused the offered JBN diets during the experiments of SID and AD. However, the
CWP ton silages were well consumed.
7. The SID of amino acids in silages compared to the corresponding raw mixture was
found to be significantly higher (P<0.05) only for methionine. However, for the
other tested amino acids and nitrogen an increase of SID was observed as a
tendency (P>0.05), whereas lysine and cystine seemed to be unaffected.
8. Remarkable increases of the AD in silages compared to the raw mixture were
found for CA as well as for AEE and ADFOM, whereas the digestibility of OM and
CP remained fairly unaffected by the ensiling process. Contradictory was the
reduction of the NDFOM digestibility after fermentation. Further experiments should
be conducted to give an explanation for this finding.
8.2 Zusammenfassung
Die Entwicklungsländer der tropischen Gebiete sehen sich mit einem Mangel an
Futtermitteln konfrontiert, der ihre Viehhaltung negativ beeinflusst. Die Nachhaltigkeit
der Tierproduktion wird dabei maßgeblich durch die Notwendigkeit des Futtermittel-
imports eingeschränkt. Die Vielzahl untersuchter alternativer Futterressourcen stellt
bis zum heutigen Tag nur eine unzureichende Lösung dar.
Aufgrund ihrer agrotechnischen und ernährungsphysiologischen Eigenschaften
werden die Körner von Jackbohne (JBN), Kuhbohne (CWP) und Sorghum (SOR) als
Alternativen zu den konventionellen Futtermitteln in der Schweineernährung
angesehen. Allerdings wird ihr effizienter Einsatz in Rationen aufgrund der Gehalte
an anti-nutritiven Inhaltsstoffen (ANF) erschwert. Um dem Problem der
Futterlagerung dieser Körner zu begegnen, sind kostengünstige Verfahren wie die

Summary
120
Silierung zu bevorzugen. Die im Allgemeinen geringe Silierbarkeit, insbesondere der
Leguminosenkörner, steht dem jedoch im Wege. Daher war es das Ziel der
vorliegenden Arbeit zu untersuchen, ob die Silierung von JBN und CWP Körnern
alleine oder gemischt mit SOR eine geeignete Methode ist, um den Futterwert nicht
nur zu erhalten, sondern darüber hinaus durch die Reduzierung der hauptsächlich
vertretenen ANF zu verbessern.
In einem ersten Schritt wurde die Silierbarkeit von JBN und CWP Körnern in einem in
vitro Fermentationstest (RFT) bestimmt. Dafür wurden zwei Mischungen mit SOR
verwendet (um jeweils 20 oder 24 % Rohprotein [CP] in der Trockenmasse [DM] zu
erzielen) und der Einfluss von Zusätzen (Milchsäurebakterienpräparat [LAB] und
Melasse [MOL]) geprüft.
Es wurde davon ausgegangen, dass eine Erhöhung des geringen Gehaltes
wasserlöslicher Kohlenhydrate (WSC) und eine Reduzierung der hohen Puffer-
kapazität (BC) in den Körnern von JBN bzw. CWP die Silierbarkeit verbessert, wobei
angenommen wurde, dass als Vorbehandlungen (PET) die Vorkeimung (PRG) den
Gehalt an WSC erhöht und das Einweichen (SOK) die BC senkt. Als fixe Effekte
wurden bei PRG das Lichtregime und die Dauer der PRG und bei SOK das
Verhältnis von Körnern zu Einweichwasser (w/v) und die Einweichdauer verwendet.
Um den Einfluss von Zusätzen und der Mischung mit SOR (18 % Rohprotein in der
Trockenmasse) zu untersuchen wurden Silagen auf Labormaßstabsebene (ROMOS)
angelegt und pH-Wert und Fermentationsprodukte (Milchsäure, flüchtige Fettsäuren,
Alkohole und Ammoniak) bestimmt. Neben PRG und SOK als PET wurde eine
Rückbefeuchtung der Körner auf 65 % DM geprüft. Weiterhin wurde in ausgewählten
Silagevarianten mit den besten Fermentationsqualitäten nach 60 Tagen Lagerung
der Effekt der Lagerdauer (STI) auf die Reduzierung der trypsinhemmenden Aktivität
(TIA), HCN und Canavanin (nur in JBN Silagen) bestimmt.
Ausgehend von den Ergebnissen der Modellsilagen und praxisrelevanter Aspekte
wurden in größerem Maßstab eingeweichte Körner (Körner:Wasser-Verhältnis von
1:4, 24 h eingeweicht) von JBN oder CWP gemischt mit SOR (18 % Rohprotein in
der Trockenmasse) unter Zusatz von MOL und LAB in Plastiktonnen (120 l Volumen)
für 60 Tage siliert, um in Fütterungsversuchen die praecaecale Verdaulichkeit (SID)
und die scheinbare Verdaulichkeit (AD) zu bestimmen. Für die Bestimmung der SID
wurden mit einer ileorektalen Anastomose ausgestattete Minipigs in einem

Summary
121
lateinischen Quadrat angeordnet. Die SID der essentiellen Aminosäuren der Silagen
wurde mittels Regressionsmethode berechnet und mit der korrespondierenden nicht
silierten Mischung verglichen. Die Ermittlung der AD ausgewählter Inhaltsstoffe
(organische Substanz [OM], Rohasche [CA], Rohprotein [CP], Rohfett [AEE],
Rohfaser [CF], neutrale Detergentienfaser [NDFOM], saure Detergentienfaser [ADFOM]
und Stärke) erfolgte mit Mastschweinen, welche ebenfalls in einem lateinischen
Quadrat angeordnet waren.
Die wesentlichen Ergebnisse können wie folgt zusammengefasst werden:
1. Mit zunehmender Dauer der PGR erhöht sich der Gehalt an WSC unabhängig
vom Lichtregime, wobei die WSC Gehalte nach 96 h bei JBN um 25 % und nach
72 h bei CWP um 321 % zunahmen. Durch SOK verringerte sich die BC sowohl in
JBN als auch in CWP. Die Reduzierung war ausgeprägter je länger die
Einweichdauer und je größer die Wassermenge zum Einweichen waren.
2. In Folge des Einweichprozesses beider Leguminosenkörner wurden Ca, P, K und
Mg geringfügig ausgewaschen, wohingegen der Gehalt an Na und Cl sich
offensichtlich nur in CWP verringerte und dagegen in JBN zunahm. Die
scheinbaren negativen Auswirkungen von SOK auf den Gehalt an Mineralstoffen
sollten noch eingehender untersucht werden.
3. Bei der Beurteilung von PGR als Vorbehandlung trat nach 12 h unabhängig des
Lichtregimes die größte Abnahme des Gehaltes an TIA und Canavanin auf,
wohingegen sich der WSC Gehalt gegenläufig verhielt.
4. Die untersuchten Fermentationsparameter im RFT und in ROMOS bestätigten
eine gute Fermentationsqualität von JBN und CWP sowohl alleine als auch im
Gemisch mit SOR, unabhängig der angewendeten PET. Allerdings wird zur
Sicherung einer optimalen Vergärung der Zusatz von LAB empfohlen.
5. Bei CWP Silagen ging eine steigende Lagerungsdauer einher mit einer
Verringerung der TIA, wohingegen der Effekt der Silierung bei JBN Silagen gering
war. Im Gegensatz dazu wurde der Gehalt von HCN in JBN Silagen reduziert,
jedoch in jeder untersuchten Variante der CWP Silagen nach 60 Tagen
Lagerdauer erhöht. Der Canavaningehalt wurde in JBN Silagen mit SOK als
Vorbehandlung verringert, MOR und PRG hatten dagegen nur einen sehr
geringen Einfluss.

Summary
122
6. Es wurde angenommen, dass das Ausmaß der Reduzierung der ANF in JBN
Silagen, die im größeren Maßstab in Plastiktonnen hergestellt wurden, im
Gegensatz zu den Modellsilagen unzureichend war, da die Tiere in den
Fütterungsversuchen zur SID und AD die Aufnahme der Rationen verweigerten,
die JBN enthielten. Die in Plastiktonnen silierten CWP wurden jedoch gut
aufgenommen.
7. Die SID von Aminosäuren in Silagen war im Vergleich zur SID in der
korrespondierenden nicht silierten Mischung nur für Methionin signifikant höher
(P<0.05). Bei den weiterhin untersuchten Aminosäuren und bei Stickstoff wurde in
der Tendenz eine Erhöhung festgestellt, wobei Lysin und Cystin scheinbar
unbeeinflusst waren.
8. Bei der AD von CA, AEE und ADFOM wurden bemerkenswerte Zunahmen in
Silagen im Vergleich zu der korrespondierenden nicht silierten Mischung
festgestellt, wobei die Verdaulichkeiten von OM und CP durch den Silierprozess
offenbar nicht beeinflusst wurden. Widersprüchlich erscheint die Reduzierung der
Verdaulichkeit von NDFOM nach der Silierung. Um einen Erklärungsansatz zu
finden, sollten hierzu weiterführende Untersuchungen durchgeführt werden.
References
123
9 References
ACAMOVIC, T. & DMELLO, J.P.F. 1990. HPLC analysis of canavanine and canaline in Canavalia ensiformis, and in excreta and serum of chicks. Journal of the Science of Food and Agriculture 50(1): 63-77.
ADEBOOYE, O.C. & SINGH, V. 2007. Effect of cooking on the profile of phenolics, tannins, phytate, amino acid, fatty acid and mineral nutrients of whole-grain and decorticated vegetable cowpea (Vigna unguiculata L. Walp). Journal of Food Quality 30(6): 1101-1120.
AGBEDE, J.O. & ALETOR, V.A. 2005. Studies of the chemical composition and protein quality evaluation of differently processed Canavalia ensiformis and Mucuna pruriens seed flours. Journal of Food Composition and Analysis 18(1): 89-103.
AHMED, S.B., MAHGOUB, S.A. & BABIKER, B.E. 1996. Changes in tannin and cyanide contents and diastic activity during germination and the effect of traditional processing on cyanide content of sorghum cultivars. Food Chemistry 56(2): 159-162.
AKINLOSOTU, A. & AKINYELE, I.O. 1991. The effect of germination on the oligosaccharide and nutrient content of cowpeas (Vigna unguiculata). Food Chemistry 39(2): 157-165.
AKINYELE, I.O. & AKINLOSOTU, A. 1991. Effect of soaking, dehulling and fermentation on the oligosaccharides and nutrient content of cowpeas (Vigna unguiculata). Food Chemistry 41(1): 43-53.
AKPAPUNAM, M.A. & SEFADEDEH, S. 1997a. Jack bean (Canavalia ensiformis): Nutrition related aspects and needed nutrition research. Plant Foods for Human Nutrition 50(2): 93-99.
AKPAPUNAM, M.A. & SEFADEDEH, S. 1997b. Some physicochemical properties and antinutritional factors of raw, cooked and germinated Jack bean (Canavalia ensiformis). Food Chemistry 59(1): 121-125.
AL JASSIM, R.A.M. 2006. Supplementary feeding of horses with processed sorghum grains and oats. Animal Feed Science and Technology 125(1-2): 33-44.
ALBRECHT, K.A. & MUCK, R.E. 1991. Proteolysis in ensiled forage legumes that vary in tannin concentration. Crop Science 31(2): 464-469.
ALI, M.A., ABBAS, A., NIAZ, S., ZULKIFFAL, M. & ALI, S. 2009. Morpho-physiological criteria for drought tolerance in sorghum (Sorghum bicolor) at seedling and post-anthesis stages. International Journal of Agriculture and Biology 11(6): 674-680.
ALVAREZ-MANILLA, G., WARREN, N.L., ATWOOD, J., ORLANDO, R., DALTON, S. & PIERCE, M. 2010. Glycoproteomic analysis of embryonic stem cells: Identification of potential glycobiomarkers using lectin affinity chromatography of glycopeptides. Journal of Proteome Research 9(5): 2062-2075.
ALVES, S.P., CABRITA, A.R.J., JERONIMO, E., BESSA, R.J.B. & FONSECA, A.J.M. 2011. Effect of ensiling and silage additives on fatty acid composition of ryegrass and corn experimental silages. Journal of Animal Science 89(8): 2537-2545.
AMBULA, M.K., ODUHO, G.W. & TUITOEK, J.K. 2003. Effects of high-tannin sorghum and bentonite on the performance of laying hens. Tropical Animal Health and Production 35(3): 285-292.
ANDERSON, J.W. 1968. Extraction of enzymes and subcellular organelles from plant tissues. Phytochemistry 7(11): 1973-1988.

References
124
ARENDT, E.K., MORONI, A. & ZANNINI, E. 2011. Medical nutrition therapy: use of sourdough lactic acid bacteria as a cell factory for delivering functional biomolecules and food ingredients in gluten free bread. Microbial Cell Factories 10.
ARIANOUTSOU, M. & THANOS, C.A. 1996. Legumes in the fire-prone Mediterranean regions: An example from Greece. International Journal of Wildland Fire 6(2): 77-82.
ARORA, S.K. 1995. Composition of legumes grains. CAB International. U.K. ASHRAF, G.M., RIZVI, S., NAQVI, S., SUHAIL, N., BILAL, N., HASAN, S., TABISH,
M. & BANU, N. 2010. Purification, characterization, structural analysis and protein chemistry of a buffalo heart galectin-1. Amino Acids 39(5): 1321-1332.
AZEKE, M.A., FRETZDORFF, B., BUENING-PFAUE, H. & BETSCHE, T. 2007. Nutritional value of African yambean (Sphenostylis stenocarpa, L): improvement by solid substrate fermentation using the tempeh fungus Rhizopus oligosporus. Journal of the Science of Food and Agriculture 87(2): 297-304.
AZEKE, M.A., FRETZDORFF, B., BUENING-PFAUE, H., HOLZAPFEL, W. & BETSCHE, T. 2005. Nutritional value of African yambean (Sphenostylis stenocarpa L): Improvement by lactic acid fermentation. Journal of the Science of Food and Agriculture 85(6): 963-970.
BAIK, B.K. & HAN, I.H. 2012. Cooking, roasting, and fermentation of chickpeas, lentils, peas, and soybeans for fortification of leavened bread. Cereal Chemistry 89(6): 269-275.
BAKER, R.L., BROWN, R.L., CHEN, Z.Y., CLEVELAND, T.E. & FAKHOURY, A.M. 2009. A maize lectin-like protein with antifungal activity against Aspergillus flavus. Journal of Food Protection 72(1): 120-127.
BARCELLOS, L.C.G., FURLAN, A.C., MURAKAMI, A.E., DA SILVA, M.A.A. & DA SILVA, R.M. 2006. Nutritional evaluation of high moisture sorghum silage grain with high or low tannin content for broilers. Revista Brasileira De Zootecnia-Brazilian Journal of Animal Science 35(1): 104-112.
BARDANA, E.J., MALINOW, M.R., HOUGHTON, D.C., MCNULTY, W.P., WUEPPER, K.D., PARKER, F. & PIROFSKY, B. 1982. Diet-induced systemic lupus-erythematosus (SLE) in primates. American Journal of Kidney Diseases 1(6): 345-352.
BAU, H.M., VILLAUME, C., NICOLAS, J.P. & MEJEAN, L. 1997. Effect of germination on chemical composition, biochemical constituents and antinutritional factors of soya bean (Glycine max) seeds. Journal of the Science of Food and Agriculture 73(1): 1-9.
BELITZ, H.-D. & WEDER, J.K.P. 1990. Protein inhibitors of hydrolases in plant foodstuffs. Food Reviews International 6(2): 151 - 211.
BELL, D. 1974. Effect of canavanine on herpes-simplex virus replication. Journal of General Virology 22(Mar): 319-330.
BELL, E.A. 1958. Canavanine and related compounds in Leguminosae. Biochemical Journal 70: 617-619.
BELL, E.A. 1960. Canavanine in the Leguminosae. Biochemical Journal 75: 618-620. BELL, E.A. 2003. Nonprotein amino acids of plants: Significance in medicine,
nutrition, and agriculture. Journal of Agricultural and Food Chemistry 51(10): 2854-2865.
BELL, E.A., LACKEY, J.A. & POLHILL, R.M. 1978. Systematic significance of canavanine in Papilionoideae (Faboideae). Biochemical Systematics and Ecology 6(3): 201-212.

References
125
BELMAR, R. & MORRIS, T.R. 1994a. Effects of raw and treated Jack beans (Canavalia ensiformis) and of canavanine on the short-term feed-intake of chicks and pigs. Journal of Agricultural Science 123: 407-414.
BELMAR, R. & MORRIS, T.R. 1994b. Effects of the inclusion of treated Jack beans (Canavalia ensiformis) and the amino acid canavanine in chick diets. Journal of Agricultural Science 123: 393-405.
BELMAR, R., NAVA-MONTERO, R., SANDOVAL-CASTRO, C. & MCNAB, J.M. 1999. Jack bean (Canavalia ensiformis L-DC) in poultry diets: antinutritional factors and detoxification studies - a review. Worlds Poultry Science Journal 55(1): 37-59.
BENCE, A.K. & CROOKS, P.A. 2003. The mechanism of L-canavanine cytotoxicity: Arginyl tRNA synthetase as a novel target for anticancer drug discovery. Journal of Enzyme Inhibition and Medicinal Chemistry 18(5): 383-394.
BENJAKUL, S., VISESSANGUAN, W. & THUMMARATWASIK, P. 2000. Isolation and characterization of trypsin inhibitors from some Thai legume seeds. Journal of Food Biochemistry 24(2): 107-127.
BENZ, J.M., TOKACH, M.D., DRITZ, S.S., NELSSEN, J.L., DEROUCHEY, J.M., SULABO, R.C. & GOODBAND, R.D. 2011. Effects of increasing choice white grease in corn- and sorghum-based diets on growth performance, carcass characteristics, and fat quality characteristics of finishing pigs. Journal of Animal Science 89(3): 773-782.
BETANCUR-ANCONA, D., GALLEGOS-TINTORE, S., DELGADO-HERRERA, A., PEREZ-FLORES, V., RUELAS, A.C. & CHEL-GUERRERO, L. 2008. Some physicochemical and antinutritional properties of raw flours and protein isolates from Mucuna pruriens (Velvet bean) and Canavalia ensiformis (Jack bean). International Journal of Food Science and Technology 43(5): 816-823.
BEZRUKOVA, M.V., LUBYANOVA, A.R. & FATKHUTDINOVA, R.A. 2011. The involvement of wheat and common bean lectins in the control of cell division in the root apical meristems of various plant species. Russian Journal of Plant Physiology 58(1): 174-180.
BIRK, Y. 1985. The Bowman-Birk inhibitor - trypsin-inhibitor and chymotrypsin-inhibitor from soybeans. International Journal of Peptide and Protein Research 25(2): 113-131.
BOLETI, A.P.D., FREIRE, M.D.M., COELHO, M.B., DA SILVA, W., BALDASSO, P.A., GOMES, V.M., MARANGONI, S., NOVELLO, J.C. & MACEDO, M.L.R. 2007. Insecticidal and antifungal activity of a protein from Pouteria torta seeds with lectin-like properties. Journal of Agricultural and Food Chemistry 55(7): 2653-2658.
BORCHERS, R. & ACKERSON, C.W. 1947. Trypsin Inhibitor. 4. Occurrence in seeds of the Leguminosae and other seeds. Archives of Biochemistry 13(2): 291-293.
BORCHERS, R. & ACKERSON, C.W. 1950. The nutritive value of legume seeds. 10. Effect of autoclaving and the trypsin inhibitor test for 17 species. Journal of Nutrition 41(2): 339-345.
BORREANI, G. & TABACCO, E. 2010. The relationship of silage temperature with the microbiological status of the face of corn silage bunkers. Journal of Dairy Science 93(6): 2620-2629.
BORREANI, G., TABACCO, E., CROVETTO, G.M., GALASSI, G., COLOMBO, D. & CAVALLARIN, L. 2006. Effect of chestnut tannin on fermentation quality, proteolysis, and protein rumen degradability of alfalfa silage. Journal of Dairy Science 89(12): 4736-4746.

References
126
BORS, W., FOO, L.Y., HERTKORN, N., MICHEL, C. & STETTMAIER, K. 2001. Chemical studies of proanthocyanidins and hydrolyzable tannins. Antioxidants & Redox Signaling 3(6): 995-1008.
BOUDRA, H. & MORGAVI, D.P. 2008. Reduction in Fusarium toxin levels in corn silage with low dry matter and storage time. Journal of Agricultural and Food Chemistry 56(12): 4523-4528.
BOWMAN, D.E. 1948. Further differentiation of bean trypsin-inhibiting factors. Archives of Biochemistry 16(1): 109-113.
BRADBURY, J.H., EGAN, S.V. & LYNCH, M.J. 1991. Analysis of cyanide in cassava using acid-hydrolysis of cyanogenic glucosides. Journal of the Science of Food and Agriculture 55(2): 277-290.
BRANDON, M.J., FOO, L.Y., PORTER, L.J. & MEREDITH, P. 1982. Proanthocyanidins of barley and sorghum - Composition as a function of maturity of barley ears. Phytochemistry 21(12): 2953-2957.
BRESSANI, R. 1985. Nutritive value of cowpeas. John Wiley and Sons, Chichester, New York, USA
BRESSANI, R., BRENES, R.G., GARCIA, A. & ELIAS, L.G. 1987. Chemical composition, amino acid content and protein-quality of Canavalia spp. seeds. Journal of the Science of Food and Agriculture 40(1): 17-23.
BREWBAKER, J.L., NAGAI, C. & LIU, E.H. 1985. Genetic polymorphisms of 13 maize peroxidases. Journal of Heredity 76(3): 159-167.
BREWIN, N.J. & KARDAILSKY, I.V. 1997. Legume lectins and nodulation by Rhizobium. Trends in Plant Science 2(3): 92-98.
BRUCE, K.J., KARR-LILIENTHAL, L.K., ZINN, K.E., POPE, L.L., MAHAN, D.C., FASTINGER, N.D., WATTS, M., UTTERBACK, P.L., PARSONS, C.M., CASTANEDA, E.O., ELLIS, M. & FAHEY, G.C. 2006. Evaluation of the inclusion of soybean oil and soybean processing by-products to soybean meal on nutrient composition and digestibility in swine and poultry. Journal of Animal Science 84(6): 1403-1414.
BUCHANAN-SMITH, J., MORRIS, J.R. & SMITH, T.K. 2003. High moisture grain and grain by-products. Silage science and technology. D. R. Buxton, R. E. Muck & J. H. Harrison. Madison, Wisconsin, USA, American Society of Agronomy. 42: 825-854.
BUNTHA, P., BORIN, K., PRESTON, T.R. & OGLE, B. 2008. Survey of taro varieties and their use in selected areas of Cambodia. Livestock Research for Rural Development. 20.September 5, 2011, http://www.lrrd.org/lrrd20/supplement/bunt1.htm
BUXTON, D.R., MUCK, R.E. & HARRISON, J.H., Eds. 2003. Silage science and technology. Agronomy.42. American Society of Agronomy, Madison, Wisconsin, USA.
CÁCERES, O., GONZÁLEZ, E. & DELGADO, R. 1995. Canavalia ensiformis: Leguminosa forrajera promisoria para la agricultura tropical Pastos y Forrajes 18(2): 107-119.
CACHO, J., GARCIA, M.A. & FERRANDO, I. 1989. Selective spectrophotometric determination of canavanine. Analyst 114(8): 965-968.
CAI, T., CAI, W.T., ZHANG, J., ZHENG, H.M., TSOU, A.M., XIAO, L., ZHONG, Z.T. & ZHU, J. 2009. Host legume-exuded antimetabolites optimize the symbiotic rhizosphere. Molecular Microbiology 73(3): 507-517.

References
127
CAMARGOS, L.S., AGUIAR, L.F. & AZEVEDO, R.A. 2004. Variation in the amino acid concentration during development of Canavalia ensiformis. Biologia Plantarum 48(2): 309-312.
CARLINI, C.R., BARCELLOS, G.B.S., BAETANEVES, A.D.V. & GUIMARAES, J.A. 1988. Immunoreactivity for canatoxin and concanavalin-A among proteins of leguminous seeds. Phytochemistry 27(1): 25-30.
CARLINI, C.R. & UDEDIBIE, A.B. 1997. Comparative effects of processing methods on hemagglutinating and antitryptic activities of Canavalia ensiformis and Canavalia braziliensis seeds. Journal of Agricultural and Food Chemistry 45(11): 4372-4377.
CASTRO, A. 1999. Untersuchungen zum Futterwert von verschiedenen Sorghumsorten für den Einsatz bei Broilern. PhD, University of Rostock, Germany
CASTRO, A., MARRERO, L.I., VALDIVIE, M., GABEL, M. & STEINGASS, H. 2002a. Anti-nutritional factor contents of four sorghum grain varieties cultivated in Cuba. Cuban Journal of Agricultural Science 36(1): 29-33.
CASTRO, M., DIAZ, J., CASTANEDA, J., BAEZ, L., DIAZ, M.F., LY, J., DIAZ, C., CABRERA, J. & CINO, D.M. 2002b. A national alternative as protein source for growing pigs: Vigna unguiculata ev INIFAT-93. Cuban Journal of Agricultural Science 36(4): 337-340.
CHAMP, M.M.J. 2002. Non-nutrient bioactive substances of pulses. British Journal of Nutrition 88: S307-S319.
CHILOMER, K., KASPROWICZ-POTOCKA, M., GULEWICZ, P. & FRANKIEWICZ, A. 2013. The influence of lupin seed germination on the chemical composition and standardized ileal digestibility of protein and amino acids in pigs. Journal of Animal Physiology and Animal Nutrition 97(4): 639-646.
CHIOU, P.W.S., CHANG, S.H., CHIANG, J.K., YU, B. & CHEN, C.R. 1999. Studies on the use of wet sorghum distiller's grains in lactating cows. Asian-Australasian Journal of Animal Sciences 12(6): 895-900.
CHRISPEELS, M.J. & BAUMGARTNER, B. 1978. Trypsin inhibitor in mug bean cotyledons, purification, characteristics, subcellular localization and metabolism Plant Physiology 61: 617-623.
CHUNG, T.K. & BAKER, D.H. 1992. Apparent and true amino acid digestibility of a crystalline amino acid mixture and of casein - Comparison of values obtained with ileal-cannulated pigs and cecectomized cockerels. Journal of Animal Science 70(12): 3781-3790.
CLIFFORD, M.N. & SCALBERT, A. 2000. Ellagitannins - nature, occurrence and dietary burden. Journal of the Science of Food and Agriculture 80(7): 1118-1125.
CONWAY, E.J. & BYRNE, A. 1933. An absorption apparatus for the micro-determination of certain volatile substances. I. The micro-determination of ammonia. Biochemical Journal 27: 419-429.
COOK, B.G., PENGELLY, B.C., BROWN, S.D., DONNELLY, J.L., EAGLES, D.A., FRANCO, M.A., HANSON, J., MULLEN, B.F., PARTRIDGE, I.J., PETERS, M. & SCHULTZE-KRAFT, R. 2005. Tropical Forages: an interactive selection tool [CD-ROM] CSIRO, DPI&F(Qld), CIAT and ILRI, Brisbane, Australia. http://www.tropicalforages.info.
CRITTENDEN, R., KARPPINEN, S., OJANEN, S., TENKANEN, M., FAGERSTROM, R., MATTO, J., SAARELA, M., MATTILA-SANDHOLM, T. & POUTANEN, K. 2002. In vitro fermentation of cereal dietary fibre carbohydrates by probiotic and intestinal bacteria. Journal of the Science of Food and Agriculture 82(8): 781-789.

References
128
DALKIN, K. & BOWLES, D.J. 1983. Analysis of interrelationship of Jack bean seed components by two-dimensional mapping of Iodinated tryptic peptides. Planta 157(6): 536-539.
DARRASSE, A., DARSONVAL, A., BOUREAU, T., BRISSET, M.N., DURAND, K. & JACQUES, M.A. 2010. Transmission of plant-pathogenic bacteria by nonhost seeds without induction of an associated defense reaction at emergence. Applied and Environmental Microbiology 76(20): 6787-6796.
DESHPANDE, S.S. & DAMODARAN, S. 1990. Food legumes: Chemistry and technology. American Association of Cereal Chemists. St. Paul, Minnesota, USA.
DESHPANDE, S.S. & SALUNKHE, D.K. 1982. Interactions of tannic acid and catechin with legume starches. Journal of Food Science 47(6): 2080-2081.
DESHPANDE, S.S. & SALUNKHE, D.K. 2000. Grain legumes, seeds and nuts: Rationale for fermentation. FAO Agricultural Services Bulletin, Rome, Italy.
DIAZ, C.P. & ELIAS, A. 1976. Cattle manure and final molasses silage in pig feeding.1. Effect of different levels in final molasses diets for growing pigs. Cuban Journal of Agricultural Science 10(2): 191-197.
DIAZ, C.P., LEZCANO, P. & ELIAS, A. 1979. Cattle manure and final molasses silage in pig feeding. 2. Substitution of a maize-based diet by manure silage for growing pigs. Cuban Journal of Agricultural Science 13(1): 33-38.
DIAZ, C.P., ROMAN, B. & CASTELLON, A. 1996. A note on the reduction of traditional feeds used in the feeding of lactating sows. Cuban Journal of Agricultural Science 30(1): 53-55.
DIAZ, M.F., MARTIN-CABREJAS, M.A., GONZALEZ, A., TORRES, V. & NODA, A. 2007. Biotransformation of Vigna unguiculata during the germination process. Cuban Journal of Agricultural Science 41(2): 161-165.
DIAZ, M.F., PADILLA, C., GONZALEZ, A. & MORA, C. 2000. A comparative study of the production of meals from Vigna unguiculata varieties for animal feeding. Cuban Journal of Agricultural Science 34(4): 353-361.
DIAZ, M.F., PADILLA, C., TORRES, V., GONZALEZ, A. & NODA, A. 2003. Bromatological characterization of seasonal legume species and varieties with possibilities of use in animal feeding. Cuban Journal of Agricultural Science 37(4): 443-447.
DING, H., FU, T.-J. & SMITH, M.A. 2013. Microbial contamination in sprouts: How effective is seed disinfection treatment? Journal of Food Science 78(4): R495-R501.
DMELLO, J.P.F., WALKER, A.G. & ACAMOVIC, T. 1988. Concentrations of total amino acids including canavanine during germination of Canavalia ensiformis (L) DC. Tropical Agriculture 65(4): 376-377.
DÖLL, S. & DÄNICKE, S. 2011. The Fusarium toxins deoxynivalenol (DON) and zearalenone (ZON) in animal feeding. Preventive Veterinary Medicine 102(2): 132-145.
DOMINGUEZ, A.D.M., CUEVAS, A.C., MARTINEZ, B.F., COELLO, C.L. & GONZALEZ, E.A. 2009. Effect of supplementing a enzyme mixture in sorghum plus soybean meal diets on apparent ileal amino acid and protein digestibility, metabolizable energy, and productivity in broilers. Tecnica Pecuaria En Mexico 47(1): 15-25.
DOMINGUEZ, P.L. 1995. Citrus waste in swine feedstuffs. 2(2).5 sep 2011, http://www.sian.info.ve/porcinos/publicaciones/rccpn/rcpp.htm#1306

References
129
EFSA. 2004. Opinion of the Scientific Panel on Contaminants in the Food Chain on a request from the Commission related to Deoxynivalenol (DON) as undesirable substance in animal feed European Food Safety Authority Journal 73: 1-42.
EFSA. 2013. Deoxynivalenol in food and feed: occurrence and exposure. European Food Safety Authority Journal 11(10): 1-56.
EGEKEZE, J.O. & OEHME, F.W. 1979. Blood and liver cyanide concentrations in rats poisoned with oral doses of potassium cyanide. Toxicology Letters 3(4): 243-247.
EGOUNLETY, M. & AWORH, O.C. 2003. Effect of soaking, dehulling, cooking and fermentation with Rhizopus oligosporus on the oligosaccharides, trypsin inhibitor, phytic acid and tannins of soybean (Glycine max Merr.), cowpea (Vigna unguiculata L. Walp) and groundbean (Macrotyloma geocarpa Harms). Journal of Food Engineering 56(2-3): 249-254.
EHLERS, J.D. & HALL, A.E. 1997. Cowpea (Vigna unguiculata L Walp). Field Crops Research 53(1-3): 187-204.
EJETA, G. & KNOLL, J.E. 2007. Marker-assisted selection in sorghum. R. K. Varshney & R. Tuberosa, Ed.^Eds. Springer, Dordrecht, The Netherlands
EKANAYAKE, S., SKOG, K. & ASP, N.G. 2007. Canavanine content in sword beans (Canavalia gladiata): Analysis and effect of processing. Food and Chemical Toxicology 45(5): 797-803.
EKHOLM, P., VIRKKI, L., YLINEN, M., JOHANSSON, L. & VARO, P. 2000. Effects of natural chelating agents on the solubility of some physiologically important mineral elements in oat bran and oat flakes. Cereal Chemistry 77(5): 562-566.
EL-ADAWY, T.A., RAHMA, E.H., EL-BEDAWY, A.A. & SOBIHAH, T.Y. 2000. Effect of soaking process on nutritional quality and protein solubility of some legume seeds. Nahrung-Food 44(5): 339-343.
ELMAKI, H.B., BABIKER, E.E. & EL TINAY, A.H. 1999. Changes in chemical composition, grain malting, starch and tannin contents and protein digestibility during germination of sorghum cultivars. Food Chemistry 64(3): 331-336.
ENNEKING, D., GILES, L.C., TATE, M.E. & DAVIES, R.L. 1993. L-Canavanine: A natural feed-intake inhibitor for pigs (isolation, identification and significance). Journal of the Science of Food and Agriculture 61(3): 315-325.
ERIKSSON, T. & ERICSON, B. 2012. Dry matter determination in silage samples with freeze-drying or oven drying with or without correction for volatile losses. XVI International Silage Conference, Hämeenlinna, Finland, 272-273.
ERLWANGER, K.H., UNMACK, M.A., GRONDAHL, M.L., PIERZYNOWSKI, S.G., AALBAEK, B., DANTZER, V. & SKADHAUGE, E. 1999. Effects of dietary substitution with raw and heat-treated cowpea (Vigna unguiculata) on the intestinal transport and pancreatic enzymes in the pig Journal of Veterinary Medicine Series A 46(10): 581-592.
EYARU, R., SHRESTHA, A.K. & ARCOT, J. 2009. Effect of various processing techniques on digestibility of starch in Red kidney bean (Phaseolus vulgaris) and two varieties of peas (Pisum sativum). Food Research International 42(8): 956-962.
FALCK, P., PRECHA-ATSAWANAN, S., GREY, C., IMMERZEEL, P., STALBRAND, H., ADLERCREUTZ, P. & KARLSSON, E.N. 2013. Xylooligosaccharides from hardwood and cereal xylans produced by a thermostable xylanase as carbon sources for Lactobacillus brevis and Bifidobacterium adolescentis. Journal of Agricultural and Food Chemistry 61(30): 7333-7340.
References
130
FAN, M.Z., SAUER, W.C., HARDIN, R.T. & LIEN, K.A. 1994. Determination of Apparent Ileal Amino-Acid Digestibility in Pigs - Effect of Dietary Amino-Acid Level. Journal of animal science 72(11): 2851-2859.
FAO 2010a. FAOSTAT-Agriculture (Crops Production) Food and Agriculture Organization of the United Nations (FAO).
FAO. 2010b. The state of food insecurity in the world FAO, Ed.^Eds. Office of Knowledge Exchange, Research and Extension, Viale delle Terme di Caracalla, 00153 Rome, Italy
FAO. 2010c. Statistical Yearbook 2010.5 May 2011, http://www.fao.org/economic/ess/ess-publications/ess-yearbook/ess-yearbook2010/yearbook2010-production/en/
FAO. 2011. Food price index. World Food Situation 5 May 2011, http://www.fao.org/worldfoodsituation/wfs-home/foodpricesindex/en/
FERNANDES, A.C., NISHIDA, W. & PROENCA, R.P.D. 2010. Influence of soaking on the nutritional quality of common beans (Phaseolus vulgaris L.) cooked with or without the soaking water: a review. International Journal of Food Science and Technology 45(11): 2209-2218.
FERNANDEZ-OROZCO, R., FRIAS, J., MUNOZ, R., ZIELINSKI, H., PISKULA, M.K., KOZLOWSKA, H. & VIDAL-VALVERDE, C. 2007. Fermentation as a bio-process to obtain functional soybean flours. Journal of Agricultural and Food Chemistry 55(22): 8972-8979.
FIGUEROA, V. 2003. El papel del consumo y el balance de nutrientes en los sistemas no convencionales de alimentación porcina CIPAV Foundation, Cali, Valle del Cauca, Colombia
FILHO, J.X. 1974. Trypsin-inhibitors in sorghum grain. Journal of Food Science 39(2): 422-423.
FITCHES, E., WILES, D., DOUGLAS, A.E., HINCHLIFFE, G., AUDSLEY, N. & GATEHOUSE, J.A. 2008. The insecticidal activity of recombinant garlic lectins towards aphids. Insect Biochemistry and Molecular Biology 38(10): 905-915.
FROTA, K.D.G., SOARES, R.A.M. & AREAS, J.A.G. 2008. Chemical composition of cowpea (Vigna unguiculata L. Walp), BRS-Milenio cultivar. Ciencia E Tecnologia De Alimentos 28(2): 470-476.
FURUYA, S. & KAJI, Y. 1989. Estimation of the true ileal digestibility of amino acids and nitrogen from their apparent values for growing pigs. Animal Feed Science and Technology 26(3-4): 271-285.
GALLUP, J.L. & SACHS, J.D. 2000. Agriculture, climate, and technology: Why are the tropics falling behind? American Journal of Agricultural Economics 82(3): 731-737.
GALVIN, J.F.P. & JONES, C.D. 2009. The weather and climate of the tropics: Part 10-Tropical agriculture. Weather 64(6): 156-161.
GATEHOUSE, A.M.R., GATEHOUSE, J.A. & BOULTER, D. 1980. Isolation and characterization of trypsin-inhibitors from cowpea (Vigna unguiculata). Phytochemistry 19(5): 751-756.
GEFROM, A., OTT, E.M., HOEDTKE, S. & ZEYNER, A. 2013. Effect of ensiling moist field bean (Vicia faba), pea (Pisum sativum) and lupine (Lupinus spp.) grains on the contents of alkaloids, oligosaccharides and tannins. Journal of Animal Physiology and Animal Nutrition 97(6): 1152-1160.
GENNIS, L.S. & CANTOR, C.R. 1976. Double-headed protease inhibitors from black-eyed peas. 1. Purification of 2 new protease inhibitors and endogenous protease by affinity chromatography. Journal of Biological Chemistry 251(3): 734-740.

References
131
GFE. 1987. Energie- und Nährstoffbedarf landwirtschaftlicher Nutztiere Communications of the Committee for Requirement Standards of the Society of Nutrition Physiology.
GFE. 2002. Bestimmung der praecaecalen Verdaulichkeit von Aminosäuren beim Schwein - Empfehlungen zur standardisierten Versuchsdurchführung. Proceedings of the Society of Nutrition Physiology 11: 233-245.
GFE. 2005a. Determination of digestibility as the basis for energy evaluation of feedstuffs for pigs Proceedings of the Society of Nutrition Physiology 14: 207-213.
GFE. 2005b. Standardised precaecal digestibility of amino acids in feedstuffs for pigs- methods and concepts. Proceedings of the Society of Nutrition Physiology 14: 185-205.
GFE. 2008. Prediction of metabolisable energy of compound feeds for pigs. Proceedings of the Society of Nutrition Physiology 17: 199-204.
GHAVIDEL, R.A. & PRAKASH, J. 2007. The impact of germination and dehulling on nutrients, antinutrients, in vitro iron and calcium bioavailability and in vitro starch and protein digestibility of some legume seeds. Lwt-Food Science and Technology 40(7): 1292-1299.
GILANI, G.S., XIAO, C.W. & COCKELL, K.A. 2012. Impact of antinutritional factors in food proteins on the digestibility of protein and the bioavailability of amino acids and on protein quality. British Journal of Nutrition 108: S315-S332.
GOBESSO, A.A.O., D'AURIA, E., PREZOTTO, L.D. & RENNO, F.P. 2008. Replacement of corn by ground or extruded sorghum in diets for horses. Revista Brasileira De Zootecnia-Brazilian Journal of Animal Science 37(11): 2011-2016.
GOERING, H.K. & VAN SOEST, P.J. 1970. Forage fiber analysis (apparatus, reagents, procedures, and some applications). Agricultural Research Service, United States Department of Agriculture in Washington, D.C., USA.
GOLLCHER, A.M.R., LIMA, J.A.D., FIALHO, E.T., RODRIGUES, P.B. & DE LIMA, R.R. 2010. Nutritional value of high and low tannin high-moisture sorghum grain silage in horses. Revista Brasileira De Zootecnia-Brazilian Journal of Animal Science 39(6): 1246-1251.
GONDOIN, A., GRUSSU, D., STEWART, D. & MCDOUGALL, G.J. 2010. White and green tea polyphenols inhibit pancreatic lipase in vitro. Food Research International 43(5): 1537-1544.
GONZALEZ, C., DIAZ, I., LEON, M., LY, J., VECCHIONACCE, H. & BIANCO, A. 2003. Performance and carcass traits in pigs fed sweet potato (Ipomoea batatas L.) root meal. Cuban Journal of Agricultural Science 37(4): 415-419.
GOODRICH, R.D., BYERS, F.M. & MEISKE, J.C. 1975. Influence of Moisture-Content, Processing and Reconstitution on Fermentation of Corn Grain. Journal of animal science 41(3): 876-881.
GOWDA, N.M., GOSWAMI, U. & KHAN, M.I. 2008. Purification and characterization of a T-antigen specific lectin from the coelomic fluid of a marine invertebrate, sea cucumber (Holothuria scabra). Fish & Shellfish Immunology 24(4): 450-458.
GRAHAM, P.H. & VANCE, C.P. 2003. Legumes: Importance and constraints to greater use. Plant Physiology 131(3): 872-877.
GRANITO, M. & ALVAREZ, G. 2006. Lactic acid fermentation of black beans (Phaseolus vulgaris): microbiological and chemical characterization. Journal of the Science of Food and Agriculture 86(8): 1164-1171.
References
132
GRANITO, M., FRIAS, J., DOBLADO, R., GUERRA, M., CHAMP, M. & VIDAL-VALVERDE, C. 2002. Nutritional improvement of beans (Phaseolus vulgaris) by natural fermentation. European Food Research and Technology 214(3): 226-231.
GRANT, G., DORWARD, P.M., BUCHAN, W.C., ARMOUR, J.C. & PUSZTAI, A. 1995. Consumption of diets containing raw soya beans (Glycine max), kidney beans (Phaseolus vulgaris), cowpeas (Vigna unguiculata) or lupin seeds (Lupinus angustifolius) by rats for up to 700 days: Effects on body composition and organ weights. British Journal of Nutrition 73(1): 17-29.
GREEN, M.J.B., MURRAY, M.G., BUNTING, G.C. & PAINE, J.R. 1996. Priorities for biodiversity conservation in the tropics. WCMC Biodiversity Bulletin No. 1. UN Environment Programme.2 May 2011, http://www.unep-wcmc.org/priorities-for-biodiversity-conservation-in-the-tropics_222.html
GUILLAMON, E., PEDROSA, M.M., BURBANO, C., CUADRADO, C., SANCHEZ, M.D.C. & MUZQUIZ, M. 2008. The trypsin inhibitors present in seed of different grain legume species and cultivar. Food Chemistry 107(1): 68-74.
GULATI, A.K., ZALEWSKI, A.A., SHARMA, K.B., OGROWSKY, D. & SOHAL, G.S. 1986. A comparison of lectin binding in rat and human peripheral nerve. Journal of Histochemistry & Cytochemistry 34(11): 1487-1493.
GUO, X.S., DING, W.R., HAN, J.G. & ZHOU, H. 2008. Characterization of protein fractions and amino acids in ensiled alfalfa treated with different chemical additives. Animal Feed Science and Technology 142(1–2): 89-98.
GUPTA, J.J., BARDOLOI, R.K., REDDY, P.B. & DAS, A. 2009. Performance of crossbred pigs fed on raw and boiled sweet potato tuber at various levels at different stages of growth. Indian Journal of Animal Sciences 79(7): 696-699.
HACKL, W., PIEPER, B., PIEPER, R., KORN, U. & ZEYNER, A. 2010. Effects of ensiling cereal grains (barley, wheat, triticale and rye) on total and pre-caecal digestibility of proximate nutrients and amino acids in pigs. Journal of Animal Physiology and Animal Nutrition 94(6): 729-735.
HAGERMAN, A.E. & BUTLER, L.G. 1981. The specificity of proanthocyanidin-protein interactions. Journal of Biological Chemistry 256(9): 4494-4497.
HAGERMAN, A.E. & BUTLER, L.G. 1989. Choosing appropriate methods and standards for assaying tannin. Journal of Chemical Ecology 15(6): 1795-1810.
HAGUE, D.R. 1975. Studies of storage proteins of higher plants.1. Concanavalin a from 3 species of genus Canavalia. Plant Physiology 55(4): 636-642.
HAN, J.G., LIU, M.X., WANG, Y.W. & MAO, P.S. 2009. The content and distribution of condensed tannins in different species of the genus sorghum (Sorghum bicolor L. Moench) and their effect on seed protein electrophoresis. Journal of the Science of Food and Agriculture 89(9): 1446-1452.
HE, Q., LV, Y. & YAO, K. 2007. Effects of tea polyphenols on the activities of alpha-amylase, pepsin, trypsin and lipase. Food Chemistry 101(3): 1178-1182.
HENNIG, U., NOEL, R., HERRMANN, U., WUNSCHE, J. & MEHNERT, E. 1986. Nutrition physiological studies in pigs with ileorectal anastomoses.1. Operation methods, biochemical and morphological findings. Archiv Fur Tierernahrung-Archives of Animal Nutrition 36(7): 585-596.
HERZBERG, G.R., SHEERIN, H. & LERNER, J. 1971. Cationic amino acid transport in chicken small intestine. Comparative Biochemistry and Physiology 40(1A): 229-247.
HERZIG, K.H., BARDOCZ, S., GRANT, G., NUSTEDE, R., FOLSCH, U.R. & PUSZTAI, A. 1997. Red kidney bean lectin is a potent cholecystokinin releasing stimulus in the rat inducing pancreatic growth. Gut 41(3): 333-338.

References
133
HIDALGO, K., LEZCANO, P., VALDIVIE, M. & RODRIGUEZ, Y. 2006. Productive performance of fattening pigs fed high-test molasses. Cuban Journal of Agricultural Science 40(4): 431-435.
HILL, G.D. 1998. Grains legumes and oilseeds-the way ahead. 3rd International Antinutritional factors Workshop Recent Advances of Research in Antinutritional Factors in Legume Seeds and Rapeseed, Wageningen, The Netherlands, 353-364.
HOEDTKE, S. & ZEYNER, A. 2011. Comparative evaluation of laboratory-scale silages using standard glass jar silages or vacuum-packed model silages. Journal of Science of Food and Agriculture 91(5): 841–849.
HONIG, H. 1990. Evaluation of aerobic stability. Proceedings of the EUROBAC Conference, Uppsala, Sweden, 76-82.
HONIG, H. & PAHLOW, G. 1986. Wirkungsweise und Einsatzgrenzen von Silage-Impfkulturen aus Milchsäurebakterien. 2. Mitteilung: Wirkung von Anwelkgrad Felddauer und Zuckerzusatz auf das Konservierungsergebnis bei Gras. Das wirtschaftseigene Futter 32: 205-228.
HOUSSOU, P.A., AHOHUENDO, B.C., FANDOHAN, P., KPODO, K., HOUNHOUIGAN, D.J. & JAKOBSEN, M. 2009. Natural infection of cowpea (Vigna unguiculata (L.) Walp.) by toxigenic fungi and mycotoxin contamination in Benin, West Africa. Journal of Stored Products Research 45(1): 40-44.
HUCK, G.L., KREIKEMEIER, K.K. & BOLSEN, K.K. 1999. Effect of reconstituting field-dried and early-harvested sorghum grain on the ensiling characteristics of the grain and on growth performance and carcass merit of feedlot heifers. Journal of Animal Science 77: 1074-1081.
HUHTANEN, P., JAAKKOLA, S. & NOUSIAINEN, J. 2012. An overview of silage research in Finland: from ensiling innovation to advances in dairy cow feeding. XVI International Silage Conference, Hämeenlinna, Finland, 16-33.
HUISDEN, C.M., ADESOGAN, A.T., KIM, S.C. & OSOSANYA, T. 2009. Effect of applying molasses or inoculants containing homofermentative or heterofermentative bacteria at two rates on the fermentation and aerobic stability of corn silage. Journal of Dairy Science 92(2): 690-697.
HWANG, I.D., KIM, S.G. & KWON, Y.M. 1996. Canavanine metabolism in tissue cultures of Canavalia lineata. Plant Cell Tissue and Organ Culture 45(1): 17-23.
HYMES-FECHT, U.C., BRODERICK, G.A. & MUCK, R.E. 2012. Effects of feeding red clover versus lucerne silage to lactating dairy cattle. XVI International Silage Conference, Hämeenlinna, Finland, 482-483.
HYMOWITZ, T. & SINGH, R.J. 1987. Taxonomy and Speciation. ASA, Madison, Wisconsin, USA.
IBRAHIM, S.S., HABIBA, R.A., SHATTA, A.A. & EMBABY, H.E. 2002. Effect of soaking, germination, cooking and fermentation on antinutritional factors in cowpeas. Nahrung-Food 46(2): 92-95.
ICRISAT. 2004. Sorghum, a crop of substance. Ed.^Eds. International Crops Research Institute for the Semi-Arid Tropics, Patancheru, Andhra Pradesh, India
IMAMICHI, Y. & YOKOYAMA, Y. 2010. Purification, characterization and cDNA cloning of a novel lectin from the jellyfish Nemopilema nomurai. Comparative Biochemistry and Physiology B-Biochemistry & Molecular Biology 156(1): 12-18.
INOUE, H., TOHNO, M., KOBAYASHI, H., MATSUO, M., KOJIMA, Y., IBUKI, T. & UEGAKI, R. 2013. Effects of moisture control, addition of glucose, inoculation of lactic acid bacteria and crushing process on the fermentation quality of rice grain silage. Grassland Science 59(2): 63-72.
References
134
JABER, K., CUARTERO DIAZ, G., HAUBRUGE, E. & FRANCIS, F. 2008. Investigation of carbohydrate binding property of a fungal lectin from Xerocomus chrysenteron and potential use on Myzus persicae aphid. Communications in agricultural and applied biological sciences 73(3): 629-638.
JACOB, J.P., MITARU, B.N., MBUGUA, P.N. & BLAIR, R. 1996. The feeding value of Kenyan sorghum, sunflower seed cake and sesame seed cake for broilers and layers. Animal Feed Science and Technology 61(1-4): 41-56.
JAFFE, W.G. 1950. Protein digestibility and trypsin inhibitor activity of legume seeds. Proceedings of the Society for Experimental Biology and Medicine 75(1): 219-220.
JAMROZ, D. & KUBIZNA, J. 2008. Harmful substances in legume seeds - their negative and beneficial properties. Polish Journal of Veterinary Sciences 11(4): 389-404.
JANSMAN, A.J.M. 1993. Tannins in feedstuffs for simple-stomached animals. Nutrition Research Reviews 6(1): 209-236.
JAURENA, G. & PICHARD, G. 2001. Contribution of storage and structural polysaccharides to the fermentation process and nutritive value of lucerne ensiled alone or mixed with cereal grains. Animal Feed Science and Technology 92(3-4): 159-173.
JEZIERNY, D., MOSENTHIN, R. & BAUER, E. 2010. The use of grain legumes as a protein source in pig nutrition: A review. Animal Feed Science and Technology 157(3-4): 111-128.
JEZIERNY, D., MOSENTHIN, R., SAUER, N., ROTH, S., PIEPHO, H.P., RADEMACHER, M. & EKLUND, M. 2011. Chemical composition and standardised ileal digestibilities of crude protein and amino acids in grain legumes for growing pigs. Livestock Science 138(1-3): 229-243.
JONES, D.I.H. 1988. The effect of cereal incorporation on the fermentation of spring-cut and autumn-cut silages in laboratory silos. Grass and Forage Science 43(2): 167-172.
KAKADE, M.L., ARNOLD, R.L., LIENER, I.E. & WAIBEL, P.E. 1969. Unavailability of cystine from trypsin inhibitors as a factor contributing to poor nutritive value of navy beans. Journal of Nutrition 99(1p1): 34-42.
KAKADE, M.L., RACKIS, J.J., MCGHEE, J.E. & PUSKI, G. 1974. Determination of trypsin inhibitor activity of soy products: Collaborative analysis of an improved procedure. Cereal Chemistry 51(3): 376-382.
KAMPHUES, J., CAPPAI, M.G., WOLF, P., LIESNER, V.G., KASTNER, A., NIEDDU, G. & PINNA, W. 2010. Effect of whole acorns (Quercus pubescens) shred based diet on parotid gland in growing pigs in relation to tannins. Livestock Science 134(1-3): 183-186.
KAPLAN, L. & LYNCH, T.F. 1999. Phaseolus (Fabaceae) in archaeology: AMS radiocarbon dates and their significance for pre-Colombian agriculture. Economic Botany 53(3): 261-272.
KAUSHIK, G., NAIK, S.N. & SATYA, S. 2010. Effect of domestic processing techniques on the mineral content in soybean. Asian Journal of Chemistry 22(7): 5159-5164.
KELSALL, A., FITZGERALD, A.J., HOWARD, C.V., EVANS, R.C., SINGH, R., RHODES, J.M. & GOODLAD, R.A. 2002. Dietary lectins can stimulate pancreatic growth in the rat. International Journal of Experimental Pathology 83(4): 203-208.

References
135
KENNEDY, J.A. & POWELL, H.K.J. 1985. Polyphenol interactions with aluminum(III) and iron(III): Their possible involvement in the podzolization process. Australian Journal of Chemistry 38(6): 879-888.
KESSLER, C.D.J. 1990. An agronomic evaluation of Jack bean (Canavalia ensiformis) in Yucatan, Mexico. III. Germplasm. Experimental Agriculture 26(01): 31-40.
KEYAERTS, E., VIJGEN, L., PANNECOUQUE, C., VAN DAMME, E., PEUMANS, W., EGBERINK, H., BALZARINI, J. & VAN RANST, M. 2007. Plant lectins are potent inhibitors of coronaviruses by interfering with two targets in the viral replication cycle. Antiviral Research 75(3): 179-187.
KHALIL, A.A. 2006. Nutritional improvement of an Egyptian breed of mung bean by probiotic lactobacilli. African Journal of Biotechnology 5(2): 206-212.
KHATTAB, R.Y. & ARNTFIELD, S.D. 2009. Nutritional quality of legume seeds as affected by some physical treatments. 2. Antinutritional factors. LWT - Food Science and Technology 42(6): 1113-1118.
KHOKHAR, S. & CHAUHAN, B.M. 1986. Effect of domestic processing and cooking on in vitro protein digestibility of moth bean. Journal of Food Science 51(4): 1083-1084.
KIPTON, H., POWELL, J. & RATE, A.W. 1987. Aluminum tannin equilibria: A potentiometric study. Australian Journal of Chemistry 40(12): 2015-2022.
KITAGAWA, M. & TOMIYAMA, T. 1929. A new amino-compound in the Jack bean and a corresponding new ferment. Journal of Biochemistry 11(2): 265-271.
KORDAS, K., SZALMAY, G., BARDOCZ, S., PUSZTAI, A. & VARGA, G. 2001. Phytohaemagglutinin inhibits gastric acid but not pepsin secretion in conscious rats. Journal of Physiology-Paris 95(1-6): 309-314.
KOSTINEK, M., SPECHT, I., EDWARD, V.A., SCHILLINGER, U., HERTEL, C., HOLZAPFEL, W.H. & FRANZ, C.M.A.P. 2005. Diversity and technological properties of predominant lactic acid bacteria from fermented cassava used for the preparation of Gari, a traditional African food. Systematic and Applied Microbiology 28(6): 527-540.
KRISTENSEN, N.B., SLOTH, K.H., HOJBERG, O., SPLIID, N.H., JENSEN, C. & THOGERSEN, R. 2010. Effects of microbial inoculants on corn silage fermentation, microbial contents, aerobic stability, and milk production under field conditions. Journal of Dairy Science 93(8): 3764-3774.
KUNITZ, M. 1945. Crystallization of a trypsin inhibitor from soybean. Science 101(2635): 668-669.
KUNITZ, M. 1946. Crystalline soybean trypsin inhibitor. Journal of General Physiology 29(3): 149-154.
KUNZELMANN, K., SUN, J., SCHREIBER, R. & KONIG, J. 2004. Effects of dietary lectins on ion transport in epithelia. British Journal of Pharmacology 142(8): 1219-1226.
LALLO, C.H.O., SINGH, R., DONAWA, A.A. & MADOO, G. 1997. The ensiling of poultry offal with sugarcane molasses and Lactobacillus culture for feeding to growing/finishing pigs under tropical conditions. Animal Feed Science and Technology 67(2-3): 213-222.
LAMBERT, N. & FENWICK, R. 1991. Norleg. Nutrition & Food Science 91(1): 14-15. LAPLACE, J.P., SOUFFRANT, W.B., HENNIG, U., CHABEAUTI, E. & FEVRIER, C.
1994. Measurement of prececal dietary protein and plant cell wall digestion in pigs: Comparison of 4 surgical procedures for ileorectal anastomosis. Livestock Production Science 40(3): 313-328.
References
136
LAURENA, A.C., REVILLEZA, M.J.R. & MENDOZA, E.M.T. 1994. Polyphenols, phytate, cyanogenic glycosides, and trypsin inhibitor activity of several Philippine indigenous food legumes. Journal of Food Composition and Analysis 7(3): 194-202.
LAVIN, M. 1986. The occurrence of canavanine in seeds of the tribe Robinieae. Biochemical Systematics and Ecology 14(1): 71-73.
LEE, C.K. & KARUNANITHY, R. 1990. Effects of germination on the chemical composition of Glycine and Phaseolus beans. Journal of the Science of Food and Agriculture 51(4): 437-445.
LEGEL, S. 1984. Feed value tables for tropical feeds. VEB Deutscher Landwirtschaftsverlag. Berlin, Germany.
LEI, V., AMOA-AWUA, W.K.A. & BRIMER, L. 1999. Degradation of cyanogenic glycosides by Lactobacillus plantarum strains from spontaneous cassava fermentation and other microorganisms. International Journal of Food Microbiology 53(2-3): 169-184.
LEÓN, R.A., ANGULO, I., JARAMILLO, M., REQUENA, F. & CALABRESE, H. 1993. Caracterización química y valor nutricional de granos de leguminosas tropicales para la alimentación de aves. Zootecnia Tropical 11(2): 151-170.
LESTIENNE, I., CAPORICCIO, B., BRESANCON, P., ROCHETTE, I. & TRECHET, S. 2005a. Relative contribution of phytates, fibers, and tannins to low iron and zinc in vitro solubility in pearl millet (Pennisetum glaucum) flour and grain fractions. Journal of Agricultural and Food Chemistry 53(21): 8342-8348.
LESTIENNE, I., ICARD-VERNIERE, C., MOUQUET, C., PICQ, C. & TRECHE, S. 2005b. Effects of soaking whole cereal and legume seeds on iron, zinc and phytate contents. Food Chemistry 89(3): 421-425.
LI, K.Y. 2004. Fermentation: Principles and microorganisms. Handbook of Food and Beverage Fermentation Technology. Y. H. Hui, L. Meunier-Goddik, Ö. S. Hansenet al, Marcel Dekker, New York, USA: 595-610.
LI, M.S., YAO, K., HE, Q. & JIA, D.Y. 2006. Biodegradation of gallotannins and ellagitannins. Journal of Basic Microbiology 46(1): 68-84.
LI, Y.R., LIU, Q.H., WANG, H.X. & NG, T.B. 2008. A novel lectin with potent antitumor, mitogenic and HIV-1 reverse transcriptase inhibitory activities from the edible mushroom Pleurotus citrinopileatus. Biochimica Et Biophysica Acta-General Subjects 1780(1): 51-57.
LIENER, I.E. 1974a. Phytohemagglutinins - Their Nutritional Significance. Journal of Agricultural and Food Chemistry 22(1): 17-23.
LIENER, I.E. 1974b. Phytohemagglutinins: Their nutritional significance. Journal of Agricultural and Food Chemistry 22(1): 17-23.
LIENER, I.E. 1976. Legume toxins in relation to protein digestibility: A review. Journal of Food Science 41(5): 1076-1081.
LIENER, I.E. 1997. Plant lectins: Properties, nutritional significance, and function. Antinutrients and Phytochemicals in Food 662: 31-43.
LIMA, R., DIAZ, R.F., CASTRO, A., HOEDTKE, S. & FIEVEZ, V. 2011. Multifactorial models to assess responses to sorghum proportion, molasses and bacterial inoculant on in vitro quality of sorghum-soybean silages. Animal Feed Science and Technology 164(3-4): 161-173.
LIMA, R., LOURENCO, M., DÍAZ, R.F., CASTRO, A. & FIEVEZ, V. 2010. Effect of combined ensiling of sorghum and soybean with or without molasses and lactobacilli on silage quality and in vitro rumen fermentation Animal Feed Science and Technology 155: 122-131.

References
137
LINDBERG, J.E., NGOAN, L.D., AN, L.V. & OGLE, B. 2000a. Ensiling techniques for shrimp by-products and their nutritive value for pigs. Asian-Australasian Journal of Animal Sciences 13(9): 1278-1284.
LINDBERG, J.E., PHUC, B.H.N. & OGLE, B. 2000b. Effect of replacing soybean protein with cassava leaf protein in cassava root meal based diets for growing pigs on digestibility and N retention. Animal Feed Science and Technology 83(3-4): 223-235.
LIU, K.S. 2011. Chemical composition of distillers grains, a review. Journal of Agricultural and Food Chemistry 59(5): 1508-1526.
LONGLAND, A.C., BARFOOT, C. & HARRIS, P.A. 2011. Effects of soaking on the water-soluble carbohydrate and crude protein content of hay. Veterinary Record 168(23): 618.
LOOMIS, W.D. & BATTAILE, J. 1966. Plant phenolic compounds and isolation of plant enzymes. Phytochemistry 5(3): 423-438.
LOPONEN, J., LAINE, P., SONTAG-STROHM, T. & SALOVAARA, H. 2007. Behaviour of oat globulins in lactic acid fermentation of oat bran. European Food Research and Technology 225(1): 105-110.
LOS, J. & PODSÉDEK, A. 2004. Tannins from different foodstuffs as trypsin inhibitors. Polish Journal of Food and Nutrition Sciences 13/54(1): 51-55.
LUO, Y.W., XIE, W.H., XIE, C.Y., LI, Y. & GU, Z.X. 2009. Impact of soaking and phytase treatments on phytic acid, calcium, iron and zinc in faba bean fractions. International Journal of Food Science and Technology 44(12): 2590-2597.
LY, J. 1990. The physiological and biochemical basis for feeding pigs and poultry in the tropics (part 1). Livestock Research for Rural Development. 2(2).9 Jun 2011, http://www.lrrd.org/lrrd2/2/ly1.htm
LY, J. 1993. The role of monogastric animal species in the sustainable use of tropical feed resources. VII World Conference on Animal Production, University of Alberta, Edmonton, Alberta, Canada, 95-117.
LY, J. 2000. A note on the digestive indices of pigs fed ad libitum intact or ground royal palm nut. Cuban Journal of Agricultural Science 34(2): 129-131.
LY, J. 2004. Bananas and plantains for feeding pigs: Some aspects of the chemical composition of the fruits and of its palatability. Revista Computarizada de Producción Porcina. 11(3): 5-25.Septiembre, 5 2011, http://www.sian.info.ve/porcinos/publicaciones/rccpn/rcpp.htm#1306
LY, J., P., S. & PRESTON, T.R. 2002. Nutritional evaluation of aquatic plants for pigs: pepsin/pancreatin digestibility of six plant species. 14(1).6 Sep 2011, http://www.cipav.org.co/lrrd/lrrd14/1/ly141a.htm
LY, J., SAMKOL, P. & PRESTON, T.R. 2001. Nutritional evaluation of tropical leaves for pigs: Pepsin/pancreatin digestibility of thirteen plant species. 13(5).6 Sep 2001, http://www.cipav.org.co/lrrd/lrrd13/5/ly135.htm
LY, N.T.H., NGOAN, L.D., VERSTEGEN, M.W.A. & HENDRIKS, W.H. 2010. Ensiled and dry cassava leaves, and sweet potato vines as a protein source in diets for growing Vietnamese Large White x Mong Cai pigs. Asian-Australasian Journal of Animal Sciences 23(9): 1205-1212.
LY, N.T.H., NGOAN, L.D., VERSTEGEN, M.W.A. & HENDRIKS, W.H. 2011. Inclusion of ensiled cassava KM94 leaves in diets for growing pigs in Vietnam reduces growth rate but increases profitability. Asian-Australasian Journal of Animal Sciences 24(8): 1157-1163.

References
138
MAKINDE, M.O., UMAPATHY, E., AKINGBEMI, B.T. & MANDISODZA, K.T. 1996a. Effects of feeding different levels of cowpea (Vigna unguiculata) on gut morphology and faecal composition in weanling pigs South African Journal of Animal Science 26(2): 42-46.
MAKINDE, M.O., UMAPATHY, E., AKINGBEMI, B.T., MANDISODZA, K.T. & SKADHAUGE, E. 1996b. Effects of dietary soybean and cowpea on gut morphology and faecal composition in creep and noncreep-fed pigs. Journal of Veterinary Medicine Series a-Physiology Pathology Clinical Medicine 43(2): 75-85.
MAKKAR, H.P.S., SIDDHURAJU, P. & BECKER, K., Eds. 2007. Plant secondary metabolites Methods in molecular biology.393. Humana Press Inc., Totowa, New Jersey, USA.
MALINOW, M.R., BARDANA, E.J., PIROFSKY, B., CRAIG, S. & MCLAUGHLIN, P. 1982. Systemic Lupus Erythematosus-like Syndrome in monkeys fed alfalfa sprouts: Role of a non-protein amino acid. Science 216(4544): 415-417.
MANFREDINI, M., BADIANI, A., NANNI, N. & CHIZZOLINI, R. 1993. Sweet potato chips in heavy pig production. Livestock Production Science 35(3-4): 329-340.
MARTIN-CABREJAS, M.A., DIAZ, M.F., AGUILERA, Y., BENITEZ, V., MOLLA, E. & ESTEBAN, R.M. 2008. Influence of germination on the soluble carbohydrates and dietary fibre fractions in non-conventional legumes. Food Chemistry 107(3): 1045-1052.
MARTIN JR, J.H., LOEHR, R.C. & PILBEAM, T.E. 1983. Animal manures as feedstuffs: Nutrient characteristics. Agricultural Wastes 6(3): 131-166.
MARUYAMA, A., YOSHIYAMA, M., ADACHI, Y., TANI, A., HASEGAWA, R. & ESASHI, Y. 1996. Promotion of cocklebur seed germination by allyl, sulfur and cyanogenic compounds. Plant and Cell Physiology 37(8): 1054-1058.
MCDONALD, P., HENDERSON, A.R. & HERON, S.J.E. 1991. The biochemistry of silage. Chalcombe Publications Marlow, UK.
MENEZES, L.F.G., SEGABINAZZI, L.R., BRONDANI, I.L., RESTLE, J., ARBOITTE, M.Z., KUSS, F., PACHECO, P.S. & ROSA, J.R.P. 2009. Corn silage and sorghum grain supplementation to cull cows finished on cultivated winter pasture. Arquivo Brasileiro De Medicina Veterinaria E Zootecnia 61(1): 182-189.
MENGE-HARTMANN, U., SOUFAN, W. & GREEF, J.M. 2009. The influence of plant development stage and N fertilization on the content of water soluble carbohydrates and fructans in different varieties of Lolium perenne. Journal für Kulturpflanzen 61(10): 365-374.
MICHE, L. & BALANDREAU, J. 2001. Effects of rice seed surface sterilization with hypochlorite on inoculated Burkholderia vietnamiensis. Applied and Environmental Microbiology 67(7): 3046-3052.
MICHELANGELI, C., PÉREZ, G., MÉNDEZ, A. & SÍVOLI, L. 2004a. Efecto del tostado del grano de Canavalia ensiformis sobre el comportamiento productivo de cerdos en crecimiento. Zootecnia tropical 22(1): 87-100.
MICHELANGELI, C., PÉREZ, G., MÉNDEZ, A., SÍVOLI, L. & PIZZANI, P. 2004b. Digestibilidades ileal y fecal en cerdos, del nitrógeno, aminoácidos, energía y componentes de la pared celular, de granos tostados de Canavalia ensiformis (L.). Zootecnia Trop. 22(1): 71-86.
MIGWI, P.K., GALLAGHER, J.R. & VAN BARNEVELD, R.J. 2000. Effect of molasses on the fermentation quality of wheat straw and poultry litter ensiled with citrus pulp. Australian Journal of Experimental Agriculture 40(6): 825-829.
References
139
MITARU, B.N., REICHERT, R.D. & BLAIR, R. 1984. The binding of dietary protein by sorghum tannins in the digestive tract of pigs. Journal of Nutrition 114(10): 1787-1796.
MITZNER, K.C., OWEN, F.G. & GRANT, R.J. 1994. Comparison of sorghum and corn grains in early and midlactation diets for dairy cows. Journal of Dairy Science 77(4): 1044-1051.
MORON, O.E., PIETROSEMOLI, S., PAEZ, A., CHIRINOS, C. & MARRUGO, A. 2006. Effect of substitution of concentrate by sweet potato (Ipomoea batatas L.) meal in carcass traits of finishing pigs. Journal of Animal Science 84: 38-38.
MORRIS, J.B. 2007. Swordbean (Canavalia ensiformis (L.) DC.) genetic resources regenerated for potential medical, nutraceutical and agricultural traits. Genetic Resources and Crop Evolution 54(3): 585-592.
MOSLEHISHAD, M., MIRDAMADI, S., EHSANI, M.R., EZZATPANAH, H. & MOOSAVI-MOVAHEDI, A.A. 2013. The proteolytic activity of selected lactic acid bacteria in fermenting cow's and camel's milk and the resultant sensory characteristics of the products. International Journal of Dairy Technology 66(2): 279-285.
MUCK, R.E. 1988. Factors influencing silage quality and their implications for management. Journal of Dairy Science 71(11): 2992-3002.
MUCK, R.E., PITT, R.E. & LEIBENSPERGER, R.Y. 1991. A model of aerobic fungal growth in silage.1. Microbial characteristics. Grass and Forage Science 46(3): 283-299.
MULIMANI, V.H. & VADIRAJ, S. 1991. Proteinase inhibitors of sorghum. Journal of the Science of Food and Agriculture 54(3): 485-488.
MURALIKRISHNA, G. & RAO, M.V.S.S.T.S. 2007. Cereal non-cellulosic polysaccharides: Structure and function relationship - An overview. Critical Reviews in Food Science and Nutrition 47(6): 599-610.
MUZQUIZ, M., VARELA, A., BURBANO, C., CUADRADO, C., GUILLAMON, E. & PEDROSA, M.M. 2012. Bioactive compounds in legumes: Pronutritive and antinutritive actions. Implications for nutrition and health. Phytochemistry Reviews 11(2-3): 227-244.
MUZQUIZ, M., WELHAM, T., ALTARES, P., GOYOAGA, C., CUADRADO, C., ROMERO, C., GUILLAMON, E. & DOMONEY, C. 2004. The effect of germination on seed trypsin inhibitors in Vicia faba and Cicer arietinum. Journal of the Science of Food and Agriculture 84(6): 556-560.
MYER, R.O. & GORBET, D.I. 2004. Crystalline amino acid supplementation of grain sorghum-based low protein diets for growing-finishing pigs. Journal of Applied Animal Research 25(2): 85-90.
MYER, R.O. & GORBET, D.W. 1994. Evaluation of Yellow Seed Color Grain-Sorghum as a Feed Grain for Swine. Soil and Crop Science Society of Florida Proceedings 53: 76-80.
MYER, R.O., WHITE, C.E., COMBS, G.E. & GORBET, D.W. 1985. Bird-Resistant Grain-Sorghum as a Corn Substitute in Diets for Growing-Finishing Swine. Soil and Crop Science Society of Florida Proceedings 44: 159-161.
MYRIE, S.B., BERTOLO, R.F., SAUER, W.C. & BALL, R.O. 2008. Effect of common antinutritive factors and fibrous feedstuffs in pig diets on amino acid digestibilities with special emphasis on threonine. Journal of Animal Science 86(3): 609-619.

References
140
NATARAJAN, K. & RAJENDRAN, A. 2012. Evaluation and optimization of food-grade tannin acyl hydrolase production by a probiotic Lactobacillus plantarum strain in submerged and solid state fermentation. Food and Bioproducts Processing 90(4): 780-792.
NATELSON, S. 1985. Canavanine to arginine ratio in alfalfa (Medicago sativa), clover (Trifolium), and the Jack bean (Canavalia ensiformis). Journal of Agricultural and Food Chemistry 33(3): 413-419.
NAUGHTON, P.J., GRANT, G., BARDOCZ, S. & PUSZTAI, A. 2000. Modulation of salmonella infection by the lectins of Canavalia ensiformis (Con A) and Galanthus nivalis (GNA) in a rat model in vivo. Journal of Applied Microbiology 88(4): 720-727.
NEURATH, H. 1984. Evolution of proteolytic enzymes. Science 224(4647): 350-357. NGUYEN, T.T., LINDBERG, J.E. & OGLE, B. 2010. Effect of additive on the chemical
composition of Tra catfish (Pangasius hypophthalmus) by-product silages and their nutritive value for pigs. Asian-Australasian Journal of Animal Sciences 23(6): 762-771.
NIDERKORN, V., BOUDRA, H. & MORGAVI, D.P. 2006. Binding of Fusarium mycotoxins by fermentative bacteria in vitro. Journal of Applied Microbiology 101(4): 849-856.
NIDERKORN, V., MORGAVI, D.P., PUJOS, E., TISSANDIER, A. & BOUDRA, H. 2007. Screening of fermentative bacteria for their ability to bind and biotransform deoxynivalenol, zearalenone and fumonisins in an in vitro simulated corn silage model. Food Additives and Contaminants 24(4): 406-415.
NIELSEN, S.S. & LIENER, I.E. 1988. Effect of germination on trypsin inhibitor and hemagglutinating activities in Phaseolus vulgaris. Journal of Food Science 53(1): 298-299.
NKOSI, B.D., MEESKE, R., PALIC, D. & LANGA, T. 2009. Laboratory evaluation of an inoculant for ensiling whole crop maize in South Africa. Animal Feed Science and Technology 150(1-2): 144-150.
NOUT, M.J.R. & KIERS, J.L. 2005. Tempe fermentation, innovation and functionality: Update into the third millenium. Journal of Applied Microbiology 98(4): 789-805.
NRC. 2012. Nutrient requirements of swine. The National Academies Press, Washington DC, USA.
NWOKORO, O. & ANYA, F.O. 2011. Linamarase enzyme from Lactobacillus delbrueckii NRRL B-763: Purification and some properties of a beta-glucosidase. Journal of the Mexican Chemical Society 55(4): 246-250.
NYANNOR, E.K.D., ADEDOKUN, S.A., HAMAKER, B.R., EJETA, G. & ADEOLA, O. 2007. Nutritional evaluation of high-digestible sorghum for pigs and broiler chicks. Journal of Animal Science 85(1): 196-203.
OBOH, H.A., MUZQUIZ, M., BURBANO, C., CUADRADO, C., PEDROSA, M.M., AYET, G. & OSAGIE, A.U. 2002. Effect of local food processing on the inositol phosphate contents in lima bean (Phaseolus lunatus L.); pigeon pea (Cajanus cajan); African yam bean (Sphenostylis sternocarpa) and Jack bean (Canavalia ensiformis). Ecology of Food and Nutrition 41(3): 229-242.
OCAMPO, A. 1994. Utilización del fruto de palma africana como fuente de energía con niveles restringidos de proteina en la alimentación de cerdos de engorde. Livestock Research for Rural Development. 6(1).6 Sep 2011, http://www.lrrd.org/lrrd6/1/ocampo1.htm
OFEK, M., HADAR, Y. & MINZ, D. 2011. Colonization of cucumber seeds by bacteria during germination. Environmental Microbiology 13(10): 2794-2807.
References
141
OGAWA, J., KISHINO, S., ANDO, A., SUGIMOTO, S., MIHARA, K. & SHIMIZU, S. 2005. Production of conjugated fatty acids by lactic acid bacteria. Journal of Bioscience and Bioengineering 100(4): 355-364.
OGLE, R.B., BORIN, K. & LINDBERG, J.E. 2005. Effect of variety and preservation method of cassava leaves on diet digestibility by indigenous and improved pigs. Animal Science 80: 319-324.
OJEDA, A., FRIAS, A., GONZALEZ, R. & PIZZANI, Z.L.Y.P. 2010. Tannins, phytic phosphorus, phytase activity in the seed of 12 sorghum grain hybrids (Sorghum bicolor (L) Moench). Archivos Latinoamericanos De Nutricion 60(1): 93-98.
OKAI, D.B., BONSI, M.L.K. & EASTER, R.A. 1985. Dried coffee pulp (DCP) as an Ingredient in the diets of growing pigs. Tropical Agriculture 62(1): 62-64.
OLDENBURG, E., BRAMM, A. & VALENTA, H. 2007. Influence of nitrogen fertilization on deoxynivalenol contamination of winter wheat — experimental field trials and evaluation of analytical methods. Mycotoxin Research 23(1): 7-12.
OLIVERA-CASTILLO, L., PEREIRA-PACHECO, F., POLANCO-LUGO, E., OLVERA-NOVOA, M., RIVAS-BURGOS, J. & GRANT, G. 2007. Composition and bioactive factor content of cowpea (Vigna unguiculata L. Walp) raw meal and protein concentrate. Journal of the Science of Food and Agriculture 87(1): 112-119.
ONWUKA, G.I. 2006. Soaking, boiling and antinutritional factors in pigeon peas (Cajanus cajan) and cowpeas (Vigna unguiculata). Journal of Food Processing and Preservation 30(5): 616-630.
ORRU, A. & DEMEL, V.C. 1941. Physiological and anatomical-pathological observations on rats fed seeds of Canavalia ensiformis. Quadr. Nutrition 7: 272-275.
OVELGONNE, J.H., KONINKX, J.F.J.G., PUSZTAI, A., BARDOCZ, S., KOK, W., EWEN, S.W.B., HENDRIKS, H.G.C.J.M. & VAN DIJK, J.E. 2000. Decreased levels of heat shock proteins in gut epithelial cells after exposure to plant lectins. Gut 46(5): 679-687.
PAHLOW, G., MUCK, R.E., DRIEHUIS, F., OUDE ELFERINK, S.J.W.H. & SPOELSTRA, S.F. 2003. Microbiology of ensiling. Silage science and technology. D. R. Buxton, R. E. Muck & J. H. Harrison. Madison, Wisconsin, USA. 42: 31-94.
PANASIUK, O. & BILLS, D.D. 1984. Cyanide content of sorghum sprouts. Journal of Food Science 49(3): 791-793.
PANDA, M. & ROBINSON, N.C. 1995. Kinetics and mechanism for the binding of HCN to cytochrome-C-oxidase. Biochemistry 34(31): 10009-10018.
PARRA, F., DIAZ, I., GONZALEZ, D., HURTADO, E., GARBATI, S. & VECCHIONACCE, H. 2002. Presentation's effect of cassava (Manihot esculenta Crantz) root and foliage on the apparent digestibility in swine diets. Revista Cientifica-Facultad De Ciencias Veterinarias 12: 471-474.
PARSONS, C.M. 1996. Digestible amino acids for poultry and swine. Animal Feed Science and Technology 59(1-3): 147-153.
PATERNIANI, E. 1990. Maize breeding in the tropics. Critical Reviews in Plant Sciences 9(2): 125-154.
PÉREZ, A., SAUCEDO, O., IGLESIAS, J., WENCOMO, H.B., REYES, F., OQUENDO, G. & MILIÁN, I. 2010. Characterization and potential of sorghum (Sorghum bicolor L. Moench) grain. Pastos y Forrajes 33(1): 1-17.
PEREZMALDONADO, R.A., NORTON, B.W. & KERVEN, G.L. 1995. Factors affecting in vitro formation of tannin-protein complexes. Journal of the Science of Food and Agriculture 69(3): 291-298.

References
142
PESTKA, J.J. 2007. Deoxynivalenol: Toxicity, mechanisms and animal health risks. Animal Feed Science and Technology 137(3-4): 283-298.
PIEPER, B., KLEEMANN, J., POPPE, S., ALLERT, H., LOSCH, K., WITTCHEN, H., MIELITZ, E. & SCHULTZ, A. 1989. Verfahren zu Bestimmung der Vergärbarkeit von Futterpflanzen. Patent Specification DD 281 255 A5, P. O. o. t. G. D. Republic.
PIEPER, R., HACKL, W., KORN, U., ZEYNER, A., SOUFFRANT, W.B. & PIEPER, B. 2010. Effect of ensiling triticale, barley and wheat grains at different moisture content and addition of Lactobacillus plantarum (DSMZ 8866 and 8862) on fermentation characteristics and nutrient digestibility in pigs. Animal Feed Science and Technology 164(1): 96-105.
PIETROSEMOLI, S., MORON, O., PAEZ, A., CHIRINOS, C. & MARRUGO, A. 2006. Effect of inclusion of sweet potato (Ipomoea batatas L.) meal on weight gain and dressing percentage of finishing pigs. Journal of Animal Science 84: 242.
PILOBELLO, K.T. & MAHAL, L.K. 2007. Deciphering the glycocode: The complexity and analytical challenge of glycomics. Current Opinion in Chemical Biology 11(3): 300-305.
PILOTO, J.L., MEDEROS, C.M., ALMAGUEL, R.E. & CRUZ, E. 2009. Use of Torula yeast ex-vinasses as protein and complex B vitamin source for feeding growing-fattening pigs. Revista Computadorizada de Producción Porcina. 16(2).6 Sep 2011, http://pigtrop.cirad.fr/content/download/7940/44236/file/162%2007artJLPiloto.pdf
PINHEIRO, A.Q., MELO, D.F., MACEDO, L.M., FREIRE, M.G.M., ROCHA, M.F.G., SIDRIM, J.J.C., BRILHANTE, R.S.N., TEIXEIRA, E.H., CAMPELLO, C.C., PINHEIRO, D.C.S.N. & LIMA, M.G.S. 2009. Antifungal and marker effects of Talisia esculenta lectin on Microsporum canis in vitro. Journal of Applied Microbiology 107(6): 2063-2069.
PIZZANI, P., VARGAS, R.E., PEREZ, S., MENDEZ, A., MICHELANGELI, C. & SIVOLI, L. 2006. Effects of toasting on true metabolizable energy value and content of antinutritional factors of Canavalia ensiformis (L.) seed meals. Revista Cientifica-Facultad De Ciencias Veterinarias 16(5): 523-530.
PLACINTA, C.M., D'MELLO, J.P.F. & MACDONALD, A.M.C. 1999. A review of worldwide contamination of cereal grains and animal feed with Fusarium mycotoxins. Animal Feed Science and Technology 78(1-2): 21-37.
PLAYNE, M.J. & MCDONALD, P. 1966. The buffering constituents of herbage and of silage. Journal of Sciences of Food Agriculture 17(June): 264-268.
PORTER, L.J., HRSTICH, L.N. & CHAN, B.G. 1986. The conversion of procyanidins and prodelphinidins to cyanidin and delphinidin. Phytochemistry 25(1): 223-230.
POULTON, J.E. 1990. Cyanogenesis in plants. Plant Physiology 94(2): 401-405. PRESCOTT, L.M., HARLEY, J.P. & KLEIN, D.A. 2004. Mycrobiology. McGraw-Hill,
New York, USA. PRESTON, T.R. 1995. Tropical animal feeding: A manual for research workers, FAO,
Rome, Italy PRINYAWIWATKUL, W., EITENMILLER, R.R., BEUCHAT, L.R., MCWATTERS, K.H.
& PHILLIPS, R.D. 1996a. Cowpea flour vitamins and trypsin inhibitor affected by treatment and fermentation with Rhizopus microsporus. Journal of Food Science 61(5): 1039-1042.
PRINYAWIWATKUL, W., MCWATTERS, K.H., BEUCHAT, L.R. & PHILLIPS, R.D. 1996b. Cowpea flour: A potential ingredient in food products. Critical Reviews in Food Science and Nutrition 36(5): 413-436.
References
143
PROSEA. 1992. Plant resources of South-East Asia. No. 4. Forages. Pudoc. Wageningen, Netherlands.
PURSIAINEN, P. & TUORI, M. 2008. Effect of ensiling field bean, field pea and common vetch in different proportions with whole-crop wheat using formic acid or an inoculant on fermentation characteristics. Grass and Forage Science 63(1): 60-78.
PUSZTAI, A., EWEN, S.W.B., GRANT, G., PEUMANS, W.J., VANDAMME, E.J.M., RUBIO, L. & BARDOCZ, S. 1990. Relationship between survival and binding of plant lectins during small intestinal passage and their effectiveness as growth factors. Digestion 46: 308-316.
PUSZTAI, A., GRANT, G., BARDOCZ, S., BAINTNER, K., GELENCSER, E. & EWEN, S.W.B. 1997. Both free and complexed trypsin inhibitors stimulate pancreatic secretion and change duodenal enzyme levels. American Journal of Physiology-Gastrointestinal and Liver Physiology 35(2): G340-G350.
QIN, G., TERELST, E.R., BOSCH, M.W. & VANDERPOEL, A.F.B. 1996. Thermal processing of whole soya beans: Studies on the inactivation of antinutritional factors and effects on ileal digestibility in piglets. Animal Feed Science and Technology 57(4): 313-324.
RACKIS, J.J., WOLF, W.J. & BAKER, E.C. 1986. Protease inhibitors in plant foods: Content and inactivation. Advances in Experimental Medicine and Biology 199: 299-347.
RAJARAJAN, K. & GANESAMURTHY, K. 2011. Genetic diversity analysis of sorghum [Sorghum bicolor (L.) Moench] genotypes for drought tolerance using SSR markers. Indian Journal of Genetics and Plant Breeding 71(1): 17-24.
REDDY, G., ALTAF, M., NAVEENA, B.J., VENKATESHWAR, M. & KUMAR, E.V. 2008. Amylolytic bacterial lactic acid fermentation: A review. Biotechnology Advances 26(1): 22-34.
REDDY, N.R. & PIERSON, M.D. 1994. Reduction in antinutritional and toxic components in plant foods by fermentation. Food Research International 27(3): 281-290.
REDDY, N.R., PIERSON, M.D., SATHE, S.K. & SALUNKHE, D.K. 1985. Dry bean tannins: A review of nutritional implications. Journal of the American Oil Chemists Society 62(3): 541-549.
REN, B., WU, M., WANG, Q., PENG, X., WEN, H., MCKINSTRY, W.J. & CHEN, Q. 2013. Crystal structure of tannase from Lactobacillus plantarum. Journal of Molecular Biology 425(15): 2737-2751.
RICHARDSON, M. 1977. The proteinase inhibitors of plants and microorganisms. Phytochemistry 16(2): 159-169.
RICHARDSON, M. 1981. Protein inhibitors of enzymes. Food Chemistry 6(3): 235-253. RISSO, J.F. & MONTILLA, J.J. 1992. Grain meal of raw, stored in alkaline medium,
autoclavated and extruded Canavalia ensiformis, in diets for growing pigs. Archivos Latinoamericanos De Nutricion 42(3): 268-274.
ROBBINS, C.T., MOLE, S., HAGERMAN, A.E. & HANLEY, T.A. 1987. Role of tannins in defending plants against ruminants: Reduction in dry matter digestion. Ecology 68(6): 1606-1615.
ROBERTS, J.L. & HAYASHI, J.A. 1983. Exacerbation of SLE associated with alfalfa ingestion. New England Journal of Medicine 308(22): 1361-1361.

References
144
RODRIGUEZ, H., CURIEL, J.A., LANDETE, J.M., DE LAS RIVAS, B., DE FELIPE, F.L., GOMEZ-CORDOVES, C., MANCHENO, J.M. & MUNOZ, R. 2009. Food phenolics and lactic acid bacteria. International Journal of Food Microbiology 132(2-3): 79-90.
ROOKE, J.A. & HATFIELD, R.D. 2003. Biochemistry of ensiling Silage Science and Technology. D. R. Buxton, R. E. Muck & J. H. Harrison. Madison, Wisconsin, USA: 95-139.
ROSENTHAL, G.A. 1970. Investigations of canavanine biochemistry in Jack bean plant, Canavalia ensiformis (L) DC. 1. Canavanine utilization in developing plant. Plant Physiology 46(2): 273-276.
ROSENTHAL, G.A. 1972. Investigations of canavanine biochemistry in Jack bean plant, Canavalia ensiformis (L.) DC. 2. Canavanine biosynthesis in developing plant. Plant Physiology 50(3): 328-331.
ROSENTHAL, G.A. 1977a. Biological effects and mode of action of L-canavanine, a structural analog of L-arginine. Quarterly Review of Biology 52(2): 155-178.
ROSENTHAL, G.A. 1977b. Nitrogen Allocation for L-Canavanine Synthesis and Its Relationship to Chemical Defense of Seed. Biochemical Systematics and Ecology 5(3): 219-220.
ROSENTHAL, G.A. 1982. L-canavanine metabolism in Jack bean, Canavalia ensiformis (L) DC (Leguminosae). Plant Physiology 69(5): 1066-1069.
ROSENTHAL, G.A. 2001. L-canavanine: A higher plant insecticidal allelochemical. Amino Acids 21(3): 319-330.
ROSENTHAL, G.A. & BERGE, M.A. 1989. Catabolism of L-canavanine and L-canaline in the Jack bean, Canavalia ensiformis (L) DC (Leguminosae). Journal of Agricultural and Food Chemistry 37(3): 591-595.
ROSENTHAL, G.A., BERGE, M.A., OZINSKAS, A.J. & HUGHES, C.G. 1988. Ability of L-canavanine to support nitrogen metabolism in the Jack bean, Canavalia ensiformis (L) DC. Journal of Agricultural and Food Chemistry 36(6): 1159-1163.
ROSENTHAL, G.A. & RHODES, D. 1984. L-canavanine transport and utilization in developing Jack bean, Canavalia ensiformis (L) DC (Leguminosae). Plant Physiology 76(2): 541-544.
RUEDA, E., MICHELANGELI, C. & GONZALEZ-MUJICA, F. 2003. L-canavanine inhibits L-arginine uptake by broiler chicken intestinal brush border membrane vesicles. British Poultry Science 44(4): 620-625.
RYAN, C.A. 1990. Protease inhibitors in plants genes for improving defenses against insects and pathogens. Annual Review of Phytopathology 28: 425-449.
SA, R.A., SANTOS, N.D.D., DA SILVA, C.S.B., NAPOLEAO, T.H., GOMES, F.S., CAVADA, B.S., COELHO, L.C.B.B., NAVARRO, D.M.D.F., BIEBER, L.W. & PAIVA, P.M.G. 2009. Larvicidal activity of lectins from Myracrodruon urundeuva on Aedes aegypti. Comparative Biochemistry and Physiology C-Toxicology & Pharmacology 149(3): 300-306.
SALMINEN, J.P., V, O., LOPONEN, J., HAUKIOJA, E. & PIHLAJA, K. 1999. Characterisation of hydrolysable tannins from leaves of Betula pubescens by high performance liquid chromatography-mass spectrometry. Journal of Chromatography A 864(2): 283-291.
SANTOS-BUELGA, C. & SCALBERT, A. 2000. Proanthocyanidins and tannin-like compounds - nature, occurrence, dietary intake and effects on nutrition and health. Journal of the Science of Food and Agriculture 80(7): 1094-1117.
References
145
SANTOS, F.A.P., HUBER, J.T., THEURER, C.B., SWINGLE, R.S. & SIMAS, J.M. 1997. Response of lactating dairy cows to various densities of sorghum grain. Journal of Animal Science 75(6): 1681-1685.
SARMIENTO, L., GOROCICA, E., RAMÍREZ, L., CASTILLO, J., SANTOS, R. & DÍAZ, M.F. 2011. True metabolizable energy and digestibility of five Vigna unguiculata varieties in chickens. Tropical and Subtropical Agroecosystems 14: 179-183.
SARRIA, P. & PRESTON, T.R. 1992. Reemplazo parcial del jugo de caña con vinaza y uso del grano de soya a cambio de torta en dietas de cerdos de engorde. Livestock Research for Rural Development. 4(1).6 Sep 2011, http://www.lrrd.org/lrrd4/1/sarria.htm
SAS/STAT 2009. User’s Guide. S. Edition. Cary, NC, SAS Institute Inc. SAUER, J. 1964. Revision of Canavalia. Brittonia 16: 106-181. SAURA-CALIXTO, F., SERRANO, J., PUUPPONEN-PIMIA, R., DAUER, A. & AURA,
A.M. 2009. Tannins: Current knowledge of food sources, intake, bioavailability and biological effects. Molecular Nutrition & Food Research 53: S310-S329.
SAVELKOUL, F.H.M.G., VANDERPOEL, A.F.B. & TAMMINGA, S. 1992. The presence and inactivation of trypsin inhibitors, tannins, lectins and amylase inhibitors in legume seeds during germination. A review. Plant Foods for Human Nutrition 42(1): 71-85.
SAVON, L., CORTAN, N. & GONZALEZ, T. 1999. The biological assessment of nitrogen in homemade protein molasses (HPM) for growing pigs. Cuban Journal of Agricultural Science 33(3): 287-294.
SCHMIDT, T., KRAWIELITZKI, K., VOIGT, J. & GABEL, M. 2005. Methodical aspects of the in situ technique for estimating ruminal nutrient degradation: Microbial contamination and lag time. Übersichten zur Tierernährung 33: 87-100.
SCHULZE, H., SAVELKOUL, F.H., VERSTEGEN, M.W., VAN DER POEL, A.F., TAMMINGA, S. & GROOT NIBBELINK, S. 1997. Nutritional evaluation of biologically treated white kidney beans (Phaseolus vulgaris L.) in pigs: Ileal and amino acid digestibility. Journal of Animal Science 75(12): 3187-3194.
SEBASTIAN, S., PHILLIP, L.E., FELLNER, V. & IDZIAK, E.S. 1996. Comparative assessment of bacterial inoculation and propionic acid treatment on aerobic stability and microbial populations of ensiled high-moisture ear corn. Journal of Animal Science 74(2): 447-456.
SELMAR, D., GROCHOLEWSKI, S. & SEIGLER, D.S. 1990. Cyanogenic lipids: Utilization during seedling Development of Ungnadia speciosa. Plant Physiology 93(2): 631-636.
SELMAR, D., LIEBEREI, R. & BIEHL, B. 1988. Mobilization and utilization of cyanogenic glycosides: The linustatin pathway. Plant Physiology 86(3): 711-716.
SHARON, N. & LIS, H. 1972. Lectins: Cell-agglutinating and sugar-specific proteins. Science 177(4053): 949-959.
SIDDHURAJU, P., VIJAYAKUMARI, K. & JANARDHANAN, K. 1994. Chemical analysis and nutritional assessment of the less known pulses, Vigna aconitifolia (Jacq.) Marechal and Vigna vexilata (L.) A. Rich. Plant food for human nutrition 45: 103-111.
SILVA, S.I., TAVANO, O.L., DEMONTE, A., ROSSI, E.A. & PINTO, A. 2013. Nutritional evaluation of soy yoghurt in comparison to soymilk and commercial milk yoghurt. Effect of fermentation on soy protein. Acta Alimentaria 41(4): 443-450.

References
146
SINGH, B.B., CHAMBLISS, O.L. & SHARMA, B. 1997. Recent advances in cowpea breeding Copublication of International Institute of Tropical Agriculture (IITA) and Japan International Research Center for Agricultural Sciences (JIRCAS). IITA, Ibadan, Nigeria. "Sayce" Publishing, Devon, UK.
SINGLETON, P. & SAINSBURY, D. 2006. Dictionary of microbiology and molecular biology. John Wiley & Sons Ltd, West Sussex, England.
SMIL, V. 1999. Nitrogen in crop production: An account of global flows. Global Biogeochemical Cycles 13(2): 647-662.
SMITH, C., VANMEGEN, W., TWAALFHOVEN, L. & HITCHCOCK, C. 1980. The determination of trypsin-inhibitor levels in foodstuffs. Journal of the Science of Food and Agriculture 31(4): 341-350.
SOHONIE, K. & AMBE, K.S. 1955. Crystalline trypsin inhibitors from the Indian field bean and the double bean. Nature 175(4455): 508-509.
SORBO, B.H. 1953. On the substrate specificity of rhodanese. Acta Chemica Scandinavica 7(1): 32-37.
SOTTO, V.R., BRITO, M., LÓPEZ, B., PÉREZ, E. & VELÁZQUEZ, F. 2009. Use of citrus meal for feeding sows during the gestation and lactation stage. Revista Computarizada de Producción Porcina. 16(1).5 Sep 2011,
SOUCI, S.W., FACHMANN, W. & KRAUT, H. 2000. Food Composition and Nutrition Tables. CRC Press Inc. Scientific Publishers Stuttgart, Germany.
SPRENT, J.I., ODEE, D.W. & DAKORA, F.D. 2010. African legumes: A vital but under-utilized resource. Journal of Experimental Botany 61(5): 1257-1265.
SRIDHAR, K.R. & SEENA, S. 2006. Nutritional and antinutritional significance of four unconventional legumes of the genus Canavalia - A comparative study. Food Chemistry 99(2): 267-288.
STARZYNSKA-JANISZEWSKA, A., STODOLAK, B. & MICKOWSKA, B. 2014. Effect of controlled lactic acid fermentation on selected bioactive and nutritional parameters of tempeh obtained from unhulled common bean (Phaseolus vulgaris) seeds. Journal of the Science of Food and Agriculture 94(2): 359-366.
STEENDAM, C.A.C., TAMMINGA, S., BOER, H., DE JONG, E.J., VISSER, G.H. & VERSTEGEN, M.W.A. 2004. Ileal endogenous nitrogen recovery is increased and its amino acid pattern is altered in pigs fed quebracho extract. Journal of Nutrition 134(11): 3076-3082.
STEIN, H.H., PAHM, A.A. & PEDERSEN, C. 2008. Application of the reactive lysine procedure to estimate lysine digestibility in distillers dried grains with solubles fed to growing pigs. Journal of Agricultural and Food Chemistry 56(20): 9441-9446.
STÜRMER, K. 2005. Untersuchungen zum Einfluss der Fütterung auf den Säure-Basen-Haushalt bei Ponys. PhD, University of Munich, Germany.
SUMNER, J.B. & HOWELL, S.F. 1936. Identification of hemagglutinin of Jack bean with concanavalin A. Journal of Bacteriology 32(2): 227-237.
SWANSON, M.D., WINTER, H.C., GOLDSTEIN, I.J. & MARKOVITZ, D.M. 2010. A lectin isolated from bananas is a potent inhibitor of HIV replication. Journal of Biological Chemistry 285(12): 8646-8655.
SZE, K.L. & TZI, B.N. 2011. Lectins: Production and practical applications. Applied Microbiology and Biotechnology 89(1): 45-55.
TELLER, R.S., SCHMIDT, R.J., WHITLOW, L.W. & KUNG, L. 2012. Effect of physical damage to ears of corn before harvest and treatment with various additives on the concentration of mycotoxins, silage fermentation, and aerobic stability of corn silage. Journal of Dairy Science 95(3): 1428-1436.

References
147
TEPAL, J.A., CASTELLANOS, R. & LARIOS, A. 1994. Detoxification of Jack beans (Canavalia ensiformis). 1. Extrusion and canavanine elimination. Journal of the Science of Food and Agriculture 66(3): 373-379.
THEURER, C.B., HUBER, J.T., DELGADO-ELORDUY, A. & WANDERLEY, R. 1999. Invited review: Summary of steam-flaking corn or sorghum grain for lactating dairy cows. Journal of Dairy Science 82(9): 1950-1959.
TORINO, M.I., LIMON, R.I., MARTINEZ-VILLALUENGA, C., MAKINEN, S., PIHLANTO, A., VIDAL-VALVERDE, C. & FRIAS, J. 2013. Antioxidant and antihypertensive properties of liquid and solid state fermented lentils. Food Chemistry 136(2): 1030-1037.
TORRES, J., MUÑOZ, L.S., PETERS, M. & MONTOYA, C.A. 2013. Characterization of the nutritive value of tropical legume grains as alternative ingredients for small-scale pork producers using in vitro enzymatic hydrolysis and fermentation*. Journal of Animal Physiology and Animal Nutrition 97(6): 1066-1074.
TURNER, B.L. & HARBORNE, J.B. 1967. Distribution of canavanine in the plant kingdom. Phytochemistry 6(6): 863-866.
UDEDIBIE, A.B.I. & CARLINI, C.R. 1998a. Crack and cook: A simple and quick process for elimination of concanavalin a (Con A) from Canavalia seeds. Animal Feed Science and Technology 74(2): 179-184.
UDEDIBIE, A.B.I. & CARLINI, C.R. 1998b. Questions and answers to edibility problem of the Canavalia ensiformis seeds - A review. Animal Feed Science and Technology 74(2): 95-106.
UDEDIBIE, A.B.I., ESONU, B.O., OBAJI, C.N. & DURUNNA, C.S. 1994. Dry urea treatment prior to toasting as a method of improving the nutritive value of jackbeans (Canavalia ensiformis) for broilers. Animal Feed Science and Technology 48(3-4): 335-345.
UMOREN, U.E., TEWE, O.O., BOKANGA, M. & JACKAI, L.E.N. 1997. Protein quality of raw and autoclaved cowpeas: Comparison between some insect resistant and susceptible varieties. Plant Foods for Human Nutrition 50(4): 301-315.
USDA 2010. National nutrient database for standard reference, U.S. Department of Agriculture, Agricultural Research Service. Nutrient Data Laboratory Home Page, http://www.ars.usda.gov/ba/bhnrc/ndl
UZOGARA, S.G. & OFUYA, Z.M. 1992. Processing and utilization of cowpeas in developing countries - A review. Journal of Food Processing and Preservation 16(2): 105-147.
VAN MAN, N. & WIKTORSSON, H. 2002. Effect of molasses on nutritional quality of cassava and Gliricidia tops silage. Asian-Australasian Journal of Animal Sciences 15(9): 1294-1299.
VASUPEN, K., YUANGKLANG, C., WONGSUTHAVAS, S., SRENANUL, P., MITCHAOTHAI, J. & BEYNEN, A.C. 2008. Macronutrient digestibility in Kadon pigs fed diets with isonitrogenous amounts of various carbohydrate sources. Tropical Animal Health and Production 40(4): 249-253.
VDLUFA. 1993. Die chemische Untersuchung von Futtermitteln. In: Handbuch der Landwirtschaftlichen Versuchs- und Untersuchungsmethodik (VDLUFA-Methodenbuch), Vol. III. VDLUFA-Verlag Darmstadt , Germany.
VERBRUGGEN, M.A., BELDMAN, G., VORAGEN, A.G.J. & HOLLEMANS, M. 1993. Water-unextractable cell-wall material from sorghum - Isolation and characterization. Journal of Cereal Science 17(1): 71-82.
VETTER, J. 2000. Plant cyanogenic glycosides. Toxicon 38(1): 11-36.

References
148
VIJAYAKUMARI, K., SIDDHURAJU, P., PUGALENTHI, M. & JANARDHANAN, K. 1998. Effect of soaking and heat processing on the levels of antinutrients and digestible proteins in seeds of Vigna aconitifolia and Vigna sinensis. Food Chemistry 63(2): 259-264.
VIROBEN, G. & MICHELANGELIVARGAS, C. 1997. Determination of canavanine in raw and processed Jack bean seeds. Sciences Des Aliments 17(3): 299-307.
VOIGT, J. & STEGER, H. 1967. Zur quantitativen Bestimmung von Ammoniak, Harnstoff und Ketokörpern in biologischem Material mit Hilfe eines modifizierten Mikrodiffusionsgefäßes. Archiv für Tierernährung 17: 289.
VYNNYTSKA, B.O., MAYEVSKA, O.M., KURLISHCHUK, Y.V., BOBAK, Y.P. & STASYK, O.V. 2011. Canavanine augments proapoptotic effects of arginine deprivation in cultured human cancer cells. Anti-Cancer Drugs 22(2): 148-157.
WANG, H.F., CHEN, Y., ZHAO, Y.N., LIU, H.Y., LIU, J.X., MAKKAR, H.P.S. & BECKER, K. 2011. Effects of replacing soybean meal by detoxified Jatropha curcas kernel meal in the diet of growing pigs on their growth, serum biochemical parameters and visceral organs. Animal Feed Science and Technology 170(1-2): 141-146.
WANG, S., DONG, S., ZHANG, R., SHAO, H. & LIU, Y. 2014. Effects of proanthocyanidins on porcine pancreatic lipase: Conformation, activity, kinetics and thermodynamics. Process Biochemistry 49(2): 237-243.
WEIGAND, E. & KIRCHGESSNER, M. 1980. Protein and energy value of vinasse for pigs. Animal Feed Science and Technology 5(3): 221-231.
WEISSBACH, F. 1967. Die Bestimmung der Pufferkapazität der Futterpflanzen und ihre Bedeutung für die Beurteilung der Vergärbarkeit. Akademie der Landwirtschaftswissenschaften der DDR 92: 211-220.
WEISSBACH, F. 2011. The future of forage conservation Proceedings of the “II International Symposium on Forage Quality and Conservation” November 16-19th,, University of Sao Paulo, Brazil 319-363.
WILKINSON, J.M. & DAVIES, D.R. 2013. The aerobic stability of silage: Key findings and recent developments. Grass and Forage Science 68(1): 1-19.
WOOLFORD, M.K. 1984. The silage fermentation. Marcel Dekker, New York, USA. XANDE, X., REGNIER, C., ARCHIMEDE, H., BOCAGE, B., NOBLET, J. &
RENAUDEAU, D. 2010. Nutritional values of sugarcane products in local Caribbean growing pigs. Animal 4(5): 745-754.
YADAV, H., JAIN, S. & SINHA, P.R. 2007. Production of free fatty acids and conjugated linoleic acid in problotic dahi containing Lactobacillus acidophilus and Lactobacillus casei during fermentation and storage. International Dairy Journal 17(8): 1006-1010.
YAN-BING, L. & NISHINO, N. 2012. Microbial communities and aerobic stability of whole crop corn and wilted Italian ryegrass silage inoculated with and without Lactobacillus rhamnosus or Lactobacillus buchneri. XVI International Silage Conference, Hämeenlinna, Finland, 342-343.
YAN, Q.Y. & BENNICK, A. 1995. Identification of histatins as tannin-binding proteins in human saliva. Biochemical Journal 311: 341-347.
YANG, Y.L., BUCK, G.A. & WIDMER, G. 2010. Cell sorting-assisted microarray profiling of host cell response to Cryptosporidium parvum infection. Infection and Immunity 78(3): 1040-1048.

References
149
YIN, Y.L., HUANG, R.L., ZHANG, H.Y., CHEN, C.M., LI, T.J. & PAN, Y.F. 1993. Nutritive-Value of Feedstuffs and Diets for Pigs .1. Chemical-Composition, Apparent Ileal and Fecal Digestibilities. Animal Feed Science and Technology 44(1-2): 1-27.
YIN, Y.L., HUANG, R.L., ZHONG, H.Y., LI, T.J., SOUFFRANT, W.B. & DE LANGE, C.F.M. 2002. Evaluation of mobile nylon bag technique for determining apparent ileal digestibilities of protein and amino acids in growing pigs. Journal of Animal Science 80(2): 409-420.
YOUNES, M. & STRUBELT, O. 1988. Cyanide-induced injury to the isolated perfused rat liver. Pharmacology & Toxicology 63(5): 382-385.
ZAMORA, A.F. & FIELDS, M.L. 1979. Nutritive quality of fermented cowpeas (Vigna sinensis) and Chickpeas (Cicer arietinum). Journal of Food Science 44(1): 234-236.
ZAMORA, N.C. 2003. Effect of extrusion on the activity of antinutritional factors and in vitro digestibility of protein and starch in flours of Canavalia ensiformis. Archivos Latinoamericanos De Nutricion 53(3): 293-298.
ZHANG, G., SUN, J., WANG, H. & NG, T.B. 2010. First isolation and characterization of a novel lectin with potent antitumor activity from a Russula mushroom. Phytomedicine 17(10): 775-781.
ZIERENBERG, B. 2000. In vitro Methode zur Beurteilung der Fermentationsleistung von Milchsäurebakterien und deren Einfluss auf die Stoffwechselaktivität weiterer für die Silierung relevanter Mikroorganismen bei unterschiedlichen Fermentationsbedingungen. PhD, University of Rostock, Germany.

Table index
10 Table index
Table 1: Chemical composition of the leaves of selected trees, shrubs and aquatic
plants ..................................................................................................................... 5
Table 2: Chemical composition of raw Jack bean seeds (Canavalia ensiformis [L.]
DC) ........................................................................................................................ 8
Table 3: Chemical composition of raw cowpea seeds (Vigna unguiculata [L.] Walp) ............ 9
Table 4: Chemical composition of sorghum seeds (Sorghum bicolor [L.] Moench) ............. 10
Table 5: Treatments used in the Rostock Fermentation Test.............................................. 33
Table 6: Treatments used for silages of remoistened grains of Jack bean and cowpea...... 34
Table 7: Experimental design of the soaking trial with Jack bean and cowpea grains
(n=4)..................................................................................................................... 35
Table 8: Treatments used for silages of soaked grains of Jack bean and cowpea .............. 37
Table 9: Composition of diets (g·kg-1 DM) used in the experiments for determination of
ileal digestibility .................................................................................................... 40
Table 10: Composition of diets (g·kg-1 DM) used in the experiment for determination of
fecal digestibility ................................................................................................... 42
Table 11: Selected chemical parameters of Jack bean, cowpea and sorghum grains .......... 54
Table 12: Content of water soluble carbohydrates and buffering capacity, their ratio and
the content of starch of Jack bean, cowpea and sorghum grains .......................... 54
Table 13: Fermentation parameters of different treatments with cowpea in filtrates of
RFT after 38 h incubation (n=3) ............................................................................ 56
Table 14: Fermentation parameters of different treatments with Jack bean in filtrates of
RFT after 38 h incubation (n=3) ............................................................................ 57
Table 15: Influence of storage time and treatment on dry matter, pH and fermentation
losses of ensiled remoistened Jack bean grains sole or mixed with sorghum
(n=3)..................................................................................................................... 58
Table 16: Influence of storage time and treatment on dry matter, pH and fermentation
losses of ensiled remoistened cowpea grains sole or mixed with sorghum
(n=3)..................................................................................................................... 59
Table 17: Fermentation products in model silages of remoistened Jack bean grains
after 60 days of storage (n=3).............................................................................. 60
Table 18: Fermentation products in model silages of remoistened cowpea grains after
60 days of storage (n=3) ....................................................................................... 61
Table 19: Trypsin inhibitory activity (mg TI·g-1 DM) in silages of remoistened Jack bean
and cowpea sole or mixed with sorghum (n=3) ..................................................... 62
Table index
Table 20: Hydrogen cyanide (mg·100 g-1 DM) in silages of remoistened Jack bean or
cowpea sole or mixed with sorghum (n=3) ........................................................... 63
Table 21: Canavanine (g·100 g-1 DM) in silages of remoistened Jack bean sole or
mixed with sorghum (n=3) .................................................................................... 63
Table 22: Effect of soaking time and grain:water ratio (w/v) on buffering capacity, dry
matter, crude protein and ash in Jack bean grains (n=3) ...................................... 64
Table 23: Effect of soaking time and grain:water ratio (w/v) on buffering capacity, dry
matter, crude protein and ash in cowpea (n=3) ..................................................... 65
Table 24: Content of selected minerals in raw and soaked beans after different soaking
treatments (n=4) ................................................................................................... 66
Table 25: Selected chemical characteristics of soaked (24 h at 1:4 [w/v) Jack bean
and cowpea grains sole or mixed with sorghum used for model silages ............... 67
Table 26: Influence of storage time and treatment on dry matter, pH and fermentation
losses of ensiled soaked Jack bean grains sole or mixed with sorghum (n=3) ...... 67
Table 27: Influence of storage time and treatment on dry matter, pH and fermentation
losses of ensiled soaked cowpea grains sole or mixed with sorghum (n=3).......... 68
Table 28: Fermentation products determined in model silages of soaked jack bean
grains after 60 days of storage (n=3) .................................................................... 69
Table 29: Fermentation products determined in model silages of soaked cowpea grains
after 60 days of storage (n=3)............................................................................... 70
Table 30: Ammonia production (% NH3-N/Ntotal) in model silages with soaked grains
after 60 days of storage (n=3)............................................................................... 71
Table 31: Trypsin inhibitory activity (mg TI·g-1 DM) in four silage treatments of soaked
Jack bean and cowpea sole or mixed with sorghum during three storage
periods (n=3) ........................................................................................................ 71
Table 32: Hydrogen cyanide (mg·100 g-1 DM) in four silage treatments of soaked Jack
bean and cowpea sole or mixed with sorghum during three storage periods
(n=3)..................................................................................................................... 72
Table 33: Canavanine (g·100 g-1 DM) in four silage treatments of soaked jack bean
sole or mixed with sorghum during three storage periods (n=3) ............................ 73
Table 34: Effect of illumination regime and germination time on dry matter, water
soluble carbohydrates and crude protein in Jack bean (n=3) ................................ 74
Table 35: Effect of illumination regime and germination time on dry matter, water
soluble carbohydrates and crude protein in cowpea (n=3) .................................... 75
Table 36: Influence of storage time and treatment on dry matter, pH and losses of
ensiled pre-germinated Jack bean sole or mixed with sorghum (n=3) ................... 76

Table index
Table 37: Influence of storage time and treatment on dry matter, pH and losses of
ensiled pre-germinated cowpea sole or mixed with sorghum (n=3) ...................... 77
Table 38: Fermentation products determined in model silages of pre-germinated Jack
bean grains after 60 days of storage (n=3) ........................................................... 78
Table 39: Fermentation products determined in model silages of pre-germinated
cowpea grains after 60 days of storage (n=3) ....................................................... 79
Table 40: Ammonia production (% NH3-N/Ntotal) in model silages with pre-germinated
beans after 60 days of storage (n=3) .................................................................... 79
Table 41: Effect of illumination regime and pre-germination time on trypsin inhibitory
activity and canavanine in Jack bean and cowpea (n=3) ...................................... 80
Table 42: Trypsin inhibitory activity (mg TI·g-1 DM) in four silage treatments of pre-
germinated Jack bean and cowpea grains sole or mixed with sorghum during
three storage periods (n=3) .................................................................................. 81
Table 43: Hydrogen cyanide (mg·100g-1 DM) in four silage treatments of pre-
germinated Jack bean and cowpea grains sole or mixed with sorghum (n=3) ...... 82
Table 44: Canavanine (g·100 g-1 DM) in four silage treatments of pre-germinated Jack
bean grains sole or mixed with sorghum during three storage periods (n=3) ........ 83
Table 45: Chemical composition of feedstuffs under evaluation in the feeding trials ............. 84
Table 46: Chemical composition of ensiled and not ensiled legume-sorghum mixtures
under evaluation in the feeding trials .................................................................... 85
Table 47: Selected fermentation parameters of legume-sorghum silages used in the
feeding trials after 60 days storage (n=3) ............................................................. 85
Table 48: Changes in selected variables before and after the aerobic stability test in
silages prepared for feeding trials ......................................................................... 87
Table 49: Amino acid composition of not ensiled feedstuffs used in the feeding trials .......... 87
Table 50: Amino acid composition of ensiled and not ensiled Jack bean-sorghum and
cowpea-sorghum mixtures used in the feeding trials ............................................ 88
Table 51: Content of selected anti-nutritional factors of ensiled or not ensiled legume-
sorghum mixtures used in the feeding trials .......................................................... 89
Table 52: Content of deoxynivalenol in raw grains and mixed silages used in the
feeding trials with pigs .......................................................................................... 90
Table 53: Standardized ileal digestibilities (%) of N and essential amino acids of raw or
ensiled cowpea-sorghum mixture ......................................................................... 90
Table 54: Apparent fecal digestibilities (%) of selected nutrients of raw or ensiled
cowpea-sorghum mixture ..................................................................................... 91

Table index
Table 55: Source of variation in fermentation parameters after 60 days storage in Jack
bean and cowpea model silages using a model with pre-ensiling treatment,
grain type, additive and sorghum inclusion as fixed effects................................. 103
Table 56: Source of variation in anti-nutritional factors in Jack bean and cowpea model
silages using a model with pre-ensiling treatment, treatment and storage time
as fixed effects ................................................................................................... 108
Table 57: Losses and gains of amino acids comparing raw and ensiled mixtures of
cowpea or Jack bean with sorghum .................................................................... 110

Figure index
11 Figure index
Figure 1: The food commodity price indices in the monthly international prices of
major food commodities from January 1990 to April 2011 (FAO, 2011) ................ 6
Figure 2: World production of sorghum grains between 2000 and 2009 (FAOSTAT,
2010a) ................................................................................................................ 11
Figure 3: Chemical structure of canavanine and arginine .................................................. 14
Figure 4: Simultaneous (I) and sequential (II) mechanisms for the catabolism of
cyanogenic disaccharides (Poulton, 1990) ......................................................... 17
Figure 5: Structures of pentagalloylglucopyranose (A, gallotannin) and trigalloyl-
HHDP-glucopyranose (B, ellagitannin) (Salminen et al., 1999) ........................... 19
Figure 6: Basic structure of proanthocyanidins. R1=H, R2=H: propelargonidins; R1=H,
R2=OH: procyanidins; R1=OH, R2=OH: prodelphinidins (Santos-Buelga &
Scalbert (2000)) ................................................................................................. 19
Figure 7: Scheme of lactic acid production from starch as substrate (Reddy et al.,
2008) .................................................................................................................. 27
Figure 8: Change of pH during Rostock Fermentation Test for cowpea grains sole or
mixed with sorghum (n=3) .................................................................................. 55
Figure 9: Change of pH during Rostock Fermentation Test for Jack bean grains sole
or mixed with sorghum (n=3) .............................................................................. 56
Figure 10: Temperature rise of Jack bean and cowpea silages mixed with sorghum
used for feeding trials (n=4) ................................................................................ 86
Figure 11: Dry matter content in grain model silages sole or mixed with sorghum after
60 days of storage submitted to different pre-ensiling treatments and
additives (n=3) ................................................................................................... 97
Figure 12: Losses in grain model silages sole or mixed with sorghum after 60 days of
storage submitted to different pre-ensiling treatments and additives (n=3) ......... 98
Figure 13: The pH in grain model silages sole or mixed with sorghum after 60 days of
storage submitted to different pre-ensiling treatments and additives (n=3) ......... 99
Figure 14: Lactic acid content in grain model silages sole or mixed with sorghum after
60 days of storage submitted to different pre-ensiling treatments and
additives (n=3) ................................................................................................. 100
Figure 15: Ethanol content in grain model silages sole or mixed with sorghum after 60
days of storage submitted to different pre-ensiling treatments and additives
(n=3) ................................................................................................................ 101

Figure index
Figure 16: Trypsin inhibitory activity (TIA) measured after 5, 20 and 60 days of storage
in four model silage treatments of Jack bean and cowpea after three pre-
ensiling treatments (n=3) .................................................................................. 104
Figure 17: Hydrogen cyanide content after 5, 20 and 60 days of storage in four model
silage treatments of Jack bean and cowpea after three pre-ensiling
treatments (n=3) ............................................................................................... 106
Figure 18: Canavanine content measured after 5, 20 and 60 days of storage in four
model silage treatments of Jack bean after three pre-ensiling treatments
(n=3) ................................................................................................................ 107
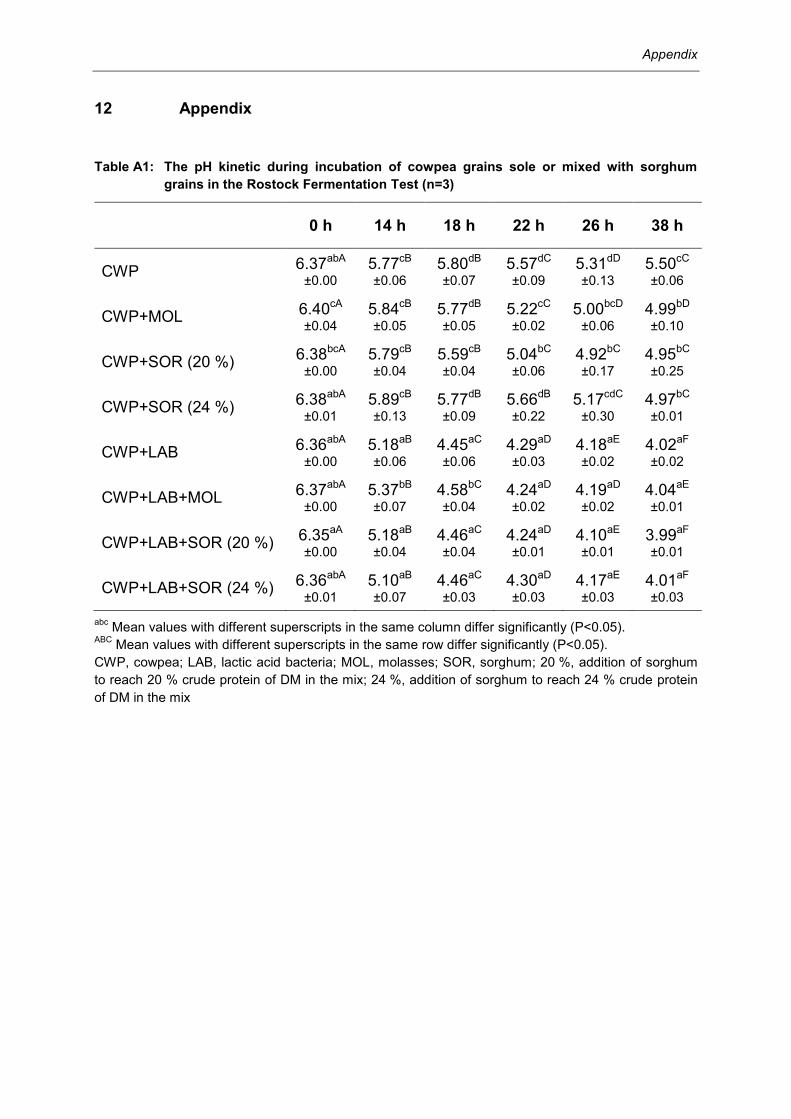
Appendix
12 Appendix
Table A1: The pH kinetic during incubation of cowpea grains sole or mixed with sorghum
grains in the Rostock Fermentation Test (n=3)
0 h 14 h 18 h 22 h 26 h 38 h
CWP 6.37abA
±0.00 5.77cB
±0.06 5.80dB
±0.07 5.57dC
±0.09 5.31dD
±0.13 5.50cC
±0.06
CWP+MOL 6.40cA
±0.04 5.84cB
±0.05 5.77dB
±0.05 5.22cC
±0.02 5.00bcD
±0.06 4.99bD
±0.10
CWP+SOR (20 %) 6.38bcA
±0.00 5.79cB
±0.04 5.59cB
±0.04 5.04bC
±0.06 4.92bC
±0.17 4.95bC
±0.25
CWP+SOR (24 %) 6.38abA
±0.01 5.89cB
±0.13 5.77dB
±0.09 5.66dB
±0.22 5.17cdC
±0.30 4.97bC
±0.01
CWP+LAB 6.36abA
±0.00 5.18aB
±0.06 4.45aC
±0.06 4.29aD
±0.03 4.18aE
±0.02 4.02aF
±0.02
CWP+LAB+MOL 6.37abA
±0.00 5.37bB
±0.07 4.58bC
±0.04 4.24aD
±0.02 4.19aD
±0.02 4.04aE
±0.01
CWP+LAB+SOR (20 %) 6.35aA
±0.00 5.18aB
±0.04 4.46aC
±0.04 4.24aD
±0.01 4.10aE
±0.01 3.99aF
±0.01
CWP+LAB+SOR (24 %) 6.36abA
±0.01 5.10aB
±0.07 4.46aC
±0.03 4.30aD
±0.03 4.17aE
±0.03 4.01aF
±0.03
abc Mean values with different superscripts in the same column differ significantly (P<0.05).
ABC Mean values with different superscripts in the same row differ significantly (P<0.05).
CWP, cowpea; LAB, lactic acid bacteria; MOL, molasses; SOR, sorghum; 20 %, addition of sorghum
to reach 20 % crude protein of DM in the mix; 24 %, addition of sorghum to reach 24 % crude protein
of DM in the mix

Appendix
Table A2: The pH kinetic during incubation of Jack bean grains sole or mixed with sorghum
grains in the Rostock Fermentation Test (n=3)
0 h 14 h 18 h 22 h 26 h 38 h
JBN 6.10cA
±0.01 5.99dAB
±0.02 5.73dB
±0.04 5.15dC
±0.30 4.89cCD
±0.29 4.62D
±0.20
JBN+MOL 6.14fA
±0.00 6.02dA
±0.01 5.73dA
±0.22 5.10dB
±0.49 4.77bcB
C ±0.31
4.51C
±0.25
JBN+SOR (20 %) 6.13eA
±0.00 5.91cB
±0.04 5.55cC
±0.04 4.99cdD
±0.07 4.58abE
±0.04 4.50F
±0.04
JBN+SOR (24 %) 6.11dA
±0.00 5.99dB
±0.01 5.73dC
±0.03 5.28dD
±0.05 4.78bcE
±0.02 4.56F
±0.01
JBN+LAB 6.07aA
±0.01 5.93cB
±0.01 5.51cC
±0.02 4.89bcdD
±0.05 4.63abcE
±0.02 4.51F
±0.02
JBN+LAB+MOL 6.09bA
±0.00 5.92cB
±0.03 5.43cC
±0.08 4.65abcD
±0.06 4.43aE
±0.02 4.35F
±0.00
JBN+LAB+SOR (20 %) 6.11cdA
±0.01 5.74aB
±0.03 4.91aC
±0.02 4.48aD
±0.02 4.43aE
±0.01 4.33F
±0.01
JBN+LAB+SOR (24 %) 6.10cA
±0.00 5.78bB
±0.03 5.07bC
±0.01 4.58abD
±0.02 4.44aE
±0.01 4.37F
±0.01
abc Mean values with different superscripts in the same column differ significantly (P<0.05).
ABC Mean values with different superscripts in the same row differ significantly (P<0.05).
JBN, Jack bean; LAB, lactic acid bacteria; MOL, molasses; SOR, sorghum; 20 %, addition of sorghum
to reach 20 % crude protein of DM in the mix; 24 %, addition of sorghum to reach 24 % crude protein
of DM in the mix

Table A3: Differences (P<0.05) in silage dry matter content using a model with pre-treatment, legume grain, additives and sorghum inclusion as fixed effects
MOR PRG SOK
JBN CWP JBN CWP JBN CWP
-SOR +SOR -SOR +SOR -SOR +SOR -SOR +SOR -SOR +SOR -SOR +SOR
1 2 3 4 1 2 3 4 1 2 3 4 1 2 3 4 1 2 3 4 1 2 3 4 1 2 3 4 1 2 3 4 1 2 3 4 1 2 3 4 1 2 3 4 1 2 3 4
MOR
JBN
-SOR
1
*
2
*
3
*
4
*
+SOR
1
* *
2
3
4
CWP
-SOR
1
2
3
4
+SOR
1
* *
2
3
4
SOK
JBN
-SOR
1 * * * * *
2
* * * *
3
* * *
4
* * * *
+SOR
1
* * * * *
2
3
* * *
4
* * * *
CWP
-SOR
1
* * *
2
* *
3
*
4
* * *
+SOR
1
* * * * *
2
3
* *
4
* * * *

Table A3 (continued)
MOR PRG SOK
JBN CWP JBN CWP JBN CWP
-SOR +SOR -SOR +SOR -SOR +SOR -SOR +SOR -SOR +SOR -SOR +SOR
1 2 3 4 1 2 3 4 1 2 3 4 1 2 3 4 1 2 3 4 1 2 3 4 1 2 3 4 1 2 3 4 1 2 3 4 1 2 3 4 1 2 3 4 1 2 3 4
PRG
JBN
-SOR
1 * * * *
2
* * *
3
*
4
* * * *
+SOR
1
* * * *
2
* * *
3
* * *
4
* * *
CWP
-SOR
1
*
2
*
3
4
*
+SOR
1
* * *
2
* * *
3
*
4
* * *
* Significant difference for P<0.05.
Treatments: 1, control; 2, molasses; 3, lactic acid bacteria; 4, molasses and lactic acid bacteria
CWP, cowpea; JBN, Jack bean; MOR, moisture reconstituted; PRG, pre-germinated; SOK, soaked; -SOR, without the addition of sorghum; +SOR, with sorghum in the mix

Table A5: Differences (P<0.05) in silage pH value using a model with pre-treatment, legume grain, additives and sorghum inclusion as fixed effects
MOR PRG SOK
JBN CWP JBN CWP JBN CWP
-SOR +SOR -SOR +SOR -SOR +SOR -SOR +SOR -SOR +SOR -SOR +SOR
1 2 3 4 1 2 3 4 1 2 3 4 1 2 3 4 1 2 3 4 1 2 3 4 1 2 3 4 1 2 3 4 1 2 3 4 1 2 3 4 1 2 3 4 1 2 3 4
MOR
JBN
-SOR
1
* *
2
* *
3
4
*
+SOR
1
* * * *
2
*
3
4
*
CWP
-SOR
1
* *
2
*
3
4
*
+SOR
1
* * *
2
* *
3
4
*
SOK
JBN
-SOR
1 * * * * *
2
* *
3
* * *
4
*
+SOR
1
* * * * *
2
3
*
4
CWP
-SOR
1
* * *
2
* *
3
4
*
+SOR
1
* *
2
3
4

Table A5 (continued)
MOR PRG SOK
JBN CWP JBN CWP JBN CWP
-SOR +SOR -SOR +SOR -SOR +SOR -SOR +SOR -SOR +SOR -SOR +SOR
1 2 3 4 1 2 3 4 1 2 3 4 1 2 3 4 1 2 3 4 1 2 3 4 1 2 3 4 1 2 3 4 1 2 3 4 1 2 3 4 1 2 3 4 1 2 3 4
PRG
JBN
-SOR
1
* *
2
* *
3
4
* *
+SOR
1
* *
2
*
3
*
4
*
CWP
-SOR
1
*
2
*
3
4
*
+SOR
1
* *
2
* *
3
4
*
* Significant difference for P<0.05.
Treatments: 1, control; 2, molasses; 3, lactic acid bacteria; 4, molasses and lactic acid bacteria
CWP, cowpea; JBN, Jack bean; MOR, moisture reconstituted; PRG, pre-germinated; SOK, soaked; -SOR, without the addition of sorghum; +SOR, with sorghum in the mix

Table A6: Differences (P<0.05) in silage lactic acid content using a model with pre-treatment, legume grain, additives and sorghum inclusion as fixed effects
Lactic acid as
MOR PRG SOK
JBN CWP JBN CWP JBN CWP
-SOR +SOR -SOR +SOR -SOR +SOR -SOR +SOR -SOR +SOR -SOR +SOR
1 2 3 4 1 2 3 4 1 2 3 4 1 2 3 4 1 2 3 4 1 2 3 4 1 2 3 4 1 2 3 4 1 2 3 4 1 2 3 4 1 2 3 4 1 2 3 4
MOR
JBN
-SOR
1
* * *
2
* *
3
4
*
+SOR
1 * * * *
2
* *
3
*
4
* * *
CWP
-SOR
1
* *
2
*
3
4
* *
+SOR
1
* * * *
2
* *
3
*
4
* *
SOK
JBN
-SOR
1 * * * * *
2
* * * *
3
* * *
4
* * *
+SOR
1
* * * * *
2
3
* * *
4
* * *
CWP
-SOR
1
* * * *
2
* *
3
*
4
*
+SOR
1
* * * *
2
3
*
4
* * * *

Table A6 (continued)
MOR PRG SOK
JBN CWP JBN CWP JBN CWP
-SOR +SOR -SOR +SOR -SOR +SOR -SOR +SOR -SOR +SOR -SOR +SOR
1 2 3 4 1 2 3 4 1 2 3 4 1 2 3 4 1 2 3 4 1 2 3 4 1 2 3 4 1 2 3 4 1 2 3 4 1 2 3 4 1 2 3 4 1 2 3 4
PRG
JBN
-SOR
1 * * *
2
* *
3
4
* * *
+SOR
1
* * * *
2
* * *
3
*
4
* * *
CWP
-SOR
1
2
*
3
4
+SOR
1
*
2
* *
3
*
4
*
* Significant difference for P<0.05.
Treatments: 1, control; 2, molasses; 3, lactic acid bacteria; 4, molasses and lactic acid bacteria
CWP, cowpea; JBN, Jack bean; MOR, moisture reconstituted; PRG, pre-germinated; SOK, soaked; -SOR, without the addition of sorghum; +SOR, with sorghum in the mix

Table A4: Differences (P<0.05) in silage fermentation losses using a model with pre-treatment, legume grain, additives and sorghum inclusion as fixed effects
MOR PRG SOK
JBN CWP JBN CWP JBN CWP
-SOR +SOR -SOR +SOR -SOR +SOR -SOR +SOR -SOR +SOR -SOR +SOR
1 2 3 4 1 2 3 4 1 2 3 4 1 2 3 4 1 2 3 4 1 2 3 4 1 2 3 4 1 2 3 4 1 2 3 4 1 2 3 4 1 2 3 4 1 2 3 4
MOR
JBN
-SOR
1
*
2
* *
3
4
+SOR
1
*
2
* *
3
4
CWP
-SOR
1
2
3
4
*
+SOR
1
* * *
2
* *
3
4
*
SOK
JBN
-SOR
1
* *
2
*
3
*
4
+SOR
1
*
2
3
* *
4
* *
CWP
-SOR
1
* * *
2
* *
3
*
4
* *
+SOR
1
* * *
2
3
* *
4
*

Table A4 (continued)
MOR PRG SOK
JBN CWP JBN CWP JBN CWP
-SOR +SOR -SOR +SOR -SOR +SOR -SOR +SOR -SOR +SOR -SOR +SOR
1 2 3 4 1 2 3 4 1 2 3 4 1 2 3 4 1 2 3 4 1 2 3 4 1 2 3 4 1 2 3 4 1 2 3 4 1 2 3 4 1 2 3 4 1 2 3 4
PRG
JBN
-SOR
1
*
2
* *
3
*
4
*
+SOR
1
* * *
2
*
3
*
4
* *
CWP
-SOR
1
*
2
*
3
4
*
+SOR
1
* *
2
*
3
*
4
*
* Significant difference for P<0.05.
Treatments: 1, control; 2, molasses; 3, lactic acid bacteria; 4, molasses and lactic acid bacteria
CWP, cowpea; JBN, Jack bean; MOR, moisture reconstituted; PRG, pre-germinated; SOK, soaked; -SOR, without the addition of sorghum; +SOR, with sorghum in the mix

Table A7: Differences (P<0.05) in silage ethanol content using a model with pre-treatment, legume grain, additives and sorghum inclusion as fixed effects
MOR PRG SOK
JBN CWP JBN CWP JBN CWP
-SOR +SOR -SOR +SOR -SOR +SOR -SOR +SOR -SOR +SOR -SOR +SOR
1 2 3 4 1 2 3 4 1 2 3 4 1 2 3 4 1 2 3 4 1 2 3 4 1 2 3 4 1 2 3 4 1 2 3 4 1 2 3 4 1 2 3 4 1 2 3 4
MOR
JBN
-SOR
1
* * * *
2
*
3
4
+SOR
1 * * * *
2
3
4
*
CWP
-SOR
1
* *
2
*
3
4
*
+SOR
1
* * * *
2
3
4
*
SOK
JBN
-SOR
1
*
2
* *
3
* *
4
* * *
+SOR
1
* * * * *
2
3
* *
4
* *
CWP
-SOR
1
* *
2
3
4
+SOR
1
*
2
3
4

Table A7 (continued)
MOR PRG SOK
JBN CWP JBN CWP JBN CWP
-SOR +SOR -SOR +SOR -SOR +SOR -SOR +SOR -SOR +SOR -SOR +SOR
1 2 3 4 1 2 3 4 1 2 3 4 1 2 3 4 1 2 3 4 1 2 3 4 1 2 3 4 1 2 3 4 1 2 3 4 1 2 3 4 1 2 3 4 1 2 3 4
PRG
JBN
-SOR
1
* *
2
* *
3
*
4
*
+SOR
1
* * * *
2
*
3
*
4
* *
CWP
-SOR
1
* *
2
3
4
*
+SOR
1
* *
2
*
3
4
*
* Significant difference for P<0.05.
Treatments: 1, control; 2, molasses; 3, lactic acid bacteria; 4, molasses and lactic acid bacteria
CWP, cowpea; JBN, Jack bean; MOR, moisture reconstituted; PRG, pre-germinated; SOK, soaked; -SOR, without the addition of sorghum; +SOR, with sorghum in the mix

Table A10: Differences (P<0.05) in HCN content of Jack bean silages using a model with pre-ensiling treatment, treatment and storage time as fixed effects
MOR PRG SOK
LAB MOL+LAB SOR+LAB SOR+MOL+LAB LAB MOL+LAB SOR+LAB SOR+MOL+LAB LAB MOL+LAB SOR+LAB SOR+MOL+LAB
0 60 0 60 0 60 0 60 0 60 0 60 0 60 0 60 0 60 0 60 0 60 0 60
MO
R
LA
B 0
60 *
MO
L+
LA
B
0
60 * *
SO
R+
LA
B
0 * *
60 * * *
SO
R+
MO
L+
LA
B
0 * *
60 * * *
SO
K
LA
B 0 * *
60 * * *
MO
L+
LA
B
0 * *
60 * * *
SO
R+
LA
B
0 * * * *
60 * * * * *
SO
R+
MO
L+
LA
B
0 * * * *
60 * * * * *

Table A10 (continued)
MOR PRG SOK
LAB MOL+LAB SOR+LAB SOR+MOL+LAB LAB MOL+LAB SOR+LAB SOR+MOL+LAB LAB MOL+LAB SOR+LAB SOR+MOL+LAB
0 60 0 60 0 60 0 60 0 60 0 60 0 60 0 60 0 60 0 60 0 60 0 60
PR
G
LA
B 0
60 * *
MO
L+
LA
B
0
60 * * *
SO
R+
LA
B
0 * *
60 * * *
SO
R+
MO
L+
LA
B
0 * *
60 * * * *
* Significant difference for P<0.05.
LAB, lactic acid bacteria; MOL, molasses; MOR, moisture reconstituted; PRG, pre-germinated; SOK, soaked; SOR, sorghum
0, day 0 before ensiling; 60, day 60 of storage

Table A11: Differences (P<0.05) in HCN content of cowpea silages using a model with pre-ensiling treatment, treatment and storage time as fixed effects
MOR PRG SOK
LAB MOL+LAB SOR+LAB SOR+MOL+LAB LAB MOL+LAB SOR+LAB SOR+MOL+LAB LAB MOL+LAB SOR+LAB SOR+MOL+LAB
0 60 0 60 0 60 0 60 0 60 0 60 0 60 0 60 0 60 0 60 0 60 0 60
MO
R
LA
B 0
60 *
MO
L+
LA
B
0
60 *
SO
R+
LA
B
0
60 * * *
SO
R+
MO
L+
LA
B
0
60 * * *
SO
K
LA
B 0 * *
60 * * *
MO
L+
LA
B
0 * *
60 * * *
SO
R+
LA
B
0 * *
60 * * * * *
SO
R+
MO
L+
LA
B
0 * *
60 * * * * *

Table A11 (continued)
MOR PRG
LAB MOL+LAB SOR+LAB SOR+MOL+LAB LAB MOL+LAB SOR+LAB SOR+MOL+LAB LAB MOL+LAB SOR+LAB SOR+MOL+LAB
0 60 0 60 0 60 0 60 0 60 0 60 0 60 0 60 0 60 0 60 0 60 0 60
PR
G
LA
B 0
60 * *
MO
L+
LA
B
0
60 * *
SO
R+
LA
B
0
60 * * * *
SO
R+
MO
L+
LA
B
0
60 * * *
* Significant difference for P<0.05.
LAB, lactic acid bacteria; MOL, molasses; MOR, moisture reconstituted; PRG, pre-germinated; SOK, soaked; SOR, sorghum
0, day 0 before ensiling; 60, day 60 of storage

Table A8: Differences (P<0.05) in TIA of Jack bean silages using a model with pre-ensiling treatment, treatment and storage time as fixed effects
MOR PRG SOK
LAB MOL+LAB SOR+LAB SOR+MOL+LAB LAB MOL+LAB SOR+LAB SOR+MOL+LAB LAB MOL+LAB SOR+LAB SOR+MOL+LAB
0 5 20 60 0 5 20 60 0 5 20 60 0 5 20 60 0 5 20 60 0 5 20 60 0 5 20 60 0 5 20 60 0 5 20 60 0 5 20 60 0 5 20 60 0 5 20 60
MO
R
LA
B
0
5 * 20 * 60 *
MO
L+
LA
B 0
5
* *
20
* *
60
* *
SO
R+
LA
B 0 * *
5
* * *
20
* * *
60
* * *
SO
R+
MO
L+
LA
B
0 * *
5
* * *
20
* * * *
60
* * *
SO
K
LA
B
0 * * 5
* *
20
* * 60
* * * *
MO
L+
LA
B 0
* *
5
* *
20
* * *
60
* * * *
SO
R+
LA
B 0
* *
5
* *
20
* * * *
60
* * * * *
SO
R+
MO
L+
LA
B
0
* *
5
* * *
20
* * *
60
* * *

Table A8 (continued)
MOR PRG SOK
LAB MOL+LAB SOR+LAB SOR+MOL+LAB LAB MOL+LAB SOR+LAB SOR+MOL+LAB LAB MOL+LAB SOR+LAB SOR+MOL+LAB 0 5 20 60 0 5 20 60 0 5 20 60 0 5 20 60 0 5 20 60 0 5 20 60 0 5 20 60 0 5 20 60 0 5 20 60 0 5 20 60 0 5 20 60 0 5 20 60
PR
G
LA
B
0
5
* *
20
* * *
60
* * *
MO
L+
LA
B 0
5
*
20
* *
60
* *
SO
R+
LA
B 0
* *
5
* * *
20
* * *
60
* * * * *
SO
R+
MO
L+
LA
B 0
* *
5
* * *
20
* *
60
* * * *
* Significant difference for P<0.05.
LAB, lactic acid bacteria; MOL, molasses; MOR, moisture reconstituted; PRG, pre-germinated; SOK, soaked; SOR, sorghum
0, day 0 before ensiling; 5, day 5 of storage; 20, day 20 of storage; 60, day 60 of storage

Table A9: Differences (P<0.05) in TIA of cowpea silages using a model with pre-ensiling treatment, treatment and storage time as fixed effects
MOR PRG SOK
LAB MOL+LAB SOR+LAB SOR+MOL+LAB LAB MOL+LAB SOR+LAB SOR+MOL+LAB LAB MOL+LAB SOR+LAB SOR+MOL+LAB
0 5 20 60 0 5 20 60 0 5 20 60 0 5 20 60 0 5 20 60 0 5 20 60 0 5 20 60 0 5 20 60 0 5 20 60 0 5 20 60 0 5 20 60 0 5 20 60
MO
R
LA
B
0
5 * 20 * * 60 * *
MO
L+
LA
B 0
5
*
20
* *
60
* *
SO
R+
LA
B 0 * *
5
* * *
20
* * *
60
*
SO
R+
MO
L+
LA
B 0 * *
5
* * *
20
* * *
60
*
SO
K
LA
B
0 * * 5
*
20
60
*
MO
L+
LA
B 0
* *
5
20
60
* *
SO
R+
LA
B 0
* *
5
*
20
60
SO
R+
MO
L+
LA
B 0
* *
5
*
20
60

Table A9 (continued)
MOR PRG SOK LAB MOL+LAB SOR+LAB SOR+MOL+LAB LAB MOL+LAB SOR+LAB SOR+MOL+LAB LAB MOL+LAB SOR+LAB SOR+MOL+LAB
0 5 20 60 0 5 20 60 0 5 20 60 0 5 20 60 0 5 20 60 0 5 20 60 0 5 20 60 0 5 20 60 0 5 20 60 0 5 20 60 0 5 20 60 0 5 20 60
PR
G
LA
B
0
5
*
20
*
60
* *
MO
L+
LA
B 0
5
*
20
*
60
* *
SO
R+
LA
B 0
* *
5
* * *
20
* *
60
*
SO
R+
MO
L+
LA
B 0
* *
5
* * *
20
* *
60
*
* Significant difference for P<0.05.
LAB, lactic acid bacteria; MOL, molasses; MOR, moisture reconstituted; PRG, pre-germinated; SOK, soaked; SOR, sorghum
0, day 0 before ensiling; 5, day 5 of storage; 20, day 20 of storage; 60, day 60 of storage

Table A12: Differences (P<0.05) in canavanine content of Jack bean silages using a model with pre-ensiling treatment, treatment and storage time as fixed effects
MOR PRG SOK
LAB MOL+LAB SOR+LAB SOR+MOL+LAB LAB MOL+LAB SOR+LAB SOR+MOL+LAB LAB MOL+LAB SOR+LAB SOR+MOL+LAB
0 5 20 60 0 5 20 60 0 5 20 60 0 5 20 60 0 5 20 60 0 5 20 60 0 5 20 60 0 5 20 60 0 5 20 60 0 5 20 60 0 5 20 60 0 5 20 60
MO
R
LA
B
0
5
20
60
MO
L+
LA
B 0
5
20
60
SO
R+
LA
B 0 * *
5
* *
20
* *
60
* *
SO
R+
MO
L+
LA
B
0 * *
5
* *
20
* *
60
* *
SO
K
LA
B
0
5
20
60
MO
L+
LA
B 0
5
20
60
SO
R+
LA
B 0
* *
5
* *
20
* *
60
* *
SO
R+
MO
L+
LA
B
0
* *
5
* *
20
* *
60
* *

Table A12 (continued) MOR PRG SOK
LAB MOL+LAB SOR+LAB SOR+MOL+LAB LAB MOL+LAB SOR+LAB SOR+MOL+LAB LAB MOL+LAB SOR+LAB SOR+MOL+LAB
0 5 20 60 0 5 20 60 0 5 20 60 0 5 20 60 0 5 20 60 0 5 20 60 0 5 20 60 0 5 20 60 0 5 20 60 0 5 20 60 0 5 20 60 0 5 20 60
PR
G
LA
B
0
5
20
60
MO
L+
LA
B 0
5
20
60
SO
R+
LA
B 0
* *
5
* *
20
* *
60
* *
SO
R+
MO
L+
LA
B 0
* *
5
* *
20
* *
60
*
* Significant difference for P<0.05.
LAB, lactic acid bacteria; MOL, molasses; MOR, moisture reconstituted; PRG, pre-germinated; SOK, soaked; SOR, sorghum
0, day 0 before ensiling; 5, day 5 of storage; 20, day 20 of storage; 60, day 60 of storage

Selbstständigkeitserklärung
Erklärung
Hiermit erkläre ich, dass ich die vorliegende Dissertation selbstständig und ohne
fremde Hilfe verfasst, nur die von mir angegebenen Quellen und Hilfsmittel genutzt
und die den verwendeten Werken wörtlich oder inhaltlich entnommenen Stellen als
solche kenntlich gemacht habe.
Rostock, im September 2014

Acknowledgement
Acknowledgement
I could not imagine that this would be the most difficult chapter to write. I could fill
pages with the names of people that in one way or another supported me in bringing
this thesis to the end.
In first place, I would like to express my infinite gratitude to my former advisers
Dr. Francisco Diaz Casas† (Pancho) and Dr. Leandro Marrero Suarez for leading me
through the exciting universe of knowledge and science. I enjoyed every second you
let me take part in your scientific discussions and I appreciate all the support,
patience and advises you passed on me. You were the first to encourage me in
starting this project and helped me in making it better in our frequent brainstorming
meetings. Thanks to Dr. Andres Castro Alegría for continuing what they started.
I am grateful to Prof. Martin Gabel for offering me the opportunity to start my doctoral
studies at the Chair for Nutrition Physiology and Animal Nutrition, University of
Rostock and to Dr. Edda Sandmann and Dr. Wolfgang Hackl for their selfless help.
I also thank Prof. Annette Zeyner for allowing me to continue my PhD study and
research and for assuming my tutorship. Her guidance helped me in all the time of
research and writing of this thesis.
The support of Prof. Ellen Kienzle and Prof. Sven Dänicke in completing special lab
analysis was of great value. Thanks go as well to Prof. Norbert Reinsch, Dr. Gerd
Nürnberg and especially to Dr. Armin Tuchscherer for the immeasurable support in
the statistical processing of the data.
I appreciate all the support I got from Sabine Bremer, Diana Gall and Margitta Beck
in completing my chemical analysis. Thanks go as well to Dr. Kirsten Büsing, Heike
Riese and Heino Marx for the assistance with the animal experiments. My German
was a mess, so was your Spanish language, but seemed to work in the end. I want to
thank Helga Strehlow and Anja Kofahl for making me feel at home. Thanks to the rest
of the staff of the professorship for their encouraging words, they were of good help.
I acknowledge my colleagues at the Centro de Investigaciones Agropecuarias and
experimental stations (Universidad Central de Las Villas) for their technical support
and many others that helped with planting, keeping, harvesting and transporting the
plant material used in the experiments. We all know how hard those activities in our
conditions are. Especially I would like to mention Dora Quintana† for showing me the
shortcuts in the techniques of chemical analysis of feedstuffs and for being a friend.
I want to thank my parents and sisters for their unconditional love. Even when I was
far apart from you, I could feel you pushing in my back. As well, I want to express my
sincere gratitude to my wife. Only we both know how much love, healing words and
support from your side were necessary to keep me in one piece and get the power to
bring this project to the end.

Theses
Theses
“Ensilage of Jack bean and cowpea grains sole or mixed with sorghum to
improve their nutritional value as feedstuff for growing-finishing pigs”
submitted by Dipl. vet. med. Luis Alberto González Díaz
Research objectives
1. Due to the high prices of feedstuffs in the world market, local and profitable
solutions should be suggested to recover the weakened swine husbandry in
tropical developing countries, especially Cuba.
2. Until today, alternative strategies had failed in offering a feedstuff able to cover all
the animals´ requirements. The protein content remains as the limiting nutrient,
which requires supplementation with synthetic amino acids or other conventional
sources. Furthermore, alternative feedstuffs often have low dry matter contents,
which hinders their conservation and storage as drying is expensive.
3. Because of a high nutritional quality, native legume grains like Jack bean (JBN)
and cowpea (CWP) and cereal grains like sorghum (SOR) are reliable
ingredients in integral rations for pigs. A necessary condition is that most of the
relevant anti-nutritional factors (ANF) present in those grains must be deactivated
or at least reduced.
4. In contrast to the storage of air-dry grains, lactic acid fermentation in silages of
JBN and CWP sole or mixed with SOR can contribute not only to prevent losses
during storage (e.g. plagues and diseases) provoked by the high humidity and
temperature in the tropics. Moreover, ensilage can contribute to increase the
nutritional value of grains and additionally it has a beneficial effect on the
reduction of ANF.
5. As is known, the low content of water soluble carbohydrates and the generally
high buffering capacity of legumes lower their ensilability. Pre-ensiling treatments
like pre-germination and soaking are assumed to have a positive effect by
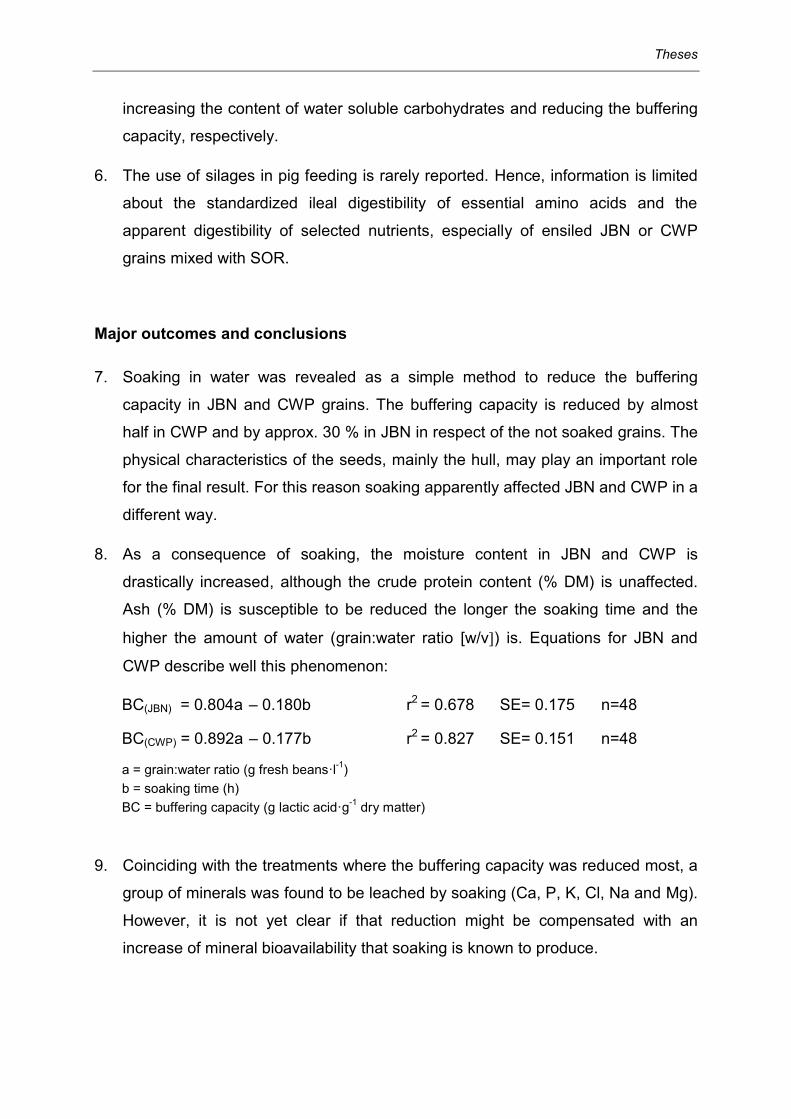
Theses
increasing the content of water soluble carbohydrates and reducing the buffering
capacity, respectively.
6. The use of silages in pig feeding is rarely reported. Hence, information is limited
about the standardized ileal digestibility of essential amino acids and the
apparent digestibility of selected nutrients, especially of ensiled JBN or CWP
grains mixed with SOR.
Major outcomes and conclusions
7. Soaking in water was revealed as a simple method to reduce the buffering
capacity in JBN and CWP grains. The buffering capacity is reduced by almost
half in CWP and by approx. 30 % in JBN in respect of the not soaked grains. The
physical characteristics of the seeds, mainly the hull, may play an important role
for the final result. For this reason soaking apparently affected JBN and CWP in a
different way.
8. As a consequence of soaking, the moisture content in JBN and CWP is
drastically increased, although the crude protein content (% DM) is unaffected.
Ash (% DM) is susceptible to be reduced the longer the soaking time and the
higher the amount of water (grain:water ratio [w/v) is. Equations for JBN and
CWP describe well this phenomenon:
BC(JBN) = 0.804a – 0.180b r2 = 0.678 SE= 0.175 n=48
BC(CWP) = 0.892a – 0.177b r2 = 0.827 SE= 0.151 n=48
a = grain:water ratio (g fresh beans·l-1
)
b = soaking time (h)
BC = buffering capacity (g lactic acid·g-1
dry matter)
9. Coinciding with the treatments where the buffering capacity was reduced most, a
group of minerals was found to be leached by soaking (Ca, P, K, Cl, Na and Mg).
However, it is not yet clear if that reduction might be compensated with an
increase of mineral bioavailability that soaking is known to produce.

Theses
10. Pre-germination produces an increase (P<0.05) of the content of water soluble
carbohydrates of 25 % in JBN and 321 % in CWP after 96 and 72 h, respectively.
Therefore, pre-germination represents an alternative to the addition of a readily
available source of water soluble carbohydrates like molasses, when legume
grains like JBN and CWP are conserved by ensiling. The illumination regime
during germination does not play a significant role in the final quantity of water
soluble carbohydrates.
11. An expected reduction of canavanine, one of the major ANF in JBN with the
highest influence on feed intake depression, was not observed in this study.
There was no accordance with the literature that claimed pre-germination a
means of reducing canavanine and that this effect is more visible under light
regime. On the other hand, in model silages (ROMOS) with soaked JBN,
canavanine was reduced as the storage time was prolonged. Outstanding was
the treatment JBN+SOR+MOL+LAB (Jack bean mixed with sorghum and
addition of molasses and a lactic acid bacteria inoculant) with a reduction of
approx. 55 % after 60 days of storage compared with the corresponding not
ensiled raw mixture. The question remains why in the same silage treatment
when scaled up for the animal feeding trial, the content of canavanine remained
on the same level after ensiling. It is assumed that the different storage
conditions of the ton silages and ROMOS had an influence.
12. Of the analyzed ANF, the trypsin inhibitory activity (TIA) was the most susceptible
to be reduced by ensiling. As storage time was prolonged from 5 to 20 and 60
days the lowest TIA was observed in CWP. In moisture reconstituted (65 % DM)
silages and those with pre-germinated grains TIA was reduced by 72 to 80 %
compared with not ensiled material. The treatment CWP+SOR+MOL+LAB
(cowpea mixed with sorghum and addition of molasses and a lactic acid bacteria
inoculant) showed the lowest TIA after 60 days. In JBN, remoistened silages
showed the highest reduction (44 %) of TIA already after 5 days for
JBN+MOL+LAB. In pre-germinated JBN silages TIA reduction was never higher
than 30 % and even not altered in silages mixed with sorghum. In soaked JBN
silages TIA increased, whereas the treatment JBN+SOR+MOL+LAB showed the
lowest increase (18 %).

Theses
13. The reasons why JBN containing diets produce a poor animal performance are
still controversial as pigs reject diets containing JBN even after deactivation of
ANF took place. Presumably a low palatability is given higher priority rather than
the later effects ANF produce in the animal. However, taste masking had failed in
solving the problem. The content of HCN has as well been associated to feed
intake depression, principally due to its bitter taste. In this work, there was the
belief ensiling could be a way to reduce HCN and to improve palatability.
Unfortunately, in the case of CWP the HCN content was higher for every
evaluated treatment after ensiling. In JBN silages, HCN was reduced by approx.
17 % in the treatment JBN+LAB (Jack bean with addition of a lactic acid bacteria
inoculant) in moisture reconstituted (65 % DM) silages and by approx. 41 % in
JBN+MOL+LAB (Jack bean with addition of molasses and a lactic acid bacteria
inoculant) in pre-germinated silages. The addition of SOR increased HCN by 10 -
25 %. Only in JBN+SOR+MOL+LAB (pre-germinated JBN) HCN was slightly
reduced (5 %).
14. A taste masking effect, that lactic acid fermentation is expected to have, did not
occur when JBN grains were ensiled, as animals under experiment refused to eat
the diets containing JBN silages. Further studies should aim at finding the
reasons for the low palatability of JBN.
15. Ensiling contributes to an increased standardized ileal digestibility for essential
amino acids, although only for methionine a higher digestibility (increased by
24 %, P<0.05) compared to the corresponding raw mixture was observed, for
which the reduction of ANF due to the ensiling process might be among the
reasons. Still remains unclear why ensiling affected the digestibility of amino
acids differently, as for example the standardized ileal digestibility of cystine
seemed to be unaffected.
16. Ensiling a mixture of soaked CWP and SOR with the addition of molasses and a
lactic acid bacteria inoculant increases (P<0.05) the apparent digestibility of
crude ash, as well as of AEE and ADFOM, whereas the digestibility of the organic
matter and crude protein remains fairly unaffected. Contradictory seems to be the
fact that the digestibility of NDFOM was reduced after ensiling. This might be

Theses
explained by the hydrolysis of hemicelluloses that took place during ensiling,
which correspond to the high digestible fiber fraction in pigs.
17. Both pre-ensiling treatments, soaking and pre-germination, can be seen as time-
consuming and work-intensive in addition to what is already laborious itself, the
ensiling process. Nevertheless, this is compensated by a rather simple
technology and a low demand for infrastructure what makes the pre-ensiling
treatments accessible to producers of all levels, what together with ensiling is a
cost-effective alternative to the expensive and high energy-consuming
conserving methods offered by the market.
Future outlook
18. In order to understand better how soaking affects the buffering capacity, other
variables like pH, temperature and hardness of the water should be considered.
As the available sources of water around the world have different physical
characteristics, the variation produced by these parameters would affect the
accuracy of the equations to predict the buffering capacity after soaking.
19. It is a concern to study the leaching effect soaking produces on minerals,
although soaking water could be recycled as drinking water, so that leached
minerals will be recovered. Further experiments should be conducted to
understand how soaking transforms the bioavailability of minerals. Already some
hints are given, as ensiling soaked CWP mixed with SOR improved the apparent
digestibility of crude ash by approx. 48 % compared to the raw mixture.
20. The deactivation of selected ANF during pre-ensiling treatments or ensilage
correlated to the time the grains were pre-treated or silages were stored. As the
content of some ANF remained almost unaltered (canavanine in JBN) or even
increased (HCN in CWP), the effect of longer pre-ensiling and/or storage time on
the deactivation of these ANF might broaden the knowledge about the influence
of ensiling.
21. Many of the decomposition products of ANF are well described in the literature.
These substances can produce an anti-nutritive effect on the animal that in some

Theses
cases might be different to the effect of the original ANF. However, it is still
unclear if the same decomposition products were formed during ensiling than
described for other deactivation methods, which requires further experiments.
22. It was not possible to clarify why the aerobic stability of JBN+SOR silage
prepared for animal trials was higher compared to CWP+SOR silage. As both
silages showed a rather similar fermentation pattern, unidentified factors present
in JBN or formed during ensiling could be an explanation. Therefore, the possible
role certain ANF play in the aerobic stability, especially those ones in JBN that
were not significantly affected by ensiling like canavanine, should be studied.