enso–cave drip water hydrochemical relationship: a 7-year dataset
TRANSCRIPT

Hydrol. Earth Syst. Sci., 20, 4625–4640, 2016www.hydrol-earth-syst-sci.net/20/4625/2016/doi:10.5194/hess-20-4625-2016© Author(s) 2016. CC Attribution 3.0 License.
ENSO–cave drip water hydrochemical relationship:a 7-year dataset from south-eastern AustraliaCarol V. Tadros1,2, Pauline C. Treble1,2, Andy Baker2, Ian Fairchild3,4, Stuart Hankin1, Regina Roach5,Monika Markowska1,2, and Janece McDonald6
1Australian Nuclear Science and Technology Organisation, Locked Bag 2001, Kirrawee DC, NSW 2232, Australia2Connected Waters Initiative Research Centre, UNSW Australia, Kensington NSW 2052, Australia3School of Geography, Earth and Environmental Sciences, University of Birmingham, Edgbaston, Birmingham, UK4Birmingham Institute for Forest Research, University of Birmingham, Edgbaston, Birmingham, UK5NSW National Parks and Wildlife Service, Sydney, NSW, Australia6Environmental and Climate Change Research Group, School of Environmental and Life Sciences, University of Newcastle,Callaghan, NSW 2308, Australia
Correspondence to: Carol V. Tadros ([email protected])
Received: 28 April 2016 – Published in Hydrol. Earth Syst. Sci. Discuss.: 2 June 2016Revised: 20 October 2016 – Accepted: 25 October 2016 – Published: 17 November 2016
Abstract. Speleothems (cave deposits), used for palaeoen-vironmental reconstructions, are deposited from cave dripwater. Differentiating climate and karst processes within adrip-water signal is fundamental for the correct identificationof palaeoenvironmental proxies and ultimately their interpre-tation within speleothem records. We investigate the poten-tial use of trace element and stable oxygen-isotope (δ18O)variations in cave drip water as palaeorainfall proxies in anAustralian alpine karst site. This paper presents the first ex-tensive hydrochemical and δ18O dataset from Harrie WoodCave, in the Snowy Mountains, south-eastern (SE) Australia.Using a 7-year long rainfall δ18O and drip-water Ca, Cl,Mg /Ca, Sr /Ca and δ18O datasets from three drip sites,we determined that the processes of mixing, dilution, flowpath change, carbonate mineral dissolution and prior cal-cite precipitation (PCP) accounted for the observed varia-tions in the drip-water geochemical composition. We iden-tify that the three monitored drip sites are fed by fractureflow from a well-mixed epikarst storage reservoir, suppliedby variable concentrations of dissolved ions from soil andbedrock dissolution. We constrained the influence of multi-ple processes and controls on drip-water composition in aregion dominated by El Niño–Southern Oscillation (ENSO).During the El Niño and dry periods, enhanced PCP, a flowpath change and dissolution due to increased soil CO2 pro-duction occurred in response to warmer than average tem-
peratures in contrast to the La Niña phase, where dilutiondominated and reduced PCP were observed. We present aconceptual model, illustrating the key processes impactingthe drip-water chemistry. We identified a robust relation-ship between ENSO and drip-water trace element concentra-tions and propose that variations in speleothem Mg /Ca andSr /Ca ratios may be interpreted to reflect palaeorainfall con-ditions. These findings inform palaeorainfall reconstructionfrom speleothems regionally and provide a basis for palaeo-climate studies globally, in regions where there is intermit-tent recharge variability.
1 Introduction
The El Niño–Southern Oscillation (ENSO) is the leadingmode of rainfall variation in south-eastern (SE) Australia(Dai et al., 1997), where extreme events of rainfall variabil-ity, such as droughts, floods, bush fires and cyclones asso-ciated with ENSO, are prominent (Risbey et al., 2009). Se-vere drought between 2001 and 2008 and enhanced El Niñoconditions resulted in record low inflows from the alpineheadwaters of the Murray River (Murphy and Timbrel, 2008;Cai and Cowan, 2008; Nicholls, 2010), strongly impactingthe water resource availability of the Murray–Darling basinand agricultural production, affecting the livelihood of ur-
Published by Copernicus Publications on behalf of the European Geosciences Union.

4626 C. V. Tadros et al.: ENSO–cave drip water hydrochemical relationship
ban and rural Australians (Barros and Bowden, 2008; Mc-Gowan et al., 2009). Reconstructing past ENSO variabilityfrom speleothems (calcium carbonate cave deposits) locatedwithin the Yarrangobilly Caves system in the Snowy Moun-tains alpine region will provide a basis for understandingfuture regional impacts, therefore assisting with water re-source management policy making and the global impactsthat ENSO-driven climate variability has on the environ-ment, agricultural production, water resources, ecosystemsas well as on human life, emergency management and dis-ease (Power and Smith, 2007).
Studies have shown that trace element time series con-structed from the central growth axis of a speleothem pro-vide potential proxy evidence of palaeorainfall conditions(Roberts et al., 1998; Lauritzen et al., 1999; Fairchild etal., 2001; Johnson et al., 2006; Cruz et al., 2007; Jo et al.,2010). The concentration of trace elements in drip water isdependent on the evolution of the drip-water geochemistry,which is influenced by site-specific characteristics (Spötl etal., 2005) and a range of surface and karst processes (Bal-dini et al., 2006). Elements may be atmospherically de-rived from meteoric precipitation (P), dust supply (Goedeet al., 1998; Dredge et al., 2013), marine aerosols (Baker etal., 2000; Fairchild et al., 2000), volcanic eruption activity(Frisia et al., 2005, 2008), atmospheric pollutants (Spötl etal., 2005; Wynn et al., 2008), the host rock and soil (Toothand Fairchild, 2003). Surface processes: deforestation (Bor-sato et al., 2007) and fire (Coleborn et al., 2016; Nagra etal., 2016); soil processes: water–sediment and water–rock in-teraction (Fairchild et al., 2000), colloid, particle or solutemobilization (Hartland et al., 2012), and temperature, wateravailability and CO2 changes (Cuthbert et al., 2014; Rutlidgeet al., 2014; Treble et al., 2016); and karst hydrological pro-cesses: hydrological flow routes, mixing and dilution effects,degassing and calcite precipitation, differential and incongru-ent dissolution, and selective leaching (Fairchild et al., 2000;Tooth and Fairchild, 2003) potentially modulate the concen-tration of elements in the drip water. Constraining these pro-cesses and understanding potential climatic signals in the hy-drochemistry of drip water is quintessential in successfullyusing trace elements as a palaeoclimate proxy (Fairchild etal., 2006).
As such, long-term datasets of stable oxygen-isotope(δ18O) and geochemistry (trace element concentrations andratios) of rainfall and cave drip water provide an empiricalbasis for identifying factors influencing trace element vari-ability ultimately recorded in speleothems (Baldini et al.,2002; Treble et al., 2003; Riechelmann et al., 2011; Oster etal., 2012; Frappier, 2013; Partin et al., 2013). For example,McDonald et al. (2004) demonstrated Mg /Ca and Sr /Caratios in the drip water doubled in response to an El Niñoevent that occurred during a 2.5-year baseline monitoringstudy at Wombeyan Caves, SE Australia. This was an im-portant finding that raised the potential for using speleothemrecords to reconstruct past ENSO variability for this region.
The Wombeyan Caves site lies in the Sydney catchment.The study site used here lies ∼ 85 km away in the head-waters of the Murray–Darling basin and as such providesan opportunity to further examine the ENSO signal in cavedrip water at a second site from this region, with a longerdataset. Additionally, the interpretation of this new hydro-chemical dataset is conducted within an established frame-work. The dominant controls on precipitation stable isotopevariability in this alpine region have been examined. Callowet al. (2014) conducted event-based δ18O precipitation (rain-fall and snow) sampling across 18 sites (n= 70; from Febru-ary 2010 to March 2012) from a transect in the Snowy Moun-tains; they determined that the origin of moisture, pathwayand terrain effects were the dominant controls on precipita-tion stable isotope variability in this alpine region. Further-more, the unsaturated zone hydrology of our studied cavehas been investigated. Markowska et al. (2015) presentedrainfall, soil moisture saturation and drip discharge data at14 sites within the same cave studied here, between Octo-ber 2011 and January 2013. Markowska et al. (2015) applieda statistical approach to classify the drip types and identifiedfive flow regimes, which were represented using a combinedconceptual flow and box hydrological model.
The emphasis of this study is to understand the relation-ship between modern climatic and environmental controls onthe cave drip water in a region strongly influenced by ENSO,to aid in the interpretation of speleothem-based palaeoenvi-ronmental records and ultimately to develop climate proxyrecords from suitable speleothems (Tooth and Fairchild,2003). Here we present the first comprehensive climate anddrip water monitoring study, which commenced at three dripsites in 2006, in Harrie Wood Cave (Yarrangobilly, NewSouth Wales, Australia). This record encapsulated the last3 years of the “Millennium Drought” (1997–2009), whichhad a large impact across SE Australia (CSIRO and BoM,2015) and the 2010/2011 La Niña event, which producedwidespread flooding across SE Australia (CSIRO and BoM,2015). Within this framework, spanning 7 years, we em-ployed the results to ascertain the key hydrological processesthat control the drip hydrochemistry during La Niña and ElNiño events and categorized the flow regime. Our findingsform the basis for palaeoclimate interpretation of speleothemtrace element and δ18O records located within the Yarrango-billy Caves system and are pertinent for speleothem palaeo-climate research in other ENSO-dominated regions globally.
2 Study area
2.1 Study site and climate
Harrie Wood Cave (35◦44′ S, 148◦30′ E) is located in a lime-stone belt ca. 14 km long and 1.5 km wide along the Yarran-gobilly River in the north of Kosciuszko National Park,New South Wales, Australia (Fig. 1a). The Yarrangobilly
Hydrol. Earth Syst. Sci., 20, 4625–4640, 2016 www.hydrol-earth-syst-sci.net/20/4625/2016/

C. V. Tadros et al.: ENSO–cave drip water hydrochemical relationship 4627
Figure 1. (a) Location of Harrie Wood Cave, Snowy Mountains, Australia. (b) Survey map of the Harrie Wood Cave system (adapted fromNicholl, 1974) showing location of the three drip-water sites (HW1–3), which have been monitored since 2006, the location of automaticdrip counters underneath 14 drip sites reported by Markowska et al. (2015), and overlayed is the location of the weather station and StevensHydra Probe® soil sensors. (c) Site monthly mean air temperature (◦C) (2006–2013), precipitation (mm) (1983–2013) and ET; the sum oftranspiration and soil evaporation (1967–1990; parameter FWE (m day−1) compiled by the WaterDyn model, from the Australian WaterAvailability Project (AWAP) database; Raupach et al., 2009, 2011).
Limestone formed in the upper Silurian period from a coralreef (Worboys, 1982). Harrie Wood Cave is located withinthe Yarrangobilly Caves system, which includes over 250independent limestone caves that began to develop in the
Pleistocene (Worboys, 1982). Harrie Wood Cave is hostedwithin a highly fractured hard massive limestone and thedrip sites are in close proximity to a fracture contact zone.The host limestone bedrock contains red/brown palaeokarst
www.hydrol-earth-syst-sci.net/20/4625/2016/ Hydrol. Earth Syst. Sci., 20, 4625–4640, 2016

4628 C. V. Tadros et al.: ENSO–cave drip water hydrochemical relationship
features and little to no dolomite. The cave entrance is ca.965 m above sea level (a.s.l.) on a north-dipping steep rockygorge. Harrie Wood is a restricted access, medium-sizedsouth-dipping cave. The cave chamber is 80± 2 m in lengthand 34± 1 m deep (Nicholl, 1974).
Surrounding vegetation consists of open snow gum (Eu-calyptus pauciflora subsp. Pauciflora) and black sallee (E.stelullata) woodland dominated by a snow grass (Poasieberi) understorey (Aplin et al., 2010). Above the cave,vegetation coverage is sparsely developed on shallow rockysoil that lacks clearly defined horizons, and are dominated byangular clasts (typically 2–10 cm size) indicating mechanicalweathering processes. The surface over the cave was burntby an intense wildfire in 2003 and the shrubby vegetationthat is present over the cave shows evidence of regenerationpost-fire (Coleborn, 2016). There is no evidence of a distinctzone of infiltration on the surface directly above and upslopeof Harrie Wood Cave. There is also no evidence of surfacerunoff following rain events. We interpret from our field ob-servations that infiltration is via pervasive cracks and fissures.
The Yarrangobilly Caves system is part of the AustralianAlps bioregion and is dominated by a montane climate (Sternet al., 2000), being characterized by mild dry summers andcold wet winters (Fig. 1c). The median annual rainfall at theBureau of Meteorology (BoM) weather station at Yarrango-billy Caves (BoM station 72141), calculated using the clima-tological median 1985–2013, is 1178± 29 mm with a win-ter maximum of 349± 15 mm. The two dominant synopticweather categories delivering most of this cool-season rain-fall to SE Australia are cut-off low-pressure systems out ofthe westerlies and systems from the mid-latitudes includingmid-latitude storms and fronts (Chubb et al., 2011; Pook etal., 2014; Callow et al., 2014). Modelled total evapotranspi-ration (ET) is maximum in summer and minimum in winter,and mean annual ET is 838± 40 mm over the period 1961–1990. The site has a mean annual temperature of 10.5 ◦C,with mean maximum temperatures in January and mean min-imum temperatures in July of 27.8 and−1.8 ◦C, respectively.The growing season is limited by cold winter temperatures.
2.2 Drip site setting
The three drip-water monitoring sites (HW1–3) in this studyare measured from active stalactites (Table 1) located cen-trally within the cave (Fig. 1b) at a depth of 38 m to the sur-face. HW1 and 2 were feeding actively forming stalagmitesca. 0.5 m apart on either side of the main path. These sta-lagmites were removed for palaeoclimate studies in 2006. Inorder to remove HW2, a small adjacent calcite column thathad formed from a fused stalactite–stalagmite pair ca. 10–15 cm from HW2 (see Supplement S1 for photograph), hadto be removed also. This resulted in re-invigoration of thedrip point that had formed the column, which we included inour sampling program and refer to here as HW3.
Table 1. Summary of the drip-point characteristics for the monitor-ing sites.
Site Description
HW1 The tip of the 1 m long massive stalactite (130 mm wide)was broken, presumably when the path was constructedin ∼ 1911 CE. A 7 cm long soda-straw stalactite hasformed from the base of the massive stalactite anddrips onto a 14 cm tall and 8 cm wide stalagmitedeveloped on a flowstone on pebble ground.The stalagmite was removed in 2006.
HW2 Drip emanates from a 1 m long, 110 mm wide stalactite.The 160 mm by 70 mm stalagmite was removed in 2006.HW2 is an overflow of HW3 (see Supplement S1and Sect. 5.1 for further discussion).
HW3 Drip point formed when stalagmite from site HW2was removed.
Unsaturated zone hydrology of Harrie Wood Cave has re-cently been characterized (Markowska et al., 2015) and 5drip-water regimes were identified. All flow types are fed bya theoretical soil storage and epikarst storage reservoir byfracture/fissure drainage. The five discharge flow types areas follows. Type 1 is designated mixed-flow/storage connec-tivity (low flow/high flow). Water at these discharge points isdrained from a bulk homogenized epikarst storage reservoir.At the high-flow sub-type, during periods of water excess, theepikarst store is bypassed and water is routed directly fromthe soil storage reservoir. At the low-flow sub-type, dischargeis from a pocket reservoir with a variable head within theepikarst storage reservoir. With Type 2 extreme events acti-vated drip sites, a large intense infiltration event is required toinitiate flow from the epikarst store. Type 3 are overflow sites,with discharge at the drip point fed by overflow from thepocket reservoir. Type 4 are non-linear flow sites; based onintra-karst dynamics, flow is intermittent between both stor-age reservoirs. Type 5 are underflow sites; during high infil-tration, discharge is preferential underflow where both reser-voirs are bypassed, and during base-flow conditions flow issourced from the epikarst store. The sampling points in thisstudy, HW1–3, are situated within the transect monitored byMarkowska et al. (2015) (Fig. 1b).
3 Methods
3.1 Meteorological data
Daily rainfall was measured from the BoM standard 203 mmrain gauge at 09:00 local time (LT) each morning. Providedprecipitation was 2 mm or greater, an aliquot of this precip-itation was collected in a 10 mL amber bottle, ensuring zeroheadspace, and stored for stable isotope analysis (δ18O, δ2H).Maximum and minimum air temperatures are also recordedat 09:00 LT using BoM standard procedures.
Hydrol. Earth Syst. Sci., 20, 4625–4640, 2016 www.hydrol-earth-syst-sci.net/20/4625/2016/

C. V. Tadros et al.: ENSO–cave drip water hydrochemical relationship 4629
A network of two automatic weather stations were in-stalled above Harrie Wood and Jillabenan Caves on the14 October 2011 and 6 September 2012, respectively. Atmo-spheric measurements of pressure, humidity, rainfall, temper-ature and wind speed and direction are recorded by a DavisVantage Pro2™. Within the soil zone above each cave sys-tem, soil sensor probes were installed and buried in holesdrilled with an auger to a depth of 25–30 cm at three local-ities (Fig. 1b). The Stevens Hydra Probe® soil sensor mea-surements include temperature, soil moisture and electricalconductivity and complex dielectric permittivity (both cor-rected from 0 to 35 ◦C). All data are recorded every 15 min bya dataTaker DT80 data logger. A detailed description of theparameters measured by the various instrumentation and dataavailable from the network are outlined in Supplement S2.
3.2 Geochemistry
Drip water analysed for this study was collected approxi-mately fortnightly over the period July 2006 to December2013 (n= 468). The drip rate was measured manually asthe time interval elapsed between two drips recorded using astopwatch and the drips emanating from the stalactites accu-mulated in 1 L HDPE containers. Since March 2011 and sam-ple volume permitting, in situ field measurements of elec-trical conductivity (referred to 25 ◦C; ±1 %), temperature(±0.1 ◦C) and pH measurements (±0.01 pH) were made us-ing a TPH1-MyronL TechPro II handheld meter, which wascalibrated using buffer solutions that were kept at cave tem-perature.
At each drip site, aliquots from the bulk water sample werecollected and filtered through a mixed cellulose ester 0.45 µmfilter and split into (i) two clean 50 mL polypropylene bottlesfor cation and anion analysis and (ii) a 10 mL amber glassbottle for δ18O and δ2H analysis. On exiting the cave, sam-ples were refrigerated, transported to the laboratory in an in-sulated container and maintained at 4 ◦C until analysis.
Cation and anion analysis was conducted at the Envi-ronmental Research Chemistry Laboratory at the AustralianNuclear Science and Technology Organisation (ANSTO).Cation analysis was carried out on a Varian™ Vista Pro AXICP-AES; prior to analysis aliquots were acidified with 1 %HNO3. Anion analysis was conducted on an un-acidifiedaliquot using a Dionex 600 Instrument with an auto suppres-sor. Analytical error on cation and anion analyses was≤ 5 %.
Representative limestone samples (n= 7) were collectedfrom bedrock exposures above the cave and within HarrieWood Cave. Freshly cleaved samples were dried at 40 ◦Cand powdered using a ROCKLABS® TC-40 tungsten carbideball mill. Then, 0.2 g of sample was microwave digested at180 ◦C for 15 min using aqua regia (HCl /HNO3= 1 : 3) andanalysed by ICP-AES at the Environmental Research Chem-istry Laboratory at ANSTO.
The isotopic composition (δ18O and δ2H) of the rain-fall and drip-water samples were performed on a LGR-
24 d off-axis, integrated cavity output, cavity ringdown massspectrometer at University of New South Wales (UNSW)Australia. δ18O and δ2H values are reported relative to V-SMOW2. Analytical precision for δ18O is 0.17 and 0.6 ‰for δ2H.
3.3 Mixing and prior calcite precipitation calculations
To determine whether the geochemical evolution of thedrip water was principally due to prior calcite precipitation(PCP), the hydrochemistry was assessed based on the ac-cepted mathematical methods after Sinclair et al. (2012) andTremaine and Froelich (2013). First, to compare betweenthe two methods, ln(Sr /Ca) (mmol mol−1) vs. ln(Mg /Ca)(mmol mol−1) ratios in dissolved host bedrock endmem-bers overlayed with the drip-water ratios was graphed. TheMg /Ca and Sr /Ca ratios during the step change in 2007,wet period and high dry-season Ca values were differentiatedfrom the complete dataset to isolate processes affecting thedrip-water chemical evolution during these periods. Then,at each drip site the slopes of the linear regression of theln(Sr /Ca) vs. ln(Mg /Ca) (weight ratio) graph was calcu-lated based on the model suggested by Sinclair et al. (2012),where a slope of 0.709–1.003 is an indicator of water–rockinteractions, i.e. PCP and incongruent dissolution-driven pro-cesses.
4 Results
4.1 Bedrock composition
The Ca concentration and Mg /Ca and Sr /Ca ratios forthe suite of bedrock samples are listed in Table 2. BedrockMg /Ca ratios range from 2.6 to 15.3 mmol mol−1 andSr /Ca ratios lie between 0.03 and 0.32 mmol mol−1. Theselow ratios indicate the host limestone rock above and withinHarrie Wood Cave are a low-Mg calcite type, indicating dia-genesis of the original bedrock material. We observe threegroupings of samples; Ca does not vary significantly be-tween the samples but there is an observed difference in theMg /Ca and Sr /Ca ratios between groups. The ratios forsamples (R7–R10) are similar and there is no difference be-tween colour variations, the limestone conglomerate (R12)has the highest Mg /Ca ratio and the palaeokarst samples(R13, R14) have the lowest Mg /Ca and Sr /Ca ratios.
4.2 Precipitation and infiltration
The observed daily rainfall and monthly cumulative waterbalance (CWB) at the study site and the Southern Oscilla-tion Index (SOI) are shown in Fig. 2. The CWB represents aresidual mass curve to show trends in the cumulative monthlywater budget trends, following the method of Hurst (1951).It is calculated as the cumulative sum of the monthly P–ETanomalies from the climatological mean (1961–1990). The
www.hydrol-earth-syst-sci.net/20/4625/2016/ Hydrol. Earth Syst. Sci., 20, 4625–4640, 2016

4630 C. V. Tadros et al.: ENSO–cave drip water hydrochemical relationship
Table 2. Sample name, sampling location and description, Ca concentration (mol kg−1), Mg /Ca (mmol mol−1) and Sr /Ca (mmol mol−1)ratios in bedrock samples. On the slope above Harrie Wood Cave, representative samples were collected from the soil surface. The outcropabove the cave is located 33 m west of the cave entrance along the path and at the base of the slope. Within the cave, only exposed limestonesurfaces were sampled. Colours of samples are based on a visual comparison with the Munsell® rock-colour chart.
Sample name Sampling location: description, colour Ca Mg /Ca Sr /Ca(mol kg−1) (mmol mol−1) (mmol mol−1)
Slope above Harrie Wood Cave: 21 cm weathered 10.0 11.7 0.27YGB_R7 limestone boulder, very light grey,
contains moderate orange pink patches
YGB_R8Outcrop above Harrie Wood Cave: 10.2 11.5 0.32limestone, greyish black
YGB_R9Harrie Wood Cave, lower chamber: 9.7 9.9 0.23limestone, moderate reddish orange
YGB_R10Harrie Wood Cave, lower chamber: 9.7 8.8 0.24limestone, medium dark grey
YGB_R12Slope above Harrie Wood Cave: limestone, 7.5 15.3 0.18conglomeratic – round very light grey fragmentsover 2 mm, cemented by moderate yellow finer material
YGB_R13 10.3 2.6 0.08
YGB_R13 (duplicate)Inception horizon along bedding plane in outcrop aboveHarrie Wood Cave: palaeokarst, moderate reddish brown 10.2 2.6 0.08
YGB_R14 8.7 3.8 0.03
earlier half of the record overlaps the latter 4 years of the“Millennium Drought”, including SE Australia’s most per-sistent rainfall deficit that occurred between 1997 and 2009(CSIRO and BoM, 2015). Hence, the site experienced below-average rainfall from 2006 to 2009, and for much of thepreceding decade. For example, from May 06 to December06 (Fig. 3a), annual rainfall totals were 52.6 % below themean attributable to a weak El Niño event (BoM, 2015a).The years 2007–2009 were a period of generally dry con-ditions, where the annual total precipitation was on average10.3 % below the 30-year average. There were exceptions ofabove-average monthly rainfall for February and May 2007,November 2007 to April 2008, July 2008 and in April, Julyand September 2009 (Fig. 3b; BoM, 2015b). However, thereduced annual totals until 2010 resulted in a decline in thecalculated cumulative water balance (Fig. 2b).
By contrast, in 2010–2012, average annual rainfall atYarrangobilly Caves (BoM station 72141) was 152, 135 and115 % above the mean for these 3 years, due to the strong2010–2012 La Niña event (BoM, 2015a). The wettest inter-val in our study occurred from July 2010 to March 2011(Figs. 2b and 3c) during which the calculated cumulativewater balance increased (Fig. 2b). The subsequent 6 monthsfrom May to October 2011 were relatively dry (Fig. 3d), fol-lowed by a 5-month period of above-average monthly rainfallfrom November 2011 to March 2012 (Fig. 3e).
Based on measurements of soil moisture saturation be-tween 14 October 2011 and 9 January 2013, Markowska et
al. (2015) interpreted that a daily rainfall threshold range be-tween 13 and 31.4 mm for Harrie Wood Cave was requiredto initiate a discharge response at 14 monitored drip sites.During the drier 2006 to mid-2010 period of our study, therewere 75 such events in total, representing 30 % of total raindays. By contrast, during the wetter mid-2010 to 2014 inter-val, there were 124 events, representing 37 % of rain days.
4.3 Variability of δ18O in precipitation and drip water
Daily rainfall, δ18O, monthly precipitation-weighted mean(PWM), as well as drip-water δ18O, are shown in Fig. 2.The monthly PWM of rain water δ18O values ranges from−13.6 to −2.1 ‰ over the sampling period, with an overallδ18O PWM of −6.9 ‰ of all rainfall events. At Harrie WoodCave, rainfall events greater than 13 mm initiate recharge(Markowska et al., 2015); the δ18O PWM value from theserecharge events (−6.7 ‰) is not significantly different thanthat of all rainfall events. The monthly δ18O PWM valuesshow a large 5–10 ‰ intra-annual variation following thegeneral seasonal trend of depleted isotopic values in win-ter and isotopically enriched values in summer, although thewinter isotopic depletion is much less pronounced in 2008,2009 and 2011. During the dry period prior to mid-2010, thePWM was enriched (−6.2 ‰) compared to the 2010/2012wet period (−6.9 ‰).
With regards to drip water, there is ca. 0.5–1 ‰ variabilityover the observation period, which is largely dampened com-
Hydrol. Earth Syst. Sci., 20, 4625–4640, 2016 www.hydrol-earth-syst-sci.net/20/4625/2016/

C. V. Tadros et al.: ENSO–cave drip water hydrochemical relationship 4631
Figure 2. The combined time series of (a) SOI as a measure of ENSO, (b) daily rainfall (BoM), infiltration corresponding to when rainfallexceeds 13 mm, and cumulative water balance (CWB), (c) daily δ18Orain overlayed with the monthly precipitation-weighted mean (PWM),(d) drip rate, (e) δ18Odripwater, (f) Ca, (g) Mg /Ca, (h) Sr /Ca and (i) Cl at drip site HW1–3. Gaps within a time series indicate no availabledata. The dotted vertical line at July 2010 signifies the onset of the wet period. Blue and red arrows indicate an increase and decreaserespectively. The pink vertical bar highlights the step change due to a flow path change.
Figure 3. Monthly rainfall, minimum temperature (Tmin) and maximum temperature (Tmax) anomalies at Yarrangobilly Caves (BoM sta-tion 72141) during the cave drip-water monitoring study period. The solid line is the result of applying a binomial smoothing, one-passGaussian filter to the monthly data.
www.hydrol-earth-syst-sci.net/20/4625/2016/ Hydrol. Earth Syst. Sci., 20, 4625–4640, 2016

4632 C. V. Tadros et al.: ENSO–cave drip water hydrochemical relationship
Figure 4. Linear fit representing the LMWL for the relationshipbetween δ2H and δ18O in daily precipitation samples (dashed redline) and cave drip water (HW1–3). The solid grey line denotes theposition of the GMWL.
pared to rainfall. Site HW2 had a wider range of δ18O values(−5.4 –−7.7 ‰) than site HW1 (−6.0 –−7.4 ‰) and HW3(−5.7 –−7.9 ‰). The δ18O arithmetic mean values, close tothe PWM (−6.9 ‰), were −6.8± 0.3 ‰ for HW1 and 2 and−6.9± 0.3 ‰ for HW3, suggesting significant mixing of in-filtration events and that evaporation of infiltrating water isnot significant. There is no clear seasonality in drip-waterδ18O, in contrast to the rainfall δ18O, and there appears tobe no simple isotopic response to infiltration of winter rain-fall (Fig. 2). Furthermore, at all sites the mean drip-waterδ18O values are similar prior to mid-2010 during the dry pe-riod compared to the wettest interval between mid-2010 andMarch 2011 (HW1: −6.7 ‰ cf. −7.0 ‰; HW2: −6.6 ‰ cf.−6.9 ‰; and HW3: −6.9 ‰ cf. −6.9 ‰), although there is asubtle trend to lighter δ18O values.
Figure 4 shows δ2H vs. δ18O calculated local meteoric wa-ter line (LMWL; δ2H= (8.11± 0.08)× δ18O+ (15.9± 0.5),n= 415) compared with the global meteoric water line(GMWL; Rozanski et al., 1993). The LMWL intercept isgreater than the GMWL, but is in agreement with the LMWLestablished by Hughes and Crawford (2013) from a 3-yearprecipitation dataset from Big Hill in the Southern Highlands(δD = (8.10± 0.12)× δ18O + (16.3± 0.8); 188 km north-east (NE) of our site, 652 m a.s.l.). Crawford et al. (2013)attributed the high intercept value to a larger contribution ofmoisture recycling from the land surface to the local moisturebudget.
4.4 Drip rates
Drip rates throughout the 7-year period demonstrateirregular multi-annual variations (Fig. 2d). All sites re-mained hydrologically active, with a mean drip rateof 2.2± 0.6, 2.2± 1.7 and 3.5± 1.9× 10⁻³ mL s−1
at site HW1–3 respectively (Table 3). Prior to mid-2010, during the long phase of below average monthlyrainfall and water deficit, a base-flow drip rate of2.1± 0.5× 10⁻³ mL s−1 for HW1, 1.9± 1.4× 10⁻³ mL s−1
for HW2 and 3.1± 1.3× 10⁻³ mL s−1 for HW3 was main-tained, only increasing slightly in response to above-averagemonthly rainfall anomalies during this period (Sect. 4.2),therefore suggesting the drip sites receive flow from astorage reservoir. The increased rise in discharge is oftenonly captured by one fortnightly sampling event, but is oftenpresent at all three sites. During the wettest interval betweenmid-2010 and March 2011, the mean drip rate increased tobetween 2.8 and 4.7× 10⁻³ mL s−1 (Fig. 2d). Site HW2 isa slower dripping site compared to HW1, and HW3 is thefastest dripping stalactite. Drip rates at all three sites aremostly in phase, recording a similar pattern.
4.5 Drip-water chemistry
Concentrations of major cations and anions in the drip-watersamples from the three drip sites are listed in Table 3. Drip-water samples from all three sites represent a Ca–HCO3dominating water type (pH 6.8–8.3) (Drever, 1982); accord-ingly, Ca is the main cation in the drip-water solutions. Themean Ca concentrations observed at drip sites HW1–3 are66.4, 56.4 and 63.0 mg L−1 respectively, and range from 31.1to 84.1 mg L−1. Mean concentrations of other ions are simi-lar across the three drip sites, further supporting that the dripwater is sourced from the same well-mixed storage reservoir.
Time series of Ca, Mg /Ca, Sr /Ca and Cl are shown inFig. 2. Broadly, Ca concentrations are declining from 80 to60 mg L−1 at sites HW1 and 3 from the beginning of thestudy until early 2008 when they become more similar to oneanother, but still greater than HW2 (which remains lower at50 mg L−1 through the same period). There is a prominentrise in Ca at all sites beginning in the summer of 2008/2009and peaking in November 2009 at ca. 80 mg L−1, beforefalling back to ca. 60 mg L−1 in autumn 2010. After this time,and throughout the following wetter interval, Ca concentra-tions at all sites become closer in value and less variable over-all with some excursions to lower Ca at individual drip sitesover periods of 0.5–2 months.
The prominent Ca peak in 2009 also occurs during a dryperiod when Ca is increasing rather than decreasing. In thiscase, this prominent peak in Ca occurs during a persistentrun of above-average surface temperatures dominating theentire year (Fig. 3). Specifically, an unusually warm winterwas experienced in 2009 (Fig. 3f), followed by the hottestNovember on record (BoM; 2015b). We propose that, in this
Hydrol. Earth Syst. Sci., 20, 4625–4640, 2016 www.hydrol-earth-syst-sci.net/20/4625/2016/
C. V. Tadros et al.: ENSO–cave drip water hydrochemical relationship 4633
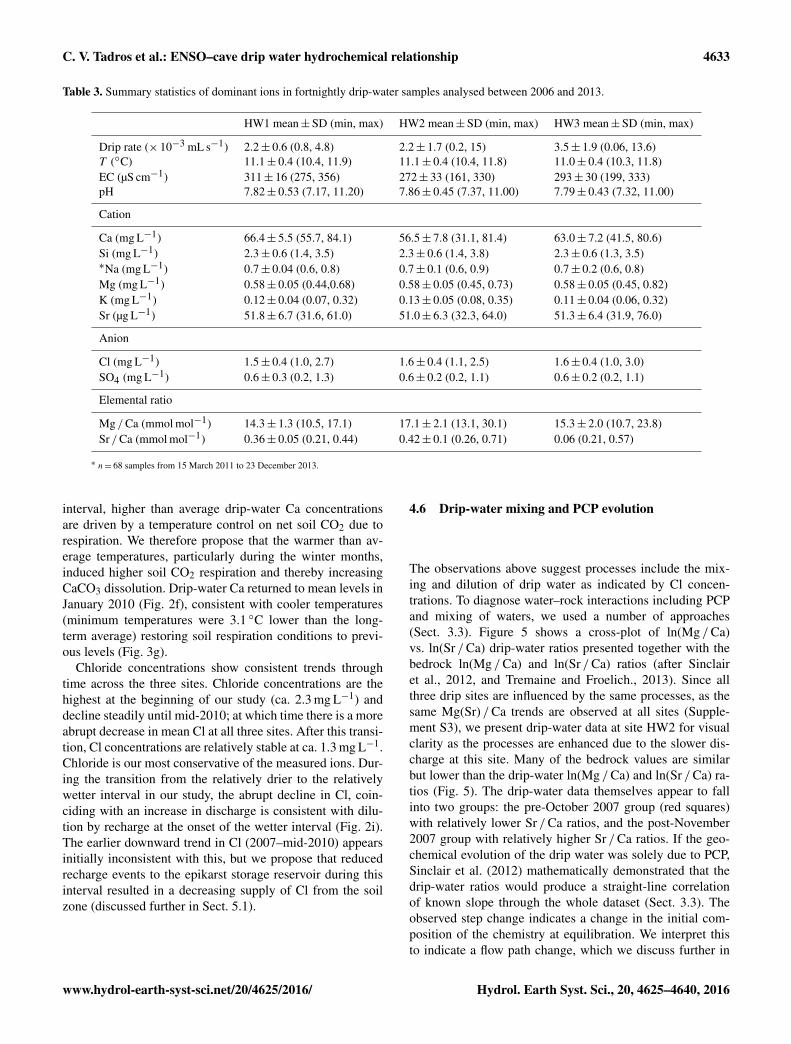
Table 3. Summary statistics of dominant ions in fortnightly drip-water samples analysed between 2006 and 2013.
HW1 mean±SD (min, max) HW2 mean±SD (min, max) HW3 mean±SD (min, max)
Drip rate (× 10−3 mL s−1) 2.2± 0.6 (0.8, 4.8) 2.2± 1.7 (0.2, 15) 3.5± 1.9 (0.06, 13.6)T (◦C) 11.1± 0.4 (10.4, 11.9) 11.1± 0.4 (10.4, 11.8) 11.0± 0.4 (10.3, 11.8)EC (µS cm−1) 311± 16 (275, 356) 272± 33 (161, 330) 293± 30 (199, 333)pH 7.82± 0.53 (7.17, 11.20) 7.86± 0.45 (7.37, 11.00) 7.79± 0.43 (7.32, 11.00)
Cation
Ca (mg L−1) 66.4± 5.5 (55.7, 84.1) 56.5± 7.8 (31.1, 81.4) 63.0± 7.2 (41.5, 80.6)Si (mg L−1) 2.3± 0.6 (1.4, 3.5) 2.3± 0.6 (1.4, 3.8) 2.3± 0.6 (1.3, 3.5)∗Na (mg L−1) 0.7± 0.04 (0.6, 0.8) 0.7± 0.1 (0.6, 0.9) 0.7± 0.2 (0.6, 0.8)Mg (mg L−1) 0.58± 0.05 (0.44,0.68) 0.58± 0.05 (0.45, 0.73) 0.58± 0.05 (0.45, 0.82)K (mg L−1) 0.12± 0.04 (0.07, 0.32) 0.13± 0.05 (0.08, 0.35) 0.11± 0.04 (0.06, 0.32)Sr (µg L−1) 51.8± 6.7 (31.6, 61.0) 51.0± 6.3 (32.3, 64.0) 51.3± 6.4 (31.9, 76.0)
Anion
Cl (mg L−1) 1.5± 0.4 (1.0, 2.7) 1.6± 0.4 (1.1, 2.5) 1.6± 0.4 (1.0, 3.0)SO4 (mg L−1) 0.6± 0.3 (0.2, 1.3) 0.6± 0.2 (0.2, 1.1) 0.6± 0.2 (0.2, 1.1)
Elemental ratio
Mg /Ca (mmol mol−1) 14.3± 1.3 (10.5, 17.1) 17.1± 2.1 (13.1, 30.1) 15.3± 2.0 (10.7, 23.8)Sr /Ca (mmol mol−1) 0.36± 0.05 (0.21, 0.44) 0.42± 0.1 (0.26, 0.71) 0.06 (0.21, 0.57)
∗ n= 68 samples from 15 March 2011 to 23 December 2013.
interval, higher than average drip-water Ca concentrationsare driven by a temperature control on net soil CO2 due torespiration. We therefore propose that the warmer than av-erage temperatures, particularly during the winter months,induced higher soil CO2 respiration and thereby increasingCaCO3 dissolution. Drip-water Ca returned to mean levels inJanuary 2010 (Fig. 2f), consistent with cooler temperatures(minimum temperatures were 3.1 ◦C lower than the long-term average) restoring soil respiration conditions to previ-ous levels (Fig. 3g).
Chloride concentrations show consistent trends throughtime across the three sites. Chloride concentrations are thehighest at the beginning of our study (ca. 2.3 mg L−1) anddecline steadily until mid-2010; at which time there is a moreabrupt decrease in mean Cl at all three sites. After this transi-tion, Cl concentrations are relatively stable at ca. 1.3 mg L−1.Chloride is our most conservative of the measured ions. Dur-ing the transition from the relatively drier to the relativelywetter interval in our study, the abrupt decline in Cl, coin-ciding with an increase in discharge is consistent with dilu-tion by recharge at the onset of the wetter interval (Fig. 2i).The earlier downward trend in Cl (2007–mid-2010) appearsinitially inconsistent with this, but we propose that reducedrecharge events to the epikarst storage reservoir during thisinterval resulted in a decreasing supply of Cl from the soilzone (discussed further in Sect. 5.1).
4.6 Drip-water mixing and PCP evolution
The observations above suggest processes include the mix-ing and dilution of drip water as indicated by Cl concen-trations. To diagnose water–rock interactions including PCPand mixing of waters, we used a number of approaches(Sect. 3.3). Figure 5 shows a cross-plot of ln(Mg /Ca)vs. ln(Sr /Ca) drip-water ratios presented together with thebedrock ln(Mg /Ca) and ln(Sr /Ca) ratios (after Sinclairet al., 2012, and Tremaine and Froelich., 2013). Since allthree drip sites are influenced by the same processes, as thesame Mg(Sr) /Ca trends are observed at all sites (Supple-ment S3), we present drip-water data at site HW2 for visualclarity as the processes are enhanced due to the slower dis-charge at this site. Many of the bedrock values are similarbut lower than the drip-water ln(Mg /Ca) and ln(Sr /Ca) ra-tios (Fig. 5). The drip-water data themselves appear to fallinto two groups: the pre-October 2007 group (red squares)with relatively lower Sr /Ca ratios, and the post-November2007 group with relatively higher Sr /Ca ratios. If the geo-chemical evolution of the drip water was solely due to PCP,Sinclair et al. (2012) mathematically demonstrated that thedrip-water ratios would produce a straight-line correlationof known slope through the whole dataset (Sect. 3.3). Theobserved step change indicates a change in the initial com-position of the chemistry at equilibration. We interpret thisto indicate a flow path change, which we discuss further in
www.hydrol-earth-syst-sci.net/20/4625/2016/ Hydrol. Earth Syst. Sci., 20, 4625–4640, 2016

4634 C. V. Tadros et al.: ENSO–cave drip water hydrochemical relationship
Figure 5. Drip-water ln(Sr /Ca) vs. ln(Mg /Ca) ratios at site HW2are graphed together with the bedrock composition (see Table 2).To enhance clarity, high dry-season Ca, wet and 2007 drip-waterchemistry trends are discriminated from the complete dataset (lightgrey circles). The step change, offsetting between the two lineartrends, is indicated by a curved arrow. Inset highlights dry and wetperiod data.
Sect. 5.1. All HW2 drip-water values are consistent with evo-lution from the bedrock values, notably R7 to R10.
Linear regressions are plotted for each group of data inFig. 5. There is some scatter of the data around these linessuggesting that more than one process may be influencing theresulting drip-water Sr /Ca and Mg /Ca ratios. During lowdischarge and dry rainfall conditions the drip-water composi-tion shifts to higher Mg /Ca and Sr /Ca ratios away from thebedrock plotting in the distal outer ends, representing pro-gressive CO2 degassing due to increased PCP. During thetransition period from dry to wet conditions in mid-2010when discharge increased (blue filled circles in Fig. 5), drip-water Mg /Ca and Sr /Ca ratios plot closer to the bedrock re-gion, indicating reduced PCP. During the high dry-season Cavalues (November 2009, square window), Mg(Sr) /Ca ratiosare close to the bedrock ratios. As drip water reached maxi-mum Ca values, Mg(Sr) /Ca ratios evolved towards slightlylower values, due to dissolution of the host limestone, causedby increased soil CO2 from bioproductivity. An alternativehypothesis for the rise in Ca in late 2009 could be a flowpath change; however, the Sr /Ca and Mg /Ca data show noevidence to support this.
The calculated drip-water ln(Sr /Ca) vs. ln(Mg /Ca)(weight ratio) correlation slopes of the two groups of dataat each drip site range between 0.66± 0.17 and 1.01± 0.07,
within the range of predicted slopes suggested by Sinclair etal. (2012). Although a slight slope change is observed be-tween the two flow paths, this suggests that cave drip waterevolves under PCP.
Unlike the late 2007 step change, we observe a rise inMg(Sr) /Ca and a drop in Ca in 2011 and 2013 (arrows;Fig. 2). These events are short-lived and are most notable atone site only (HW2); there is insufficient data to evaluate thissite-specific change and nonetheless are features that wouldnot be preserved in the speleothem.
Excluding 2007, the long-term Mg values are increasingrelative to Ca and there is a drift towards higher Mg /Ca val-ues overall but less evident in the Sr /Ca time series (Fig. 2).There is a long-term rise in Mg concentrations of 0.15 ppmfrom 2008 to 2013. A more complete characterization willinclude an investigation of aerosols and soil in a future study.
5 Discussion
Speleothem geochemical proxy records archive environmen-tal and climate signals from the surface to the cave (Fairchildand Treble, 2009). However, informed palaeorainfall recon-struction from speleothems requires an understanding of thedrip hydrological pathway and the karst hydrogeological in-fluences, preferably based on modern cave monitoring datafrom similar climates. In this section we discuss the key re-sults used to constrain the hydrological processes that char-acterize drip sites HW1–3 based on discharge, geochemicaland stable isotope parameters in contrasting rainfall condi-tions, highlighting the importance of constraining the evo-lution of the drip water in the context of the local environ-ment. Multiple lines of evidence indicate the drip sites areconstrained by multiple processes, which we summarize in aconceptual model. We examine the relationship between theobserved hydrogeochemical changes with the climate. Ourfindings underlie the use of geochemical tracers toward in-forming speleothem proxy records and we also discuss theimplications of these results for palaeoenvironmental recon-struction.
5.1 Hydrogeochemical processes influencingdrip-water chemistry
Based on hydrogeochemical observations presented inSect. 4, we suggest in Harrie Wood Cave the flow pathsfeeding stalagmites from drip sites HW1–3 are from aType 1, mixed-flow/storage connectivity low-flow sub-type,i.e. fracture flow from a “pocket reservoir” in the well-mixed epikarst storage reservoir (Markowska et al., 2015; seeSect. 2.2). Our data confirm the drip water that precipitatesspeleothem calcite drains from bulk homogenized epikarststore water, the primary karst storage reservoir at HarrieWood Cave. The results from the oxygen-isotope data indi-cate that infiltrating water is well-mixed, because the range of
Hydrol. Earth Syst. Sci., 20, 4625–4640, 2016 www.hydrol-earth-syst-sci.net/20/4625/2016/

C. V. Tadros et al.: ENSO–cave drip water hydrochemical relationship 4635
drip-water δ18O values is narrow in comparison to the rain-fall, and the arithmetic mean of the drip water reflects theweighted mean of precipitation (Sect. 4.3); moreover, fromthe drip-water isotope time series there is a strong buffer-ing of the extremely low δ18O winter rainfall values in 2007,2010, 2012 and 2013 (Fig. 2). Furthermore, consistency intrace element trends among the sites (Table 3) confirms thekarst waters are well homogenized.
A significant proportion of flow to the drip points isdrained from a storage reservoir, owing to sustained base-flow discharge levels during the weak El Niño in 2006 andthe low rainfall period between 2007 and 2009 (Sect. 4.4).Furthermore, as base flow is maintained and a large infiltra-tion event or threshold level is not required to activate thedrip site; this suggests the karst plumbing system feeding thestalagmites is not as described by Markowska et al. (2015),i.e. a Type 2 extreme event activated or Type 3 overflow site(see Sect. 2.2).
Dilution of the epikarst storage reservoir was observedduring the transition to the La Niña phase in 2010/2011, con-sistent with the observation of a clear increase in dischargefollowed by a decrease in Cl concentrations. This further sug-gests that after recharge the epikarst storage reservoir vol-ume reached close to maximum capacity maintaining “steadystate”, supported by the drip-water Mg /Ca and Sr /Ca ratiosreaching mean levels indicating minimum PCP. Additionally,this indicates that discharge at the drip sites are not from aType 1 (high flow sub-type), Type 4 or Type 5 site, as duringperiods of water excess discharge at these sites receive flowdirectly from the soil storage reservoir, and therefore a risein Cl would be anticipated due to higher ET to the system asa whole; however, the converse was observed.
During the dry period from 2007 to mid-2010, we suggestthe decreasing trend from elevated Cl levels indicates limitedrecharge. During the dry period we observe a decline in theCWB and reduced drip rate, consistent with fewer rechargeevents from the soil–vadose zone to the epikarst store, andtherefore decreasing drip-water Cl concentrations. Alterna-tively, it may also reflect higher ET in the soil–vadose zone,but this would also result in an enriched drip-water δ18Osignal. ET is relevant at this karst site; however, we do notfavour this explanation, as the similarity between drip-waterδ18O values during the dry period compared to the wetter pe-riod suggests evaporation of the infiltrating drip water wasnot significant (Sect. 4.3).
A flow path change at October 2007 is inferred from theshift to higher Sr /Ca ratios (Sect. 4.6; Fig. 5). This processoccurred during the drying conditions when the CWB wasdecreasing (Fig. 2b), but when base-flow levels were main-tained at all drip sites during this period. We infer that a flowpath re-direction through a higher Sr /Ca endmember oc-curred due to soil–vadose zone drying to sustain discharge.This indicates a non-linear response of the system to pro-gressive drying. A possible explanation is that calcification of
the flow path produced a threshold change causing re-routingthrough a higher Sr /Ca source.
The three drip-water monitoring sites (HW1–3) are lo-cated within a small area (Fig. 1b); however, there are dif-ferences in the chemistry, which is notable in 2007 duringthe earliest interval of the dry period. In particular a lowerdrip rate (Sect. 4.4) and a lower Ca concentration and higherMg /Ca and Sr /Ca ratio (Sect. 4.5) of site HW2 comparedto the neighbouring sites HW3 and 1, which are only 10–15 cm away. Equivalent Cl concentrations over this period(Sect. 4.5) suggest differences have subsequently arisen inthe carbonate chemistry. A potential explanation for this isthat all three drip sites are fed by the same chemistry, but thelower drip rate at site HW2 is consistent with greater in-cavePCP on the stalactite tip, inducing a lower Ca concentrationand enhancing PCP (Treble et al., 2015).
Thus, we deduce that the studied drip water is from aType 1 mixed-flow/storage connectivity low-flow sub-type,the system is open to CO2, and a ventilated air pocket withvariable height and lower pCO2 provides the potential for de-gassing and calcite precipitation from the drip water (Toothand Fairchild, 2003). Although we observed a hydrologicalflow path change, a distinction in drip-water Mg /Ca andSr /Ca composition between drier and wetter periods is evi-dent. During dry periods, the PCP mechanism was enhancedand the highest Mg /Ca and Sr /Ca ratios in this study arerecorded during the El Niño and intervals of below averagerainfall, as PCP is promoted due to a dewatering of spaces.In contrast, for the duration of the strong La Niña phasein 2010/11 and above-average rainfall, reduced PCP (meanMg /Ca and Sr /Ca ratios) is noted (blue circles, Fig. 5)since a reduced reservoir head space limits degassing.
We also examine the role of calcite dissolution and soilzone CO2 in more detail. Drip-water Ca concentrationsreached maximum values (80 mg L−1) in November 2009(see Fig. 2f), as unseasonal temperatures increased. We sug-gest that soil microbial production increased the CO2 con-centration of infiltrating waters driving CaCO3 mineral dis-solution (square window, Fig. 5). Presumably vadose zoneCO2 production also drives calcite dissolution during the dryperiod (Atkinson et al., 1977). During the dry period there isa long-term decline in the CWB and progressive draining ofthe epikarst store; therefore, more unsaturated zone is avail-able for CO2 production, which may also lead to increasedcalcite solubility.
An alternative hypothesis is the Ca trend may be a fire-driven process as the site was affected by fire 4 years beforethe monitoring period, which may have decreased soil CO2production, associated calcite dissolution and Ca concentra-tions (Coleborn et al., 2006). That effect is most likely in thefirst decade after the fire. However, a decreasing trend in Cain the early monitoring period (the opposite of what mightbe expected) in combination with thin soil and sparse veg-etation indicates that any fire-induced soil biogeochemicalchanges had relatively little impact on the drip-water signa-
www.hydrol-earth-syst-sci.net/20/4625/2016/ Hydrol. Earth Syst. Sci., 20, 4625–4640, 2016

4636 C. V. Tadros et al.: ENSO–cave drip water hydrochemical relationship
ET
I
P
w
g
w
g
(b)
1
2
High Sr bedrock
g
(c) (d) Dry Wet
w
g
w PCP
Di lution
Dry Wet
I II
Dr ier
I
II
High-Cl L ow-Cl
SO
IL
CO2
HCO3-
H2O
Ca2+ L
IME
ST
ON
E
(a)
Figure 6. Conceptual model summarizing key process affecting drip-water hydrochemical variations at Harrie Wood Cave. Shown areprecipitation (P ), evapotranspiration (ET) and infiltration (I ) infiltrations corresponding to when rainfall exceeds 13 mm. Stalactites fromdrip sites HW1–3 are fed by fracture flow from a ventilated well-mixed pocket reservoir with a variable head within the epikarst. (a) Soil andunsaturated/vadose zone CO2 drive CaCO3 dissolution, increasing drip-water Ca. (b) The host bedrock varies geochemically and the darkgrey shading along the fracture represents bedrock of higher Sr concentrations. A flow path change from 1 to 2 (October 2007) results in dripwater being enriched in Sr. The size of flow arrows in (c) and (d) qualitatively correspond to recharge to the epikarst storage reservoir. (c) PCPwithin the store is enhanced during dry periods as the water level (w) is low, fairly constant and in contact with a greater ventilated gas phase(g). Dilution occurs during wet intervals due to greater inflow and PCP decreases as a reduced reservoir head space limits degassing (w > g).(d) During dry periods, the response to reduced inflow (I to II) is a decrease in Cl concentrations within the storage reservoir and thereforedrip water. In wet periods, Cl is flushed from the soil–vadose zone and then diluted within the store, resulting in a sharp decline in drip-waterCl.
ture. Also, in the short term, the concentration of elements inthe soil can increase in response to a fire. Considering this,during the drying trend when there is reduced recharge andbased on the observed trend of the conservative tracer Cl, theeffect would be an analogous decrease in Mg and Sr concen-trations in the drip water, whereas a long-term rise in Mg isnoted (Sect. 4.6), as such we do not consider the 2003 fireevent had an impact on the drip-water dataset.
Based on a 7-year observational study, we have unveileda complex non-linear geochemical response, as depicted inFig. 6. We now attempt to discern whether these long-termtrends in the geochemistry are climate related. During thedrying trend (2007 to mid-2010), we observed low discharge,a flow path change, decreased Cl, enhanced and increasedCa caused by increased CaCO3 solubility due to higher soilCO2 and bioproductivity. This is a response consistent withreducing recharge conditions. During the wetter period, wealso observed trends consistent with increased recharge, in-
creased discharge, dilution and reduced PCP. Therefore, weinterpret these as evidence of climatic induced changes. Overthe long-term, drip discharge and hydrogeochemical varia-tions between the relatively dry and wet period are drivenby variations in water availability due to ENSO and are ofpalaeoclimatic relevance.
We have confidently constrained the possible hydrologi-cal processes, which can occur in a karst system situated ina region greatly impacted by ENSO episodes. We attributethis to long-term monitoring that encapsulated the shift be-tween the two extremes of ENSO, namely from dry El Niñoto wet La Niña conditions. Based on our findings and withthe knowledge that the impact of each ENSO episode onAustralia varies, we have identified how Harrie Wood Caveresponds to a changing climate signal (rainfall), and throughgeochemical proxies (δ18O, Ca, Cl, and Mg /Ca and Sr /Caratios) identified how this response has been transformedand is recorded in cave drip water over time. These results
Hydrol. Earth Syst. Sci., 20, 4625–4640, 2016 www.hydrol-earth-syst-sci.net/20/4625/2016/

C. V. Tadros et al.: ENSO–cave drip water hydrochemical relationship 4637
have important implications in informing palaeoclimate find-ings from speleothem archives, which we discuss further inSect. 5.2.
5.2 Implications for speleothems as palaeorainfallrecorders
Our results provide a foundation to inform speleothempalaeoclimate records where drip-water compositions are in-fluenced by multiple processes. During our studied inter-val, element concentrations and ratios in the drip water weredriven by climate (ENSO) and karst hydrological processes.Based on drip characterization of sites HW1–3, Mg /Cavariations in the conjugate stalagmite could in principle, besuccessfully applied to construct palaeorainfall conditions(Tooth and Fairchild, 2003; Markowska et al., 2015). Wehave demonstrated that drip-water Mg /Ca and Sr /Ca ratiosare a relative measure of modern rainfall variability. There-fore, in a highly resolved speleothem time series, we an-ticipate displacements of [Mg /Ca]calcite and [Sr /Ca]calcitefrom a baseline ratio (bedrock) to higher and mean ratioswill differentiate between dry and wet periods respectively.McDonald et al. (2004) also identified a relationship be-tween drip-water Mg /Ca and Sr /Ca ratios and drought inWombeyan Caves, New South Wales (NSW); however, theirinterpretation of the trace element stalagmite record variesslightly. At Wombeyan, PCP is a more dominant controlon the karst hydrochemistry, although it is in the same cli-mate region, but a warmer site with greater evapotranspira-tion and a longer growing season. Consequently, we wouldexpect that the resultant drip water (and stalagmite calcite)would be enriched in Mg /Ca and Sr /Ca. As such we ex-pect to observe a greater displacement of Mg /Ca ratiosaway from the bedrock composition during any given dryphase at Wombeyan Caves, in comparison to a correspond-ing record at Harrie Wood Cave. For wet periods, no LaNiña events occurred during their study period (July 2001–January 2004); therefore, McDonald et al. (2004) could onlyspeculate Mg /Ca calcite ratios would shift towards bedrockvalues due to a decreased effect of PCP. In contrast, extendedmonitoring through the La Niña mode of an ENSO cycle pro-vides us with a more informed interpretation; whereby weanticipate La Niña events in the stalagmite trace element timeseries may be resolved from baseline ratios by a shift to meanratios.
6 Conclusions
This research targeted the Snowy Mountains region of theAustralian Alps; a key water resource region in SE Aus-tralia where rainfall variability and, therefore, future waterresource availability in this climatically sensitive region isuncertain. Our results have advanced the scientific knowl-edge of the in-cave drip response to modern-ENSO variabil-
ity, via rainfall, and therefore enabled the identification ofthe most reliable geochemical proxies (trace element con-centrations and δ18O) for palaeoclimate reconstruction fromspeleothem archives within Harrie Wood Cave and in the re-gion.
This study underpins the importance of extended monitor-ing through a modern ENSO cycle and we document a sitewhere a number of concurrent hydrological processes are oc-curring, occasioning a complex non-linear geochemical drip-water signature. The local karst hydrogeological processes,which influence trace element and δ18O proxies in drip wa-ter, and therefore signatures in the speleothem calcite, wereconstrained. We identified discharge at drip sites HW1–3 isfrom a well-mixed pocket reservoir in the epikarst storagereservoir.
Interpretation of drip-water Ca, Cl, Mg /Ca and Sr /Caratios during contrasting rainfall conditions allowed the fol-lowing processes to be constrained. During the El Niño anddry periods, enhanced PCP resulted in higher Mg /Ca andSr /Ca ratios. While during the La Niña and wet phase, Clconcentrations and discharge were used to constrain the pro-cess of dilution and reduced PCP controlled drip chemistry.However, we found a number of non-linear responses em-bedded in a linear drying climate trend. An interpretation ofdrip-water Sr /Ca vs. Mg /Ca ratios compared to differentendmember bedrock ratios showed a shift to higher Sr val-ues, suggesting a flow-path change. Decreasing drip-waterCl levels indicated reduced recharge of the epikarst storagereservoir, and an unexpected rise in the Ca time series wasshown to be caused by carbonate dissolution due to an in-crease in soil and epikarst–vadose zone CO2 concentrations.The data presented here highlight the complex interplay ofa drip-water signal in response to the climate signal, thishas been achieved only through long-term monitoring overa 7-year (2007–2013) period. A conceptual model was con-structed illustrating these key processes controlling the drip-water composition.
These processes are shown to be linked to climate inducedchanges and propose Mg /Ca and Sr /Ca variations in theconjugate stalagmite could, in principle, be successfully ap-plied to construct palaeorainfall conditions. This study hasextended our understanding of changing climatic controls onproxy variations within the Harrie Wood Cave system and,therefore, provides a benchmark for its application region-ally and globally when using speleothems for palaeoclimatereconstruction.
7 Data availability
Time series of rainfall and drip-water data used in thisstudy are available upon request from the correspondingauthor. The Southern Oscillation Index monthly data arepublicly available (http://www.bom.gov.au/climate/current/soihtm1.shtml). This work used data acquired from the Aus-
www.hydrol-earth-syst-sci.net/20/4625/2016/ Hydrol. Earth Syst. Sci., 20, 4625–4640, 2016

4638 C. V. Tadros et al.: ENSO–cave drip water hydrochemical relationship
tralian Water Availability Project (AWAP), AWAP modelresults can be accessed by contacting Peter Briggs (http://www.csiro.au/awap/; [email protected]).
The Supplement related to this article is available onlineat doi:10.5194/hess-20-4625-2016-supplement.
Author contributions. Carol V. Tadros conceptualized the research,collected data, conducted all data analysis and interpretation, gen-erated graphs, the conceptual model and wrote the manuscript.Pauline C. Treble and Andy Bake provided guidance, reviewedand edited the manuscript in their function as my supervisors,as did Ian Fairchild, and Stuart Hankin installed and main-tained the weather stations and assisted with generating Fig. 1a.Regina Roach collected the fortnightly drip-water samples for thisstudy. Monika Markowska performed the stable isotope sampleanalysis. Janece McDonald set up the drip-water monitoring studyin 2006.
Acknowledgements. The authors are grateful to Suzanne Hollinsfor supporting this research. We thank Jagoda Crawford and DarrellTremaine for useful discussion. Henri Wong, Chris Vardanega,Robert Chisari and Barbora Gallagher are thanked for theirassistance with sample analysis. George Bradford and the staffat Yarrangobilly Caves and NSW NPWS are also thanked fortheir dedication and on-going field support and access permission.Silvia Frisia and Andrea Borsato are thanked for their assistancein the field regarding the geology of karst in the Snowy Mountainsalpine region. Peter Briggs and Alan Griffiths are acknowledgedfor providing the AWAP data. PCT acknowledges the supportof a Land & Water Australia grant (project number ANU52) forthis study. We thank Bill Hu and two anonymous reviewers fortheir constructive and thoughtful reviews that helped improved themanuscript.
Edited by: B. HuReviewed by: two anonymous referees
References
Aplin, K., Ford, F., and Hiscock, P.: Early Holocene human occu-pation and environment of the southeast Australian Alps: Newevidence for the Yarrangobilly Plateau, New South Wales, in: Al-tered Ecologies: Fire, Climate and Human Influence on Terres-trial Landscapes, edited by: Haberle, S., Stevenson, J., Prebble,M., 187–212, 2010.
Atkinson, T. C.: Carbon dioxide in the atmosphere of the unsat-urated zone: an important control of groundwater hardness inlimestones, J. Hydrol., 35, 111–123, 1977.
Baker, A., Genty, D., and Fairchild, I. J.: Hydrological characterisa-tion of stalagmite dripwaters at Grotte de Villars, Dordogne, bythe analysis of inorganic species and luminescent organic matter,Hydrol. Earth Syst. Sci., 4, 439–449, doi:10.5194/hess-4-439-2000, 2000.
Baldini, J. U. L., McDermott, F., and Fairchild, I. J.: Structure ofthe 8200 year cold event revealed by a speleothem trace elementrecord, Science, 296, 2203–2206, 2002.
Baldini, J. U. L., McDermott, F., and Fairchild, I. J.: Spatial vari-ability in cave drip water hydrochemistry: Implications for sta-lagmite paleoclimate records, Chem. Geol., 235, 390–404, 2006.
Barros, A. P. and Bowden, G. J.: Toward long-lead operational fore-casts of drought: An experimental study in the Murray-DarlingRiver Basin, J. Hydrol., 357, 349–367, 2008.
BoM: http://www.bom.gov.au/climate/enso/ (last access: 24 De-cember 2015), 2015a.
BoM: http://www.bom.gov.au/climate/mwr/ (last access: 24 De-cember 2015), 2015b.
Borsato, A., Frisia, S., Fairchild, I. J., Somogyi, A., and Susini, J.:Trace element distribution in annual stalagmite laminae mappedby micrometer-resolution X-ray fluorescence: Implications forincorporation of environmentally significant species, Geochim.Cosmochim. Ac., 71, 1494–1512, 2007.
Cai, W. and Cowan, T.: Evidence of impacts from rising temperatureon inflows to the Murray–Darling Basin, Geophys. Res. Lett., 35,L07701, doi:10.1029/2008GL033390, 2008.
Callow, N., McGowan, H., Warren, L., and Speirs, J.: Driversof precipitation stable isotope variability in an alpine setting,Snowy Mountains, Australia, J. Geophys. Res.-Atmos., 119,3016–3031, 2014.
Chubb., T. H., Siems, S. T., and Manton, M. J.: On the decline ofwintertime precipitation in the snowy mountains of SoutheasternAustralia, J. Hydrometeorol., 12, 1483–1497, 2011.
Coleborn, K., Spate, A., Tozer, M., Anderson, M. S., Fairchild,I. J., MacKenzie, B., Treble, P. C., Meehan, S., Baker, A., andBaker, A.: Effects of wildfire on long-term soil CO2 concentra-tion: implications for karst processes, Environ. Earth Sci., 75,1–12, 2016.
Crawford, J., Hughes, C. E., and Parkes, S. D.: Is the isotopic com-position of event based precipitation driven by moisture sourceor synoptic scale weather in the Sydney Basin, Australia?, J. Hy-drol., 507, 213–226, 2013.
Cruz Jr., F. W., Burns, S. J., Jercinovic, M., Karmann, I., Sharp, W.D., and Vuille, M.: Evidence of rainfall variations in SouthernBrazil from trace element ratios (Mg /Ca and Sr /Ca) in a LatePleistocene stalagmite, Geochim. Cosmochim. Ac., 71, 2250–2263, 2007.
CSIRO and Bureau of Meteorology: Climate Change in AustraliaInformation for Australia’s Natural Resource Management Re-gions: Technical Report, CSIRO and Bureau of Meteorology,Australia, 1–222, 2015.
Cuthbert, M. O., Baker, A., Jex, C. N., Graham, P. W., Treble, P.C., Andersen, M. S., and Acworth, R. I.: Drip water isotopes insemi-arid karst: implications for speleothem paleoclimatology,Earth Planet. Sci. Lett., 395, 194–204, 2014.
Dai, A., Fung, I. Y., and Del Genio, A. D.: Surface observed globalland precipitation variations during 1900–1988, J. Climate., 10,2943–2962, 1997.
Drever, J. I.: The Geochemistry of Natural Waters, Prentice-HallInc., Englewood Cliffs, NJ, 388 pp., 1982.
Dredge, J., Fairchild, I. J., Harrison, R. M., Fernandez-Cortes, A.,Sanchez-Moral, S., Jurado, V., Gunn, J., Smith, A., Spötl, C.,Mattey, D., Wynn, P. M., and Grassineau, N.: Cave aerosols: Dis-
Hydrol. Earth Syst. Sci., 20, 4625–4640, 2016 www.hydrol-earth-syst-sci.net/20/4625/2016/

C. V. Tadros et al.: ENSO–cave drip water hydrochemical relationship 4639
tribution and contribution to speleothem geochemistry, Quat. Sci.Rev., 63, 23–41, 2013.
Fairchild, I. J. and Treble, P. C.: Trace elements in speleothems asrecorders of environmental change, Quat. Sci. Rev., 28, 449–468,2009.
Fairchild, I. J., Borsato, A., Tooth, A. F., Frisia, S., Hawkesworth,C. J., Huang, Y., McDermott, F., and Spiro, B.: Controls on traceelement (Sr-Mg) compositions of carbonate cave water: implica-tions for speleothem climatic records, Chem. Geol., 166, 255–269, 2000.
Fairchild, I. J., Baker, A., Borsato, A., Frisia,S., Hinton, R. W., Mc-Dermott, F., and Tooth, A. F.: High-resolution, multiple trace-element variation in speleothems, J. Geol. Soc. London, 158,831–841, 2001.
Fairchild, I. J., Smith, C. L., Baker, A., Fuller, L., Spötl, C., Mattey,D., and McDermott, F.: Modification and preservation of envi-ronmental signals in speleothems, Earth Sci. Rev., 75, 105–153,2006.
Frappier, A. B.: Masking of interannual climate proxy signals byresidual tropical cyclone rainwater: Evidence and challenges forlow-latitude speleothem paleoclimatology, Geochem. Geophys.Geosyst., 14, 3632–3647, doi:10.1002/ggge.20218, 2013.
Frisia, S., Borsato, A., Fairchild, I. J., and Susini, J.: Variationsin atmospheric sulphate recorded in stalagmites by synchrotronmicro-XRF and XANES analyses, Earth Planet. Sci. Lett., 235,729–740, 2005.
Frisia, S., Borsato, A., and Susini, J.: Synchrotron radiation appli-cations to past volcanism archived in speleothems: An overview,J. Volcanol. Geoth. Res., 117, 96–100, 2008.
Goede, A., McCulloch, M., McDermott, F., and Hawkesworth, C.:Aeolian contribution to strontium and strontium isotope vari-ations in a Tasmanian speleothem, Chem. Geol., 149, 37–50,1998.
Hartland, A., Fairchild, I. J., Lead, J. R., Borsato, A., Baker, A.,Frisia, S., and Baalousha, M.: From soil to cave: Transport oftrace metals by natural organic matter in karst dripwaters, Chem.Geol., 304–305, 68–82, 2012.
Hughes, C. E. and Crawford, J.: Spatial and temporal variation inprecipitation isotopes in the Sydney Basin, Australia, J. Hydrol.,489, 42–55, 2013.
Hurst, H.: Methods of long-term storage in reservoirs, T. Am. Soc.Civ. Eng., 116, 519–543, 1951.
Jo, K., Kyung, S., Gi, H., Kim, S., and Suk, B.: Rainfall and hy-drological controls on speleothem geochemistry during climaticevents (droughts and typhoons): an example from SeopdongCave, Republic of Korea, Earth Planet. Sci. Lett., 295, 441–450,2010.
Johnson, K., Hu, C., Belshaw, N., and Henderson, G.: Sea-sonal trace-element and stable-isotope variations in a Chinesespeleothem: the potential for high-resolution paleomonsoon re-construction, Earth Planet. Sci. Lett., 244, 394–407, 2006.
Lauritzen, S. E. and Lundberg, J.: Speleothems and climate: A spe-cial issue of the Holocene, Holocene, 9, 643–647, 1999.
Markowska, M., Baker, A., Treble, P. C., Andersen, M. S., Hankin,S., Jex, C. N., Tadros, C. V., and Roach, R.: Unsaturated zonehydrology and cave drip discharge water response: Implicationsfor speleothem paleoclimate record variability, J. Hydrol., 529,662–675, 2015.
McDonald, J., Drysdale, R., and Hill, D.: The 2002–2003 El Niñorecorded in Australian cave drip waters: Implications for recon-structing rainfall histories using stalagmites, Geophys. Res. Lett.,31, L22202, doi:10.1029/2004GL020859, 2004.
McGowan, H. A., Marx, S. K., Denholm, J., Soderholm, J., andKamber, B. S.: Reconstructing annual inflows to the headwa-ter catchments of the Murray River, Australia, using the Pa-cific Decadal Oscillation, Geophys. Res. Lett., 36, L06707,doi:10.1029/2008GL037049, 2009.
Murphy, B. F. and Timbal, B.: A review of recent climate variabilityand climate change in Southeastern Australia, Int. J. Climatol.,28, 859–879, 2008.
Nagra, G., Treble, P. C., Andersen, M. S., Fairchild, I. J., Cole-born, K., and Baker, A.: A post-wildfire response in cavedripwater chemistry, Hydrol. Earth Syst. Sci., 20, 2745–2758,doi:10.5194/hess-20-2745-2016, 2016.
Nicholl, O.: Harrie Wood Cave Map – Y26, Yarrangobilly ResearchGroup and Canberra Speleological Society, Canberra, 1974.
Nicholls, N.: Local and remote causes of the southern Australianautumn–winter rainfall decline, 1958–2007, Clim. Dynam., 34,835–845, 2010.
Oster, J. L., Montañez, I. P., and Kelley, N. P.: Response of a moderncave system to large seasonal precipitation variability, Geochim.Cosmochim. Ac., 91, 92–108, 2012.
Partin, J. W., Cobb, K. M., Adkins, J. F., Tuen, A. A., and Clark, B.:Trace metal and carbon isotopic variations in cave dripwater andstalagmite geochemistry from northern Borneo, Geochem. Geo-phys. Geosyst., 14, 3567–3585, doi:10.1002/ggge.20215, 2013.
Pook, M. J., Risbey, J. S., and McIntosh, P. C.: A comparative syn-optic climatology of cool-season rainfall in major grain-growingregions of southern Australia, Theor. Appl. Climatol., 117, 521–533, 2014.
Power, S. B. and Smith, I. N.: Weakening of the Walker Circula-tion and apparent dominance of El Niño both reach record levels,but has ENSO really changed?, Geophys. Res. Lett., 34, L18702,doi:10.1029/2007GL030854, 2007.
Raupach, M. R., Briggs, P. R., Haverd, V., King, E. A., Paget,M., and Trudinger, C. M.: Australian Water Availability Project(AWAP): CSIRO Marine and Atmospheric Research Compo-nent: Final Report for Phase 3. CAWCR, Technical ReportNo. 013, 67 pp., 2009.
Raupach, M. R., Briggs, P. R., Haverd, V., King, E. A., Paget,M., and Trudinger, C. M.: Australian Water Availability Project.CSIRO Marine and Atmospheric Research, Canberra, Australia,http://www.csiro.au/awap (last access: 15 November 2015),2011.
Riechelmann, D. F. C., Schroder-Ritzrau, A., Scholz, D., Fohlmeis-ter, J., Spotl, C., Richter, D. K., and Mangini, A.: MonitoringBunker Cave (NW Germany): A prerequisite to interpret geo-chemical proxy data of speleothems from this site, J. Hydrol.,409, 682–695, 2011.
Risbey, J. S., Pook, M. J., McIntosh, P. C., Wheeler, M. C., andHendon, H. H.: On the remote drivers of rainfall variability inAustralia, Mon. Weather Rev., 137, 3233–3253, 2009.
Roberts, M., Smart, P., and Baker, A.: Annual trace element vari-ations in a Holocene speleothem, Earth Planet. Sci. Lett., 154,237–246, 1998.
Rozanski, K., Araguas-Araguas, L., and Gonfiantini, R.: Isotopicpatterns in modern global precipitation, in: Climate Change in
www.hydrol-earth-syst-sci.net/20/4625/2016/ Hydrol. Earth Syst. Sci., 20, 4625–4640, 2016

4640 C. V. Tadros et al.: ENSO–cave drip water hydrochemical relationship
Continental Isotopic Records, edited by: Swart, P. K., Lohmann,K. C., McKenzie, J., and Savin, S., American GeophysicalUnion, Geophysical Monograph No. 78, Washington, D.C., 1–36, 1993.
Rutlidge, H., Baker, A., Marjo, C. E., Andersen, M. S., Graham,P. W., Cuthbert, M. O., Rau, G. C., Roshan, H., Markowska, M.,Mariethoz, G., and Jex, C. N.: Dripwater organic matter and traceelement geochemistry in a semi-arid karst environment: Implica-tions for speleothem paleoclimatology, Geochim. Cosmochim.Ac., 135, 217–230, 2014.
Sinclair, D. J., Banner, J. L., Taylor, F. W., Partin, J., Jenson, J.,Mylroie, J., Goddard, E., Quinn, T., Jocson, J., and Miklavic, B.:Magnesium and strontium systematics in tropical speleothemsfrom the Western Pacific, Chem. Geol., 294, 1–17, 2012.
Spötl, C., Fairchild, I. J., and Tooth, A. F.: Cave air controlon dripwater geochemistry, Obir Caves (Austria): Implicationsfor speleothem deposition in dynamically ventilated caves,Geochim. Cosmochim. Ac., 69, 2451–2468, 2005.
Stern, H., de Hoedt, G., and Ernst, J.: Objective classification ofAustralian climates, Australian Meteorological Magazine, 49,87–96, 2000.
Tooth, A. F. and Fairchild, I. J.: Soil and karst aquifer hydrologi-cal controls on the geochemical evolution of speleothem-formingdrip waters, Crag Cave, southwest Ireland, J. Hydrol., 273, 51–68, 2003.
Treble, P., Shelley, J. M. G., and Chappell, J.: Comparison of highresolution sub-annual records of trace elements in a modern(1911–1992) speleothem with instrumental climate data fromsouthwest Australia, Earth Planet. Sci. Lett., 216, 141–153, 2003.
Treble, P. C., Fairchild, I. J., Griffiths, A., Baker, A., Meredith, K. T.,Wood, A., and McGuire, E.: Impacts of cave air ventilation andin-cave prior calcite precipitation on Golgotha Cave dripwaterchemistry, southwest Australia, Quaternary Sci. Rev., 127, 61–72, doi:10.1016/j.quascirev.2015.06.001, 2015.
Treble, P. C., Fairchild, I. J., Baker, A., Meredith, K. M., Ander-sen, M. S., Salmon, S. U., Bradley, C., Wynn, P. M., Hankin, S.,Wood, A., and McGuire, E.: Roles of bioproductivity, transpi-ration and fire in a nine-year record of cave dripwater chemistryfrom southwest Australia, Geochim. Cosmochim. Ac., 184, 132–150, doi:10.1016/j.gca.2016.04.017, 2016.
Tremaine, D. M. and Froelich, P. N.: Speleothem trace element sig-natures: A hydrologic geochemical study of modern cave drip-waters and farmed calcite, Geochim. Cosmochim. Ac., 121, 522–545, 2013.
Worboys, G.: Kosciuosko National Park Geology and Geomorphol-ogy, National Parks and Wildlife Service, Sydney, 1–26, 1982.
Wynn, P. M., Fairchild, I. J., Baker, A., Baldini, J. U., and McDer-mott, F.: Isotopic archives of sulphate in speleothems, Geochim.Cosmochim. Ac., 72, 2465–2477, 2008.
Hydrol. Earth Syst. Sci., 20, 4625–4640, 2016 www.hydrol-earth-syst-sci.net/20/4625/2016/