enter stage left: immigration and the creative arts in …
TRANSCRIPT

ENTER STAGE LEFT: IMMIGRATION AND THE CREATIVE ARTS IN
AMERICA
K. PUN WINICHAKUL, NING ZHANG
Abstract. To what extent have immigrants contributed to the growth of the United States cre-
ative arts economy? In this paper, we explore the impact of immigration during the Age of Mass
Migration on the development of the arts in the U.S. over the past century. In the short run, our
results suggest that immigration helped produce greater numbers of native artists. Over a century
later, counties with greater historical immigration house more arts businesses and nonprofit organi-
zations that generate more revenue, employ a larger proportion of the community, and have earned
more federal arts grants. When evaluating potential mechanisms, we see that arts development
was not solely attributable to immigrant artists or artists from immigrant families. Our analysis
instead suggests that broader interactions between the general immigrant population and natives
contributed to this growth. Altogether, our results highlight the important role that immigrants
played in the early development of the creative arts in America.
Keywords: Immigration, Creative Arts, Economic Development
JEL Classification: F22, O35, Z11
Date: April 27, 2021.∗University of Pittsburgh, Department of Economics, [email protected]; [email protected]. We thank Jason Cook, JosephDoyle, Claire Duquennois, Osea Giuntella, Hillel Rapoport, Frank Schilbach, Allison Shertzer, Noam Yuchtman, andseminar/conference participants at the IV Workshop on Migration, Health, and Well-being, and the University ofPittsburgh. All errors are our own.
1

1. Introduction
The Age of Mass Migration (1850-1920) fundamentally reshaped American communities, as peo-
ple were exposed to new cultures and practices from all over Europe. The creative arts was one
arena that appeared to benefit from these innovative experiences. Fields such as music, dance, and
the visual arts, for instance, integrated immigrant voices and ideas (Scheffler, 2009; Smith et al.,
2011; Pareles, 2019; Hirschman, 2013). With its growth over the past century, the production of
the cultural arts is now one of the largest sectors of the U.S. economy. The arts industry is esti-
mated to contribute nearly $900 billion to the U.S. economy each year (4.5% of annual GDP), and
employs more than 5 million workers nationwide who earn more than the average American worker
(National Endowment for the Arts, 2020).1 Taken together, the stories of immigrant involvement
in creative endeavors suggest that they may have played an important role in the development, and
the continued success, of this American industry today.
In this paper, we systematically analyze the impact of immigration on the growth of the creative
arts in the United States. To the best of our knowledge, we are among the first papers to provide
empirical evidence regarding this question. Researchers in related work have highlighted the role
immigration has played in scientific innovation (Hunt and Gauthier-Loiselle, 2010; Moser et al.,
2014; Moser and San, 2020). We build upon this prior literature by highlighting the impact of
immigration on the American cultural arts, where the creative process may require distinct methods
from those used in the sciences (Furnham et al., 2011; Botella and Lubart, 2016). Scholars have also
studied the economic benefits of diversity in American cities, including the labor market impact
of immigrant artists on native artists (Ottaviano and Peri, 2006; Borowiecki and Graddy, 2018).
Our paper focuses on the broad impact of immigration on progress in the arts. Through this
comprehensive scope, we measure short and long run outcomes that capture the development and
growth of the American arts industry as a whole.
To explore our research question, we use data from the Age of Mass Migration (AMM) to first
examine short run outcomes for counties who experience greater inflows of immigrants during
the prior decade. To address potential identification concerns with using ordinary least squares
(OLS) estimates, our main analysis adopts the instrumental variables strategy used by Sequeira
et al. (2020). In their work the authors leverage the gradual expansion of the railway network,
1Workers in arts-related occupations earn an average of $52,800 annually, $8,000 more than the average Americanworker (National Endowment for the Arts, 2019).
2

and differences in national immigration flows into the United States by decade, to instrument for
county-level immigration. We find that the instrument is a strong predictor of actual immigrant
inflows during this period.
In the short run, we find that greater immigration into a county during the prior decade increases
the share of natives employed in arts occupations in the county in the following decade. We
also evaluate the long-term impact on arts communities roughly 100 years after the Age of Mass
Migration. We note that counties that experienced greater inflows of migrants during the AMM
have greater arts presences today. These counties house a larger number of arts businesses and
arts nonprofits that employ a larger fraction of county populations. Beyond employment, these
arts institutions have been awarded a larger number of National Endowment for the Arts grants
with greater average award value. Finally, counties with higher historical immigration report larger
revenues from arts organizations. The long run results are robust to the potential impact of the
Great Migration and more recent international migration patterns.
To understand the mechanisms behind how immigration has contributed to progress in the Amer-
ican cultural arts, we first note that the development of the arts was not solely due to immigrant
artists. We estimate the impact of immigrant non-artists and artists separately, and find that both
groups led to greater numbers of natives employed in arts-related jobs. We also document that
the short run effects of immigration on natives employment in the arts are driven by individuals
who were not themselves children of immigrants. Finally, we observe that counties who experi-
enced greater immigrant inflows from particular European nations (e.g. France) exhibited larger
increases in the number of natives employed in arts fields (e.g. sculpture) popular in those countries
of origin. We interpret these results as evidence that the development of the creative arts was not
solely due to collaborations among artists of different cultural and ethnic backgrounds, nor was
it driven by those who grew up in immigrant households. Instead, the creative arts appeared to
develop through the everyday interactions and integration of immigrants with native populations
in their communities.
Our findings regarding the development of the creative arts add to recent work exploring the as-
sociation between immigration and patent activity and invention.2 Researchers have also illustrated
the contributions of immigrants to industry growth and firm capacity (Borjas and Doran, 2012;
2See, for example, Moser et al. (2014); Hunt and Gauthier-Loiselle (2010); Akcigit et al. (2017); Burchardi et al.(2020); Moser and San (2020); Doran and Yoon (2020).
3

Kerr and Lincoln, 2010; Khanna and Lee, 2018).3 We complement the prior research regarding
scientific innovation by focusing on the creative arts and cultural innovation. Beyond the economic
importance of the arts industry, existing scholarship has also documented the mental and physical
health benefits of the creative arts (e.g., Hansumaker, 1980; Secker et al., 2011).4
Our paper also complements work that explores the short- and long-term impact of immigrants
who arrived in the United States during the Age of Mass Migration. These papers have documented
immigrant contributions to county and city economic development, as well as backlash immigrants
received from natives during this time period (Abramitzky and Boustan, 2017; Sequeira et al.,
2020; Tabellini, 2020). Economists have suggested that a key mechanism through which economic
development occurs is the sharing of diverse cultural backgrounds (Ottaviano and Peri, 2006).
Therefore in complement to this research, we highlight the cultural contributions of immigrants
who arrived during the AMM to the creative arts economy.
This paper closely resembles the research question posed in Borowiecki and Graddy (2018). In
their paper, the researchers examine the influence of immigrant artists on native artists in the United
States. We complement, but diverge, from their work in the following ways. First, we investigate
the aggregate impact of immigration on the development of the creative arts in America. We study
whether immigrant artists affected native occupation choices, but also evaluate other measures of
arts industry growth. In other words, we not only look at the role of immigrant artists but at
the broader effect of the immigrant community as a whole. Second, we adopt a different empirical
strategy. Borowiecki and Graddy (2018) rely on changes in immigrant inflows by decade beginning
from 1850 to today. Our identification strategy focuses on population movements during the Age of
Mass Migration in particular, one of the most notable periods of immigration in American history.
We then leverage variation in county access to the railway, and national-level immigration inflows,
over this time. Finally, by adopting a different empirical strategy we are also able to evaluate long
run effects in addition to the short run impact of immigration on the arts.
The rest of the paper proceeds as follows. In Section 2, we provide background regarding the
Age of Mass Migration and arts development in the United States. In Section 3 we describe the
data we use. In Section 4, we outline our empirical strategy and report results in Section 5. In
Section 6, we review potential mechanisms behind our results. Finally, in Section 7 we conclude.
3Related literature has also documented the outsized share of immigrants involved in entrepreneurial activities (Kerrand Kerr, 2018; Azoulay et al., 2020).4As a practical example, children’s hospitals across the United States utilize arts therapy programs as part of theirtreatment for kids in their care.
4

2. Background
2.1. The Age of Mass Migration. Nearly 30 million Europeans arrived in the United States
during the Age of Mass Migration. In prior waves of European immigration, the majority of
individuals arrived from the western part of the continent. Individuals who crossed the Atlantic
during this time period were instead largely from southern and eastern Europe (Abramitzky and
Boustan, 2017). The unique set of sending countries was reflected in the diversity of languages
spoken and religious customs followed (Sequeira et al., 2020; Hatton and Williamson, 2005; Daniels,
2002).
Immigrants from southern and eastern Europe also held a wide range of occupations. They
worked in a mix of (traditionally-defined) less-skilled and skilled work. Immigrants from certain
sending countries were disproportionately employed in areas such as carpentry, cabinet-making,
and clock-making, among others (Abramitzky et al., 2014). Immigrants also pursued work in the
creative arts. They brought influences from their countries of origins to America, introducing new
styles and genres across music, dance, and the visual arts (Glueck, 2004). Many Americans credit
immigrant creatives as influences on their own work. Some scholars suggest that immigrants were
able to contribute significantly due to their socialization in multiple cultures and languages. They
argue these experiences were just as important to their artistic successes as any inherent individual
artistic talents (Hirschman, 2013).
Beyond the particular influence of immigrant artists, natives had more regular opportunities to
interact with new cultures that could have sparked their own creativity. As the AMM led to more
frequent interactions in many aspects of everyday life, immigrants in both arts and non-arts work
may have had significant influences on native work. Figure 1 plots immigration inflows to the United
States during the Age of Mass Migration. It also plots changes in the number of native artists as
a share of the U.S. population during this time. Figure 1 illustrates that changes in the number of
native artists are correlated with immigration inflows. This association suggests immigrants could
have affected native occupational choices, including pushing them toward arts-related work.
2.2. American art history before and during the Age of Mass Migration. Many early
American colonial paintings reflected the social and political struggle of the nation. In the nation’s
infancy, paintings often documented major events and figures of the Revolutionary War. Beyond
paintings, colonial Americans filled their homes with fine arts such as woodcraft and pottery to5

signal social status and refined cultural taste (Miller et al., 2008). Outside of European Americans,
American indigenous art often captured the natural and spiritual characteristics of their societies.
As families of American colonists expanded westward, their art also began to include images of
natural lands. At the same time, their art reflected the conflict and violence toward indigenous
communities. Eastern Americans documented their contentious encounters with American indige-
nous peoples, whose communities were being upended by colonists coming from the east (Miller
et al., 2008). However even as artistic diversity began to grow by the mid-19th century, the total
number of individuals who reported arts-related jobs as their primary occupation still remained
limited (Borowiecki, 2019).
In the latter part of the 19th century, American art incorporated styles of innovative artists from
abroad. A select number of Americans with financial means traveled to Europe to formally study
under European artists. Others did not receive formal training but instead immersed themselves
in the cultures across the Atlantic (Cotter, 2012). Experiences from traveling abroad shaped their
own work when they returned to the United States. In addition to the few Americans who traveled
abroad, many Europeans, particularly those from southern and eastern Europe, began arriving on
American shores at this time. Immigrants who arrived during the AMM also brought their artistic
tastes. American art began to reflect the creative demand brought from overseas, and immigrants
helped define what constituted American culture and art styles during this period. Their influence
was reflected across many modes of art, including music, dance, and cinema (Hirschman, 2013).
3. Data
We take advantage of multiple data sources for our analysis. In particular, we leverage U.S.
Census data from IPUMS USA and NHGIS (Ruggles et al., 2020), digitized railway network data
from Sequeira et al. (2020), and aggregate U.S. immigration inflow data from Willcox (1929). We
also utilize data from County Business Patterns regarding arts businesses in 2000, and the Urban
Institute’s National Center for Charitable Statistics regarding arts nonprofit organizations from
1987-2018 (National Center for Charitable Statistics, 2020). Finally, we compile data on National
Endowment for the Arts (NEA) grants disbursed between 1998 and 2020 (National Endowment for
the Arts, 2021).
First, we use U.S. Census micro-data from 1860 to 1920 through IPUMS USA. In the data,
we examine the presence of artists across the U.S. during this time period. We define artists as6

individuals who work primarily in an arts-related occupation. Examples of arts-related occupations
include actors, artists, sculptors, teachers of art, authors, designers, musicians, teachers of music,
architects, and photographers. Beyond occupation information, we use Census data drawn from
NHGIS to obtain the share of immigrants in a county, based on nativity.
Second, we use historical data on county connections to the railway network from Sequeira et
al. (2020). The authors constructed each county’s access to rail transit using historical maps that
outlined both national and regional coverage. Sequeira et al. (2020) obtained a geo-referenced
shapefile of the current railway network from the United States Department of Transportation.
They then overlayed the shapefile onto a digitized version of a paper map to precisely identify the
railway lines in each decade between 1830 and 1920. We take advantage of the data they provide
to document each county’s connection to the railway. We consider a county to have access to the
railway if its boundary is intersected by at least one rail line.
Third, we measure national immigration inflows into the U.S. using data from Willcox (1929).
Inflow estimates are calculated from passenger lists provided by the masters of arriving vessels. We
use the lists to calculate the total number of immigrants from Europe who arrived in the U.S. each
year between 1860 and 1920. Immigrants were defined as foreign passengers who arrived in the
U.S. with the intention of settling down.
Fourth, we collect information from County Business Patterns (CBP) to study the potential
impact of historical immigration on the formation of arts businesses in the United States in con-
temporary times. The CBP data are accessible through the U.S. Census Bureau and include
information on businesses and employees at the county level during the week of March 12, 2000.
We apply the 6-digit NAICS code to identify arts businesses. The industry code that denotes arts-
related firms (NAICS code 7111-7121) includes organizations related to the performing and visual
arts, such as theater, dance, musical groups, and museums, as well as independent artists, writers,
and performers, among others.
Fifth, we explore arts nonprofit financial information from the Urban Institute’s National Center
for Charitable Statistics (NCCS) between 1987 and 2018. The data complement the CBP business
data by measuring the presence of arts nonprofits in the United States over the past few decades
(National Center for Charitable Statistics, 2020). The NCCS data are compiled from Form-990
tax documents completed by all U.S. nonprofit institutions each year who receive revenue above
a minimum reporting threshold. In the data, we identify arts nonprofits by codes that delineate
7

each organization’s primary cause/mission. The data also include information about organization
annual revenues and expenditures.
Finally, we leverage comprehensive information on National Endowment for the Arts grant re-
cipients from 1998 to 2020 (National Endowment for the Arts, 2021). The National Endowment for
the Arts is a federal agency that is one of the largest arts grant-making institutions in the United
States. Each year, it awards thousands of grants to provide Americans with diverse opportunities
to participate in, and complete, arts projects and programs. NEA provides cost/share matching
grants to nonprofit organizations for a wide range of arts projects such as literature fellowships
for creative writers and translators, and Partnership Agreements with 62 state/jurisdictional arts
agencies and regional arts organizations. The grant database includes a comprehensive list of all
individuals and organizations who have received an NEA grant since 1998. The database lists the
award amount for each grant, the geographic location of the recipient, and the applicable sub-field
for the grant.
To motivate our empirical analysis outlined in Section 4, in Table 1 we provide summary sta-
tistics for our data. Data are summarized by two different types of counties – those with and
those without historical railway access in 1920. As mentioned earlier and elaborated below in Sec-
tion 4.1.1, our preferred empirical strategy relies on variation resulting from access to the railway
network.5 As shown in Table 1, counties with railway access in 1920 had slightly larger average
immigration inflows than counties without railway access. Counties with access to the railway
network in 1920 experienced average immigration inflows per decade of approximately 9 percent
of the county’s population. Counties without access to the railway network experienced average
immigration inflows per decade of approximately 8 percent of the county’s population.
Further, historical railway access also appears to be positively correlated with arts-related out-
comes in the short- and long-term. Counties with railway access by 1920 had greater shares of
native artists in their communities during the AMM. Native artists made up an average of 0.20
percent of the population in these counties, but only 0.06 percent of the population in counties
without historical rail access. Over a century later, counties with historical railway access house
more arts businesses that employ more individuals. According to CBP data, these counties average
over nine arts business that employ over 400 employees; meanwhile, counties without historical rail
5More precisely, our preferred empirical strategy relies on variation in railway access over time, as well as nationalimmigration inflows over time. These sources of variation are not explored in the summary statistics provided inTable 1.
8

access average less than five arts businesses that employ approximately 250 individuals. Finally,
on average, counties with historical railway access have more arts nonprofits (8.92 vs. 3.54), have
been awarded more NEA arts grants (36.94 vs. 30.22), and have been awarded NEA arts grants of
greater average value ($1.78 million vs. $0.95 million), than counties lacking historical connection
to the railway.
4. Empirical Strategy
We analyze the impact of immigration during the Age of Mass Migration on the development
of the creative arts both in the short- and long-term. Below, we elaborate on our identification
strategy.
4.1. Short-term effects. In the baseline specification for identifying short-term effects, we use a
panel of U.S. counties from 1860–1920 and estimate the following ordinary least squares equation:
(1)YctPopct
= β0 + β1Ict
Popct+ XctΓ + µt + µc + εct.
In the specification above, Yct is the outcome of interest for county c in decade t. For instance
Yct could represent the number of native artists. The term Popct is a county’s population in decade
t. Thus, the term YctPopct
represents the share of the county population that are native artists in
period t. The term Ict represents the number of immigrants, and the term IctPopct
stands for the
share of the county population that are immigrants in decade t. The term Xct is a vector of
contemporaneous county characteristics, and µt and µc are a set of decade dummies and county
dummies, respectively. The coefficient of interest is β1, which measures the effect of immigration on
short-term county outcomes. We weight the regressions by county population, and cluster standard
errors at the county level to account for serial correlation.
However, estimating equation (1) could suffer from endogeneity bias. For instance, one possibility
is that counties with favorable economic conditions could have offered greater opportunities in the
creative arts, all while attracting a larger number of immigrants. On the other hand, counties with
fewer economic opportunities, including those available in the arts, could have brought in greater
numbers of immigrants if natives discriminated against non-native populations and pushed them
toward less-desirable locales. Each of these forces would be unobservable to the econometrician.
The resulting correlation with the error term would cause β1 in the OLS model to be biased upward
with respect to the former factor, or downward with respect to the latter example. Independently,9

β1 could be biased toward zero due to measurement error, although weighting the specifications by
county population would reduce this bias.
To address the potential endogeneity bias described above, we employ an instrumental variables
approach (2SLS), and leverage two different instruments for immigration inflows. Our preferred
specification is described below.
4.1.1. Instrument 1: Rail access and national immigration inflows. We adopt the instrument con-
structed by Sequeira et al. (2020), which interacts fluctuations in national immigrant inflows with
the gradual expansion of the railway network in the United States. This instrument leverages two
levels of variation related to immigration during the AMM. First, national immigration inflows fluc-
tuated greatly across decades. Second, arriving immigrants tended to rely on rail transit to travel
inland to their final destinations (Faulkner, 1960; Foerster, 1969). During this period of expansive
railway construction, it is therefore likely that the timing of a county’s connection to the railway
network, coupled with when the U.S. was experiencing large national inflows of immigrants, affected
the number of individuals that settled in a county. The benefit of combining the timing of railway
construction with the timing of national immigration booms is that the interaction between the
two produces variation that is unlikely to affect our arts outcomes of interest other than through
its influence on immigration to a county.6
With this instrument, we estimate the first- and second-stage of the 2SLS analysis, described in
equations (2) and (3) below.
(2)Ict
Popct= α1
∆It−1
Popt−1× IRR
ct−1 + α2IRRct−1 + α3
Ict−1
Popct−1+ Xct−1Π + µt + µc + νct
(3)YctPopct
= β1Ict
Popct+ β2I
RRct−1 + β3
Ict−1
Popct−1+ Xct−1Γ + µt + µc + ξct.
The term ∆It−1
Popt−1represents national immigration inflows (∆It−1) between periods t− 1 and t as
a share of the total U.S. population in period t−1 (Popt−1). The term IRRct−1 is an indicator variable
that equals one if county c is connected to the railway in period t− 1. The term ∆It−1
Popt−1× IRR
ct−1 is
the interaction between national immigration inflows as a share of the United States population,
and whether a county is connected to the railway network in period t − 1. The interaction term
6While the interaction is important to the construction of the instrument, we sometimes refer to this as the “railwayinstrument” for expositional ease moving forward.
10

captures the heterogeneous effect of access to a railway on immigrant settlement in a county during
immigration booms relative to immigration lulls. The term Ict−1
Popct−1is the lagged immigrant share in
county c. It is included to control for the mechanical effect of the size of the immigrant population
in the prior period on the size of the immigrant population in period t.
As is noted in Sequeira et al. (2020), we are also concerned with the possibility that immigrant
inflows to a county are associated with business cycle variations. To allow the effect of being
connected to a railway to vary differentially depending on national GDP growth, the term GDPt−1×
IRRc,t−1 is included in Xct−1 in our specification. This interaction captures any differential effects
that being connected to a railway may have had due to economic cycles. The vector of controls
Xct−1 also include county characteristics such as a lagged indicator for county urbanization, lagged
county population density, the interaction between the lagged urbanization measure and lagged
immigration inflows as a share of total population, and polynomials for latitude and longitude,
each of which flexibly capture different factors that could affect immigrant share estimates.7
4.1.2. Instrument 2: Shift-share. The second instrument we use is inspired by the broader class
of shift-share instruments. This instrument estimates changes in county immigrant populations
stemming from changes in national immigrant inflows by origin regions. To illustrate, suppose
immigrants from southern Europe prefer to settle in counties in the Northeastern United States
because other Europeans from the same region have already settled there. Likewise, suppose
immigrants from northern Europe prefer another region of the United States, such as the Midwest,
for similar reasons. Then, a large national increase in the share of immigrants from northern Europe
would lead to larger increases in immigration to the Midwest, relative to the Northeast.
Formally, the predicted change in the number of immigrants in county c predicted by changes in
national inflows from origin region k, can be written as:
∆Mct =∑k
Mck1860
Mk1860∆Mkt =
∑k
λck1860∆Mkt.
In the above equation, λck1860 is county c’s “share” of the national total of immigrants from region
k in 1860, and ∆Mkt is the national “shift,” or change in the number of immigrants from region
7One way to evaluate the validity of the railway instrument is to compare the baseline characteristics of counties whodiffer by when they are connected to the railway and the national immigration inflows at that time. This analysis isshown in Tables 1 and A2 of Sequeira et al. (2020), using county characteristics from 1820-1840, as well as economiccharacteristics by decade from 1850 to 1890. The authors illustrate that the baseline economic characteristics ofcounties that connect to the railroads during immigration booms did not significantly differ from counties thatconnected to the railway during immigration lulls.
11

k between years t and t+ 1. We use 17 source regions or countries, listed in Appendix Table A.1.
Because the variable that is instrumented, ∆IctPopct
, is measured as a first-difference in proportions,
we also estimate ∆Mct as a first-difference in proportions by dividing by the county population at
the start of the period, which is:
∆Mct
Popct
With the shift-share instrument, we estimate the first- and second-stage of the 2SLS analysis, as
shown in equations (4) and (5) below.
(4)∆Ict−1
Popct−1= α1
∆Mct−1
Popct−1+ Xct−1Π + µt + νct
(5)YctPopct
= β1∆Ict−1
Popct−1+ Xct−1Γ + µt + ξct
Though the shift-share instrument is a powerful predictor of regional immigration flows, it may
conflate short and long run responses to immigration shocks. It therefore may be less of an effective
empirical tool to identify short run causal effects (Jaeger et al., 2018). We include this instrument
as a complement to our preferred 2SLS specification described in Section 4.1.1, albeit with caution
due the concerns cited above.8
4.2. Long-term effects. The effect of immigration on the development of the creative arts may
evolve over many years. We therefore explore whether immigration during the Age of Mass Mi-
gration has had lasting effects on the arts industry in present times. In particular, we focus on
outcomes that reflect the robustness of arts communities in counties across the United States from
the 1990s to today.
We begin by estimating the following equation:
(6) Yc,s = β11
T
T∑t=1
Ict,sPopct,s
+1
T
T∑t=1
Xct,sΓ + µs + εc,s.
8To further examine this empirical strategy, we also follow Goldsmith-Pinkham et al. (2020) and construct Rotem-berg weights to evaluate the sensitivity-to-misspecification of our shift-share instrument. The Rotemberg weightssummarize the relative weight of each sending region in the construction of the shift-share instrument. We reportresults from this analysis in Appendix Tables A.11, A.12 and Figure A.6. The results suggest that this shift-shareinstrument is not likely to be sensitive to misspecification, with further discussion provided in Section 5.
12

In Equation (6), the term Yc,s is the outcome of interest in county c and state s. For example, this
measure could be the average annual number of NEA grants that individuals and arts organizations
have received per county over the past twenty years. The term 1T
∑Tt=1
Ict,sPopct,s
summarizes the
historical immigration county c experienced during the AMM. In particular, the term represents
the average share of migrants in county c and state s over the county’s population across years
t, where t ∈ {1860, 1870, 1880, 1900, 1910, 1920}. The term 1T
∑Tt=1 Xct,s represents the average
county-, state-, and year-specific characteristics over the same historical time period. The term µs
represents state fixed effects, which capture geographic and historical factors that may be similar
among counties within a state. The coefficient of interest is β1, which measures the effect of a
county’s average immigrant share between 1860 and 1920 on present measures of arts prosperity.
4.2.1. Instrument 1: Rail access and aggregate immigration inflows. As with the short-term results,
we are still concerned about potential endogeneity bias in the OLS specification outlined in Equation
6. To resolve concerns about endogeneity, we adopt our preferred instrument described in Section
4.1.1; namely, the interaction between national immigration inflows and the gradual expansion of
the railway network in the United States. However given the long-term time frame of this analysis,
we must make a modification to the instrument in Section 4.1.1 above. In particular, for our 2SLS
specification we follow Sequeira et al. (2020) to estimate zero-, first-, and second-stage equations,
as represented by equations (7), (8), and (9) below.
We begin by estimating the following zero-stage equation:
(7)Ict
Popct= α1
∆It−1
Popt−1× IRR
c,t−1 + α2IRRc,t−1 + α3
Ict−1
Popct−1+ Xct−1Γ + µt + µc + νct
which is identical to equation (2), the short run first-stage.
After estimating Equation (7), we calculate the immigrant share in each county and year that is
predicted by the railway instrument:
IctPopct
= α1∆It−1
Popt−1× IRR
c,t−1
where α1 is the estimate of α1 from equation (7). However, in order to study long-run outcomes we
must form a composite measure of the decade-by-decade estimates produced from equation (7). In
the next step, we take the average of the predicted immigrant shares over the decades 1860–1920:13

1
T
T∑t=1
IctPopct
=1
T
T∑t=1
α1∆Ict−1
Popct−1× IRR
c,t−1
.
We estimate the effect of immigration on measures of long-term arts development using 1T
∑Tt=1
IctPopct
as an instrument for the average immigrant share in county c during the AMM. Formally, we esti-
mate the first- and second-stage equations given by equations (8) and (9).
(8) Avg Immig Sharec,s = α1
1
T
T∑t=1
IctPopct
+ Xc,sΠ + µs + νc,s
(9) Yc,s = β1Avg Immig Sharec,s + Xc,sΓ + µs + ξc,s
where c and s index counties and states. The vector Xct,s includes the interaction between av-
erage national GDP growth and connection to the railway 1T
∑Tt=1 α3∆GDPt−1 × IRR
c,t−1, where
α3 is the coefficient estimate in front of the ∆GDPt−1 × IRRc,t−1 term in the zero-stage equa-
tion. We are also concerned about the fact that the timing of connection to the railway may
directly affect long-term outcomes through industrialization. Thus, we control for average levels
of industrialization and connection to the railway on the predicted immigrant share in county c,
1T
∑Tt=1 α4Industrializationt−1×IRR
c,t−1. The term Industrializationt−1 is a measure of the average
annual level of industrialization between years t − 1 and t. Similar to α3, the coefficient α4 is the
coefficient in front of the Industrializationt−1 × IRRc,t−1 term in the zero-stage equation. We also
control for the duration of a county’s connection to the railway as of 2000 to allow for the effect
of early railway access on long-term outcomes. Finally, we also include polynomials for latitude
and longitude in Xct,s, in order to control for the correlation between the instrument and county
geographical characteristics.
5. Results
5.1. Short-term effects of immigration on native occupations. We first examine the impact
of immigration during the AMM on outcomes in the same period. In Table 2 we report estimates of
the effect of immigration on the share of natives working in arts-related occupations. The outcome
of interest is the share of native artists normalized by county population, i.e., YctPopct
= NActPopct
, where
NAct is the number of natives working in arts occupations in county c and period t.14

We report the OLS estimates in column (1) of Panel A in Table 2. The point estimate measuring
the effect of immigration on the share of native artists in a county is small and not statistically
different from zero. However, given the endogeneity concerns with the OLS specification that
would bias our estimates, we turn to our 2SLS estimation. We start with the first-stage results,
reported in Panel B of Table 2. Panel B reports estimates using both the shift-share instrument
(column (2)) and our preferred railway instrument (column (3)). We find that predicted immigrant
shares using both instruments are strongly correlated with actual immigrant shares. The shift-
share and railway instruments yield Kleibergen-Paap F-statistics of approximately 7.04 and 12.62,
respectively. The magnitude of the point estimate using the shift-share instrument suggests that a
one percentage point increase in the predicted immigrant share is associated with a 0.011 percentage
point increase in the actual average immigrant share. The magnitude of the point estimate using
the railway instrument suggests that a one percentage point increase in the predicted immigrant
share is associated with a 0.159 percentage point increase in the actual average immigrant share.
The second-stage estimates are reported in Panel A of Table 2. We again use the change in
the share of native artists in a county as our outcome of interest. Column (2) reports the 2SLS
estimates when using the shift-share instrument, and column (3) reports 2SLS estimates when using
the preferred railway instrument. According to the 2SLS estimates in columns (2) and (3), counties
with larger immigration inflows observe significantly larger increases in the share of native artists.
The magnitude of the column (2) coefficient suggests a one percentage point increase in the share
of immigrants will increase the share of native artists working in a county by 0.027 percentage
points. The estimated effect is statistically significant and is larger in magnitude than the OLS
estimate. To further alleviate concerns noted earlier with the shift-share instrument, we turn to
the results in column (3) using the railway instrument.9 The results from column (3) show that a
one percentage point increase in the share of immigrants in a county increases the share of native
artists in the same county by 0.075 percentage points, statistically significant at the 10% level.
While the magnitudes alone do not appear large, it is important to note that the change is quite
substantial relative to the average share of natives working as artists in this time period. During
the AMM, the creative arts economy was in its emerging stages. According to Census data, about
9The results in Appendix Table A.11 and Figure A.6 suggest that the shift-share instrument is not likely to besensitive to misspecification. In particular, we find that the individual instruments constructed for each sendingregion are concentrated around the overall Bartik instrument estimate, both for sending regions that receive greaterRotemberg weights as well as those that receive lesser Rotemberg weights (Goldsmith-Pinkham et al., 2020).
15

80% of county-year observations had no artists. The average share of natives working as artists
for all counties was 0.19%, and conditional on reporting any artists, the average share was 0.94%.
Altogether, the results suggest that immigration during the AMM had a significant effect on the
composition of native workers in the labor force in the short run, shifting many natives toward
occupations related to the arts.10
5.2. Long-term effects of immigration on arts development. Beyond outcomes during the
Age of Mass Migration, we also explore the persistent effects of immigration during that period on
arts institutions today. To study the long-term effects of immigration on the development of the
creative arts, we highlight how immigration from roughly a century ago has affected the prosperity
of arts communities in U.S. counties over the past few decades.
We first examine how immigration contributes to the establishment and presence of arts busi-
nesses in a county. To do this, we first use the CBP data and 6-digit NAICS code to count the
number arts businesses and employees in a county. Arts establishments (with NAICS codes from
7111 to 7121) include organizations related to a wide range of art activities. These businesses
include, theaters, dance studios, musical groups, and museums, among others. Arts employees
include individuals working in the types of establishments above, as well as agents, managers for
artists, and other public figures. We report estimates for the effect of immigration on the number
of arts businesses and employees of arts businesses in Table 3. The OLS estimate in column (1)
suggests that a one percentage point increase in the average historical immigrant share in a county
between 1860 and 1920 has contributed to 0.27 more arts businesses in a county in 2000, a 3.1%
increase relative to the mean. Column (2) in Panel B reports results from the first-stage when we
instead use our preferred railway instrument. The first stage results suggests that a one percentage
point increase in the average predicted immigrant share is associated with a 4.97 percentage point
increase in the actual historical immigrant share in a county. The Kleibergen Paap F-statistic is
28.2, indicating the strong predictive power of the instrument. Column (2) of Panel A reports the
second-stage estimate, which is larger in magnitude than the estimate in the OLS specification.
A one percentage point increase in the average historical immigrant share has contributed to 1.44
more arts businesses in a county, a 16.6% increase relative to the mean.
10We also test whether the effect of immigration on arts development in the short-term could be driven by certainlarge metropolitan areas such as Los Angeles and New York. To test the sensitivity of our results to these potentialoutliers, we re-run the main analysis and iterate through counties in our sample, omitting one county a time. Weplot the range of coefficients as well as the confidence intervals of these analyses in Figure A.1. The figure shows thatour estimates are not driven by any single county.
16
We also examine the effect of historical immigration on the number of employees in arts busi-
nesses, reported as a share of the county population. The results are reported in columns (3) and
(4) of Table 3. The OLS estimate in column (3) suggests that immigration during the AMM had a
positive effect on the share of employees in arts businesses today. A one percentage point increase in
the average historical immigrant share in a county contributes to a 0.008 percentage point increase
in share of employees in art businesses. The 2SLS estimate in column (4) suggests a larger effect
– a one percentage point increase in the average historical immigrant share contributes to a 0.046
percentage point increase in share of employees in art businesses. The OLS and 2SLS estimates are
equivalent to 3.0 and 17.0 percent increases relative to the mean, respectively.
In complement to the CBP data, we leverage the NCCS data that has aggregated information on
the universe of U.S-based nonprofits since 1987. These data also list organizations by their primary
cause, which allows us to identify organizations related to the arts. In Table 4, we report the results
from this analysis. Our outcome of interest for columns (1) and (2) is the average number of arts
nonprofits in a county per year. The OLS estimate in column (1) suggests that a one percentage
point increase in the average historical immigrant share in a county between 1860 and 1920 has
contributed to an increase of 1.25 more arts nonprofits in a county today. This effect is equivalent to
a 15.7 percent increase in the number of arts nonprofits in a county, relative to the mean. Column
(2) of Panel A reports the second-stage results using our preferred railway instrument, and describes
a positive effect of larger magnitude than estimated in the OLS specification. A one percentage
point increase in the average historical immigrant share has contributed to approximately 2.5 more
arts nonprofits in a county today. This effect is equivalent to over a 30% increase in the number of
arts nonprofits in a county today, relative to the mean.
Not only do the results suggest a greater presence of arts nonprofits in counties with greater
historical immigration, but subsequent analyses demonstrate that these institutions are successful
and contribute other positive benefits to the community. In these analyses, we proxy for the
prosperity of arts institutions through a few different measures. First, in columns (3) and (4) of
Table 4, we examine the average annual revenue that arts nonprofits receive. The results show
for every one percentage point increase in the average historical immigrant share in a county, arts
institutions earn 3.6 percent more in average revenue. Although the second-stage estimate in the
2SLS specification is no longer statistically significant, the point estimate remains consistent with
the OLS estimate.
17

To continue measuring the success of arts organizations, we use data on NEA grant recipients
over the past two decades. For our outcomes, we use the number NEA grant recipients in a county,
and the average value of those grant awards, in Table 5. In particular, the dependent variable in
columns (1) and (2) of Panel A is the log of the average number of NEA art grants in county c
between 1998 and 2020. The dependent variable in columns (3) and (4) of Panel A is the log of
the average art grant award amount in county c between 1998 and 2020.
The OLS estimates in columns (1) and (3) suggests that a one percentage point increase in
a county’s average immigrant share during the Age of Mass Migration has contributed to a 6.4
percent increase in the average number of NEA grants received by arts groups in that county; in
complement, the average value of NEA grant award amounts increases by 7.4 percent. Columns
(2) and (4) in Panel A report the second-stage estimates and suggest a larger long-term impact of
historical immigration than estimated in the OLS specification. The coefficients imply that if the
average immigrant share in a county during the Age of Mass Migration increases by one percentage
point, the average number of NEA grants awarded to art nonprofits in the same location increases
by 25 percent, and the average value of those NEA grants increases by 27 percent.
The long run results demonstrate the lasting effects of immigration during the AMM on arts
communities. Today, areas that received larger numbers of immigrants during the AMM have more
arts businesses and nonprofits. These businesses employ a larger share of the population, earn more
revenue, and have been awarded more NEA grants.11 Further, a consistent pattern across these
results is that the 2SLS estimates are larger than the OLS estimates. This pattern suggests that
the OLS estimates are biased downward, which would support the argument that immigrants faced
discrimination from natives. Immigrants may have been forced to settle in locations that previously
were less developed and likely had less growth potential with respect to the arts. Altogether, the
results regarding the positive growth of the creative arts industry, as well as the downward bias of the
OLS estimates, is consistent with prior work that highlights other long-term effects of immigration
into the United States during the Age of Mass Migration (Sequeira et al., 2020).
11Similar to our short-term results, we also test whether the effect of historical immigration on arts development inthe long-term could be driven by certain large metropolitan areas. Figures A.2-A.5 show that our estimates are notdriven by any single county.
18

6. Mechanisms
In this section, we describe analyses that explore possible mechanisms behind the impact of
immigration on the American cultural arts. Most of these results focus on short run outcomes. As
part of this exercise, we examine the effects of immigrant artists and non-artists separately, as well
as native outcomes split by children of immigrants (second-generation immigrants) and individuals
with longer families histories in America. We also consider the cultural influences of particular
sending regions, medium run outcomes, potential geographic spillover effects, and the robustness
of the long-term results to more recent migration patterns.
6.1. The impact of immigrant artists versus non-artists. The development of the creative
arts in America could have been driven primarily by immigrants working in arts occupations.
That is, immigrant artists could have shared particular artistic skills and methods with natives.
Alternatively, the effect of immigration on the arts could have been more expansive. The benefits
could have accrued simply due to regular interactions between different immigrant and native
cultures and customs, irrespective of whether immigrants worked in the arts. We examine which
channel may be more important in Table A.2. Compared to immigrants in non-arts work, migrant
artists appear to have a larger impact on growing the number natives working as artists. The 2SLS
point estimate in column (2) of Table A.2 shows that for every one percentage point increase in
the number of migrant artists in a county, the number of native artists in that location increases
by 0.544 percentage points. However, greater presences of both immigrant artists and non-artists
appear to increase the number of native artists in a county. The 2SLS point estimate in column
(4) of Table A.2 shows that for every one percentage point increase in the number of non-artist
migrants in a county, the number of native artists in that location increases by 0.028 percentage
points. While the latter estimate is much smaller in magnitude, the estimate is significant at the
10% level. We interpret these results as showing suggestive evidence that immigrant artists during
the AMM had a large effect on the development of the arts through direct knowledge transfers.
Yet, the result regarding non-immigrant artists suggests that immigration as a whole promoted
broader diversity and artistic tastes among natives.
6.2. Artists among second-generation and non-second-generation immigrants. In this
section, we explore whether certain native populations are more likely to choose arts-related occu-
pations. In particular, we consider whether natives from immigrant families (i.e., second generation19
immigrants) are more likely to be employed in the arts than immigrants from families with more
established roots in the United States. We study these different populations to better understand
whether arts interests came from within immigrant families or whether arts growth emerged from
other families.
We report the results of this analysis in Table A.3. The dependent variable in column (1) is the
share of the second-generation immigrant population that works in arts occupations. The dependent
variable in column (2) is the share of the non-second-generation immigrant population that is
employed in arts occupations. Our results suggest that immigration did not meaningfully impact
the share of second-generation immigrants working in arts occupations; instead, the results show
that immigration had a positive effect on non-second-generation natives. The coefficient is similar
to the 2SLS estimate provided in Table 2 when evaluating the aggregate impact of immigration.
These heterogeneous effects highlight how immigrants may have influenced arts growth beyond
their immediate families and instead through collaborations with natives.
6.3. The cultural influences of sending regions. If immigration helped boost native creativity
by exposing them to new experiences and ideas, we might expect to find a positive association
between region-specific immigrant shares for sending countries known for their originality in a
particular form of art, and the number of natives working in those specific creative fields. For
example, during the Age of Mass Migration, France was a leader in arts fields such as sculpture
and architecture (Lee, 2016; Widewalls, 2016). We might then expect U.S. counties with larger
numbers of French immigrants to also have larger numbers of natives working in sculpture and
architecture.
In Table A.4, we examine the association between French immigrants and native sculptors and
architects in a county in the short run. We also test for the association between sculptors and
architects and immigrants for a “placebo” European country, e.g., the United Kingdom, which
historically was less well-known for these forms of art (Causey et al., 2002; Chu, 2003). We conduct
a similar analysis with German and Austrian immigrants, but now looking at natives in music
occupations (Kralik et al., 1959). The estimates in column (1) and (2) of Table A.4 highlight that
French immigrant inflows to a county are positively and significantly associated with the number
of native sculptors and architects in the same location; meanwhile immigrant inflows from the
U.K. to a county are not significantly associated with the outcome. Turning to music, counties
with larger numbers of German and Austrian immigrants also have greater numbers of native20
musicians. Again, the share of U.K. immigrants in a county does not positively predict the number
of native employed as musicians (columns (3) and (4)). We take this evidence to further suggest
that immigration impacted native occupational choices in the short-term through the sharing of
cultural preferences and promoting new creative channels for natives.
6.4. Medium-term effects of immigration on arts development. We also provide estimates
of the impact of immigration in the medium-term, i.e., during the 1930’s, the decade following the
end of the Age of Mass Migration. This analysis mimics the empirical strategy used on long-term
outcomes. Our first outcome measures natives in arts occupations in 1940. We also examine Federal
Theatre Project (FTP) productions held between 1935-1939. Data for productions is included in the
Library of Congress’s FTP collection (Library of Congress, 2021). The FTP was one of multiple
arts-related New Deal programs enacted after the Great Depression in the United States. FTP
productions were intended to get struggling artists back to work, and to boost American morale.
The results described in Appendix Table A.5 show that a one percentage point increase in
the average immigrant share over the prior half century significantly increased the share of natives
working in the arts by 0.014 percentage points in 1940, an effect of approximately 7 percent relative
to the mean. The results also suggest that a greater number of Federal Theatre Project productions
were held in counties with greater average immigration over the prior half-century. These latter
effects regarding FTP plays are not statistically significant as we lack power to make meaningful
conclusions from this analysis. However, we interpret the qualitative results and the direction of
the coefficient estimates to be consistent with our main results.
6.5. Spillover effects. While our geographic unit of interest is the U.S. county, it is possible that
the effects of immigration on local arts development could broader in geographic scope. In order to
address this possibility, we investigate the spillover effects of immigration on arts development in
adjacent counties. We weight each neighboring county equally and include the average immigration
share among all neighboring counties in the OLS and 2SLS specifications. For the 2SLS approach,
we apply the average of the interaction between railway access and national immigration inflows
across all adjacent counties as an additional instrument to predict the average immigration share
among all the neighboring counties. The results are presented in Table A.6 and Table A.7. For the
short run results, we use the share of native artists as the outcome of interest. For the long run
results, we use the number of arts businesses and nonprofits as the outcome of interest. In both the21

short and long run, the effect of immigration on arts development in adjacent counties are small
and not statistically different from zero.
6.6. Migration effects beyond the Age of Mass Migration. In addition to the Age of Mass
Migration, the United States has experienced other significant domestic and international migration
over the past century. With respect to domestic migration, between 1920 and 1970 the United States
saw large numbers of Southern blacks leave the South and move to Northern cities during the Great
Migration (Collins, 2021). The United States has also experienced a Second Age of Mass Migration
over the past few decades, receiving a greater number of immigrants from Asia and Latin America
(Abramitzky et al., 2020). Each of these major population shifts could have impacted the long-run
development of American creative arts, independent of the impact of immigration during the Age
of Mass Migration.
Tables A.8, A.9, and A.10 test the robustness of the long run results reported in Tables 3, 4,
and 5, to the impact of these other significant migration events. To proxy for the potential effect
of the Great Migration on arts development, we include a control for the change in the black share
of a county’s population between 1920 and 1970. To proxy for the potential impact of recent
immigration waves, we include a measure for the immigrant share in a county as of 2000. Across
Tables A.8-A.10, we find that the long run results are not affected by the inclusion of controls for
other meaningful migration events.12
7. Conclusion
When immigrants arrive in new surroundings, they share a diversity of cultures, skills, and
experiences with their communities. These novel interactions between immigrants and natives
have led to important advances in many domains, including in the sciences. The creative arts is
another arena where several narratives have been written about the contributions of immigrants and
the profitable experiences of learning from, and working collaboratively with them. Yet for a sector
that accounts for roughly 4.5% of U.S. annual GDP, there has been limited systematic exploration
of the role that immigrants played in how the arts came to flourish in American society.
12We also note that during the Age of Mass Migration, natives may have moved to different locations within theUnited States as a response to immigrant resettlement in their communities. Such selective domestic migration couldbias our results. However as shown in Sequeira et al. (2020), the authors find no significant changes to internalmigration patterns of natives during the Age of Mass Migration.
22

In this paper, we explore the impact of immigration on the growth of the creative arts in the
United States. We focus on immigration during the Age of Mass Migration, a time when American
communities changed considerably as individuals were exposed to many new cultures and practices,
predominantly from Europe. By studying this particular migration event in American history, we
are able to examine both short and long run effects. In the short run, we focus on whether
immigrant inflows from the prior decade alter natives’ occupations in the subsequent decade. In
the long run, we focus on measures that describe the robustness of arts communities across America.
These measures include the total presence of arts nonprofits and businesses located in a county, the
revenue-generating ability of such organizations, and the number and value of federal grants awarded
to the arts institutions. To address potential identification concerns with using ordinary least
squares estimates, our preferred analysis adopts an instrumental variables strategy that leverages
the expansion of the railway network in the United States, and interacts it with national immigration
inflows across decades from 1860-1920 as an instrument for county-level immigration.
We find that immigration had a significant effect on native work during the Age of Mass Migra-
tion. Larger increases in immigrant inflows into a county led to significant shifts in native work
toward arts-related occupations. Over a century later, areas with greater historical immigration
also have larger arts presences today. These communities have more arts businesses and non-profit
organizations in their jurisdiction. These institutions employ a larger share of county populations,
generate more revenue, and receive a larger number of National Endowment of the Arts grants than
organizations in counties with less historical immigration. These effects appear to be larger when
we address concerns with endogeneity bias in where immigrants settled in the late 19th and early
20th century. The analysis suggests that immigrants were more likely to settle in areas with fewer
opportunities in the arts and generally worse economic conditions, likely due to discrimination from
natives.
By documenting the impact of immigration during the Age of Mass Migration on the arts, this
paper broadens our understanding of the arenas through which immigrants have shaped develop-
ment in the United States. Though we focus on the Age of Mass Migration, we do not suggest that
other waves of immigration or migration events did not influence American cultural arts. Immi-
grants from a diverse set of countries and regions have established roots across America throughout
the 20th and 21st century. Separately, major population movement within the United States, such
as the Great Migration, may have also influenced the cultural arts in the United States. We also
23

acknowledge that the definition of art continues to evolve, and therefore new forms of art have been
developed over the past century. We view our analysis as an initial exploration of the impact of
immigration on more traditional categories of art. Future work may explore the effects of migra-
tion outside of the AMM, as well as the impact of immigration on the development of newer or
particular forms of art over the past 150 years.
Overall, our results suggest that immigrants have made significant contributions to the early
growth, and continued success of the American creative arts economy. Much of our existing aca-
demic knowledge focuses on the role of immigration in advancing scientific innovation. Our paper
notes the equally significant impact that immigration has had on the development of American art.
As policymakers continue to review the rules on who should be prioritized to be able to resettle
in the United States, our results expand the set of domains through which immigrants have been
shown to contribute to American society. In particular, our findings suggest that it may be impor-
tant consider the contributions of immigrants to the American creative arts industry, which plays
a critical economic and cultural role in U.S. communities today.
24

References
Abramitzky, Ran and Leah Boustan, “Immigration in American Economic History,” Journal of EconomicLiterature, 2017, 55 (4), 1311–1345.
, , and Katherine Eriksson, “Do Immigrants Assimilate More Slowly Today Than in the Past?,”American Economic Review: Insights, 2020, pp. 125–141.
, Leah Platt Boustan, and Katherine Eriksson, “A Nation of Immigrants: Assimilation and EconomicOutcomes in the Age of Mass Migration,” Journal of Political Economy, 2014, 122 (3), 467–506.
Akcigit, Ufuk, John Grigsby, and Tom Nicholas, “Immigration and the Rise of American Ingenuity,” AmericanEconomic Review: Papers & Proceedings, 2017, 107 (5), 327–331.
Azoulay, Pierre, Benjamin Jones, J. Daniel Kim, and Javier Miranda, “Immigration and Entrepreneurshipin the United States,” 2020. NBER Working Paper No. 27778.
Borjas, George J. and Kirk B. Doran, “The Collapse of the Soviet Union and the Productivity of AmericanMathematicians,” Quarterly Journal of Economics, 2012, 127 (3), 1143–1203.
Borowiecki, Karol Jan, “The Origins of Creativity: The Case of the Arts in the United States since 1850,” WorkingPaper, 2019.
and Kathryn Graddy, “Immigrant Artist: Enrichment or Displacement,” Working Paper, 2018.Botella, Marion and Todd Lubart, “Creative Processes: Art, Design and Science,” in G.E. Corazza and S Ag-
noli, eds., Multidisciplinary Contributions to the Science of Creative Thinking, Springer Science+Business MediaSingapore, 2016, pp. 53–65.
Burchardi, Konrad B, Thomas Chaney, Tarek Alexander Hassan, Lisa Tarquinio, and Stephen J Terry,“Immigration, Innovation, and Growth,” Technical Report, National Bureau of Economic Research 2020.
Causey, Andrew, David Curtis, Gijs van Tuyl, and Richard Cork, Blast to Freeze: British Art in the 20thcentury, Hatje Cantz Pub, 2002.
Collins, William J., “The Great Migration of Black Americans from the US South: A Guide and Interpretation,”Explorations in Economic History, 2021.
Cotter, Sara, “Straddling the Atlantic: European Influences on the American Art of the Weir Family,” 2012.Daniels, Roger, Coming to America: A History of Immigration and Ethnicity in American Life, Harper Perennial,
2002.Doran, Kirk and Chungeun Yoon, “Immigration and Invention: Evidence from the Quota Acts,” Working Paper,
2020.Faulkner, Harold Underwood, American Economic History, Harper and Row Publishers, 1960.Foerster, Robert, The American Immigration Collection, Arno Press Inc., 1969.Furnham, Adrian, Mark Batey, Tom W. Booth, Vikita Patel, and Dariya Lozinskaya, “Individual Dif-
ference Predictors of Creativity in Art and Science Students,” Thinking Skills and Creativity, 2011, 6, 114–121.Glueck, Grace, “European Influences on Americans’ Views,” New York Times, 2004.Goldsmith-Pinkham, Paul, Isaac Sorkin, and Henry Swift, “Bartik Instruments: What, When, Why, and
How,” American Economic Review, 2020, 110 (8), 2586–2624.Hansumaker, James, “The Effects of Arts Education on Intellectual and Social Development: A Review of Selected
Research,” Bulletin of the Council for Research in Music Education, 1980, pp. 10–28.Hatton, Timothy J. and Jeffrey G. Williamson, Global Migration and the World Economy: Two Centuries of
Policy and Performance, MIT Press, 2005.Hirschman, Charles, “The Contributions of Immigrants to American Culture,” Daedalus, 2013, 142 (3), 26–47.Hunt, Jennifer and Marjolaine Gauthier-Loiselle, “How Much Does Immigration Boost Innovation?,” Ameri-
can Economic Journal: Macroeconomics, 2010, 2 (2), 31–56.Jaeger, David A, Joakim Ruist, and Jan Stuhler, “Shift-share Instruments and the Impact of Immigration,”
Technical Report, National Bureau of Economic Research 2018.Kerr, Sari Pekkala and William R. Kerr, “Immigrant Entrepreneurship in America: Evidence from the Survey
of Business Owners 2008 & 2012,” 2018. NBER Working Paper No. 24494.Kerr, William R and William F Lincoln, “The Supply Side of Innovation: H-1B Visa Reforms and US Ethnic
Invention,” Journal of Labor Economics, 2010, 28 (3), 473–508.Khanna, Gaurav and Munseob Lee, “High-Skill Immigration, Innovation, and Creative Destruction,” 2018.
NBER Working Paper No. 24824.Kralik, Heinrich, Othmar Wessely, and Beatrix Kempf, Austria: Land of Music, Press and Information
Service of the Austrian Government, 1959.Lee, Patina, “The Evolution of French Architecture,” 2016. Widewalls Magazine.Library of Congress, “About this Collection: Federal Theatre Project, 1935 to 1939,” 2021. Available from:
https://www.loc.gov/collections/federal-theatre-project-1935-to-1939/about-this-collection/.Miller, Angela L., Janet C. Berlo, Bryan J. Wolf, and Jennifer L. Roberts, American Encounters: Art,
25

History, and Cultural Identity, Washington University Libraries, 2008.Moser, Petra, Alessandra Voena, and Fabian Waldinger, “German Jewish Emigres and US Invention,”
American Economic Review, 2014, 104 (10), 3222–3255.and Shmuel San, “Immigration, Science, and Invention. Lessons from the Quota Acts,” Working Paper,
2020.National Center for Charitable Statistics, “Core File 1989-2013 Public Charities Fiscal Year Trend [data set],”
Urban Institute, 2020. Available from: http://nccs-data.urban.org.National Endowment for the Arts, “Artists and Other Cultural Workers: A Statistical Portrait,” National
Endowment For The Arts, 2019., “The U.S. Arts Economy (1998-2017): A National Summary Report,” National Endowment For The Arts,
2020., “Grant Database: Recent Grants [data set],” 2021. Available from: https://apps.nea.gov/grantsearch/.
Ottaviano, Gianmarco I.P. and Giovanni Peri, “The Economic Value of Cultural Diversity: Evidence from USCities,” Journal of Economic Geography, 2006, 6, 9–44.
Pareles, Jon, “Immigrants Created American Music. A New Festival Tells Their Stories,” New York Times, 2019.Ruggles, Steven, Sarah Flood, Ronald Goeken, Josiah Grover, Erin Meyer, Jose Pacas, and Matthew
Sobek, “IPUMS USA: Version 10.0 [data set],” 2020.Scheffler, Samuel, “Immigration and the Significance of Culture,” in “Nationalism and Multiculturalism in a World
of Immigration,” Springer, 2009, pp. 119–150.Secker, Jenny, Mick Loughran, Kirsten Heydinrych, and Lyn Kent, “Promoting Mental Well-being and
Social Inclusion Through Art: Evaluation of an Arts and Mental Health Project,” Arts & Health, 2011, pp. 51–60.Sequeira, Sandra, Nathan Nunn, and Nancy Qian, “Immigrants and the Making of America,” Review of
Economic Studies, 2020, 87, 382–419.Smith, Laura, Brieahn DeMeo, and Sunny Widmann, “Identity, Migration, and the Arts: Three Case Studies
of Translocal Communities,” The Journal of Arts Management, Law, and Society, 2011, 41 (3), 186–197.Tabellini, Marco, “Gifts of the Immigrants, Woes of the Natives: Lessons from the Age of Mass Migration,” The
Review of Economic Studies, 2020, 87 (1), 454–486.ten Doesschate Chu, Petra, Nineteenth-century European Art, Abrams, 2003.Widewalls, “French Art History,” 2016. Widewalls Magazine.Willcox, Walter F., International Migrations, Volume I: Statistics, National Bureau of Economic Research, 1929.
26

Table 1. Summary statistics
Historical railway network Counties CountiesWith Access Without Access
Mean Std. Dev. Mean Std. Dev.
Historical VariablesImmigration Inflow Share 0.09 0.10 0.08 0.13Native Artist Share 0.20% 0.55% 0.06% 0.44%
Contemporaneous VariablesArt Businesses 9.46 9.51 4.68 7.01Art Business Employees 439 4,767 252 2,232Art Nonprofits 8.92 37.76 3.54 20.99Avg. Art Nonprofits Revenue (in $ thousands) 26.70 75.40 35.18 79.92Arts Grants 36.94 260 30.22 231Avg. Arts Grant Value (in $ millions) 1.78 10.50 0.95 6.58
No. of Observations 2,465 301
Note: This table shows the summary statistics for the variables of interest. Historical variables measure countycharacteristics during the Age of Mass Migration and into the 1930’s. Contemporaneous variables measure countycharacteristics around the year 2000. Immigration inflow share and native artist share are calculated based on U.S.Census data. Arts businesses and their employees are drawn from the County Business Patterns. Art nonprofitsdata is from the NCCS, and arts grants data is from the NEA.
27

Table 2. Short run effects of immigration on natives working in arts occupations
(1) (2) (3)OLS 2SLS: Shift-share 2SLS: Lag Rail Access
x Lag Immigration Inflow
Panel A: OLS and 2SLS Dependent Variable: Native Artist Share
Immigrant Share -0.004 0.027*** 0.075*(0.003) (0.005) (0.043)
Mean of Dep. Var. 0.19% 0.19% 0.19%Std. Dev. of Dep. Var. 0.52% 0.52% 0.52%Observations 12,330 9,752 12,330
Panel B: First Stage Dependent Variable: Immigrant Share
Shift-share 0.011***(0.004)
Lag Rail Access 0.159***x Lag Immigration Inflow (0.044)Kleibergen Paap F-statistic 7.04 12.62
Controls (in all panels)Lag Rail Access Yes Yes YesLag Immigration Share Yes Yes YesLag Urbanization Dummy Yes Yes YesLog County Population Density Yes Yes YesLag Urbanization Dummy Yes Yes Yesx Lag Immigration Inflow ShareLag Rail Access Yes Yes Yesx Lag GDP GrowthPolynominal of Longitude Yes Yes YesPolynominal of Latitude Yes Yes YesCounty Fixed Effects Yes Yes YesYear Fixed Effects Yes Yes Yes
Note: This table shows the short run effects of immigration on the share of the native population working inarts-related jobs. Column (1) in panel A reports the OLS estimate. Columns (2) and (3) in panel A reports 2SLSestimates using the shift-share and the railway instruments. The variable “Native Artist Share” is the share of acounty’s population that is working in an arts-related occupation in period t. The variable “Immigrant Share” isthe share of a county’s population that is foreign-born in period t. Column (2) and (3) in panel B reports the firststage estimates. *** p<0.01, ** p<0.05, * p<0.1
28

Table 3. Long run effects of immigration on arts businesses
(1) (2) (3) (4)OLS 2SLS OLS 2SLS
Panel A: OLS and 2SLS Dependent Variable:No. of Businesses Employee Share
Avg. Immigrant Share 26.937*** 144.248*** 0.008*** 0.046*(3.184) (38.825) (0.003) (0.028)
Mean of Dep. Var. 8.681 8.681 0.27% 0.27%Std. Dev. of Dep. Var. 9.402 9.402 0.55% 0.55%Observations 2,934 2,934 2,933 2,933
Panel B: First Stage Dependent Variable: Avg. Immigrant Share
Lag Rail Access 4.97*** 4.97***x Lag Immigration Inflow (1.41) (1.41)Kleibergen Paap F-statistic 28.2 28.2
Controls (in all panels)Industrialization Predicted Immigration Yes Yes Yes YesBusiness Cycle Predicted Immigration Yes Yes Yes YesTotal Time Connected to Rail (as of 2000) Yes Yes Yes YesPolynomial for Latitude and Longitude Yes Yes Yes YesState Fixed Effects Yes Yes Yes Yes
Note: This table shows the long-term effects of immigration on arts businesses. Columns (1) and (2) in panel Areport OLS and 2SLS estimates using the logarithm number of arts organizations as the dependent variable.Columns (3) and (4) in panel A reports OLS and 2SLS estimates using logarithm average revenue of arts businessesas the dependent variable. The instrumental variable for the 2SLS estimation is the interaction between lag railwayaccess and lag immigration inflow share. The variable “Average Immigrant Share” is the average share of acounty’s population that is foreign-born between 1860-1920. Column (2) and (4) in panel B reports the first stageestimates. *** p<0.01, ** p<0.05, * p<0.1
29
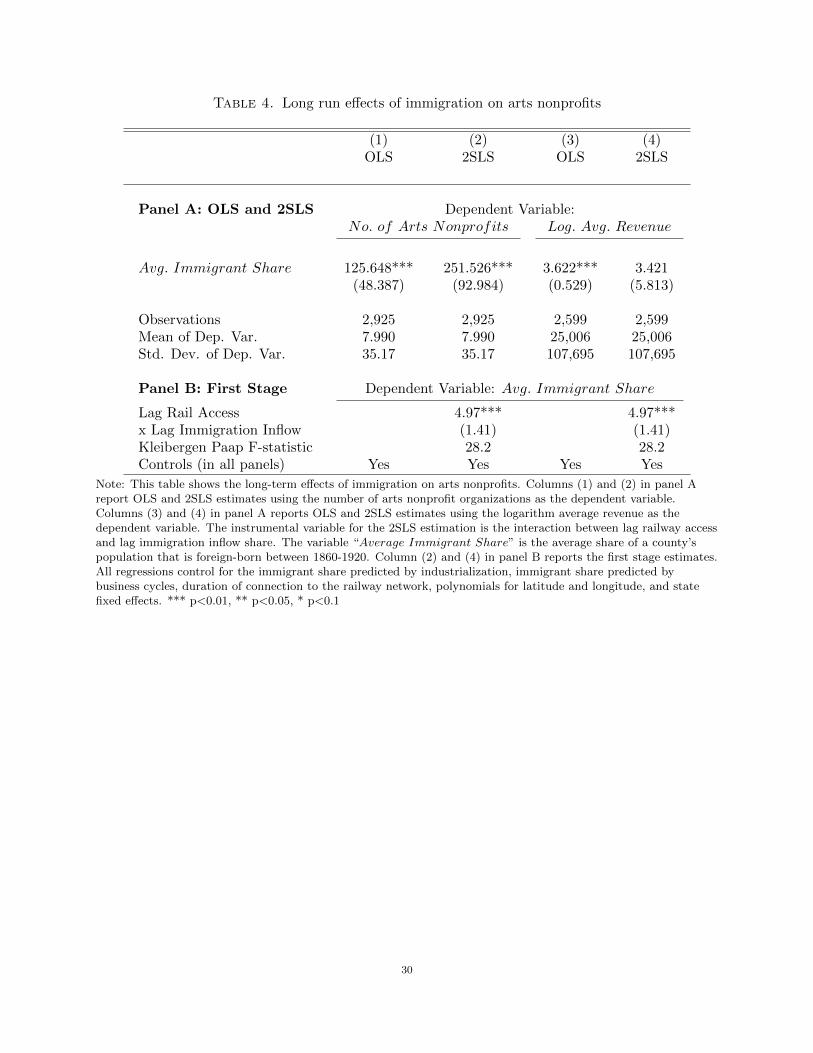
Table 4. Long run effects of immigration on arts nonprofits
(1) (2) (3) (4)OLS 2SLS OLS 2SLS
Panel A: OLS and 2SLS Dependent Variable:No. of Arts Nonprofits Log. Avg. Revenue
Avg. Immigrant Share 125.648*** 251.526*** 3.622*** 3.421(48.387) (92.984) (0.529) (5.813)
Observations 2,925 2,925 2,599 2,599Mean of Dep. Var. 7.990 7.990 25,006 25,006Std. Dev. of Dep. Var. 35.17 35.17 107,695 107,695
Panel B: First Stage Dependent Variable: Avg. Immigrant Share
Lag Rail Access 4.97*** 4.97***x Lag Immigration Inflow (1.41) (1.41)Kleibergen Paap F-statistic 28.2 28.2Controls (in all panels) Yes Yes Yes Yes
Note: This table shows the long-term effects of immigration on arts nonprofits. Columns (1) and (2) in panel Areport OLS and 2SLS estimates using the number of arts nonprofit organizations as the dependent variable.Columns (3) and (4) in panel A reports OLS and 2SLS estimates using the logarithm average revenue as thedependent variable. The instrumental variable for the 2SLS estimation is the interaction between lag railway accessand lag immigration inflow share. The variable “Average Immigrant Share” is the average share of a county’spopulation that is foreign-born between 1860-1920. Column (2) and (4) in panel B reports the first stage estimates.All regressions control for the immigrant share predicted by industrialization, immigrant share predicted bybusiness cycles, duration of connection to the railway network, polynomials for latitude and longitude, and statefixed effects. *** p<0.01, ** p<0.05, * p<0.1
30

Table 5. Long run effects of immigration on arts grants
(1) (2) (3) (4)OLS 2SLS OLS 2SLS
Panel A: OLS and 2SLS Dependent Variable:Log No. of Grants Log Avg. Grant Amount
Avg. Immigrant Share 6.381*** 25.158** 7.435*** 26.625**(0.903) (10.117) (1.094) (12.589)
Mean of Dep. Var. 35.45 35.45 1.69M 1.69MStd. Dev. of Dep. Var. 250.4 250.4 10M 10MObservations 1,353 1,353 1,353 1,353
Panel B: First Stage Dependent Variable Avg. Immigrant Share
Lag Rail Access 4.97*** 4.97***x Lag Immigration Inflow (1.41) (1.41)Kleibergen Paap F-statistic 28.2 28.2Controls (in all panels) Yes Yes Yes Yes
Note: This table shows the long-term effects of immigration on arts grants. Columns (1) and (2) in panel A reportOLS and 2SLS estimates using the logarithm number of NEA arts grants as the dependent variable. Columns (3)and (4) in panel A reports OLS and 2SLS estimates using the logarithm number of average arts grant value as thedependent variable. The instrumental variable for the 2SLS estimation is the interaction between lag railway accessand lag immigration inflow. The variable “Average Immigrant Share” is the average share of a county’spopulation that is foreign-born between 1860-1920. Column (2) and (4) in panel B reports the first stage estimates.All regressions control for the immigrant share predicted by industrialization, the immigrant share predicted bybusiness cycles, duration of connection to the railway network, polynomials for latitude and longitude, and statefixed effects. *** p<0.01, ** p<0.05, * p<0.1
31

Note: The red dotted line shows immigration inflows as a share of the total U.S. population during the Age of Mass
Migration. The blue solid line shows the share of native artists as a share of the total U.S. population. Data is
drawn from the IPUMS USA Census 1% sample in 1860, 1870, 1880, 1900, 1910, and 1920.
Figure 1. Immigration & Native Artists Shares during the Age of Mass Migration
32

Appendix A: Tables and Figures
Table A.1. Immigrant regions of origin
Regions Percent of Migrants in 1860 Percent of Migrants in 1920
Central and South America 0.6% 2.3%Northern Europe 1.2% 5.9%Western Europe 27% 39%Southern Europe 0.1% 1.4%Central Europe 0.1% 13%Asia 0.7% 1.5%Africa 0.1% 0.2%Canada 3.9% 5.0%U.K. 8.5% 3.7%Germany 22% 6.4%Ireland 30% 4.3%France 2.1% 0.6%Scotland 1.9% 1.1%Italy 0.2% 7.3%Spain 0.1% 0.3%Switzerland 0.9% 0.5%Russia 0.1% 7.1%All Countries 100% 100%
Note: This table shows the relative share of immigration from each region in 1860 and 1920. Data is drawn fromthe IPUMS USA Census data 1% sample in 1860 and 1920.
33

Table A.2. Effects of migrant artists vs. migrant non-artists on natives in artsoccupations
(1) (2) (3) (4)Migrant Artists Migrant Non− artists
OLS 2SLS: Lag Rail Access OLS 2SLS: Lag Rail Accessx Lag Immigration Inflow x Lag Immigration Inflow
Panel A: OLS and 2SLS Dependent variable: Native Artist Share
Immigrant Share 0.031 0.544* -0.004 0.028*(0.085) (0.310) (0.003) (0.016)
Observations 12,330 12,330 12,330 12,330Mean of Dep. 0.19% 0.19% 0.19% 0.19%Std.Dev. of Dep. 0.52% 0.52% 0.52% 0.52%
Panel B: First Stage Dependent variable:Migrant Artist Share Migrant Non− artist Share
Lag Rail Access 0.021* 0.431***x Lag Immigration Inflow (0.012) (0.159)Kleibergen Paap F-statistic 3.19 7.30
Controls (in all panels) Yes Yes Yes Yes
Note: This table shows the effects of migrant artists and migrant non-artists separately on natives working in artsoccupations. Column (1) in panel A reports the OLS estimate. Columns (2) and (3) in panel A reports the 2SLSestimates using the -share and the railway instruments. The variable “Native Artist Share” is the share of acounty’s population that is working in an arts-related occupation in period t. Column (2) and (4) in panel Breports the first stage estimates. All regressions control for lag railway access, lag immigration share, lagurbanization dummy, log county population density, lag urbanization dummy × lag immigration inflow share, lagrailway access × lag GDP growth, polynomials for latitude and longitude, as well as county and year fixed effects.*** p<0.01, ** p<0.05, * p<0.1
34

Table A.3. Heterogeneous effects on populations working in art occupations
(1) (2)2SLS: Lag Rail Access 2SLS: Lag Rail Access
x Lag Immigration Inflow x Lag Immigration Inflow
Dependent Variable: 2nd− generation Non 2nd− generationNative Artist Share Native Artist Share
Immigrant Share -0.012 0.087**(0.014) (0.042)
Mean of Dep. Var. 0.04% 0.13%Std. Dev. of Dep. Var. 0.23% 0.48%Observations 12,330 12,330
Controls Yes Yes
Note: This table reports 2SLS estimates of the heterogeneous effects of immigration on native artists on twopopulations, 2nd-generation immigrants and non native populations that are not 2nd generation immigrants. Weusing our preferred railway instrument for this analysis. The variable in column (1)“2nd− generation Artist Share” is the share of a county’s population that is a second-generation immigrant andworking in an arts-related occupation. The variable in column (2) “Non 2nd− generation Native Artist Share” isthe share of a county’s population that is not a second-generation immigrant and working in an arts-relatedoccupation. All regressions control for lag railway access, lag immigration share, lag urbanization dummy, log countypopulation density, lag urbanization dummy × lag immigration inflow share, lag railway access × lag GDP growth,polynomials for latitude and longitude, as well as county and year fixed effects. *** p<0.01, ** p<0.05, * p<0.1
35

Table A.4. Country specific effects
(1) (2) (3) (4)OLS 2SLS: Shift-share OLS 2SLS: Shift-share
Panel A: OLS and 2SLS Dependent Variable:No. of Sculptors & Architects No. of Musicians
French Immigrants 0.477*** 0.544***(0.156) (0.073)
Austrian & 0.010 0.078*German Immigrants (0.009) (0.045)
UK Immigrants -0.025 -0.124* -0.020** 0.009(0.019) (0.075) (0.009) (0.023)
Mean of Dep. Var. 0.068 0.068 0.240 0.240Std. Dev. of Dep. Var. 0.824 0.824 1.393 1.393Observations 12,330 9,604 12,330 9,604
Panel B: First Stage Dependent Variable:French Immigrants Austrian & German Immigrants
Shift-share 0.705*** 0.904***(0.250) (0.059)
Kleibergen Paap F-statistic 13.22 22.28Controls (in all panels) Yes Yes Yes Yes
Note: This table shows the short-run country specific effects of immigration. Columns (1) and (2) in panel A reportOLS and 2SLS estimates using the number of sculptors and architects as the dependent variable, and columns (3)and (4) using the number of musicians as the dependent variable. The instrumental variable for the 2SLSestimation is the shift-share instrument. Column (2) and (4) in panel B reports the first stage estimates.Regressions control for lag railway access, lag immigration share, lag urbanization dummy, log county populationdensity, lag urbanization dummy × lag immigration inflow share, lag railway access × lag GDP growth,polynomials for latitude and longitude, as well as county and year fixed effects. *** p<0.01, ** p<0.05, * p<0.1
36

Table A.5. Medium-term effects of immigration on arts development
(1) (2)2SLS 2SLS
Year: 1930-1940
Panel A: 2SLS Dependent Variable:Native Artists Share No. of P lays
Avg. Immigrant Share 0.014** 3.126(0.007) (6.789)
Mean of Dep. Var. 0.20% 0.137Std. Dev. of Dep. Var. 0.494% 1.732Observations 2,902 2,935
Panel B: First Stage Dependent Variable: Avg. Immigrant Share
Lag Rail Access 4.97*** 4.97***x Lag Immigration Inflow (1.41) (1.41)Kleibergen Paap F-statistic 28.2 28.2Controls (in all panels) Yes Yes
Note: This table reports the medium-term effects of immigration on the creative arts in America. Panel A reports2SLS estimates using the native artist share, number of Federal Theatre Project plays as the dependent variables.The instrumental variable for the 2SLS estimation is the interaction between lag railway access and lag immigrationinflows. All regressions control for the immigrant share predicted by industrialization, immigrant share predicted bybusiness cycles, duration of connection to the railway network, polynomials for latitude and longitude, and statefixed effects. *** p<0.01, ** p<0.05, * p<0.1
37

Table A.6. Short run spillover effects of immigration on share working in art oc-cupations
(1) (2)OLS 2SLS: Lag Rail Access
x Lag Immigration Inflow
Dependent variable: Native Artist Share
Immigrant Share -0.005 0.075*(0.003) (0.043)
Avg. Adjacent Co. Immigrant Share 0.002 0.001(0.003) (0.003)
Mean of Dep. 0.19% 0.19%Std. Dev. of Dep. 0.52% 0.52%Observations 12,330 7,760
Controls (in all panels) Yes Yes
Note: This table reports the short-term spillover effects of immigration on natives working in arts-relatedoccupations. Column (1) reports the OLS estimate. Columns (2) reports 2SLS estimates using the interactionbetween lag railway access and lag immigration flow share as an instrument for immigrant share. The variables“Immigrant Share” and “Avg. Adjacent Co. Immigrant Share” are the share of foreign-born individuals in acounty and the average share in its adjacent counties, respectively. All regressions control for lag railway access, lagimmigration share, lag urbanization dummy, log county population density, lag urbanization dummy × lagimmigration flow share, the interaction between lag railway access and lag GDP growth, polynomials for latitudeand longitude, as well as county and year fixed effects. *** p<0.01, ** p<0.05, * p<0.1
38

Table A.7. Long run spillover effects of immigration on number of art businessesand nonprofits
(1) (2) (3) (4)OLS 2SLS OLS 2SLS
Dependent variable:No. of Businesses No. of Arts Nonprofits
Avg. Immigrant Share 31.386*** 134.111*** 6.259*** 16.992**(4.235) (46.408) (0.807) (8.139)
Avg. Adjacent Immigrants Share -10.457* 26.378 -2.526** 4.983(5.891) (54.968) (0.106) (10.949)
Mean of Dep. Var. 8.681 8.681 231.5 231.5Std. Dev. of Dep. Var. 9.402 9.402 1,020 1,020Observations 2,934 2,934 2,621 2,621
Controls (in all panels) Yes Yes Yes Yes
Note: This table shows the long-term spillover effects of immigration on the presence of the arts in counties.Columns (1) and (2) report OLS and 2SLS estimates using the logarithm number of art businesses as the dependentvariable. Columns (3) and (4) reports OLS and 2SLS estimates using the logarithm number of arts nonnonprofits asthe dependent variable. The instrument variable for the 2SLS estimation is the interaction between lag railwayaccess and lag immigration flow. The variables ”Avg. Immigrant Share” and “Avg. Adjacent Immigrants Share”are the average share that is foreign-born between 1860-1920 in a county and in its adjacent counties, respectively.All regressions control for the immigrant share predicted by industrialization, immigrant share predicted bybusiness cycles, polynomials for latitude and longitude, and state fixed effects. *** p<0.01, ** p<0.05, * p<0.1
39

Table A.8. Long-run effects of immigration on art businesses
(1) (2) (3) (4)OLS 2SLS OLS 2SLS
Panel A: OLS and 2SLS Dependent Variable:No. of Businesses Employee Share
Avg. Immigrant Share 16.495*** 165.230*** 0.005** 0.035(3.213) (40.956) (0.002) (0.030)
Mean of Dep. Var. 8.681 8.681 0.27% 0.27%Std. Dev. of Dep. Var. 9.402 9.402 0.55% 0.55%Observations 2,934 2,934 2,933 2,933
Panel B: First Stage Dependent Variable: Immigrant Share
Lag Rail Access 4.95*** 4.95***x Lag Immigration Flow (0.88) (0.88)Kleibergen Paap F-statistic 27.06 27.06
Controls (in all panels)Industrialization Predicted Immigration Yes Yes Yes YesBusiness Cycle Predicted Immigration Yes Yes Yes YesTotal Time Connected to Rail (as of 2000) Yes Yes Yes YesPolynomials for Latitude and Longitude Yes Yes Yes YesState Fixed Effects Yes Yes Yes Yes∆ Share Black 1920-1970 Yes Yes Yes YesImmigrant Share in 2000 Yes Yes Yes Yes
Note: This table shows the long-term effects of immigration on arts businesses. Columns (1) and (2) in panel Areport OLS and 2SLS estimates using the logarithm number of art organizations as the dependent variable.Columns (3) and (4) in panel A reports OLS and 2SLS estimates using the logarithm average revenue of artorganizations as the dependent variable. The instrumental variable for the 2SLS estimation is the interactionbetween lag railway access and lag immigration inflow share. The variable “Avg. Immigrant Share” is the averageshare of a county’s population that is foreign-born between 1860-1920. Column (2) and (4) in panel B report thefirst stage estimates. *** p<0.01, ** p<0.05, * p<0.1
40

Table A.9. Long-run effects of immigration on arts nonprofits
(1) (2) (3) (4)OLS 2SLS OLS 2SLS
Panel A: OLS and 2SLS Dependent Variable:No. of Arts Nonprofits Log. Revenue
Avg. Immigrant Share 75.127** 257.551*** 2.602*** 5.026(38.222) (90.834) (0.533) (5.453)
Observations 2,925 2,925 2,599 2,599Mean of Dep. Var. 7.990 7.990 25,006 25,006Std. Dev. of Dep. Var. 35.17 35.17 107,695 107,695
Panel B: First Stage Dependent Variable: Immigrant Share
Lag Rail Access 4.95*** 4.95***x Lag Immigration Inflow (0.88) (0.88)Kleibergen Paap F-statistic 27.06 27.06
Controls (in all panels)Industrialization Predicted Immigration Yes Yes Yes YesBusiness Cycle Predicted Immigration Yes Yes Yes YesTotal Time Connected to Rail (as of 2000) Yes Yes Yes YesPolynomials for Latitude and Longitude Yes Yes Yes YesState Fixed Effects Yes Yes Yes Yes∆ Share Black 1920-1970 Yes Yes Yes YesImmigrant Share in 2000 Yes Yes Yes Yes
Note: This table shows the long-term effects of immigration on arts nonprofits and their revenue. Columns (1) and(2) in panel A report OLS and 2SLS estimates using number of arts nonprofits as the dependent variable. Columns(3) and (4) in panel A reports OLS and 2SLS estimates using logarithm average revenue as the dependent variable.The instrumental variable for the 2SLS estimation is the interaction between lag railway access and lag immigrationflow share. The variable “Avg. Immigrant Share” is the average share of a county’s population that is foreign-bornbetween 1860-1920. Column (2) and (4) in panel B report the first stage estimates. *** p<0.01, ** p<0.05, * p<0.1
41

Table A.10. Long-run effects of immigration on art grants
(1) (2) (3) (4)OLS 2SLS OLS 2SLS
Panel A: OLS and 2SLS Dependent Variable:Log. No. of Grants Log. Avg. Grant Amount
Avg. Immigrant Share 3.190*** 28.868*** 3.733*** 30.432***(0.755) (9.561) (0.942) (11.473)
Mean of Dep. Var. 35.45 35.45 1.69M 1.69MStd. Dev. of Dep. Var. 250.4 250.4 10M 10MObservations 1,353 1,353 1,353 1,353
Panel B: First Stage Dependent Variable: Immigrant Share
Lag Rail Access 4.95*** 4.95***x Lag Immigration inflow (0.88) (0.88)Kleibergen Paap F-statistic 27.06 27.06
Controls (in all panels)Industrialization Predicted Immigration Yes Yes Yes YesBusiness Cycle Predicted Immigration Yes Yes Yes YesTotal Time Connected to Rail (as of 2000) Yes Yes Yes YesPolynomials for Latitude and Longitude Yes Yes Yes YesState Fixed Effects Yes Yes Yes Yes∆ Share Black 1920-1970 Yes Yes Yes YesImmigrant Share in 2000 Yes Yes Yes Yes
Note: This table shows the long-term effects of immigration on NEA arts grants. Columns (1) and (2) in panel Areport OLS and 2SLS estimates using the logarithm number of art grants as the dependent variable. Columns (3)and (4) in panel A reports OLS and 2SLS estimates using the logarithm average arts grant amount as thedependent variable. The instrumental variable for the 2SLS estimation is the interaction between lag railway accessand lag immigration flow. The variable “Avg. Immigrant Share” is the average share of a county’s population thatis foreign-born between 1860-1920. Column (2) and (4) in panel B report the first stage estimates. *** p<0.01, **p<0.05, * p<0.1
42

Table A.11. Summary of Rotemberg weights
Panel A: Negative and Positive Weights
Sum Mean Share
Negative -0.037 -0.018 0.034Positive 1.037 0.069 0.966
Panel B: Correlations of Sending Region Aggregatesαk gk βk Fk Var(zk)
αk 1gk 0.987 1βk 0.133 0.086 1Fk 0.524 0.435 0.200 1Var(zk) 0.095 0.029 0.329 0.249 1
Panel C: Top 5 Rotemberg Weight Sending Regions
αk gk βk 95 % CI
Western Europe 0.443 24979.299 0.026 (0.020,0.030)Central Europe 0.129 7628.373 0.022 (0.020,0.040)Germany 0.099 2983.658 0.026 (0.020,0.030)Italy 0.108 5425.910 0.026 (0.020,0.030)Russia 0.089 6318.998 0.024 (0.020,0.020)
Panel D: Estimates of βk for Positive and Negative Weightsα-weighted Sum Share of overall β Mean
Negative 0.000 0.006 -0.192Positive 0.026 0.994 0.027
Note: This table summarizes information regarding the Rotemberg weights for our shift-share instrument. Wefollow Goldsmith-Pinkham et al. (2020) to calculate these statistics. The five sending regions that received thelargest α weights are: Western Europe, Central Europe, Italy, Germany, and Russia.
43

Table A.12. Relationship between origin region immigrant shares and county char-acteristics
West Europe Central Europe Germany Italy Russia Bartik IV
Share Female -0.038 0.006 -0.062 -0.050 -0.037 -4.202(0.005) (0.008) (0.006) (0.009) (0.008) (1.102)
Share Black 0.004 0.012 0.001 0.014 0.002 0.213(0.001) (0.002) (0.001) (0.002) (0.002) (0.279)
GDP Growth 0.009 0.005 0.012 0.010 0.007 -0.845x Rail Access (0.003) (0.005) (0.004) (0.006) (0.006) (0.735)Rail Access -0.003 -0.005 -0.005 -0.007 -0.003 -0.219
(0.001) (0.001) (0.001) (0.001) (0.001) (0.193)Log County Population Density 0.009 0.007 0.007 0.012 0.009 0.848
(0.000) (0.000) (0.000) (0.000) (0.000) (0.031)Urbanization Index 0.002 0.000 0.005 -0.002 -0.004 -0.097
(0.001) (0.002) (0.001) (0.002) (0.002) (0.279)Urbanization Index -0.137 -0.110 -0.131 -0.165 -0.113 1.827x Immigration Inflow Share (0.014) (0.022) (0.016) (0.023) (0.023) (3.022)
R2 0.56 0.28 0.41 0.43 0.30 0.28N 4612 4612 4612 4612 4612 4612
Note: This table reports correlations between 1860 county characteristics and county shares of immigrants fromparticular regions of origin in 1860. Results are weighted by 1860 county level population. Standard errors arereported in parentheses.
44

Note: This figure plots the coefficients and 95% confidence intervals (CI) by dropping one county a time.
Figure A.1. Short run effects on native artists, omitting one county at a time
45

Note: This figure plots the coefficients and 95% confidence intervals (CI) by dropping one county a time.
Figure A.2. Long run effects on arts businesses, omitting one county at a time
46

Note: This figure plots the coefficients and 95% confidence intervals (CI) by dropping one county a time.
Figure A.3. Long run effects on arts nonprofits, omitting one county at a time
47
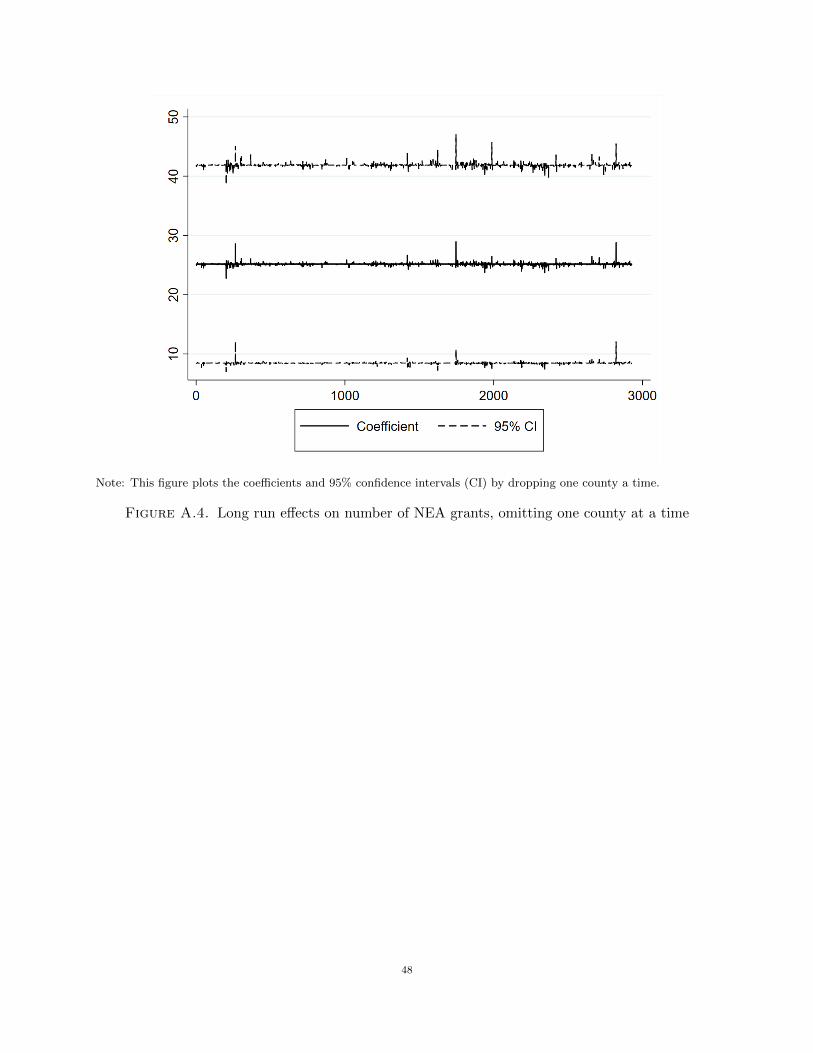
Note: This figure plots the coefficients and 95% confidence intervals (CI) by dropping one county a time.
Figure A.4. Long run effects on number of NEA grants, omitting one county at a time
48

Note: This figure plots the coefficients and 95% confidence intervals (CI) by dropping one county a time.
Figure A.5. Long run effects on average NEA grant amount, omitting one countyat a time
49

-.4-.3
-.2-.1
0.1
β k e
stim
ate
0 50 100 150 200First stage F-statistic
Positive Weights Negative Weights
Note: This figure plots the relationship between the first-stage F-statistics, the Rotemberg weights, and the value
for each sending region instrument βk, following Goldsmith-Pinkham et al. (2020). Each plotted point is a separate
instrument estimate. The estimated βk for each instrument is plotted on the y-axis, while the estimated first-stage
F-statistic for each instrument is plotted on the x-axis. The size of the shape (diamond or circle) defines the
magnitude of the Rotemberg weights, with circles denoting positive Rotemberg weights and diamonds denoting
negative weights. The horizontal dashed line represents the value of the overall β when using Bartik instrument.
Figure A.6. Heterogeneity of βk
50