enteric disease in ottawa, 2011
TRANSCRIPT
Enteric Disease in Ottawa 2011
613-580-6744 ottawa.ca/health TTY: 613-580-9656
Acknowledgements
This report has been written by
Lindsay Whitmore, Epidemiologist, Epidemiology Section, Ottawa Public Health
We would also like to thank the following Ottawa Public Health staff who contributed to the report
Amira Ali, Senior Epidemiologist, Ottawa Public Health
Brenda MacLean and the Outbreak Management Team
Cameron McDermaid, Epidemiologist, Ottawa Public Health
Members of the Health Status Steering Committee: Dr. Vera Etches, Siobhan Kearns,
Esther Moghadam, John Steinbachs, Orhan Hassan, Amira Ali and Angèle Beaulieu
Special thanks go to the following peer reviewer for her technical advice and review
Sherri Deamond, MHSc, Epidemiologist, Durham Region Health Department
Editor
Chris Mercer, Adhawk Communications Inc.
Please use the following citation when referencing this document
Ottawa Public Health. Enteric Disease in Ottawa 2011. Ottawa (ON): Ottawa Public Health; 2011.
For additional copies of the report, please visit ottawa.ca/health.
For further information, please contact Amira Ali at 613-580-6744, extension 23484 or [email protected]
Design
Adhawk Communications Inc.
Ottawa Public Health | Enteric Disease in Ottawa 2011
Contents
Reportable enteric illness in Ottawa ..............................................................................................1
Summary of findings.....................................................................................................................1
Guide to this report .........................................................................................................................3
Data presentation ..........................................................................................................................4
Data sources ...................................................................................................................................5
Data limitations.............................................................................................................................6
Amebiasis..........................................................................................................................................7
Botulism .........................................................................................................................................10
Campylobacter enteritis.................................................................................................................11
Cholera ...........................................................................................................................................14
Cryptosporidiosis...........................................................................................................................15
Cyclosporiasis.................................................................................................................................19
Giardiasis........................................................................................................................................22
Hepatitis A......................................................................................................................................25
Listeriosis........................................................................................................................................29
Paratyphoid fever ..........................................................................................................................32
Salmonellosis .................................................................................................................................34
Shigellosis.......................................................................................................................................39
Typhoid fever .................................................................................................................................43
Verotoxin-producing E. coli ..........................................................................................................46
Yersiniosis.......................................................................................................................................49
Glossary ..........................................................................................................................................52
ottawa.ca/health | [email protected] | 613-580-6744 | TTY: 613-580-9656 i

Contents
Figures
Figure 1: Reported cases (% of all cases) of enteric illness, Ottawa, 2010 ...........................................2
Figure 2: Incidence per 100,000 of amebiasis by year,
Ottawa and the rest of Ontario, 2001–2010..................................................................... 8
Figure 3: Incidence per 100,000 of amebiasis by age and sex, Ottawa, 2010......................................8
Figure 4: Number of reported cases of amebiasis by month, Ottawa, 2010........................................9
Figure 5: Incidence per 100,000 of Campylobacter enteritis by year,
Ottawa and the rest of Ontario, 2001–2010................................................................... 12
Figure 6: Incidence of Campylobacter enteritis by age and sex, Ottawa, 2010...................................12
Figure 7: Number of reported cases of Campylobacter enteritis by month, Ottawa, 2010 ................13
Figure 8: Incidence per 100,000 of cryptosporidiosis by year,
Ottawa and the rest of Ontario, 2001–2010 .......................................................................16
Figure 9: Incidence of cryptosporidiosis by age and sex, Ottawa, 2010............................................16
Figure 10: Number of reported cases of cryptosporidiosis by month, Ottawa, 2010 .......................17
Figure 11: Incidence per 100,000 of cyclosporiasis by year,
Ottawa and the rest of Ontario, 2001–2010 .....................................................................20
Figure 12: Incidence per 100,000 of cyclosporiasis by age and sex, Ottawa, 2010...........................20
Figure 13: Number of reported cases of cyclosporiasis by month, Ottawa, 2010 .............................21
Figure 14: Incidence per 100,000 of giardiasis by year,
Ottawa and the rest of Ontario, 2001–2010 .....................................................................23
Figure 15: Incidence per 100,000 of giardiasis by age and sex, Ottawa, 2010 ..................................23
Figure 16: Number of reported cases of giardiasis by month, Ottawa, 2010 ....................................24
Figure 17: Incidence per 100,000 of hepatitis A by year,
Ottawa and the rest of Ontario, 2001–2010 .....................................................................26
Figure 18: Incidence per 100,000 of hepatitis A by age and sex, Ottawa, 2010................................26
Figure 19: Number of reported cases of hepatitis A by month, Ottawa, 2010..................................27
Figure 20: Incidence per 100,000 of listeriosis by year,
Ottawa and the rest of Ontario, 2001–2010 .....................................................................30
Figure 21: Incidence per 100,000 of listeriosis by age and sex,
Ottawa, 2006–2010 (5-year incidence)..............................................................................30
Ottawa Public Health | Enteric Disease in Ottawa 2011 ii

Contents
Figure 22: Incidence per 100,000 of paratyphoid fever by year,
Ottawa and the rest of Ontario, 2001–2010 .....................................................................33
Figure 23: Incidence per 100,000 of salmonellosis by year,
Ottawa and the rest of Ontario, 2001–2010 .....................................................................35
Figure 24: Incidence per 100,000 of salmonellosis by age and sex, Ottawa, 2010 ...........................35
Figure 25: Number of reported cases of salmonellosis by month, Ottawa, 2010 .............................36
Figure 26: Incidence per 100,000 of shigellosis by year,
Ottawa and the rest of Ontario, 2001–2010 .....................................................................40
Figure 27: Incidence per 100,000 of shigellosis by age and sex, Ottawa, 2010.................................40
Figure 28: Number of reported cases of shigellosis by month, Ottawa, 2010...................................41
Figure 29: Incidence per 100,000 of typhoid fever by year,
Ottawa and the rest of Ontario, 2001–2010 .....................................................................44
Figure 30: Incidence per 100,000 of typhoid fever by age and sex,
Ottawa, 2006–2010 (5-year incidence)..............................................................................44
Figure 31: Incidence per 100,000 of verotoxin-producing E. coli by year,
Ottawa and the rest of Ontario, 2001–2010 .....................................................................47
Figure 32: Incidence per 100,000 of verotoxin-producing E. coli by age and sex,
Ottawa, 2006–2010 (5-year mean) ....................................................................................47
Figure 33: Number of reported cases of verotoxin-producing E. coli by month, Ottawa, 2010.......48
Figure 34: Incidence per 100,000 of yersiniosis by year,
Ottawa and the rest of Ontario, 2001–2010 .....................................................................50
Figure 35: Incidence per 100,000 of yersiniosis by age and sex, Ottawa, 2010 ................................50
Figure 36: Number of reported cases of yersiniosis by month, Ottawa, 2010 ..................................51
Tables
Table 1: 2010 summary for amebiasis...................................................................................................7
Table 2: 2010 summary for Campylobacter enteritis ...........................................................................11
Table 3: 2010 summary for cryptosporidiosis ....................................................................................15
Table 4: Exposure source for reported cases of cryptosporidiosis, Ottawa, 2010 ..............................17
Table 5: Exposure setting for reported cases of cryptosporidiosis, 2010............................................18
Table 6: 2010 summary for cyclosporiasis ..........................................................................................19
ottawa.ca/health | [email protected] | 613-580-6744 | TTY: 613-580-9656 iii

Contents
Table 7: 2010 summary for giardiasis .................................................................................................22
Table 8: 2010 summary for hepatitis A...............................................................................................25
Table 9: Exposure source for reported cases of hepatitis A, Ottawa, 2010.........................................27
Table 10: Exposure setting for reported cases of hepatitis A, Ottawa, 2010......................................28
Table 11: 2010 summary for listeriosis ...............................................................................................29
Table 12: 2010 summary for paratyphoid fever .................................................................................32
Table 13: 2010 summary for salmonellosis ........................................................................................34
Table 14: Reported cases of salmonellosis by serotype,
Ottawa, 2010 and 5-year average (2005–2009) ..................................................................36
Table 15: Exposure source for reported cases of salmonellosis, Ottawa, 2010 ..................................37
Table 16: Exposure setting for reported cases of salmonellosis, 2010 ...............................................38
Table 17: 2010 summary for shigellosis..............................................................................................39
Table 18: Number of reported cases of shigellosis by agent,
Ottawa, 2010 and 5-year mean (2005–2009) .....................................................................41
Table 19: Exposure source for reported cases of shigellosis, Ottawa, 2010 .......................................42
Table 20: Exposure setting for reported cases of shigellosis, 2010.....................................................42
Table 21: 2010 summary for typhoid fever ........................................................................................43
Table 22: Exposure source for reported cases of typhoid fever, Ottawa, 2010 ..................................45
Table 23: Exposure setting for reported cases of typhoid fever, 2010................................................45
Table 24: 2010 summary for verotoxin-producing E. coli (VTEC) .....................................................46
Table 25: Exposure source for reported cases of verotoxin-producing E. coli, Ottawa, 2010............48
Table 26: Exposure setting for reported cases of verotoxin-producing E. coli, 2010.........................48
Table 27: 2010 summary for yersiniosis .............................................................................................49
Table 28: Exposure source for reported cases of yersiniosis, Ottawa, 2010 .......................................51
Table 29: Exposure setting for reported cases of yersiniosis, 2010 ....................................................51
Ottawa Public Health | Enteric Disease in Ottawa 2011 iv

Reportable enteric illness in Ottawa
This report is one of a series of health status reports published by Ottawa Public Health. These
comprehensive reports are an important part of the public health mandate to report on population
health status and provide the evidence necessary to identify trends and health issues of public
health significance in Ottawa. Local evidence helps tailor planning and decision making to
enhance the health of the Ottawa population.
The purpose of this particular report is to provide surveillance data about reportable enteric
(intestinal) diseases in Ottawa. The data support the Ontario Public Health Standards requirement
to conduct surveillance on infectious diseases and drinking water illnesses of public health
importance, their associated risk factors, and emerging trends. The Ontario Public Health
Standards’ goals related to enteric illness include:
• To prevent or reduce the burden of infectious diseases of public health importance
• To prevent or reduce the burden of foodborne illness
• To prevent or reduce the burden of waterborne illness related to drinking water
• To prevent or reduce the burden of waterborne illness and injury related to recreational water use
Enteric illnesses are transmitted primarily through ingestion of contaminated food and water.
However, they can also be transmitted person-to-person or animal-to-person through direct or
fecal-oral contact. Typical symptoms include diarrhea, nausea, vomiting and fever. Young children,
the elderly and people with suppressed immune systems are more likely to develop serious
complications, but serious complications can also occur in young, healthy adults.
Most cases of enteric diseases are mild. However, even mild disease can cause lost productivity and
other related costs. Severe cases can result in hospitalization, serious chronic conditions, or death.
In Ontario, for example, Escherichia coli is estimated to have caused an average of 600 deaths and
resulted in more than 450,000 cases of illness requiring medical attention (Ontario Burden of
Infectious Disease Study, 2010).
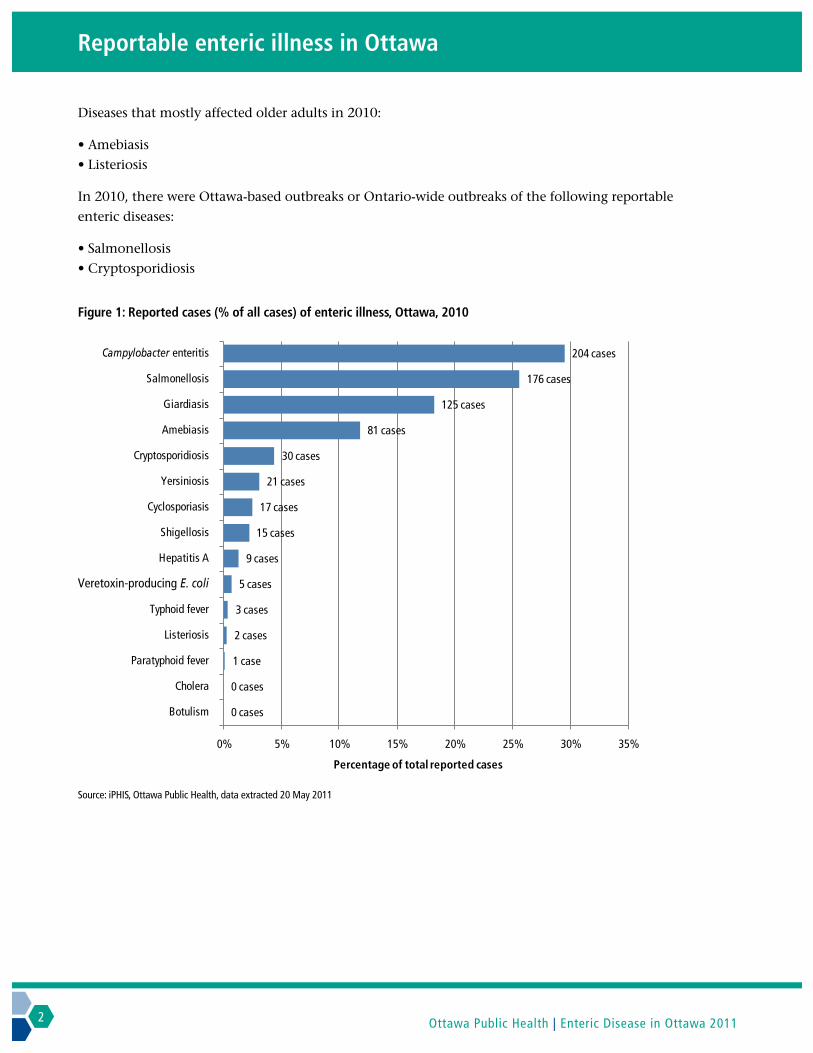
Summary of findings There were 689 cases of reportable enteric illness in Ottawa in 2010. The most commonly reported
were Campylobacter enteritis (n=204), salmonellosis (n=176), giardiasis (n=125) and amebiasis
(n=81).
Compared with the previous five years, the incidence of cryptosporidiosis and cyclosporiasis is
increasing, and fewer cases of Campylobacter enteritis and verotoxin-producing E. coli (VTEC)
were reported.
Diseases that mostly affected children under age 5 in 2010:
• Cryptosporidiosis
• Giardiasis
• Salmonellosis
• Shigellosis
• Verotoxin-producing E. coli (VTEC)
ottawa.ca/health | [email protected] | 613-580-6744 | TTY: 613-580-9656 1
Reportable enteric illness in Ottawa
Diseases that mostly affected older adults in 2010:
• Amebiasis
• Listeriosis
In 2010, there were Ottawa-based outbreaks or Ontario-wide outbreaks of the following reportable
enteric diseases:
• Salmonellosis
• Cryptosporidiosis
Figure 1: Reported cases (% of all cases) of enteric illness, Ottawa, 2010
Campylobacter enteritis
Salmonellosis
Giardiasis
Amebiasis
Cryptosporidiosis
Yersiniosis
Cyclosporiasis
Shigellosis
Hepatitis A
Veretoxin-producing E. coli
Typhoid fever
Listeriosis
Paratyphoid fever
Cholera
Botulism 0 cases
0 cases
1 case
2 cases
3 cases
5 cases
9 cases
15 cases
17 cases
21 cases
30 cases
81 cases
125 cases
176 cases
204 cases
0% 5% 10% 15% 20% 25% 30% 35%
Percentage of total reported cases
Source: iPHIS, Ottawa Public Health, data extracted 20 May 2011
Ottawa Public Health | Enteric Disease in Ottawa 2011 2

Guide to this report
This report includes all enteric illnesses defined as reportable in the Infectious Disease Protocol of
the Ontario Public Health Standards.
Gastrointestinal outbreaks in institutions such as hospitals and long-term care homes are reportable
and are investigated by Ottawa Public Health, even if they are caused by diseases that are not
otherwise reportable (e.g., norovirus, rotavirus and Clostridium difficile). Information on some of
these diseases in the institutional setting is available online at www.health.gov.on.ca/patient_safety.
These outbreaks are outside the scope of this report.
Community outbreaks, if reported by a member of the public, are also investigated regardless of
the causative agent. Because community outbreak investigation relies on public reporting, many
outbreaks likely go unreported. As such, community outbreaks are not discussed in this report
unless they were caused by reportable diseases.
For further details on the organisms mentioned in this report, the diseases they cause and the
provincial case definitions, see the Ontario Public Health Standards, Infectious Disease Protocol 2009.
Appendix A, at www.health.gov.on.ca/english/providers/program/pubhealth/oph_standards/ophs/
progstds/idprotocol/appendixa/appendix_a.pdf, provides details on organisms and the diseases they
cause. Appendix B, at www.health.gov.on.ca/english/providers/program/pubhealth/oph_standards/
ophs/progstds/idprotocol/appendixb/appendix_b.pdf, provides provincial case definitions.
ottawa.ca/health | [email protected] | 613-580-6744 | TTY: 613-580-9656 3

Guide to this report
Data presentation The report provides epidemiological data on 15 enteric illnesses occurring in Ottawa. For each
illness, data are presented as follows:
Summary table
These “at a glance” tables highlight epidemiological indicators such as number of cases, overall
incidence, male and female incidence, and age at time of illness. The five-year average summarizes
data from 2005 to 2009 and provides a benchmark for a 2010 comparison.
Incidence by year, Ottawa and the rest of Ontario, 2001–2010
This figure compares the incidence of disease in Ottawa with the rest of Ontario over a 10-year
period (where available). Incidence from the rest of Ontario was calculated by subtracting the
number of Ottawa cases from the total number of Ontario cases. Please note that the “rest of
Ontario rate” is not the same as the overall rate for the whole province, as it does not include
Ottawa. Any significant changes over time are discussed in the text.
Incidence by age and sex, Ottawa, 2010
This figure compares the incidence of disease in each of five age groups (0–4, 5–19, 20–39, 40–59,
60+) and by sex (male and female). Any significant differences are discussed in the text. Where case
numbers per year are low, incidence data will state cases per five years instead.
Number of reported cases by month, Ottawa, 2010
Some enteric illnesses have a seasonal pattern. The figure includes a 95% confidence interval for a
five-year mean by month to demonstrate the expected case numbers for that month. These data are
not included for all diseases, namely those with low annual numbers.
Exposure source
The means of transmission (e.g., foodborne, waterborne, person-to-person).
Exposure setting
The environment in which the exposure occurred. This is only reported if case investigations were
done and exposure data is available for enough cases to give a representation.
Ottawa Public Health | Enteric Disease in Ottawa 2011 4

Guide to this report
Data sources All of the Ottawa data included in this report were extracted from iPHIS (integrated Public Health
Information System), which is a secure province-wide, integrated data and surveillance system
required for reporting and managing communicable diseases and outbreaks in Ontario. iPHIS was
implemented in Ontario in 2005 and replaced RDIS (Reportable Disease Information System). Pre
2005 data were migrated from the RDIS database to iPHIS to facilitate historical comparisons.
Provincial data were also extracted from iPHIS by the Ontario Ministry of Health and Long-Term
Care and made available to public health units on the public health portal
(www.publichealthontario.ca—password required).
The data entered into iPHIS are obtained from laboratory reports, hospital reports, physician
interviews and in-depth interviews with cases.
ottawa.ca/health | [email protected] | 613-580-6744 | TTY: 613-580-9656 5

Guide to this report
Data limitations For the most part, surveillance for these diseases is based on laboratory reporting. To be reported
to Ottawa Public Health, cases must seek medical attention and provide stool samples for testing.
Some of these diseases tend to end without treatment; hence not all affected individuals seek
medical attention. Research suggests that for every reported case of salmonellosis, between 13 and
37 cases go unreported (Thomas MK et al. Estimated numbers of community cases of illness due to
Salmonella, Campylobacter and verotoxigenic Escherichia coli: Pathogen-specific community rates.
The Canadian Journal of Infectious Diseases & Medical Microbiology 2006;17(4):229-234). As a result,
this report may under-represent actual incidence of some illnesses.
Ottawa Public Health | Enteric Disease in Ottawa 2011 6
Amebiasis Entamoeba histolytica
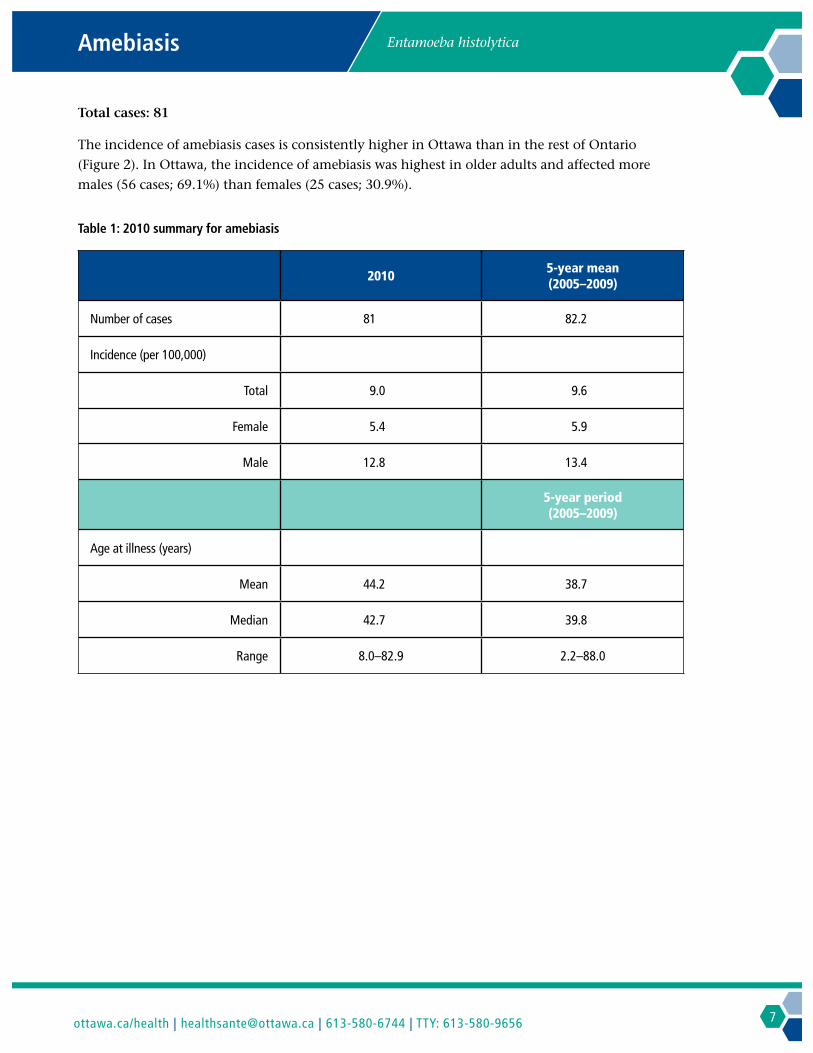
Total cases: 81
The incidence of amebiasis cases is consistently higher in Ottawa than in the rest of Ontario
(Figure 2). In Ottawa, the incidence of amebiasis was highest in older adults and affected more
males (56 cases; 69.1%) than females (25 cases; 30.9%).
Table 1: 2010 summary for amebiasis
2010 5-year mean (2005–2009)
Number of cases 81 82.2
Incidence (per 100,000)
Total 9.0 9.6
Female 5.4 5.9
Male 12.8 13.4
5-year period (2005–2009)
Age at illness (years)
Mean 44.2 38.7
Median 42.7 39.8
Range 8.0–82.9 2.2–88.0
ottawa.ca/health | [email protected] | 613-580-6744 | TTY: 613-580-9656 7

Amebiasis
Figure 2: Incidence per 100,000 of amebiasis by year, Ottawa and the rest of Ontario, 2001–2010
120
2001 2002 2003 2004 2005 2006 2007 2008 2009 2010
Ottawa cases 70 85 61 68 69 68 91 105 78 81
Ottawa incidence rate 8.7 10.4 7.4 8.2 8.2 8.0 10.6 12.3 8.8 9.0
Rest of Ontario incidence rate 7.0 6.5 6.2 5.1 5.9 5.1 6.0 5.4 5.3
Num
ber
of c
ases
Year
14
12100
10 80
8
60
6
40 4
20 2
0 0
Inci
denc
e pe
r 10
0,00
0
Source: iPHIS, Ottawa Public Health, data extracted 20 May 2011 Data note: 2010 rest of Ontario incidence rate is not reported due to a change in case definition
Figure 3: Incidence per 100,000 of amebiasis by age and sex, Ottawa, 2010
25
00 20
er 1
00,0
15
Inci
denc
e p
10
5
0 0–4 5–19 20–39 40–59 60+
Female 0.0 3.9 8.2 5.2 4.4
Male 0.0 5.1 11.5 17.5 19.3
Age
Source: iPHIS, Ottawa Public Health, data extracted 20 May 2011
8 Ottawa Public Health | Enteric Disease in Ottawa 2011

Amebiasis
Figure 4: Number of reported cases of amebiasis by month, Ottawa, 2010
Jan Feb Mar Apr May Jun Jul Aug Sep Oct Nov Dec
2010 cases 9 10 6 7 5 4 7 5 12 4 4 8
5-year mean (2005–2009) 5.8 8.4 7.4 7.2 7.8 5.6 7.6 7.2 7.8 7.6 5.6 4.2
0
2
4
6
8
10
12
14
Num
ber o
f cas
es
Month
Source: iPHIS, Ottawa Public Health, data extracted 20 May 2011
Exposure source and settings for amebiasis
Summary exposure information is unavailable.
ottawa.ca/health | [email protected] | 613-580-6744 | TTY: 613-580-9656 9

Botulism Clostridium botulinum
Total cases: 0
Botulism is a rare disease. The last case in Ottawa was reported in 2005. Prior to that, there were
two cases from the same household reported in 1991. In all of Ontario, only one case was reported
in 2010. Typically, fewer than five cases are reported annually in all of Ontario.
Ottawa Public Health | Enteric Disease in Ottawa 2011 10

Campylobacter enteritis Campylobacter jejuni and Campylobacter coli
Total cases: 204
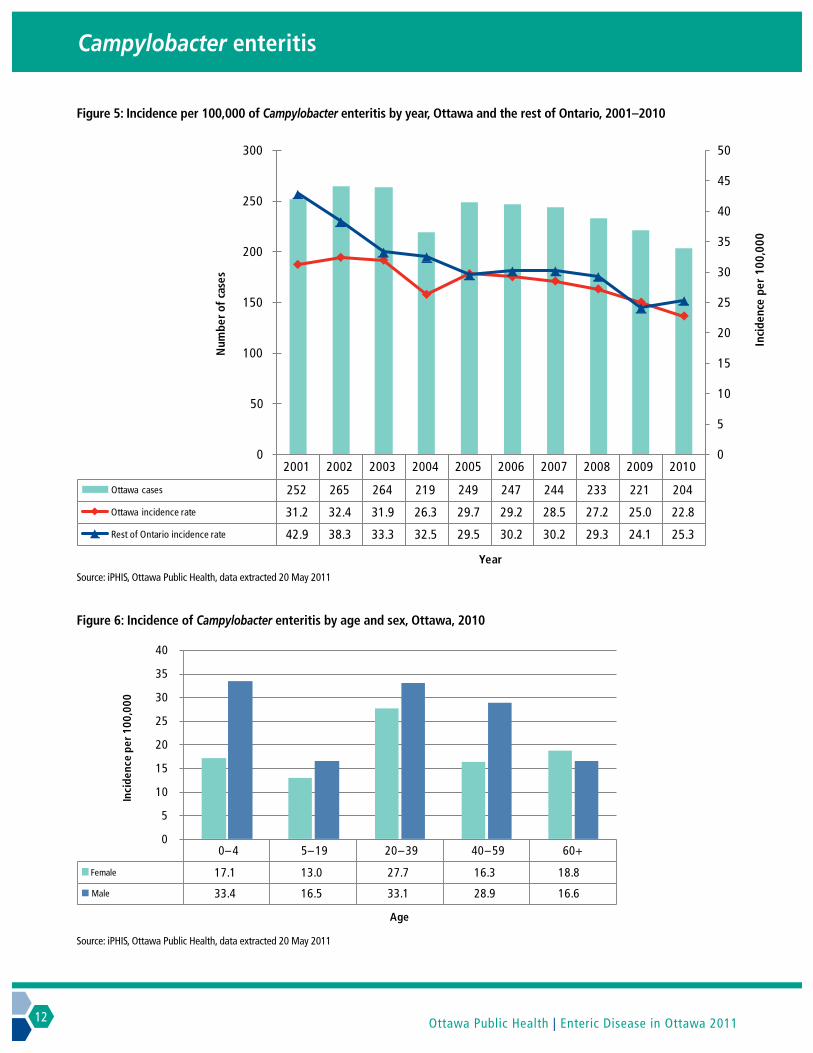
Campylobacter enteritis is the most commonly reported enteric illness in Ottawa. However, its
incidence has decreased in Ottawa and the rest of Ontario since 2001.
Campylobacter enteritis cases typically peak in July, August and September. The illness affects all age
groups although the incidence is slightly higher in males than females.
Table 2: 2010 summary for Campylobacter enteritis
2010 5-year mean (2005–2009)
Number of cases 204 238.8
Incidence (per 100,000)
Total 22.8 27.9
Female 19.6 25.4
Male 26.1 30.3
5-year period (2005–2009)
Age at illness (years)
Mean 37.8 38.8
Median 35.5 37.2
Range <1–98 <1–92.9
ottawa.ca/health | [email protected] | 613-580-6744 | TTY: 613-580-9656 11
Campylobacter enteritis
Figure 5: Incidence per 100,000 of Campylobacter enteritis by year, Ottawa and the rest of Ontario, 2001–2010
300
Source: iPHIS, Ottawa Public Health, data extracted 20 May 2011
Figure 6: Incidence of Campylobacter enteritis by age and sex, Ottawa, 2010
2001 2002 2003 2004 2005 2006 2007 2008 2009 2010
Ottawa cases 252 265 264 219 249 247 244 233 221 204
Ottawa incidence rate 31.2 32.4 31.9 26.3 29.7 29.2 28.5 27.2 25.0 22.8
Rest of Ontario incidence rate 42.9 38.3 33.3 32.5 29.5 30.2 30.2 29.3 24.1 25.3
Num
ber o
f cas
es
Year
50
45
250 40
35 200
40
30
25
20
15
10
5
0
Inci
denc
e pe
r 10
0,00
0
150
100
50
0
35
00
30
100,
0
25
20
ence
per
15
Inci
d
10
5
0 0–4 5–19 20–39 40–59 60+
Female 17.1 13.0 27.7 16.3 18.8
Male 33.4 16.5 33.1 28.9 16.6
Age
Source: iPHIS, Ottawa Public Health, data extracted 20 May 2011
Ottawa Public Health | Enteric Disease in Ottawa 2011 12

Campylobacter enteritis
Figure 7: Number of reported cases of Campylobacter enteritis by month, Ottawa, 2010
Jan Feb Mar Apr May Jun Jul Aug Sep Oct Nov Dec
2010 cases 11 15 17 14 14 18 18 29 20 24 13 11
5-year mean (2005–2009) 16.8 15.0 17.6 16.8 19.4 24.0 27.6 26.8 27.6 19.8 17.0 10.4
0
5
10
15
20
25
30
35
40
Num
ber o
f cas
es
Month
Source: iPHIS, Ottawa Public Health, data extracted 20 May 2011
Exposure source and settings for Campylobacter enteritis
Summary exposure information is unavailable.
ottawa.ca/health | [email protected] | 613-580-6744 | TTY: 613-580-9656 13

Cholera Vibrio cholerae
Total cases: 0
Cholera is a rare disease in Ottawa. Only six cases have been reported in Ottawa since
1991. Cholera is typically acquired while travelling outside of Canada in countries where
uncontaminated food and water are not always available. There were no cases of cholera reported
in all of Ontario in 2010 and, typically, fewer than three cases are reported annually.
Ottawa Public Health | Enteric Disease in Ottawa 2011 14

Cryptosporidiosis Cryptosporidium
Total cases: 30
Cryptosporidiosis cases have been increasing gradually since 2001. In 2010, the highest number
in 10 years was reported. The increase is primarily in the 20 to 39 year age group. However, overall
incidence is highest in 0–4 year olds.
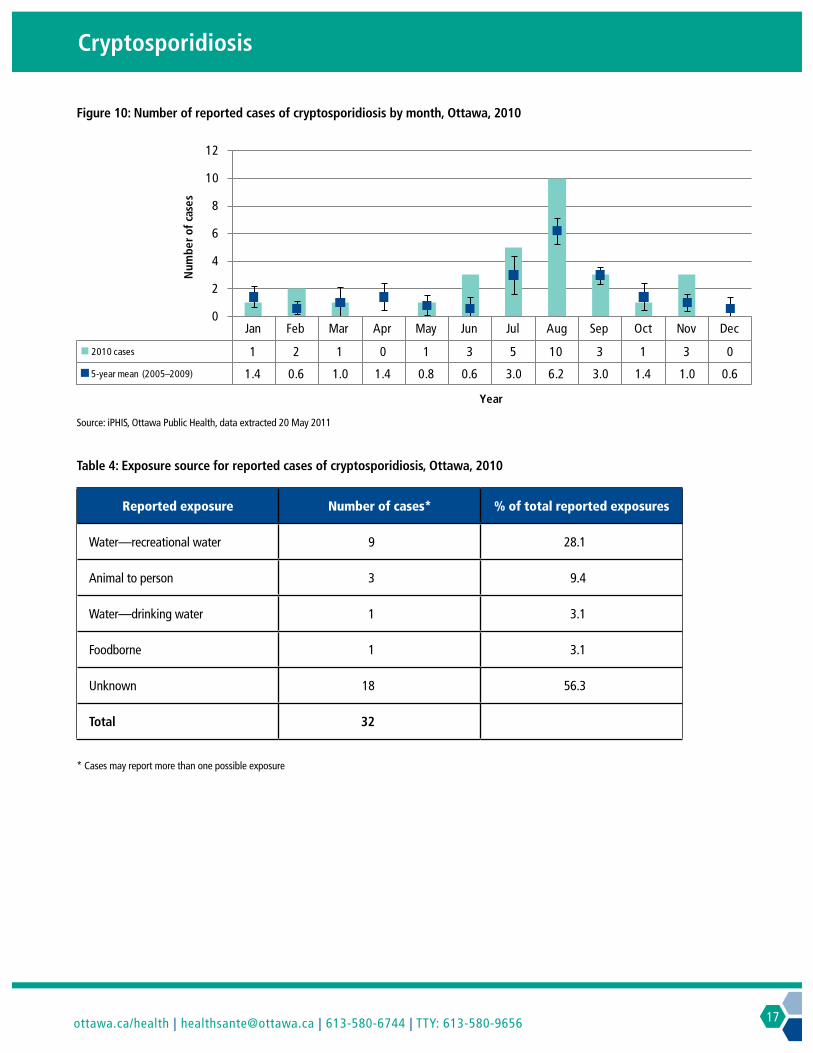
Cryptosporidiosis occurs seasonally and typically peaks in August.
In October 2010, there was an outbreak of cryptosporidiosis among students at the Veterinary
Technician Program at the Seneca College campus in King City. There was one Ottawa case related
to this outbreak.
In those cases where the setting was known, the most commonly reported setting for contracting
cryptosporidiosis was travel outside of Canada (50%).
Table 3: 2010 summary for cryptosporidiosis
2010 5-year mean (2005–2009)
Number of cases 30 21
Incidence (per 100,000)
Total 3.3 2.5
Female 3.9 2.6
Male 2.8 2.3
5-year period (2005–2009)
Age at illness (years)
Mean 25.4 20.9
Median 23.6 20.1
Range < 1–56.8 <1–81.4
ottawa.ca/health | [email protected] | 613-580-6744 | TTY: 613-580-9656 15

Cryptosporidiosis
Figure 8: Incidence per 100,000 of cryptosporidiosis by year, Ottawa and the rest of Ontario, 2001–2010
35
Source: iPHIS, Ottawa Public Health, data extracted 20 May 2011
Figure 9: Incidence of cryptosporidiosis by age and sex, Ottawa, 2010
2001 2002 2003 2004 2005 2006 2007 2008 2009 2010
Ottawa cases 8 17 19 12 16 20 25 23 21 30
Ottawa incidence rate 1.0 2.1 2.3 1.4 1.9 2.4 2.9 2.7 2.4 3.3
Rest of Ontario incidence rate 2.2 1.9 2.3 2.5 2.1 3.2 3.2 2.6 2.4 2.2
Num
ber o
f cas
es
Year
4.0
3.5 30
3.0 25
2.5
14
20
15
10
5
0
2.0
1.5
1.0
0.5
0.0
Inci
denc
e pe
r 10
0,00
0
12
,000
10
er 1
00
8
p
6
ncid
ence
4
I
2
0 0–4 5–19 20–39 40–59 60+
Female 12.8 5.2 6.7 1.5 0.0
Male 8.4 1.3 3.8 3.1 0.0
Age
Source: iPHIS, Ottawa Public Health, data extracted 20 May 2011
Ottawa Public Health | Enteric Disease in Ottawa 2011 16
Cryptosporidiosis
Figure 10: Number of reported cases of cryptosporidiosis by month, Ottawa, 2010
Jan Feb Mar Apr May Jun Jul Aug Sep Oct Nov Dec
2010 cases 1 2 1 0 1 3 5 10 3 1 3 0
5-year mean (2005–2009) 1.4 0.6 1.0 1.4 0.8 0.6 3.0 6.2 3.0 1.4 1.0 0.6
0
2
4
6
8
10
12
Num
ber o
f cas
es
Year
Source: iPHIS, Ottawa Public Health, data extracted 20 May 2011
Table 4: Exposure source for reported cases of cryptosporidiosis, Ottawa, 2010
Reported exposure Number of cases* % of total reported exposures
Water—recreational water 9 28.1
Animal to person 3 9.4
Water—drinking water 1 3.1
Foodborne 1 3.1
Unknown 18 56.3
Total 32
* Cases may report more than one possible exposure
ottawa.ca/health | [email protected] | 613-580-6744 | TTY: 613-580-9656 17

Cryptosporidiosis
Table 5: Exposure setting for reported cases of cryptosporidiosis, 2010
Reported exposure setting Number of cases* % of total reported exposure settings
Travel—outside of Canada 12 37.5
Travel—within Ontario, outside Ottawa 5 15.6
Other 3 9.4
Private home 2 6.3
Farm 1 3.1
Restaurant 1 3.1
Unknown 8 25.0
Total 32
* Cases may report more than one possible exposure
Ottawa Public Health | Enteric Disease in Ottawa 2011 18
Cyclosporiasis Cyclospora cayetanensis
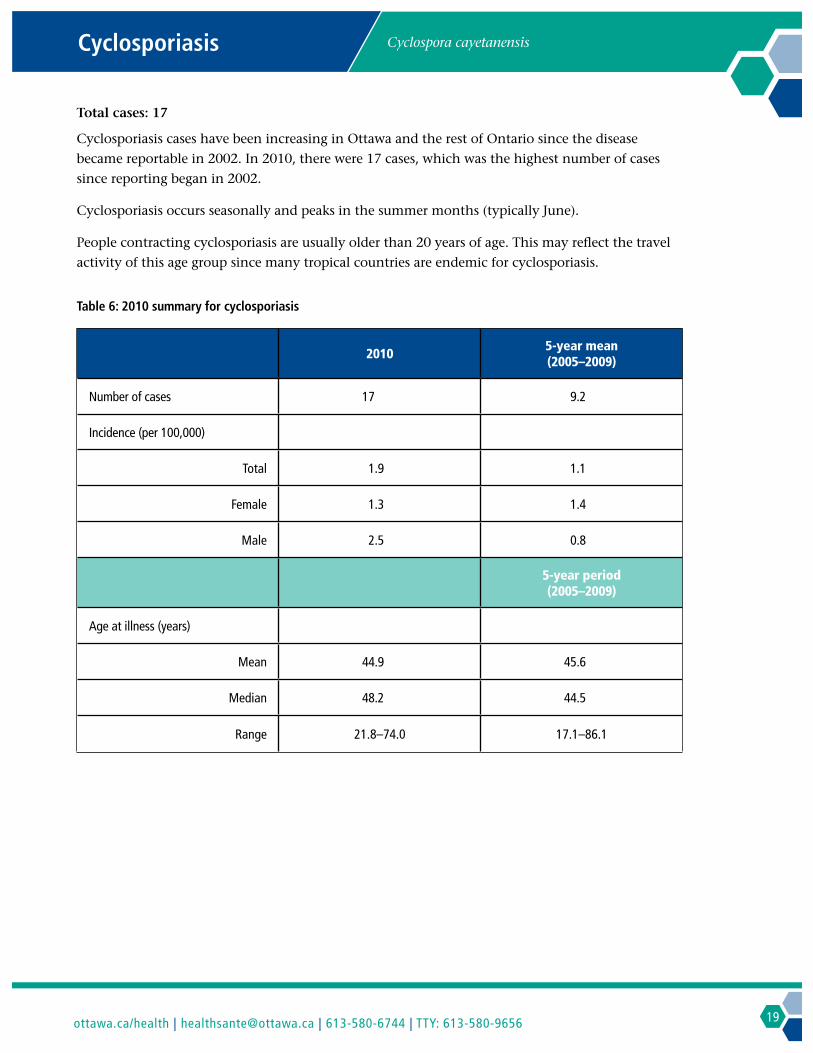
Total cases: 17
Cyclosporiasis cases have been increasing in Ottawa and the rest of Ontario since the disease
became reportable in 2002. In 2010, there were 17 cases, which was the highest number of cases
since reporting began in 2002.
Cyclosporiasis occurs seasonally and peaks in the summer months (typically June).
People contracting cyclosporiasis are usually older than 20 years of age. This may reflect the travel
activity of this age group since many tropical countries are endemic for cyclosporiasis.
Table 6: 2010 summary for cyclosporiasis
2010 5-year mean (2005–2009)
Number of cases 17 9.2
Incidence (per 100,000)
Total 1.9 1.1
Female 1.3 1.4
Male 2.5 0.8
5-year period (2005–2009)
Age at illness (years)
Mean 44.9 45.6
Median 48.2 44.5
Range 21.8–74.0 17.1–86.1
ottawa.ca/health | [email protected] | 613-580-6744 | TTY: 613-580-9656 19

Cyclosporiasis
Source: iPHIS, Ottawa Public Health, data extracted 20 May 2011 Data note: Cyclosporiasis became reportable in Ontario in 2002
Figure 12: Incidence per 100,000 of cyclosporiasis by age and sex, Ottawa, 2010
2001 2002 2003 2004 2005 2006 2007 2008 2009 2010
Ottawa cases 4 7 9 10 5 7 15 17
Ottawa incidence rate 0.5 0.8 1.1 1.2 0.6 0.8 1.7 1.9
Rest of Ontario incidence rate 0.3 0.8 1.0 0.7 0.8 0.8 1.0 1.2
Num
ber o
f cas
es
Year
6
Figure 11: Incidence per 100,000 of cyclosporiasis by year, Ottawa and the rest of Ontario, 2001–2010
18
16
14
12
10
8
6
4
2
0
2.0
1.8
1.6
1.4
1.2
1.0
0.8
0.6
0.4
0.2
0.0
Inci
denc
e pe
r 10
0,00
0
5
00,0
00
4
per 1
3
cide
nce
2
In
1
0 0–4 5–19 20–39 40–59 60+
Female 0.0 0.0 2.2 1.5 1.1
Male 0.0 0.0 3.1 2.3 5.5
Age
Source: iPHIS, Ottawa Public Health, data extracted 20 May 2011
20 Ottawa Public Health | Enteric Disease in Ottawa 2011

Cyclosporiasis
Figure 13: Number of reported cases of cyclosporiasis by month, Ottawa, 2010
Jan Feb Mar Apr May Jun Jul Aug Sep Oct Nov Dec
2010 cases 0 0 0 2 1 5 3 4 0 1 1 0
5-year mean (2005–2009) 0.2 0.2 0.4 1.4 0.6 2.8 1.2 0.6 0.0 0.2 0.4 1.2
0
1
2
3
4
5
6
Num
ber o
f cas
es
Month
Source: iPHIS, Ottawa Public Health, data extracted 20 May 2011
Exposure source and settings for cyclosporiasis
Summary exposure information is unavailable.
ottawa.ca/health | [email protected] | 613-580-6744 | TTY: 613-580-9656 21

Giardiasis Giardia lamblia
Total cases: 125
Children under five years of age are most likely to contract giardiasis; the incidence decreases with
age. It is one of the most common causes of day-care centre outbreaks of diarrhea. Males have
higher rates of giardiasis than females in each age group.
Giardiasis cases are historically reported most frequently in the month of September.
Table 7: 2010 summary for giardiasis
2010 5-year mean (2005–2009)
Number of cases 125 150.6
Incidence (per 100,000)
Total 14.0 17.6
Female 10.2 15.8
Male 17.8 19.2
5-year period (2005–2009)
Age at illness (years)
Mean 26.8 29.3
Median 25.6 27.5
Range <1–98.4 <1–85.6
Ottawa Public Health | Enteric Disease in Ottawa 2011 22

Giardiasis
Figure 14: Incidence per 100,000 of giardiasis by year, Ottawa and the rest of Ontario, 2001–2010
120
100
80
60
40
20
0 2001 2002 2003 2004 2005 2006 2007 2008 2009 2010
Ottawa cases 160 139 127 134 116 151 151 186 149 125
Ottawa incidence rate 19.8 17.0 15.4 16.1 13.8 17.9 17.6 21.7 16.9 14.0
Rest of Ontario incidence rate 17.0 15.6 13.1 12.3 12.6 11.8 12.2 11.3 10.3 9.8
Num
ber
of c
ases
Year
200 25
180
160 20
140
15
10
5
0
Inci
denc
e pe
r 10
0,00
0
Source: iPHIS, Ottawa Public Health, data extracted 20 May 2011
Figure 15: Incidence per 100,000 of giardiasis by age and sex, Ottawa, 2010
50
Inci
denc
e pe
r 100
,000
0
5
10
15
20
25
30
35
40
45
0–4 5–19 20–39 40–59 60+
Female 30.0 10.4 16.5 5.9 2.2
Male 45.9 29.2 18.5 10.7 8.3
Age
Source: iPHIS, Ottawa Public Health, data extracted 20 May 2011
ottawa.ca/health | [email protected] | 613-580-6744 | TTY: 613-580-9656 23

Giardiasis
Figure 16: Number of reported cases of giardiasis by month, Ottawa, 2010
Jan Feb Mar Apr May Jun Jul Aug Sep Oct Nov Dec
2010 cases 8 9 14 6 9 9 6 10 21 12 13 8
5-year mean (2005–2009) 10.6 6.2 12.0 13.0 13.2 10.0 15.0 11.4 21.4 13.2 14.0 10.6
0
5
10
15
20
25
30
Num
ber o
f cas
es
Month
Source: iPHIS, Ottawa Public Health, data extracted 20 May 2011
Exposure source and settings for giardiasis
Summary exposure information is unavailable.
Ottawa Public Health | Enteric Disease in Ottawa 2011 24

Hepatitis A Picornaviridae
Total cases: 9
Four of Ottawa’s nine cases of hepatitis A in 2010 were likely contracted while travelling outside of
Canada.
One non-travel-related case in a resident of a long-term care home was reported in December 2010.
This case was part of an Ontario cluster identified through laboratory genotyping. A common
source was not identified and there were no known links between the Ottawa case and the other
Ontario cases.
Table 8: 2010 summary for hepatitis A
2010 5-year mean (2005–2009)
Number of cases 9 5.6
Incidence (per 100,000)
Total 1.0 0.7
Female 1.3 0.6
Male 0.7 0.7
5-year period (2005–2009)
Age at illness (years)
Mean 44.4 32.2
Median 49.1 35.7
Range 10.9–84.7 2.3–65.5
ottawa.ca/health | [email protected] | 613-580-6744 | TTY: 613-580-9656 25

Hepatitis A
Figure 17: Incidence per 100,000 of hepatitis A by year, Ottawa and the rest of Ontario, 2001–2010
12
Source: iPHIS, Ottawa Public Health, data extracted 20 May 2011
Figure 18: Incidence per 100,000 of hepatitis A by age and sex, Ottawa, 2010
2001 2002 2003 2004 2005 2006 2007 2008 2009 2010
Ottawa cases 7 7 9 9 5 4 11 1 7 9
Ottawa incidence rate 0.9 0.9 1.1 1.1 0.6 0.5 1.3 0.1 0.8 1.0
Rest of Ontario incidence rate 1.5 1.3 1.5 1.5 1.2 1.6 0.9 0.9 1.0 1.0
Num
ber o
f cas
es
Year
1.8
1.6 10
1.4
8 1.2
2.5
Inci
denc
e pe
r 10
0,00
0
6
4
2
0
1.0
0.8
0.6
0.4
0.2
0.0
00 2.0
er 1
00,0
1.5
Inci
denc
e 1.0
p
0.5
0.0 0–4 5–19 20–39 40–59 60+
Female 0.0 1.3 0.8 2.2 1.1
Male 0.0 0.0 1.5 0.8 0.0
Age
Source: iPHIS, Ottawa Public Health, data extracted 20 May 2011
26 Ottawa Public Health | Enteric Disease in Ottawa 2011

Hepatitis A
Figure 19: Number of reported cases of hepatitis A by month, Ottawa, 2010
Jan Feb Mar Apr May Jun Jul Aug Sep Oct Nov Dec
2010 cases 2 1 0 2 0 0 0 0 3 0 0 1
5-year mean (2005–2009) 0.6 0.8 0.4 1.0 1.0 0.4 0.2 0.2 0.4 0.4 0.0 0.2
0
1
2
3
4
Num
ber o
f cas
es
Month
Source: iPHIS, Ottawa Public Health, data extracted 20 May 2011
Table 9: Exposure source for reported cases of hepatitis A, Ottawa, 2010
Reported exposure Number of cases* % of total
reported exposure
Foodborne 3 30
Person to person 1 10
Unknown 6 60
Total 10
* Cases may report more than one possible exposure
ottawa.ca/health | [email protected] | 613-580-6744 | TTY: 613-580-9656 27

Hepatitis A
Table 10: Exposure setting for reported cases of hepatitis A, Ottawa, 2010
Reported exposure setting Number of cases* % of total reported exposure settings
Travel—outside of Canada 4 40
Store—grocery/supermarket 2 20
Institutional—long-term care home 1 10
Private home 1 10
Travel—within Ontario, outside of Ottawa 1 10
Unknown or missing 1 10
Total 10
* Cases may report more than one possible exposure
Ottawa Public Health | Enteric Disease in Ottawa 2011 28

Listeriosis Listeria monocytogenes
Total cases: 3
Listeriosis typically affects older adults (average age 65 years). When patients are older or have
compromised immune systems, severe illness can result from Listeria infection.
Since 2006, listeriosis has caused seven deaths in Ottawa (28% of reported cases). The average age
of those who died was 80 years—15 years older than the average for all Listeria cases.
Listeriosis is also harmful to the very young and can be passed from the mother to her fetus. In
2010, there was one such case of maternal transmission reported in Ottawa.
Table 11: 2010 summary for listeriosis
2010 5-year mean (2005–2009)
Number of cases 2 confirmed 1 probable 6
Incidence (per 100,000)
Total 0.2 0.7
Female 0.4 0.7
Male 0.0 0.7
5-year period (2005–2009)
Age at illness (years)
Mean 40.3 65.1
Median 40.3 70.2
Range <1–80.6 <1–98.2
ottawa.ca/health | [email protected] | 613-580-6744 | TTY: 613-580-9656 29

Listeriosis
Figure 20: Incidence per 100,000 of listeriosis by year, Ottawa and the rest of Ontario, 2001–2010
8
2001 2002 2003 2004 2005 2006 2007 2008 2009 2010
Ottawa cases 1 3 6 2 7 7 4 6 6 2
Ottawa incidence rate 0.1 0.4 0.7 0.2 0.8 0.8 0.5 0.7 0.7 0.2
Rest of Ontario incidence rate 0.3 0.3 0.3 0.3 0.2 0.3 0.3 0.8 0.4 0.5
Num
ber o
f cas
es
Year
0.9
0.8 7
0.7 6
0.6 5
4
3
2
1
0
Inci
denc
e pe
r 10
0,00
0
0.5
0.4
0.3
0.2
0.1
0.0
Source: iPHIS, Ottawa Public Health, data extracted 20 May 2011
Figure 21: Incidence per 100,000 of listeriosis by age and sex, Ottawa, 2006–2010 (5-year incidence)
2.5
2.0
0–4 5–19 20–39 40–59 60+
Inci
denc
e pe
r 100
,000
1.5
1.0
0.5
0.0
Female 0.9 0.3 0.2 0.3 2.4
Male 0.0 0.0 0.3 0.3 1.8
Age
Source: iPHIS, Ottawa Public Health, data extracted 20 May 2011
Ottawa Public Health | Enteric Disease in Ottawa 2011 30

Listeriosis
Exposure source for reported cases of listeriosis
The exposure source for listeriosis is often unknown, as the disease has an incubation of 3 to 70
days—often long after people can recall what they ate. For 2010, one exposure was unknown.
The source of infection for the mother who transmitted listeriosis to her child before birth was
not known.
ottawa.ca/health | [email protected] | 613-580-6744 | TTY: 613-580-9656 31

Paratyphoid fever Salmonella paratyphi
Total cases: 1
There are few cases of Salmonella paratyphi reported in Ottawa and infection is always associated
with travel to a country outside of North America.
Table 12: 2010 summary for paratyphoid fever
2010 5-year mean (2005–2009)
Number of cases 1 1
Incidence (per 100,000)
Total 0.1 0.1
Female 0.0 0.1
Male 0.2 0.1
5-year period (2005–2009)
Age at illness (years)
Mean 34.9 29.9
Median 34.9 29.9
Range – 5.2–66.5
Ottawa Public Health | Enteric Disease in Ottawa 2011 32
Paratyphoid fever
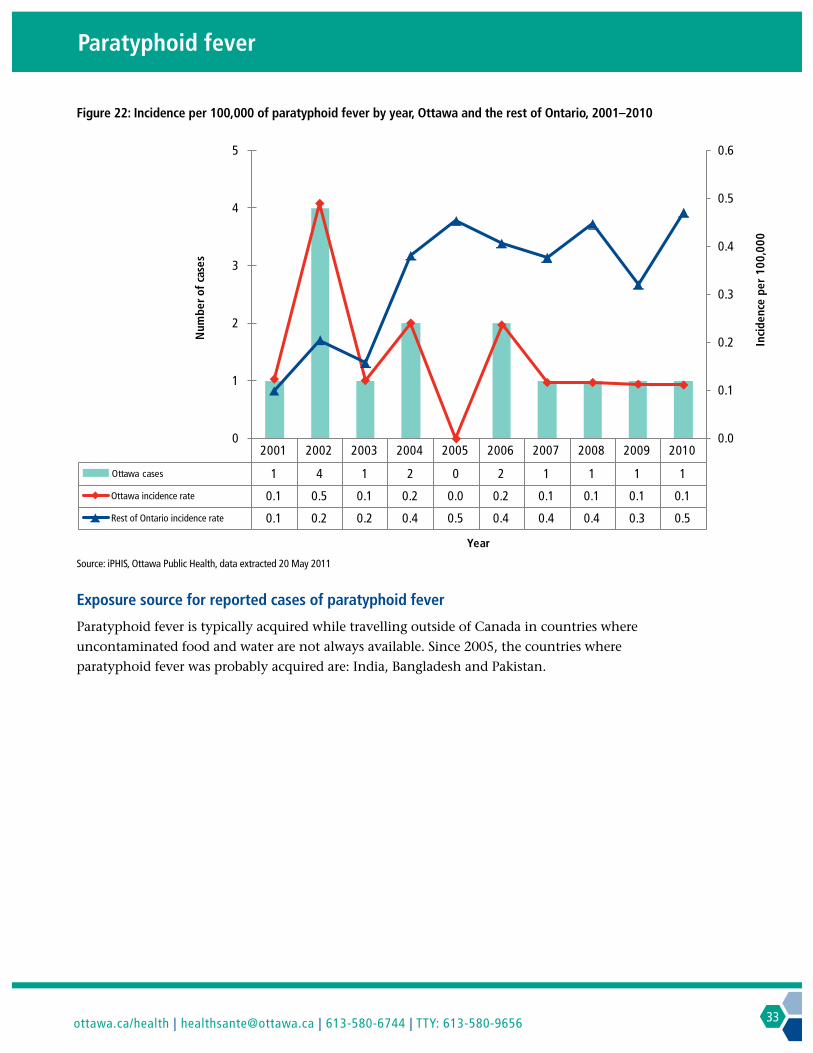
Figure 22: Incidence per 100,000 of paratyphoid fever by year, Ottawa and the rest of Ontario, 2001–2010
3
2001 2002 2003 2004 2005 2006 2007 2008 2009 2010
Ottawa cases 1 4 1 2 0 2 1 1 1 1
Ottawa incidence rate 0.1 0.5 0.1 0.2 0.0 0.2 0.1 0.1 0.1 0.1
Rest of Ontario incidence rate 0.1 0.2 0.2 0.4 0.5 0.4 0.4 0.4 0.3 0.5
Num
ber o
f cas
es
Year
0.3
2
0.2
1 0.1
0 0.0
5 0.6
0.5 4
0.4
Inci
denc
e pe
r 10
0,00
0
Source: iPHIS, Ottawa Public Health, data extracted 20 May 2011
Exposure source for reported cases of paratyphoid fever
Paratyphoid fever is typically acquired while travelling outside of Canada in countries where
uncontaminated food and water are not always available. Since 2005, the countries where
paratyphoid fever was probably acquired are: India, Bangladesh and Pakistan.
ottawa.ca/health | [email protected] | 613-580-6744 | TTY: 613-580-9656 33

Salmonellosis Salmonella
Total cases: 176
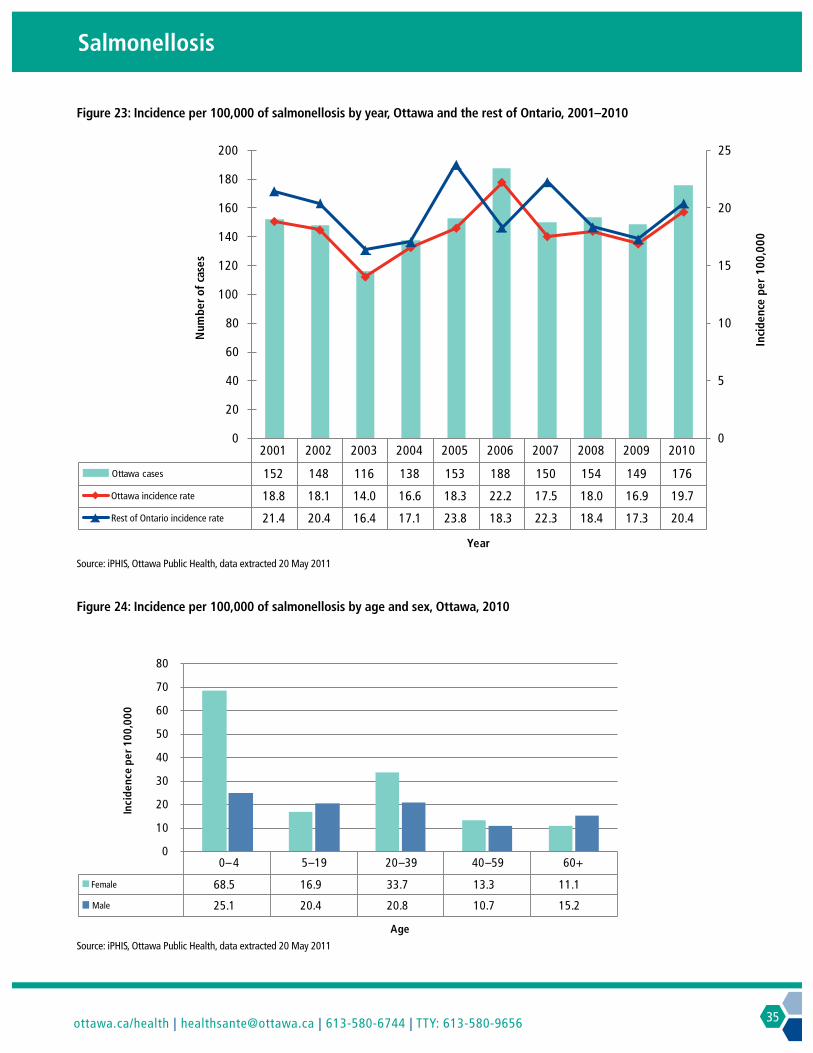
At several points during 2010, there were significantly more salmonellosis cases than in 2009 during
the same period. The mean age of cases was 31.8 years of age although the incidence is highest among
0–4 year olds.
In June 2010, Ottawa Public Health investigated an outbreak of Salmonella typhimurium. Nine young
adults who frequented the same shawarma restaurant late at night or early in the morning contracted
the disease. They ranged from 19 to 26 years of age with a median age of 21 years; five were female and
four were male. One person required hospitalization.
There were several Ontario enhanced surveillance directives reported for salmonellosis during 2010.
These directives are issued when the Ministry of Health and Long-Term Care identifies a significant
cluster or increase in salmonellosis. These directives were issued for S. enteriditis, S. oranienburg,
S. heidelberg and S. newport.
Of the 49 people who contracted salmonellosis outside of Canada, 29 (59.2%) reported acquiring the
disease at all-inclusive resorts in the Caribbean/Mexico.
Chicken and eggs were the most commonly reported exposure among food items (47.7% of all reported
food items). Reptiles were the most commonly reported exposure among animal sources (33% of all
reported source animals).
Table 13: 2010 summary for salmonellosis
2010 5-year mean (2005–2009)
Number of cases 176 158.8
Incidence (per 100,000)
Total 19.7 18.6
Female 22.2 18.4
Male 17.0 18.6
5-year period (2005–2009)
Age at illness (years)
Mean 31.8 31.4
Median 29.0 26.6
Range <1–84.8 <1–88.4
Ottawa Public Health | Enteric Disease in Ottawa 2011 34
Salmonellosis
Figure 23: Incidence per 100,000 of salmonellosis by year, Ottawa and the rest of Ontario, 2001–2010
120
100
80
60
40
20
0 2001 2002 2003 2004 2005 2006 2007 2008 2009 2010
Ottawa cases 152 148 116 138 153 188 150 154 149 176
Ottawa incidence rate 18.8 18.1 14.0 16.6 18.3 22.2 17.5 18.0 16.9 19.7
Rest of Ontario incidence rate 21.4 20.4 16.4 17.1 23.8 18.3 22.3 18.4 17.3 20.4
Num
ber o
f cas
es
Year
200 25
180
160 20
140
15
10
5
0
Inci
denc
e pe
r 10
0,00
0
Source: iPHIS, Ottawa Public Health, data extracted 20 May 2011
Figure 24: Incidence per 100,000 of salmonellosis by age and sex, Ottawa, 2010
80
70
00
60
100,
0
50
40
ence
per
30
Inci
d
20
10
0 0–4 5–19 20–39 40–59 60+
Female 68.5 16.9 33.7 13.3 11.1
Male 25.1 20.4 20.8 10.7 15.2
Age Source: iPHIS, Ottawa Public Health, data extracted 20 May 2011
ottawa.ca/health | [email protected] | 613-580-6744 | TTY: 613-580-9656 35

Salmonellosis
Figure 25: Number of reported cases of salmonellosis by month, Ottawa, 2010
Jan Feb Mar Apr May Jun Jul Aug Sep Oct Nov Dec
2010 cases 15 6 21 7 22 20 23 22 12 11 8 9
5-year mean (2005–2009) 12.4 10.2 12.2 12.6 12.0 11.8 18.8 17.2 17.2 12.6 10.0 11.8
0
5
10
15
20
25
Num
ber o
f cas
es
Month Source: iPHIS, Ottawa Public Health, data extracted 20 May 2011
Table 14: Reported cases of salmonellosis by serotype, Ottawa, 2010 and 5-year average (2005–2009)
2010 Rank Serotype Reported cases
2010 (% of total cases)
Mean reported cases 2005–2009
(% of total) 2005–2009 Rank
1 Salmonella enteriditis 66 (37.5) 35 (21.9) 2
2 Salmonella typhimurium 24 (13.6) 15 (9.5) 3
3 Salmonella heidelberg 16 (9.1) 15 (9.5) 3
4 Salmonella unspecified 8 (4.5) 50 (31.7) 1
5 Salmonella saintpaul 5 (2.8) 3 (1.8) 8
6 Salmonella havana 4 (2.3) <1 (0.1) 29
6 Salmonella infantis 4 (2.3) 3 (1.9) 7
6 Salmonella newport 4 (2.3) 2 (1.4) 10
9 Salmonella brandenburg 3 (1.7) – –
9 Salmonella mississippi 3 (1.7) <1 (0.1) 29
9 Salmonella virchow 3 (1.7) 1 (0.5) 21
9 Salmonella bareilly 3 (1.7) – –
Ottawa Public Health | Enteric Disease in Ottawa 2011 36

Salmonellosis
Table 15: Exposure source for reported cases of salmonellosis, Ottawa, 2010
Reported exposure Number of cases* % of total reported exposures
Foodborne 86 48.9
Animal to person 12 6.8
Person to person 3 1.7
Waterborne—recreational water 2 1.1
Item to person 1 0.6
Unknown 72 40.9
TOTAL 176
* Cases may report more than one possible exposure
ottawa.ca/health | [email protected] | 613-580-6744 | TTY: 613-580-9656 37

Salmonellosis
Table 16: Exposure setting for reported cases of salmonellosis, 2010
Reported exposure setting Number of cases* % of total reported exposure settings
Travel—outside of Canada 49 27.8
Private home 37 21.0
Restaurant 37 21.0
Store—grocery store 6 3.4
Travel—within Canada 3 1.7
Other 3 1.7
Institutional 2 1.1
Farm 1 0.6
Farmer’s market 1 0.6
Petting zoo 1 0.6
Store—convenience store 1 0.6
Unknown 34 19.3
Total 176
* Cases may report more than one possible exposure
Ottawa Public Health | Enteric Disease in Ottawa 2011 38

Shigellosis Shigella boydii, Shigella dysenteriae, Shigella flexneri, Shigella sonnei
Number of cases: 15
The incidence of shigellosis has been stable since 2003. The exceptionally high number of
shigellosis cases in 2002 (Figure 26) was a result of an outbreak of Shigella sonnei that was linked to
Greek pasta salad. Most cases of the outbreak occurred in Ottawa.
The infection rate is highest in children under age five and the mean age of all reported cases is low
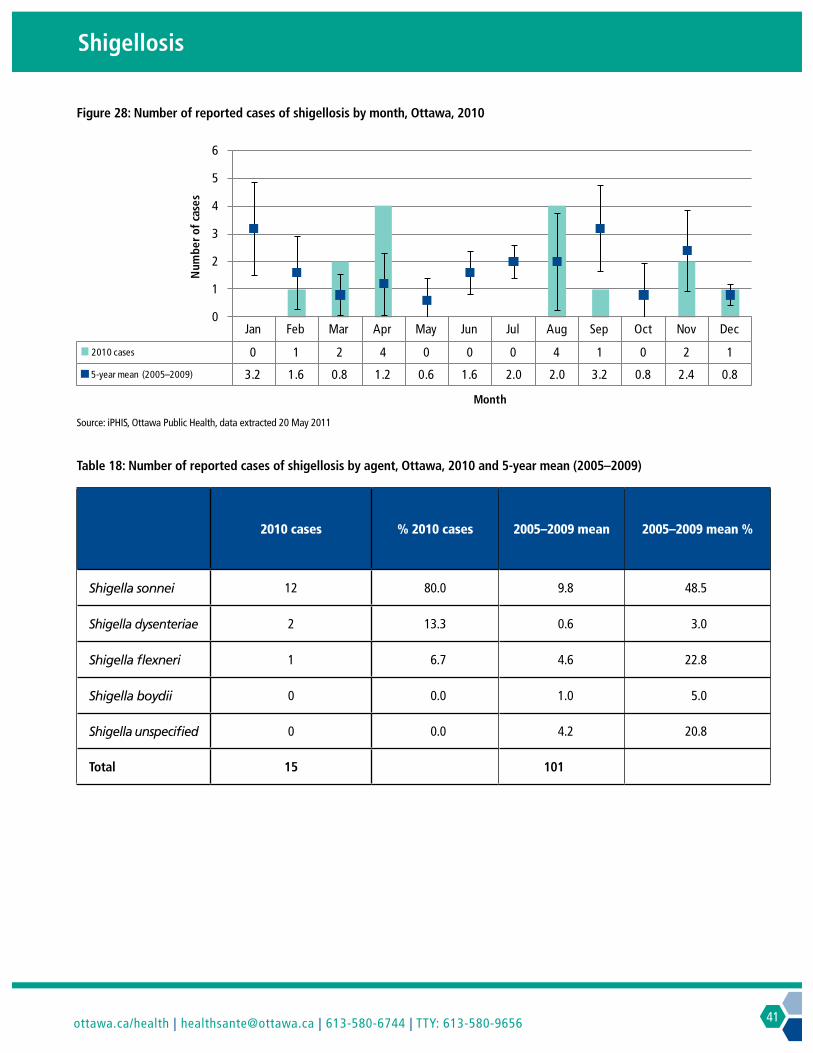
(34.1 years). Most cases of shigellosis (80%) in Ottawa are caused by Shigella sonnei.
Travel outside of Canada is the most commonly reported exposure setting for shigellosis (72%).
Table 17: 2010 summary for shigellosis
2010 5-year mean (2005–2009)
Number of cases 15 20.2
Incidence (per 100,000)
Total 1.7 2.4
Female 1.5 2.3
Male 1.8 2.4
5-year period (2005–2009)
Age at illness (years)
Mean 34.1 33.4
Median 29.2 34.2
Range 3.3–74.9 <1–86.9
ottawa.ca/health | [email protected] | 613-580-6744 | TTY: 613-580-9656 39

Shigellosis
Figure 26: Incidence per 100,000 of shigellosis by year, Ottawa and the rest of Ontario, 2001–2010
250 30
25 200
20
Num
ber o
f cas
es
150
15
100
10
50 5
0 0 2001 2002 2003 2004 2005 2006 2007 2008 2009 2010
Inci
denc
e pe
r 10
0,00
0
Ottawa cases 32 213 24 21 25 19 25 16 16 15
Ottawa incidence rate 4.0 26.0 2.9 2.5 3.0 2.2 2.9 1.9 1.8 1.7
Rest of Ontario incidence rate 1.8 5.7 2.2 2.3 2.4 1.5 1.7 1.9 1.9 1.9
Year
Source: iPHIS, Ottawa Public Health, data extracted 20 May 2011
Figure 27: Incidence per 100,000 of shigellosis by age and sex, Ottawa, 2010
4.5
4.0
0 3.5
0,00 3.0
er 1
0
2.5
2.0 pid
ence
1.5
Inc
1.0
0.5
0.0 0–4 5–19 20–39 40–59 60+
Female 4.3 1.3 1.5 2.2 0.0
Male 4.2 1.3 1.5 2.3 1.4
Age
Source: iPHIS, Ottawa Public Health, data extracted 20 May 2011
40 Ottawa Public Health | Enteric Disease in Ottawa 2011
Shigellosis
Figure 28: Number of reported cases of shigellosis by month, Ottawa, 2010
Jan Feb Mar Apr May Jun Jul Aug Sep Oct Nov Dec
2010 cases 0 1 2 4 0 0 0 4 1 0 2 1
5-year mean (2005–2009) 3.2 1.6 0.8 1.2 0.6 1.6 2.0 2.0 3.2 0.8 2.4 0.8
0
1
2
3
4
5
6
Num
ber o
f cas
es
Month
Source: iPHIS, Ottawa Public Health, data extracted 20 May 2011
Table 18: Number of reported cases of shigellosis by agent, Ottawa, 2010 and 5-year mean (2005–2009)
2010 cases % 2010 cases 2005–2009 mean 2005–2009 mean %
Shigella sonnei 12 80.0 9.8 48.5
Shigella dysenteriae 2 13.3 0.6 3.0
Shigella flexneri 1 6.7 4.6 22.8
Shigella boydii 0 0.0 1.0 5.0
Shigella unspecified 0 0.0 4.2 20.8
Total 15 101
ottawa.ca/health | [email protected] | 613-580-6744 | TTY: 613-580-9656 41

Shigellosis
Table 19: Exposure source for reported cases of shigellosis, Ottawa, 2010
Reported exposure Number of cases* % of total reported exposures
Foodborne 2 11.1
Water—recreational water 1 5.6
Unknown 15 83.3
Total 18
* Cases may report more than one possible exposure
Table 20: Exposure setting for reported cases of shigellosis, 2010
Reported exposure setting Number of cases* % of total reported exposure settings
Travel—outside of Canada 13 72.2
Restaurant 2 11.1
Travel—within Ontario 1 5.6
Unknown 2 11.1
Total 18
* Cases may report more than one possible exposure
Ottawa Public Health | Enteric Disease in Ottawa 2011 42

Typhoid fever Salmonella typhi
Number of cases: 3
There is less typhoid fever in Ottawa (0.3/100,000) than in the rest of Ontario (0.7/100,000).
Typhoid fever is most common in 20–39 year olds, who are more likely to travel.
Typically, people who contract typhoid fever have recently travelled to a country outside of North
America where uncontaminated water and food were not always available. One non-travel related
case of typhoid fever was reported in December 2010. The exposure source was not identified.
Table 21: 2010 summary for typhoid fever
2010 5-year mean (2005–2009)
Number of cases 3 2.6
Incidence (per 100,000)
Total 0.3 0.3
Female 0.4 0.2
Male 1.2 0.4
5-year period (2005–2009)
Age at illness (years)
Mean 27.3 28.3
Median 20.7 27.4
Range 9.2–52.2 10.4–48.5
ottawa.ca/health | [email protected] | 613-580-6744 | TTY: 613-580-9656 43

Typhoid fever
Figure 29: Incidence per 100,000 of typhoid fever by year, Ottawa and the rest of Ontario, 2001–2010
6
Source: iPHIS, Ottawa Public Health, data extracted 20 May 2011
Figure 30: Incidence per 100,000 of typhoid fever by age and sex, Ottawa, 2006–2010 (5-year incidence)
2001 2002 2003 2004 2005 2006 2007 2008 2009 2010
Ottawa cases 5 4 2 5 2 3 4 1 3 3
Ottawa incidence rate 0.6 0.5 0.2 0.6 0.2 0.4 0.5 0.1 0.3 0.3
Rest of Ontario incidence rate 0.5 0.5 0.4 0.6 0.5 0.8 0.7 0.8 0.6 0.7
Num
ber o
f cas
es
Year
0.9
0.8 5
0.7
4 0.6
Inci
denc
e pe
r 10
0,00
0
3
2
1
0
0.5
0.4
0.3
0.2
0.1
0.0
0–4 5–19 20–39 40–59 60+
Female 0.0 0.3 0.6 0.0 0.0
Male 0.0 0.8 0.6 0.3 0.0
0.0
0.1
0.2
0.3
0.4
0.5
0.6
0.7
0.8
Inci
denc
e pe
r 100
,000
Age
Source: iPHIS, Ottawa Public Health, data extracted 20 May 2011
Ottawa Public Health | Enteric Disease in Ottawa 2011 44

Typhoid fever
Table 22: Exposure source for reported cases of typhoid fever, Ottawa, 2010
Reported exposure source Number of cases* % of total reported exposures
Unknown 3 100.0
Total 3
* Cases may report more than one possible exposure
Table 23: Exposure setting for reported cases of typhoid fever, 2010
Reported exposure setting Number of cases* % of total reported exposure settings
Travel—outside of Canada 2 66.6
Unknown 1 33.3
Total 3
* Cases may report more than one possible exposure
ottawa.ca/health | [email protected] | 613-580-6744 | TTY: 613-580-9656 45

Verotoxin-producing E. coli Escherichia coli
Number of cases: 5
The incidence of verotoxin-producing E. coli (VTEC) has been decreasing in Ottawa and the rest of
Ontario since 2002. Infection with E. coli (VTEC) is most common in children under age five and
the mean age of all reported cases is low (11.9 years).
VTEC occurs seasonally and typically peaks in August.
Table 24: 2010 summary for verotoxin-producing E. coli (VTEC)
2010 5-year mean (2005–2009)
Number of cases 5 13.4
Incidence (per 100,000)
Total 0.6 1.6
Female 0.7 1.9
Male 0.4 1.2
5-year period (2005–2009)
Age at illness (years)
Mean 11.9 27.1
Median 8.1 19.9
Range 1.1–32.5 <1–84.8
Ottawa Public Health | Enteric Disease in Ottawa 2011 46

Verotoxin-producing E. coli
Figure 31: Incidence per 100,000 of verotoxin-producing E. coli by year, Ottawa and the rest of Ontario, 2001–2010
40
2001 2002 2003 2004 2005 2006 2007 2008 2009 2010
Ottawa cases 26 36 28 12 7 15 23 13 9 5
Ottawa incidence rate 3.2 4.4 3.4 1.4 0.8 1.8 2.7 1.5 1.0 0.6
Rest of Ontario incidence rate 2.9 3.1 3.7 2.6 2.1 2.7 2.4 2.2 1.2 1.2
Num
ber o
f cas
es
Year
5.0
4.5 35
4.0 30
3.5
25
20
15
10
5
0
3.0
2.5
2.0
1.5
1.0
0.5
0.0
Inci
denc
e pe
r 10
0,00
0
Source: iPHIS, Ottawa Public Health, data extracted 20 May 2011
Figure 32: Incidence per 100,000 of verotoxin-producing E. coli by age and sex, Ottawa, 2006–2010
(5-year mean)
0–4 5–19 20–39 40–59 60+
Female 8.8 1.8 1.7 0.6 1.9
Male 3.4 2.3 1.4 0.2 0.6
0
1
2
3
4
5
6
7
8
9
10
Inci
denc
e pe
r 100
,000
Age
Source: iPHIS, Ottawa Public Health, data extracted 20 May 2011
ottawa.ca/health | [email protected] | 613-580-6744 | TTY: 613-580-9656 47

Verotoxin-producing E. coli
Figure 33: Number of reported cases of verotoxin-producing E. coli by month, Ottawa, 2010
Jan Feb Mar Apr May Jun Jul Aug Sep Oct Nov Dec
2010 cases 0 0 0 1 0 1 0 1 2 0 0 0
5-year mean (2005–2009) 0.2 0.6 0.6 0.6 1.0 1.2 2.0 2.8 2.0 1.2 0.8 0.4
0
1
2
3
4
5
Num
ber o
f cas
es
Month
Source: iPHIS, Ottawa Public Health, data extracted 20 May 2011
Table 25: Exposure source for reported cases of verotoxin-producing E. coli, Ottawa, 2010
Reported exposure Number of cases* % of total reported exposures
Water—recreational water 1 20
Person to person 1 20
Unknown 3 60
Total 5
* Cases may report more than one possible exposure
Table 26: Exposure setting for reported cases of verotoxin-producing E. coli, 2010
Reported exposure setting Number of cases* % of total reported exposure settings
Farmers’ market 1 20
Private home 1 20
Travel—within Canada 1 20
Unknown 2 40
Total 5
* Cases may report more than one possible exposure
Ottawa Public Health | Enteric Disease in Ottawa 2011 48

Yersiniosis Yersinia entercolitica and Yersinia pseudotuberculosis
Number of cases: 21
For 2010, Ottawa had the highest number of cases of yersiniosis in 10 years. This increase is likely
the result of a local cluster. Five confirmed cases were linked to the same exposure, a local meat
premises. Cases reported buying meat directly from the premises or from a secondary retailer that
resold its products. A specific type of sausage was referenced by three cases. Onset dates ranged
between August and December 2010. The people affected ranged in age from 1 to 56 years.
Most (92%) of all Ottawa cases reported that their likely exposure source was meat, typically
pork products.
Table 27: 2010 summary for yersiniosis
2010 5-year mean (2005–2009)
Number of cases 21 13.6
Incidence (per 100,000)
Total 2.3 1.6
Female 1.7 1.6
Male 3.0 1.6
5-year period (2005–2009)
Age at illness (years)
Mean 31.0 27.5
Median 24.4 26.2
Range 1.8–64.8 <1–86.3
ottawa.ca/health | [email protected] | 613-580-6744 | TTY: 613-580-9656 49

Yersiniosis
Figure 34: Incidence per 100,000 of yersiniosis by year, Ottawa and the rest of Ontario, 2001–2010
25
Source: iPHIS, Ottawa Public Health, data extracted 20 May 2011
Figure 35: Incidence per 100,000 of yersiniosis by age and sex, Ottawa, 2010
2001 2002 2003 2004 2005 2006 2007 2008 2009 2010
Ottawa cases 18 18 17 8 12 15 14 11 16 21
Ottawa incidence rate 2.2 2.2 2.1 1.0 1.4 1.8 1.6 1.3 1.8 2.3
Rest of Ontario incidence rate 2.6 3.2 2.7 2.5 2.8 2.9 2.1 2.0 1.9 1.4
Num
ber o
f cas
es
Year
3.5
3.0 20
2.5
6
15
10
5
0
2.0
1.5
1.0
0.5
0.0
Inci
denc
e pe
r 10
0,00
0
5
00,0
00
4
per 1
3
cide
nce
2
In
1
0 0–4 5–19 20–39 40–59 60+
Female 0.0 3.9 0.8 2.2 1.1
Male 4.2 5.1 3.1 1.5 2.8
Age
Source: iPHIS, Ottawa Public Health, data extracted 20 May 2011
50 Ottawa Public Health | Enteric Disease in Ottawa 2011

Yersiniosis
Figure 36: Number of reported cases of yersiniosis by month, Ottawa, 2010
Jan Feb Mar Apr May Jun Jul Aug Sep Oct Nov Dec
2010 cases 2 0 1 1 1 4 1 2 3 1 1 4
5-year mean (2005–2009) 1.0 0.8 1.0 2.6 1.0 0.8 1.2 1.6 1.0 1.0 0.6 1.0
0
1
2
3
4
5
Num
ber o
f cas
es
Month Source: iPHIS, Ottawa Public Health, data extracted 20 May 2011
Table 28: Exposure source for reported cases of yersiniosis, Ottawa, 2010
Reported exposure Number of cases* % of total reported exposures
Foodborne 12 92.3
Unknown 1 7.7
Total 13
* Cases may report more than one possible exposure
Table 29: Exposure setting for reported cases of yersiniosis, 2010
Reported exposure setting Number of cases* % of total reported exposure settings
Private home 4 30.8
Processing plant—commissary 3 23.1
Butcher shop 2 15.4
Restaurant 2 15.4
Deli 1 7.7
Unknown or missing 1 7.7
Total 13
* Cases may report more than one possible exposure
ottawa.ca/health | [email protected] | 613-580-6744 | TTY: 613-580-9656 51

Glossary
Age at illness
The case’s age at episode date
Age range
The youngest case age and the eldest case age within the reporting time period. When the
minimum age is under the age of one year, the age is represented as “<1”.
Enteric
Relating to or situated in the intestine
Epidemiology
The scientific and medical study of the causes and transmission of disease within a population
Episode date
Episode date is a calculated field and represents the earliest date of the following: date of onset of
symptoms, laboratory specimen collection date, or date reported to public health.
Five-year mean
Total number of cases over a five-year time period divided by 5 (the number of years within the
time period)
Incidence per 100,000
Total number of new cases reported with an episode date in the calendar year of report divided by
the number of people residing in Ottawa according to the census projection of 2010
Male incidence
Total number of new male cases reported with an episode date in the calendar year of
report divided by the number of males residing in Ottawa according to the census
projection of 2010
Female incidence
Total number of new female cases reported with an episode date in the calendar year of
report divided by the number of males residing in Ottawa according to the census
projection of 2010
Ottawa Public Health | Enteric Disease in Ottawa 2011 52

Glossary
Mean
The average number of cases over a given time
Median
The point at which 50% of the data is above the point and 50% is below. This is a better measure of
the central point of the data if the data are skewed.
Number of cases
Number of confirmed cases reported to Ottawa Public Health with an episode date in the calendar
year of report
ottawa.ca/health | [email protected] | 613-580-6744 | TTY: 613-580-9656 53

613-580-6744 ottawa.ca/health TTY: 613-580-9656