entering a new league; buy - tupras.com.tr · interest cover 3.13x 1.74x 6.15x 8.04x 9.81x * for...
TRANSCRIPT
>> Employed by a non-US affiliate of MLPF&S and is not registered/qualified as a research analyst under the FINRA rules. Refer to "Other Important Disclosures" for information on certain BofA Merrill Lynch entities that take responsibility for this report in particular jurisdictions. BofA Merrill Lynch does and seeks to do business with companies covered in its research reports. As a result, investors should be aware that the firm may have a conflict of interest that could affect the objectivity of this report. Investors should consider this report as only a single factor in making their investment decision. Refer to important disclosures on page 46 to 48. Analyst Certification on Page 44. Price Objective Basis/Risk on page 44. 11495045
Tupras
Reinstatement of Coverage
BUY
Entering a new league; Buy
Equity | Turkey | Oil Refining & Marketing 19 March 2015
Anton Fedotov >> +7 495 662 6079 Research Analyst Merrill Lynch (Russia) [email protected] Karen Kostanian, CFA >> +7 495 662 6074 Research Analyst Merrill Lynch (Russia) [email protected] Denis Derushkin >> +7 495 662 6202 Research Analyst Merrill Lynch (Russia) [email protected] Jake Greenberg +44 20 7996 4815 Specialist Sales MLI (UK) [email protected]
Stock Data
Price TRY53.10 Price Objective TRY71.00 Date Established 19-Mar-2015 Investment Opinion C-1-9 Volatility Risk HIGH 52-Week Range TRY41.75-TRY57.50 Mrkt Val / Shares Out (mn) TRY13,297 / 250.4 Average Daily Volume 1,086,721 BofAML Ticker / Exchange TUPRF / IST Bloomberg / Reuters TUPRS TI / TUPRS.IS ROE (2015E) 21.2% Net Dbt to Eqty (Dec-2014A) 62.1% Est. 5-Yr EPS / DPS Growth 7.6% / NA Free Float 49.0%
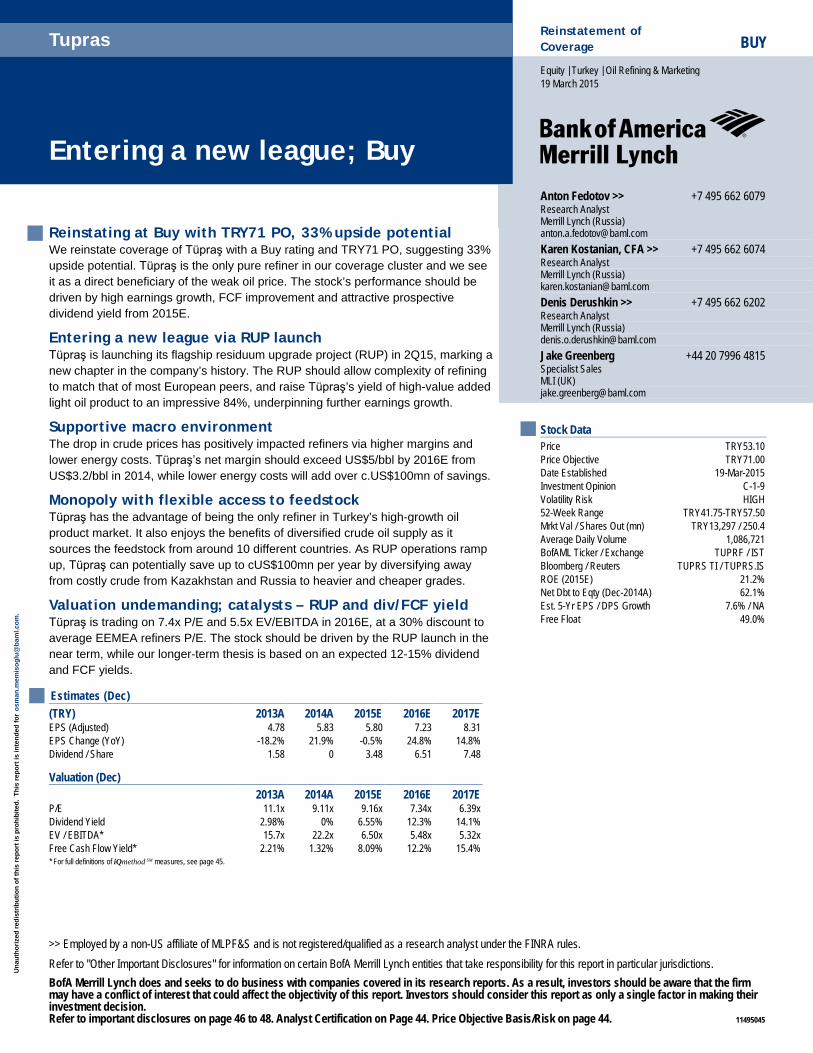
Reinstating at Buy with TRY71 PO, 33% upside potential
We reinstate coverage of Tüpraş with a Buy rating and TRY71 PO, suggesting 33% upside potential. Tüpraş is the only pure refiner in our coverage cluster and we see it as a direct beneficiary of the weak oil price. The stock’s performance should be driven by high earnings growth, FCF improvement and attractive prospective dividend yield from 2015E.
Entering a new league via RUP launch Tüpraş is launching its flagship residuum upgrade project (RUP) in 2Q15, marking a new chapter in the company’s history. The RUP should allow complexity of refining to match that of most European peers, and raise Tüpraş’s yield of high-value added light oil product to an impressive 84%, underpinning further earnings growth.
Supportive macro environment The drop in crude prices has positively impacted refiners via higher margins and lower energy costs. Tüpraş’s net margin should exceed US$5/bbl by 2016E from US$3.2/bbl in 2014, while lower energy costs will add over c.US$100mn of savings.
Monopoly with flexible access to feedstock Tüpraş has the advantage of being the only refiner in Turkey’s high-growth oil product market. It also enjoys the benefits of diversified crude oil supply as it sources the feedstock from around 10 different countries. As RUP operations ramp up, Tüpraş can potentially save up to cUS$100mn per year by diversifying away from costly crude from Kazakhstan and Russia to heavier and cheaper grades.
Valuation undemanding; catalysts – RUP and div/FCF yield Tüpraş is trading on 7.4x P/E and 5.5x EV/EBITDA in 2016E, at a 30% discount to average EEMEA refiners P/E. The stock should be driven by the RUP launch in the near term, while our longer-term thesis is based on an expected 12-15% dividend and FCF yields. Estimates (Dec)
(TRY) 2013A 2014A 2015E 2016E 2017E EPS (Adjusted) 4.78 5.83 5.80 7.23 8.31 EPS Change (YoY) -18.2% 21.9% -0.5% 24.8% 14.8% Dividend / Share 1.58 0 3.48 6.51 7.48
Valuation (Dec) 2013A 2014A 2015E 2016E 2017E P/E 11.1x 9.11x 9.16x 7.34x 6.39x Dividend Yield 2.98% 0% 6.55% 12.3% 14.1% EV / EBITDA* 15.7x 22.2x 6.50x 5.48x 5.32x Free Cash Flow Yield* 2.21% 1.32% 8.09% 12.2% 15.4%
* For full definitions of iQmethod SM measures, see page 45.
Un
auth
ori
zed
red
istr
ibu
tio
n o
f th
is r
epo
rt is
pro
hib
ited
.T
his
rep
ort
is in
ten
ded
fo
r o
sman
.mem
iso
glu
@b
aml.c
om
.

Tupras 19 March 2015
2
iQprofile SM
Tupras Key Income Statement Data (Dec) 2013A 2014A 2015E 2016E 2017E (TRY Millions)
Sales 41,078 39,723 26,626 33,004 42,915 EBITDA Adjusted 1,094 773 2,639 3,130 3,228 Depreciation & Amortization (240) (258) (431) (445) (457) EBIT Adjusted 854 515 2,207 2,686 2,771 Net Interest & Other Income (841) (331) (379) (404) (151) Tax Expense / Benefit 1,186 1,286 (366) (456) (524) Net Income (Adjusted) 1,197 1,459 1,452 1,812 2,080
Average Fully Diluted Shares Outstanding 250 250 250 250 250 Key Cash Flow Statement Data
Net Income (Reported) 1,197 1,459 1,452 1,812 2,080 Depreciation & Amortization 240 258 431 445 457 Change in Working Capital 1,525 1,603 (141) (416) (348) Deferred Taxation Charge (1,192) (1,292) 0 0 0 Other CFO 779 404 (116) 286 361 Cash Flow from Operations 2,549 2,433 1,625 2,126 2,551 Capital Expenditure (2,255) (2,258) (550) (500) (500) (Acquisition) / Disposal of Investments 0 0 0 0 0 Other CFI 95.9 70.3 0 0 0 Cash Flow from Investing (2,159) (2,187) (550) (500) (500) Share Issue / (Repurchase) NA NA NA NA NA Cost of Dividends Paid (964) (396) 0 (871) (1,630) Increase (decrease) debt 2,278 1,233 (48.5) (545) (201) Other CFF (1,385) (961) (217) (172) (119) Cash Flow from Financing (71.2) (124) (266) (1,588) (1,951) Total Cash Flow (CFO + CFI + CFF) 319 121 810 37.8 100
FX and other changes to cash 82.4 114 (352) 0 0 Change in Cash 402 235 457 37.8 100 Change in Net Debt 1,876 998 (506) (582) (302)
Net Debt 2,859 3,857 3,351 2,768 2,467 Key Balance Sheet Data Property, Plant & Equipment 8,326 10,668 10,791 10,856 10,908 Goodwill 189 189 189 189 189 Other Intangibles 39.4 60.6 51.0 41.4 32.4 Other Non-Current Assets 2,820 4,024 4,080 4,144 4,230 Trade Receivables 1,957 170 114 141 183 Cash & Equivalents 3,663 3,898 4,356 4,394 4,494 Other Current Assets 4,145 2,923 1,846 2,282 3,019 Total Assets 21,139 21,933 21,427 22,048 23,056 Long-Term Debt 5,447 6,978 6,176 6,263 4,452 Other Non-Current Liabilities 157 181 181 181 181 Short-Term Debt 1,075 777 1,530 899 2,509
Other Current Liabilities 9,322 7,784 5,964 6,275 7,118 Total Liabilities 16,001 15,720 13,852 13,618 14,260 Total Equity 5,139 6,213 7,575 8,430 8,796
Total Equity & Liabilities 21,139 21,933 21,427 22,048 23,056 Business Performance* Return On Capital Employed 8.97% 4.52% 12.7% 14.6% 14.8%
Return On Equity 24.1% 25.9% 21.2% 22.8% 24.4% Operating Margin 2.08% 1.30% 8.29% 8.14% 6.46% Free Cash Flow (MM) 294 175 1,075 1,626 2,051 Quality of Earnings* Cash Realization Ratio 2.13x 1.67x 1.12x 1.17x 1.23x
Asset Replacement Ratio 9.38x 8.75x 1.27x 1.12x 1.09x Tax Rate NM NM 20.0% 20.0% 20.0% Net Debt/Equity 55.6% 62.1% 44.2% 32.8% 28.0% Interest Cover 3.13x 1.74x 6.15x 8.04x 9.81x
* For full definitions of iQmethod SM measures, see page 45.
Company Description Tupras is Turkey's only oil refiner. The refining
operations are conducted out of four sites around the country with a total capacity of 28.1mn tons per annum. Nelson Index Complexity of 7.3 should rise from the current 7.3 to 9.9 post the full launch of Residuum Upgrade Project in Izmit Refinery in 2Q 2015. The company also has a 40% stake in OPET, the third largest petroleum retailer in Turkey with approximately 1,300 fuel stations.
Investment Thesis Tupras is likely to benefit from its dominant position
in the Turkish refining sector assuming that Socar's Star refinery project will be operational by 2019YE. Moreover, earnings growth with the Residuum Upgrade Project coming into operation in 2015 is one of the major investment highlights for Tupras.
Stock Data Price to Book Value 1.8x

3
Tupras 19 March 2015
Contents Investment summary 4
Reinstating at Buy; 33% upside potential 6
RUP as the main growth driver 11
Energy cost savings 14
Crude oil mix to drive margins 17
Efficiency improvement drives growth 20
Turkish market in growth phase 21
Monopoly in an attractive market 25
Strong financials 27
Turkey: the macro view 29
Commodity view 31
Refining outlook in Europe 34
Risks to the investment case 37
Company background 38
Tupras 19 March 2015
4
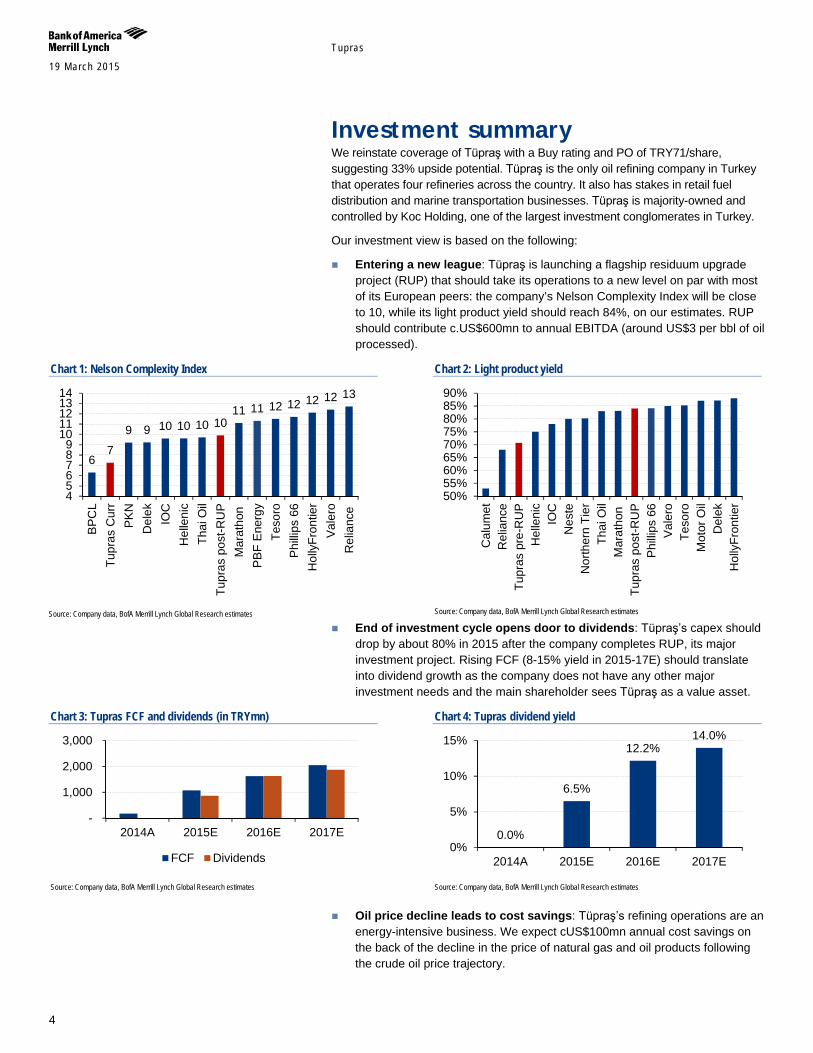
Investment summary We reinstate coverage of Tüpraş with a Buy rating and PO of TRY71/share, suggesting 33% upside potential. Tüpraş is the only oil refining company in Turkey that operates four refineries across the country. It also has stakes in retail fuel distribution and marine transportation businesses. Tüpraş is majority-owned and controlled by Koc Holding, one of the largest investment conglomerates in Turkey.
Our investment view is based on the following:
Entering a new league: Tüpraş is launching a flagship residuum upgrade project (RUP) that should take its operations to a new level on par with most of its European peers: the company’s Nelson Complexity Index will be close to 10, while its light product yield should reach 84%, on our estimates. RUP should contribute c.US$600mn to annual EBITDA (around US$3 per bbl of oil processed).
Chart 1: Nelson Complexity Index
Source: Company data, BofA Merrill Lynch Global Research estimates
Chart 2: Light product yield
Source: Company data, BofA Merrill Lynch Global Research estimates
End of investment cycle opens door to dividends: Tüpraş’s capex should drop by about 80% in 2015 after the company completes RUP, its major investment project. Rising FCF (8-15% yield in 2015-17E) should translate into dividend growth as the company does not have any other major investment needs and the main shareholder sees Tüpraş as a value asset.
Chart 3: Tupras FCF and dividends (in TRYmn)
Source: Company data, BofA Merrill Lynch Global Research estimates
Chart 4: Tupras dividend yield
Source: Company data, BofA Merrill Lynch Global Research estimates
Oil price decline leads to cost savings: Tüpraş’s refining operations are an energy-intensive business. We expect cUS$100mn annual cost savings on the back of the decline in the price of natural gas and oil products following the crude oil price trajectory.
6 7
9 9 10 10 10 10 11 11 12 12 12 12 13
456789
1011121314
BP
CL
Tupr
as C
urr
PK
ND
elek
IOC
Hel
leni
cTh
ai O
ilTu
pras
pos
t-RU
PM
arat
hon
PB
F E
nerg
yTe
soro
Phi
llips
66
Hol
lyFr
ontie
rV
aler
oR
elia
nce
50%55%60%65%70%75%80%85%90%
Cal
umet
Rel
ianc
eTu
pras
pre
-RU
PH
elle
nic
IOC
Nes
teN
orth
ern
Tier
Thai
Oil
Mar
atho
nTu
pras
pos
t-RU
PP
hilli
ps 6
6V
aler
oTe
soro
Mot
or O
ilD
elek
Hol
lyFr
ontie
r
-
1,000
2,000
3,000
2014A 2015E 2016E 2017E
FCF Dividends
0.0%
6.5%
12.2% 14.0%
0%
5%
10%
15%
2014A 2015E 2016E 2017E

Tupras 19 March 2015
5
Flexible access to crude oil supply: Tüpraş’s access to a diversified supply of crude oil feedstock stems from its advantageous geographical position. Post the RUP launch, the company should be able to process heavier and cheaper crude oil, which may potentially lead to an additional cost savings of up to US$100mn per annum.
Monopoly in a growing market: Turkey is a high-growth market for oil products with jet fuel and diesel demand up 11.2% and 4.2% in 2014, respectively. We forecast a significant middle-distillates deficit to persist over the coming years, which should support Tüpraş as the monopoly oil product producer in the country.
Improving financials to drive up shares: The launch of RUP, combined with higher refinery utilisation and cost savings, underpins Tüpraş’s impressive 22% EBITDA CAGR in 2015-18E, gradual deleveraging to 1.1x net debt/EBITDA in 2017E and rising dividend and FCF yields.
Chart 5: EBITDA (CCS) and Net debt (TRYmn)
Source: Company data, BofA Merrill Lynch Global Research estimates
Chart 6: Net debt/EBITDA
Source: Company data, BofA Merrill Lynch Global Research estimates
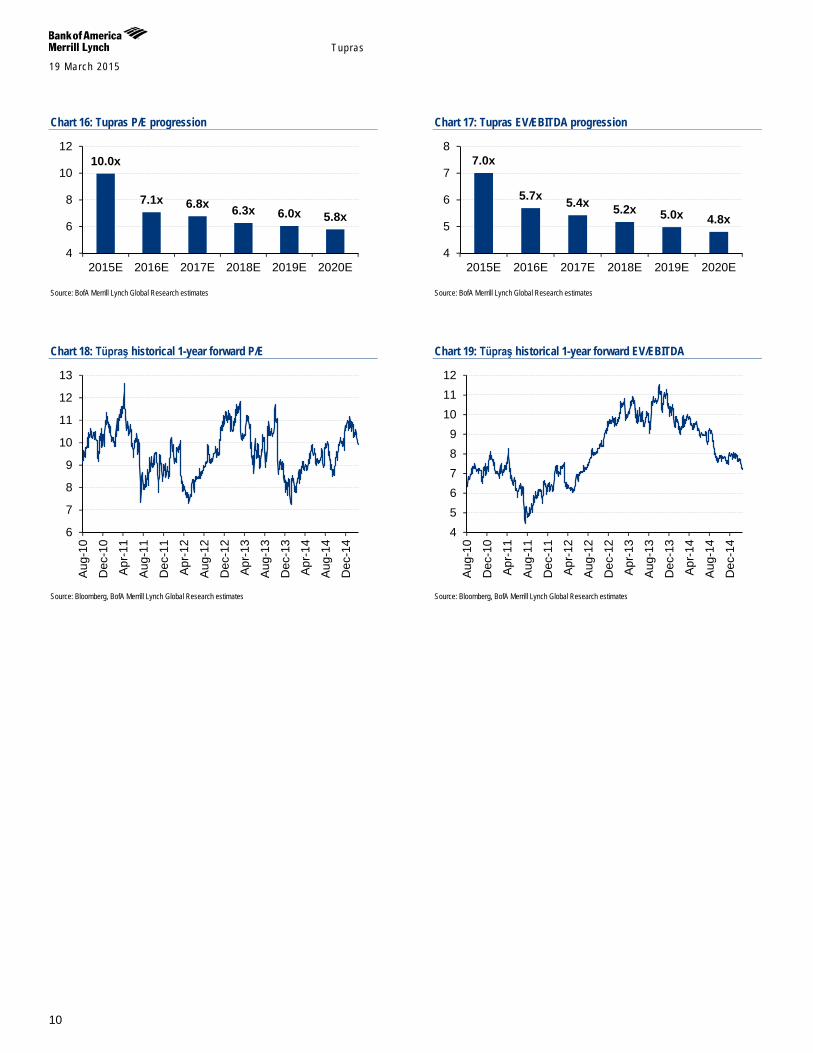
Rerating likely on the back of catalysts: Tüpraş is trading on 7.4x P/E and 5.5x EV/EBITDA in 2016E, including the full impact of RUP. The discount to the average 10x 2016E P/E of EEMEA peers is a high 29%. We believe the stock should be driven by the launch of RUP in the near term, while high EBITDA growth and improving FCF and dividends should pave the way for further rerating.
Chart 7: Tupras P/E progression
Source: BofA Merrill Lynch Global Research estimates
Chart 8: Tupras EV/EBITDA progression
Source: BofA Merrill Lynch Global Research estimates
-
2,000
4,000
6,000
2014A 2015E 2016E 2017E
EBITDA (CCS) Net debt
3.6
1.5 1.1 1.0
-
1.0
2.0
3.0
4.0
2014A 2015E 2016E 2017E
10.0x
7.1x 6.8x 6.3x 6.0x 5.8x
4
6
8
10
12
2015E 2016E 2017E 2018E 2019E 2020E
7.0x
5.7x 5.4x 5.2x 5.0x 4.8x
4
5
6
7
8
2015E 2016E 2017E 2018E 2019E 2020E
Tupras 19 March 2015
6
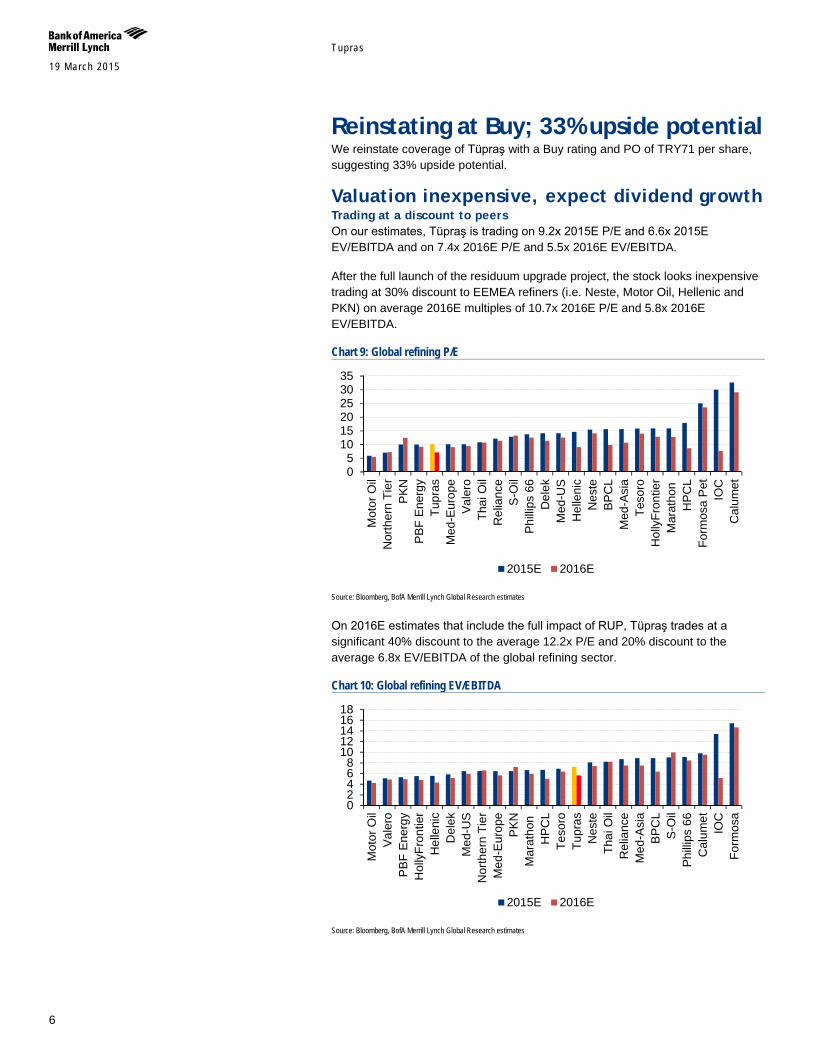
Reinstating at Buy; 33% upside potential We reinstate coverage of Tüpraş with a Buy rating and PO of TRY71 per share, suggesting 33% upside potential.
Valuation inexpensive, expect dividend growth Trading at a discount to peers On our estimates, Tüpraş is trading on 9.2x 2015E P/E and 6.6x 2015E EV/EBITDA and on 7.4x 2016E P/E and 5.5x 2016E EV/EBITDA.
After the full launch of the residuum upgrade project, the stock looks inexpensive trading at 30% discount to EEMEA refiners (i.e. Neste, Motor Oil, Hellenic and PKN) on average 2016E multiples of 10.7x 2016E P/E and 5.8x 2016E EV/EBITDA.
Chart 9: Global refining P/E
Source: Bloomberg, BofA Merrill Lynch Global Research estimates
On 2016E estimates that include the full impact of RUP, Tüpraş trades at a significant 40% discount to the average 12.2x P/E and 20% discount to the average 6.8x EV/EBITDA of the global refining sector.
Chart 10: Global refining EV/EBITDA
Source: Bloomberg, BofA Merrill Lynch Global Research estimates
05
101520253035
Mot
or O
ilN
orth
ern
Tier
PK
NP
BF
Ene
rgy
Tupr
asM
ed-E
urop
eV
aler
oTh
ai O
ilR
elia
nce
S-O
ilP
hilli
ps 6
6D
elek
Med
-US
Hel
leni
cN
este
BP
CL
Med
-Asi
aTe
soro
Hol
lyFr
ontie
rM
arat
hon
HP
CL
Form
osa
Pet
IOC
Cal
umet
2015E 2016E
02468
1012141618
Mot
or O
ilV
aler
oP
BF
Ene
rgy
Hol
lyFr
ontie
rH
elle
nic
Del
ekM
ed-U
SN
orth
ern
Tier
Med
-Eur
ope
PK
NM
arat
hon
HP
CL
Teso
roTu
pras
Nes
teTh
ai O
ilR
elia
nce
Med
-Asi
aB
PC
LS
-Oil
Phi
llips
66
Cal
umet
IOC
Form
osa
2015E 2016E

Tupras 19 March 2015
7
Turning into a dividend story Since its privatisation in 2006, Tüpraş has paid out its entire distributable profits as dividends in order to help its parent company Enerji Yatirimlari A.S. (EYAS), controlled by Koc Holding, repay its US$1.8bn acquisition loan. This dividend policy has been sustained despite the negative FCF since 2011.
The current remaining outstanding debt of EYAS is US$230mn payable in 2015. We see the current shareholder structure with Koc Holding as the controlling shareholder as positive for further dividend growth.
Tüpraş decided not to distribute dividends for 2014 due to a net loss posted in the statutory accounts on the back of a series of one-off losses and a negative inventory impact due to the massive decline in the oil price in 2H14.
We expect Tüpraş to resume paying dividends next year as earnings should grow on the back of the launch of the RUP expected in early 2Q15. We forecast DPS of TRY3.5 for 2015, TRY6.5 for 2016 and TRY7.5 for 2017. Tüpraş’s expected dividends would yield an attractive 6.5% for 2015 (payable in early 2Q16) and 12.2% for 2016 (payable in early 2Q17).
Chart 11: Tüpraş DPS (in TRY)
Source: Company data, BofA Merrill Lynch Global Research estimates
Chart 12: Tüpraş dividend yield
Source: Company data, BofA Merrill Lynch Global Research estimates
Tüpraş’s expected dividend yield would be the highest among the EEMEA refiners, which offer, on average, 4.4% for 2015E and 5.6% for 2016E. It would also be significantly higher than the average yields of the global refining peer group – 4.6% for 2015E and 4.6% for 2016E.
Chart 13: Global refiners dividend yield
Source: Bloomberg, BofA Merrill Lynch Global Research estimates
2.6 4.2
2.3 2.5 3.0 3.9 3.9
1.6 -
3.5
6.5 7.5
-
2.0
4.0
6.0
8.0
9%
14% 15%
8% 7% 9% 7%
4% 0%
7%
12% 14%
0%
5%
10%
15%
20%
0%2%4%6%8%
10%12%14%
Rel
ianc
eIO
CTe
soro
Mar
atho
nS
-Oil
Med
-Asi
aH
PC
LB
PC
LV
aler
oP
hilli
ps 6
6Fo
rmos
aP
KN
Nes
teD
elek
Med
-US
PB
F E
nerg
yTh
ai O
ilM
ed-E
EM
EA
Hel
leni
cTu
pras
Mot
or O
ilH
olly
Fron
tier
Cal
umet
Nor
ther
n Ti
er
2015E 2016E

Tupras 19 March 2015
8
FCF yield becoming solid Our dividend estimates are supported by robust expected FCF generation from 2015E. Dividends should be matched fully by strong FCF yielding 8% in 2015E, 12.1% in 2016E and 15.3% in 2017E.
Chart 14: Tüpraş FCF and dividends in TRYmn
Source: Company data, BofA Merrill Lynch Global Research estimates
Chart 15: FCF yield
Source: Company data, BofA Merrill Lynch Global Research estimates
PO TRY71 implies attractive 33% upside potential Our PO is based on the average of a DCF and comparable multiple valuation approach.
Table 1: Valuation summary US$m Weight US$m US$/share DCF 7,629 50% 3,815 15.23 Multiple 6,697 50% 3,349 13.37 12m target mcap estimate 7,163 28.6 Number of shares (m units) 250.4 250.4 12m PO (US$/share) 28.6 12m forward (US$/TRY) 2.50 12m PO (TRY/share) 71.00 Latest close (TRY/share) 53.50 Upside potential to PO (%) 32.7% Source: BofA Merrill Lynch Global Research estimates
Our DCF valuation results in a US$7.6bn equity value for Tüpraş. We use a 10.7% WACC for our DCF valuation based on 11.9% cost of equity, 5.2% after-tax cost of debt and 0% terminal growth.
Table 3: WACC calculation RFR 6.0% ERP 5.5% Beta 1.05 CoE 11.8% CoD 6.5% CoD after tax 5.2% Net Debt / Capitalisation 21% Equity / Capitalisation 80% WACC 10.7% Terminal growth rate 0.0% Source: BofA Merrill Lynch Global Research estimates
Our DCF-derived target equity value of US$7.6bn implies a TRY76.1/share price objective.
-
1,000
2,000
3,000
2014A 2015E 2016E 2017E
FCF Dividends
1.3%
8.0%
12.1% 15.3%
0%
5%
10%
15%
20%
2014A 2015E 2016E 2017E
Table 2: Beta calculation Unlevered beta 0.88 Net debt (2015YE) 1,678 Mcap 6,870 Tax 0.20 Geared beta 1.05 Source: BofA Merrill Lynch Global Research estimates

Tupras 19 March 2015
9
Table 4: Summary of DCF (US$mn) 2015E EV estimate 9,009 Less: Net debt (2015YE) 1,678 Less: minorities 28 Plus: subsidiaries 326 Target mcap (2015YE) 7,629 Number of shares (mn) 250.4 Valuation (US$/share) 30.5 Valuation (TRY/share) 76.1 Latest close (TRY/share) 53.5 Total return (%) 42% Source: BofA Merrill Lynch Global Research estimates
Table 5: DCF PO Sensitivity to WACC & Terminal Growth rate WACC
Termianl
Growth rate
71.1 10.00% 10.7% 11% 12.00% 13% 0% 77.3 71.1 69.1 62.2 56.4 1% 84.3 76.9 74.6 66.6 60.0 2% 92.9 84.0 81.2 71.9 64.3 3% 104.1 93.0 89.6 78.4 69.4
Source: BofA Merrill Lynch Global Research estimates
Our comparable multiple valuation is based on the average of 8x 2016E EV/EBITDA and 10x 2016E P/E target multiples Our target multiples are close to Tüpraş’s five-year historical average one-year forward multiples. Our 2016YE equity value estimates are then discounted using our 11.8% cost of equity. Our comparable multiple approach provides us with a US$6.7bn target equity value or TRY66.6 per share.
Table 6: Comparable multiple valuation (US$bn) Target multiple 8.0 Target multiple 10.0 16E EBITDA 1,234 15E Net income 754 16YE EV estimate 9,869 16YE Net Debt 1,378 16YE Minorities 32 16YE Subsidiaries 339 16YE equity value estimate 8,798 16YE equity value estimate 7,541 12m target equity value 7,212 12m target equity value 6,182 Weight 50% Weight 50% 2016E 12-m target equity value 6,697 # shares (mn) 250.4 Valuation (US$/share) 26.7 Valuation (TRY/share) 66.9 Latest close (TRY/share) 53.5 Total return (%) 25% Source: BofA Merrill Lynch Global Research estimates
Tupras 19 March 2015
10
Chart 16: Tupras P/E progression
Source: BofA Merrill Lynch Global Research estimates
Chart 17: Tupras EV/EBITDA progression
Source: BofA Merrill Lynch Global Research estimates
Chart 18: Tüpraş historical 1-year forward P/E
Source: Bloomberg, BofA Merrill Lynch Global Research estimates
Chart 19: Tüpraş historical 1-year forward EV/EBITDA
Source: Bloomberg, BofA Merrill Lynch Global Research estimates
10.0x
7.1x 6.8x 6.3x 6.0x 5.8x
4
6
8
10
12
2015E 2016E 2017E 2018E 2019E 2020E
7.0x
5.7x 5.4x 5.2x 5.0x 4.8x
4
5
6
7
8
2015E 2016E 2017E 2018E 2019E 2020E
6
7
8
9
10
11
12
13
Aug
-10
Dec
-10
Apr
-11
Aug
-11
Dec
-11
Apr
-12
Aug
-12
Dec
-12
Apr
-13
Aug
-13
Dec
-13
Apr
-14
Aug
-14
Dec
-14
456789
101112
Aug
-10
Dec
-10
Apr
-11
Aug
-11
Dec
-11
Apr
-12
Aug
-12
Dec
-12
Apr
-13
Aug
-13
Dec
-13
Apr
-14
Aug
-14
Dec
-14

Tupras 19 March 2015
11
RUP as the main growth driver RUP explained Since 2011, Tüpraş has focused on implementing a residuum upgrading project, a US$3bn investment to improve its competitiveness and profitability. The project consists of upgrading the Izmit refinery by improving its complexity to 14.5 from 7.8 currently. There will be no capacity additions, but the company will produce a higher share of white products: 4.5mn tons of raw materials will be transformed into 4.3mn tons of output. Of this, 3.5mn tons will be white products, comprising 2.88MMt of diesel, 0.52MMt of gasoline and 0.69MMt of LPG.
Chart 20: RUP feedstock and output
Source: Company data, BofA Merrill Lynch Global Research estimates
Management expects Tüpraş’s total refining capacity utilisation to increase to reach 95% post completion, compared with 74.9% in 2014 as the company will be able to process heavy product (i.e. atmospheric dip) in RUP units.
As of the end of January 2015, the company had spent a total of US$3bn on procurement and construction and the project was 99.8% complete. While the construction of the project was finished in December 2014, a test study of the units is currently under way and the full launch is planned in 2Q15.
RUP leads to a significant improvement in product slate… As a result of the RUP launch, we expect Tüpraş’s light product yield to rise from the current 71% to 84% in 2016. The product slate will be much more geared towards diesel (+81%), while fuel oil production should drop by 85%, on our estimates.
(3,036)
(1,214) (246)
69 86 522 690
2,883
(4,000)(3,000)(2,000)(1,000)
01,0002,0003,0004,000
Chart 21: Tupras capacity utilisation
Source: Company data, BofA Merrill Lynch Global Research estimates
77.9%
82.3% 78.7%
74.9%
82.6%
94.9%
70%
75%
80%
85%
90%
95%
100%

Tupras 19 March 2015
12
Chart 22: Tüpraş product slate in 2014
Source: Company data, BofA Merrill Lynch Global Research estimates
Chart 23: Tüpraş product slate in 2016
Source: BofA Merrill Lynch Global Research estimates
Post the launch of RUP, Tüpraş will be on par with most of its global peers in terms of complexity of refining operations.
Chart 24: Nelson Complexity Index
Source: Company data, BofA Merrill Lynch Global Research estimates
Chart 25: Light product yield
Source: Company data, BofA Merrill Lynch Global Research estimates
… and in margins Tüpraş recently guided that the positive impact from the RUP launch should add about US$650mn to annualised EBITDA. This translates into US$3.3/bbl in 2016, assuming a throughput increase to 26.7MMt to reach 95% capacity utilisation.
On our estimates, RUP should contribute US$419mn or US$2.5/bbl to 2015E EBITDA (assuming RUP launch from April 2015 and 82% total refining capacity utilisation) and US$599mn or US$3.1/bbl to EBITDA in 2016 and onwards (assuming ongoing 95% total refining capacity utilisation).
RUP profitability should be driven mainly by the diesel-fuel oil spread as the company will effectively replace fuel oil production with an increase in middle distillates. The spread has varied within a US$200-400/t range for the past two years with a decline recently on the back of the drop in the price of crude oil and related products.
4% 1%
22%
18% 27%
18%
1% 10% 1%
LPG Naphtha Gasolines
Jet fuel Diesel Fuel Oil
Lube oil Asphalt Coke/sulphur
4% 1%
24%
19% 38%
2% 1% 10% 4%
LPG Naphtha Gasolines
Jet fuel Diesel Fuel Oil
Lube oil Asphalt Coke/sulphur
6 7
9 9 10 10 10 10 11 11 12 12 12 12 13
456789
1011121314
BP
CL
Tupr
as C
urr
PK
ND
elek
IOC
Hel
leni
cTh
ai O
ilTu
pras
pos
t-RU
PM
arat
hon
PB
F E
nerg
yTe
soro
Phi
llips
66
Hol
lyFr
ontie
rV
aler
oR
elia
nce
50%55%60%65%70%75%80%85%90%
Cal
umet
Rel
ianc
eTu
pras
pre
-RU
PH
elle
nic
IOC
Nes
teN
orth
ern
Tier
Thai
Oil
Mar
atho
nTu
pras
pos
t-RU
PP
hilli
ps 6
6V
aler
oTe
soro
Mot
or O
ilD
elek
Hol
lyFr
ontie
r

Tupras 19 March 2015
13
Our calculations of the RUP impact are based on a US$250/t spread. On our estimates, each US$10/t move in the spread leads to a 7% change in the EBITDA of the RUP.
Chart 26: Diesel-fuel oil spread (US$/t)
Source: Bloomberg, BofA Merrill Lynch Global Research estimates
On our estimates, Tüpraş’s net refining margins should exceed US$5/bbl starting from 2016, which is a sizeable increase from the US$3.2/bbl posted in FY2014.
Chart 27: Tüpraş net refining margin (US$mn)
Source: Company data, BofA Merrill Lynch Global Research estimates
The margin increase will be a result not only of the RUP launch, but also significant cost savings on the back of lower energy costs, which we discuss in the following section.
200250300350400
3.3
2.5
3.2
5.0 5.3 5.4 5.4 5.5 5.6
2.0
3.0
4.0
5.0
6.0
FY12 FY13 FY14 FY15 FY16 FY17 FY18 FY19 FY20

Tupras 19 March 2015
14
Energy cost savings Tüpraş spent close to US$363mn or 63% of its clean CCS EBITDA on energy in 2014. As the energy price has almost halved since last year, we see further related cost savings as an important driver of Tüpraş’s profitability. We expect energy costs to go down due to the following reasons.
A 5-17% gas price decline in US$ in 2015E and 2016E In our base case, we expect the gas price for Tüpraş to go down by 5% in TRY from TRY798/mcm in 2014 to TRY758/mcm in 2015, or by 17% in US$ from US$364/mcm to US$303/mcm, respectively. A further 5% decline in both TRY and US$ in 2016 is also likely, in our view, if our oil price forecast materialises.
The cut in the gas price in Turkey should be driven by:
1. A low import gas price
2. 10.25% discount from Gazprom to Botas recently announced
3. Parliament elections in June 2015
Chart 28: Gas price (US$/mcm)
Source: BofA Merrill Lynch Global Research estimates
Chart 29: Botas’ gas price to Tupras (TRY/mcm)
Source: Botas data, BofA Merrill Lynch Global Research estimates
Russian gas accounts for c.60% of total gas consumed in Turkey, while the remaining import volumes are split between Iran (18%), Azerbaijan (7%) and others.
Chart 30: Turkey gas balance
Source: Oxford Institute for Energy Studies
Gazprom’s export gas prices are linked to a basket of oil products with a 6-9 month time lag. Oil product prices usually follow the crude oil price with a short time lag. This implies that Gazprom’s export price to Turkey will start reflecting January’s weakness in the crude oil price only in 3Q15.
435 421
285 237
410 364
303 288
100200300400500
2013 2014 2015 2016
Turkey input gas price Botas' gas price to Tupras
778 798
758
720
700720740760780800820
2013 2014 2015 2016
58%
18%
7%
17%
Russia Iran Azerbaijan Other

Tupras 19 March 2015
15
Moreover, Gazprom and the Turkish state company Botas recently started negotiations on a gas price discount as part of the agreement on the construction of the Turk Stream gas pipeline. The discount is planned at 10.25% and may be applied retroactively since the beginning of the year so that the gas price for Botas in the first quarter will fall to around US$332/mcm. We would expect Gazprom’s price to drop further, reaching a trough of US$165/mcm in 4Q15 on the back oil price decline.
Chart 31: Gazprom’s gas price to Turkey (US$/mcm)
Source: Company data, BofA Merrill Lynch Global Research estimates
Chart 32: Brent crude oil price (US$/bbl)
Source: BofA Merrill Lynch Global Research estimates
We see long-term positive trends for Turkish gas consumers including Tüpraş. Gazprom recently scrapped its plans to export gas to Europe via the South Stream pipeline and now plans to build the Turk Stream pipeline to Turkey instead. The construction of TANAP pipeline project was officially launched recently that will direct natural gas from Azerbaijan’s Shah Deniz field via Turkey to Europe. All this should help turn Turkey into a regional gas transportation hub, which would have a positive effect on the gas price for local consumers in the long term. Gazprom’s 10.25% discount to Botas would be the first step in that direction.
Liquids cost to drop by 48% in 2015 We expect the liquid energy cost (mainly fuel oil) to decline 48% in 2015 on the back of the global oil price drop. We forecast the average Brent oil price to go down by 52.6% to US$52/bbl in 2015 from US$98.9/bbl in 2014, driving down oil product prices accordingly.
Chart 33: Tupras liquids consumption (kt)
Source: BofA Merrill Lynch Global Research estimates
Chart 34: Liquids cost for Tupras (US$/t)
Source: BofA Merrill Lynch Global Research estimates
Total energy cost savings to exceed US$100mn per annum On our estimates, in 2014, Tüpraş consumed 0.75MMtoe of energy, composed of 0.15MMtoe of natural gas feedstock and 0.6MMtoe of other energy feedstock, mainly fuel oil.
150200250300350400450
2010 2011 2012 2013 2014 2015 201640
60
80
100
120
2010 2011 2012 2013 2014 2015 2016
500550600650700750800
2014 2015 2016200
300
400
500
600
2014 2015 2016

Tupras 19 March 2015
16
We expect gas consumption to increase by c.250ktoe/year once RUP becomes fully operational. Other energy costs (i.e. fuel oil) should rise in line with the higher refining capacity utilisation, planned to reach 95% post full RUP launch from the current 75%.
On our estimates, weighted average energy costs should go down by 43% from US$470/toe in 2014 to US$268mn in 2015 and by 40% to US$283/toe in 2016 driven by: 1) a lower crude oil price, 2) lower natural gas prices, and 3) TRY devaluation (Botas’s gas price for Tüpraş is denominated in TRY).
This should lead the energy cost to decline from US$2.4/bbl of crude oil processed in 2014 to US$1.7/bbl in 2015 and (-28% vs. 2014) and US$1.8/bbl in 2016 (-25% vs. 2016). In absolute figures, Tüpraş should achieve US$113mn and US$109mn in energy cost savings in 2015E and 2016E, respectively, corresponding to about 11% and 9% of its EBITDA.
Table 7: Tüpraş energy consumption, cost and savings 2014 2015E 2016E Total energy feedstock (ktoe) 750 996 1,156 - gas 150 335 396 - liquids (i.e. fuel oil) 600 662 760 Energy prices (US$/toe) - weighted average 470 268 283 - gas 328 273 259 - liquids (i.e. fuel oil) 505 265 296 Total energy cost (US$mn) 364 288 352 - gas 61 113 127 - liquids (i.e. fuel oil) 303 176 225 Energy cost in US$/bbl of throughput 2.4 1.7 1.8 % YoY -28% -24% Energy savings vs. 2014 (US$mn) 113 109 Energy savings vs. 2014 (TRYmn) 282 273 Source: Company data, BofA Merrill Lynch Global Research estimates
Tupras 19 March 2015
17
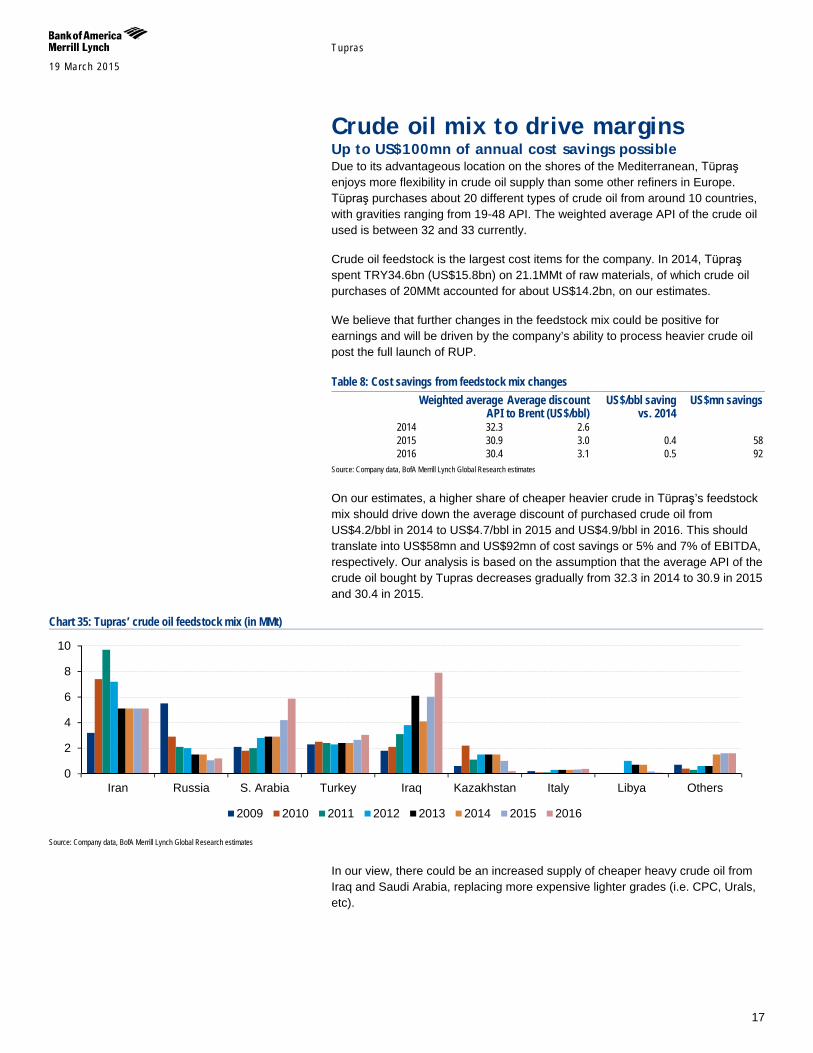
Crude oil mix to drive margins Up to US$100mn of annual cost savings possible Due to its advantageous location on the shores of the Mediterranean, Tüpraş enjoys more flexibility in crude oil supply than some other refiners in Europe. Tüpraş purchases about 20 different types of crude oil from around 10 countries, with gravities ranging from 19-48 API. The weighted average API of the crude oil used is between 32 and 33 currently.
Crude oil feedstock is the largest cost items for the company. In 2014, Tüpraş spent TRY34.6bn (US$15.8bn) on 21.1MMt of raw materials, of which crude oil purchases of 20MMt accounted for about US$14.2bn, on our estimates.
We believe that further changes in the feedstock mix could be positive for earnings and will be driven by the company’s ability to process heavier crude oil post the full launch of RUP.
Table 8: Cost savings from feedstock mix changes
Weighted average
API Average discount to Brent (US$/bbl)
US$/bbl saving vs. 2014
US$mn savings
2014 32.3 2.6 2015 30.9 3.0 0.4 58 2016 30.4 3.1 0.5 92
Source: Company data, BofA Merrill Lynch Global Research estimates
On our estimates, a higher share of cheaper heavier crude in Tüpraş’s feedstock mix should drive down the average discount of purchased crude oil from US$4.2/bbl in 2014 to US$4.7/bbl in 2015 and US$4.9/bbl in 2016. This should translate into US$58mn and US$92mn of cost savings or 5% and 7% of EBITDA, respectively. Our analysis is based on the assumption that the average API of the crude oil bought by Tupras decreases gradually from 32.3 in 2014 to 30.9 in 2015 and 30.4 in 2015.
Chart 35: Tupras’ crude oil feedstock mix (in MMt)
Source: Company data, BofA Merrill Lynch Global Research estimates
In our view, there could be an increased supply of cheaper heavy crude oil from Iraq and Saudi Arabia, replacing more expensive lighter grades (i.e. CPC, Urals, etc).
0
2
4
6
8
10
Iran Russia S. Arabia Turkey Iraq Kazakhstan Italy Libya Others
2009 2010 2011 2012 2013 2014 2015 2016

Tupras 19 March 2015
18
Chart 36: Tüpraş’s crude oil feedstock mix per country in 2014
Source: BofA Merrill Lynch Global Research estimates
Chart 37: Tüpraş’s crude oil feedstock mix per country in 2016
Source: BofA Merrill Lynch Global Research estimates
Higher oil intake from Iraq possible Since 2012, in most cases, Tüpraş has offset declining Iran crude oil imports with higher shipments from Iraq. In 2013, it imported 6.1mn tons of crude oil from Iraq, up from 1.8mn tons in 2009. However, on our estimates, Tüpraş’s purchase of Iraqi crude oil might have declined by about 2MMt to 4.1MMt in 2014 (undisclosed by Tupras) on the back of geopolitical instability in Iraq owing to the advance of Islamic State on its territory.
In the meantime, Iraq is still expected to make the largest contribution to OPEC capacity over the coming decade. Its 90 billion barrels of oil resources offer production longevity, making the country a key long-term supplier to the global oil market. Production has grown from 2.4 million b/d when the Technical Service Contracts came into force in 2010, to 3.3 million b/d in 2014. The majority of the production increase has come from the southern fields, but Kurdistan is becoming an important contributor.
According to WoodMackenzie’s estimates, Iraqi hydrocarbon liquids production could rise to around 4.5 mb/d in 2020, while Kurdistan's contribution is expected to increase from its current 8% to around 16%, with 725,000 b/d production forecast for 2020.
Chart 38: Iraq’s hydrocarbon liquids production (kboepd)
Source: WoodMackenzie
Chart 39: Tupras’ crude oil purchases from Iraq (hist. and forecast)
Source: Company data, BofA Merrill Lynch Global Research estimates
Due to the advance of Islamic State into Iraq output from the northern federal Iraqi fields is almost completely shut-in now. However, production from the
25%
7%
14%
12%
20%
7%
1%
Iran
Russia S. Arabia Turkey
Iraq Kazakhstan Italy
23%
5%
19%
12%
27%
2% 1%
Iran
Russia S. Arabia Turkey
Iraq Kazakhstan Italy
1,700
2,700
3,700
4,700
5,700
1.8 2.1 3.1
3.8
6.1
4.1
6.0
7.9
1
3
5
7
9
2009 2010 2011 2012 2013 2014 2015 2016

Tupras 19 March 2015
19
southern fields and Kurdistan remains unaffected, although the militants’ presence has increased security risks for oil operators in Iraq.
Higher purchases from Iraq would be value-accretive for Tüpraş, as these may be priced at a significant discount of around US$4-5/bbl to the Brent oil price. We believe Tüpraş will aim to grow purchases from Iraq to cover rising refining needs post the RUP launch, should the geopolitical situation allow. We would expect about a 2MMt of annual increase in oil purchases from Iraq in 2015 and 2016 by Tüpraş.
Iran remains potential catalyst Tüpraş used to buy 7-10MMt of Iranian crude oil per year before the latest sanctions against the Iranian energy sector came into effect in 2012. Tüpraş’s purchase of Iranian crude oil has dropped to around 5MMt/year since then and is now set on an annual basis for the company.
Chart 40: Tupras’ crude oil purchases from Iran (hist. and forecast)
Source: Company data, BofA Merrill Lynch Global Research estimates
Should Iran’s negotiations with the West over its nuclear programme end in a comprehensive agreement, it would have long-term positive implications for the export of Iranian crude to Turkey. 30 June 2015 is the key deadline for negotiations to watch at the moment. See EEMEA Economic Weekly: Iran negotiations – crunch time published on 13 March 2015 for more details on the Iran negotiations and potential outcomes.
We currently model Tüpraş making purchases of 5.1MMt of Iranian crude oil per year based on recent historical volumes. Assuming Iranian crude oil is priced at around a US$5/bbl discount to Brent, a 1MMt incremental supply of crude from Iran could result in about a US$15mn gain for Tüpraş. Our calculation is based on the assumption that Tüpraş’s crude oil purchase discount to Brent drops to around US$3.1/bbl in 2016, as highlighted above.
3.2
7.4
9.7
7.2
5.1 5.1 5.1
2
4
6
8
10
2009 2010 2011 2012 2013 2014 2015
Table 9: Impact of higher crude from Iran Additional
volume (MMt) Total volume
(MMt) US$mn gain 0 5.1 0 1 6.1 15 2 7.1 30 3 8.1 44 4 9.1 59 5 10.1 74
Source: BofA Merrill Lynch Global Research estimates

Tupras 19 March 2015
20
Efficiency improvement drives growth Apart from the flagship RUP, Tüpraş has undertaken other projects to streamline efficiency:
Izmir refinery: Investment in efficiency improvement projects at the Izmir refinery resulted in savings of more than US$30mn/annum. The installation of a new gas turbine with 25MW electricity generation capacity yielded annual energy savings of 132,383 gcal and annual monetary savings of US$9.7mn. Through modifications of operational parameters, diesel productivity was increased, which yielded US$11.3mn in annual savings. By improving operational parameters at crude oil units, semi-finished products were transformed into kerosene instead of naphtha. As a result, productivity increased 2%, and annual savings of US$12mn were achieved.
Kirikkale refinery: Investment to improve crude oil energy efficiency at Kirikkale will result in annual monetary savings of more than US$50mn
Chart 41: Investing in Efficiency projects (US$ mn)
Source: Company, Merrill Lynch Research
18
146
79 81
42
32 62
105 106
31 0
20406080
100120140160180200
2007 2008 2009 2010 2011 2012 2013
OMP EVP

Tupras 19 March 2015
21
Turkish market in growth phase Turkish oil product market in growth stage Relatively healthy economic growth in Turkey in recent years (i.e. GDP growth of 3.8% in 2013 and 2.7% in 2014) underpinned strong trends in petroleum product consumption in 2014:
jet fuel rose by 11.2% YoY
diesel consumption was up 4.2%
gasoline demand rose by 3.2%.
In the meantime, the country’s use of non-standard and informal petroleum products has dropped as a result of various measures being implemented.
Going forward, our macro research team expects 3.2% GDP growth in 2015 and 4% in 2016 in Turkey which, on our estimates, should translate into steady 2% per annum growth in total oil product demand, among the strongest rates in Europe. By 2020, Turkish consumption of petroleum products should reach 40Mt, on our estimates.
Most of this increase reflects incremental demand for gas/diesel oil, with the bulk of this representing road diesel, while a projected expansion in ethylene capacity should provide a substantial boost to naphtha sales. We expect the sales of most other oil products to increase during the forecast period.
Chart 43: Turkey oil product market growth (kt)
Source: BofA Merrill Lynch Global Research estimates
Gasoline consumption decline reversed Gasoline demand in Turkey has been in decline since the late 1990s because of the improved efficiency of gasoline engines as well as one of the highest retail fuel prices in Europe. As Turkey seeks accession to the EU, it is likely that it will increasingly adopt EU policy standards and initiatives. Thus, in line with wider EU policy, we expect the government to start pushing for a reduction in carbon
0
5,000
10,000
15,000
20,000
25,000
30,000
35,000
40,000
45,000
LPG Naphtha Gasolines
Jet fuel Total diesel Total fuel oil
Lube oil Asphalt Others
Chart 42: Turkey oil product demand growth
Source: BofA Merrill Lynch Global Research estimates
-2%0%2%4%6%8%
10%12%
Gasolines Jet fuel
Total diesel

Tupras 19 March 2015
22
emissions from transport. Therefore, growth in the car stock should be skewed towards new diesel and LPG cars, while the number of gasoline cars remains relatively static. We conservatively expect gasoline consumption to increase at only a 1-1.3% 2014-20E CAGR.
Local diesel market in deficit Turkey has large deficit in diesel, with domestic production covering only one-third of total demand in 2014.
Chart 44: Domestic production of diesel vs. imports in Turkey (MMt)
Source: Company data, WoodMackenzie, BofA Merrill Lynch Global Research estimates
Tüpraş’s full-scale launch of RUP should contribute about 2.9MMt/annum of diesel to domestic output and cover about 12% of demand in 2015E and 16% in 2016E. After the launch of RUP, Turkey will still have to import diesel to cover close to 50% of local demand.
Diesel demand driven by auto & GDP Diesel demand growth (c.5.2% pa from 2010-13) was driven largely by the road transport sector. Car penetration in Turkey of 165 cars per 1,000 people is still well below the European average of 500. Increasing purchasing power combined with a strong dieselisation trend in the car fleet has contributed to rising diesel consumption.
Chart 45: Turkey GDP YoY (%) vs. car sales (% yoy)
Source: Bloomberg, BofA Merrill Lynch Global Research
Chart 46: Total vehicle numbers in Turkey (mn)
Source: Company data, BofA Merrill Lynch Global Research estimates
While the recent strong dieselisation trend in the car fleet has contributed to rising diesel consumption, it is commercial transport which is estimated to account for around two thirds of diesel demand.
The other major sector of gas/diesel oil demand is Turkey's large agricultural sector. Agricultural fuel demand has grown steadily over the past decade and
5.6 5.3 8.1 9.6
11.1 12.1 9.9 8.7
0
5
10
15
20
2013 2014 2015 2016
Diesel production Diesel imports
-15%
0%
15%
30%
45%
60%
75%
-3
0
3
6
9
12
15
2009
2010
2011
2012
2013
GDP YoY (%) Car sales LTM (% yoy)
4.6 5.4 6.1 6.8 7.1 7.5 8.1 8.6 9.3 4.1 4.8
6.1 7 7.2 7.6 8 8.4 8.7
0
5
10
15
20
2002 2004 2006 2008 2009 2010 2011 2012 2013
Cars Other

Tupras 19 March 2015
23
continued increases in agricultural production are expected to result in this volume continuing to rise over the remainder of the forecast period.
Also, the increase in diesel consumption can be attributed to the implementation of the Special Consumption Tax (SCT) reimbursement in base oils to address problems such as the consumption of off-spec Number 10 diesel. These measures have been very effective in preventing this type of misconduct in the market.
We would expect growth momentum to be maintained until 2020 and forecast above a 2% 2015-20E CAGR of diesel demand in Turkey.
Chart 47: Turkey consumer confidence vs. car sales
Source: Bloomberg, BofA Merrill Lynch Global Research
Chart 48: Diesel consumption & GDP growth rate in Turkey
Source:, BofA Merrill Lynch Global Research
Rise in air traffic to boost jet fuel growth Jet fuel demand has grown strongly from 2011 at an average annual rate of 12% during this period. Growth in domestic air travel and the development of budget airlines (mainly inter-city flights) were among the key drivers. International travel has seen growth in this period as well, with a rise tourist numbers. Istanbul has become a hub for Turkish airlines and big investments in infrastructure will continue to bolster jet fuel consumption growth (above a 4% 2015-20E CAGR).
Chart 49: No of air passengers in Turkey (mn); 14% CAGR in past five years
Source: Company data, BofA Merrill Lynch Global Research estimates
Eurocontrol forecasts 7% CAGR growth for flight movements for Turkey (leading in Europe) thorough 2019. Turkish airports authority (DHMI) expects 9% CAGR growth in passenger numbers through 2023 (350mn pax in 2023 vs. 166mn achieved in 2014).
400,000
500,000
600,000
700,000
800,000
900,000
1,000,000
4045505560657075808590
2008
2009
2010
2011
2012
2013
2014
Turkey Consumer Confidence Car Sales LTM
-6%
-4%
-2%
0%
2%
4%
6%
8%
-6-4-202468
10
2009 2010 2011 2012 2013 9M-14
GDP Growth (LHS) Diesel Demand Growth (RHS)
35.8 41.2 50.6 58.3 64.5 76.1 43.6 44.3
52.2 59.4
65.4 73.4
0
25
50
75
100
125
150
2008 2009 2010 2011 2012 2013
Domestic International

Tupras 19 March 2015
24
Chart 50: # of air flights in Europe CAGR in 2012-2019E
Source: Eurocontrol Statistical Reference Area
Turkey as 2nd biggest auto-LPG market worldwide LPG demand grew rapidly to reach 1.3 Mt by the start of the last decade and, although the government has scaled back the subsidies since then, consumption continued its progress and overtook gasoline in 2010. The increase in gasoline price in recent years boosted conversions form gasoline to LPG, and the number of vehicles equipped to run on LPG is now estimated at 3 million. As a result, Turkey is the second largest auto-LPG market in the world amounting to 2.7 Mt in 2013.
Chart 51: Turkey’s car park by vehicle type
Source: WoodMackenzie
Fuel oil demand under pressure Fuel oil demand has been in terminal decline throughout the last decade as demand in the power and industrial sector has diminished, due to the steady displacement of fuel oil by natural gas in these sectors. Inland demand is expected to continue to fall in the period to 2025 although this is more than offset by rising marine bunker fuel demand, so that demand increases to 1.8 Mt by 2025. Overall, this represents an annual increase of 1.0% between now and the end of the forecast period.
012345678
Turk
eyG
eorg
iaA
zerb
haija
nA
rmen
iaM
oldo
via
Bul
garia
Rom
ania
Ukr
aine
Bel
arus
Mal
taH
unga
ryC
ypru
sS
lova
kia
Icel
and
Cro
atia
Bos
nia-
Her
z.Li
thua
nia
Pol
and
Ser
bia
& M
ont.
FYR
OM
Alb
ania
Slo
veni
aE
ston
iaM
oroc
coC
zech
Rep
.La
tivia
Gre
ece
San
ta M
aria
Aus
tria
Irela
ndS
wed
enB
elgi
umD
enm
ark
Ger
man
yIta
lyN
ethe
rland UK
Lisb
onFr
ance
Sw
itzer
land
Finl
and
Nor
way
Spa
inC
anar
y Is
l.
0
5000
10000
15000
20000
Conventional Hybrids AEV/PHEV Other LPG Diesel Gasoline

Tupras 19 March 2015
25
Monopoly in an attractive market Tüpraş is by far the leading player in the Turkish wholesale market for oil products across all the segments of the value chain:
Tüpraş controls all Turkey’s 28.1MMt refining capacity. In terms of geographical location, its refineries are deployed adjacent to consumption areas and are best suited to meet the country’s needs, which adds to the competitive strengths of the company.
It owns 59% of the total petroleum products storage capacity in Turkey, comprising 1.7 million tons of crude oil, 1.3 million tons of white product and 0.9 million tons of black product.
Tüpraş maintains a leading c.50% market share in wholesale of oil products in Turkey, which is mainly covered by own production, but also via imports (mainly diesel). The RUP should allow Tüpraş to raise its market share to 60% in 2016, on our estimates.
Chart 52: Tüpraş’s market share in 2014
Source: Company data, BofA Merrill Lynch Global Research estimates
Chart 53: Tüpraş’s market share in 2015E
Source: Company data, BofA Merrill Lynch Global Research estimates
Chart 54: Tüpraş’s market share in 2016E
Source: Company data, BofA Merrill Lynch Global Research estimates
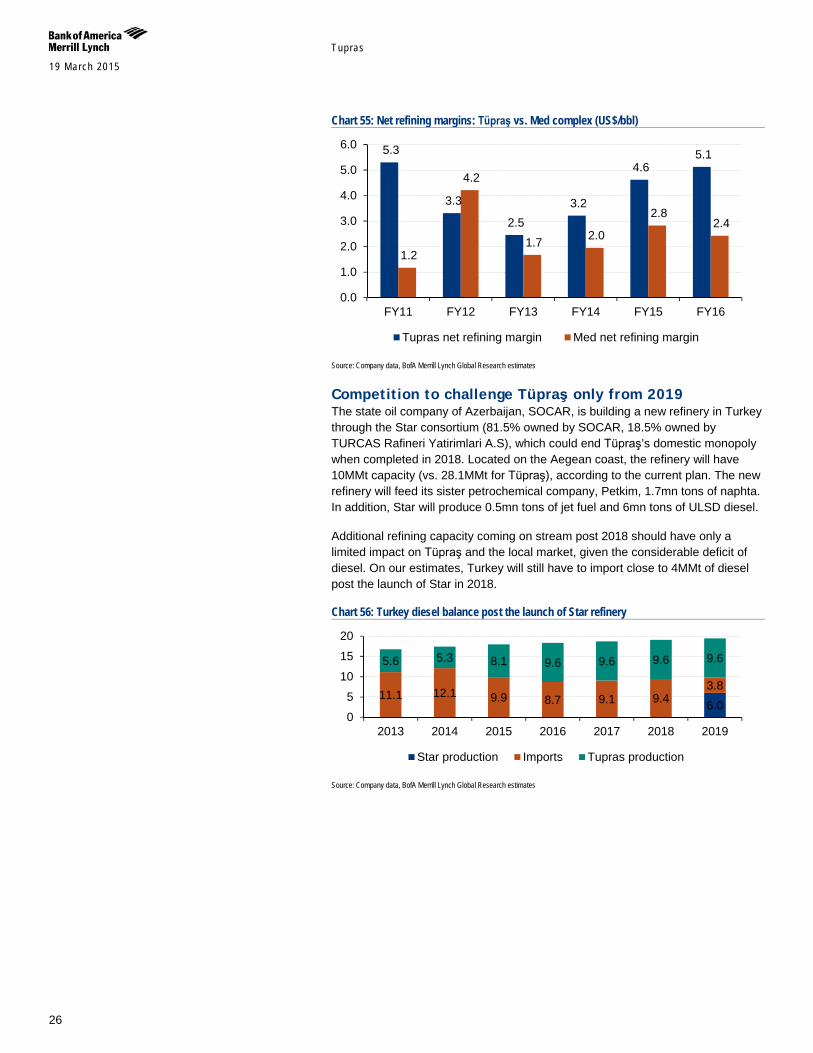
Higher net refining margin than Med peers In line with its peers, Tüpraş’s refining margins compressed from 2011 to 1H14 driven by higher capacity utilisation across the industry, lower price differentials between crude grades and higher energy costs due to an increase in natural gas prices in Turkey. However, even in tough times, the company generates higher margins than its peers on average, mainly thanks to a Turkey inland price premium and a better crude oil sourcing mix. In 2014, Tüpraş’s net refining margin was US$3.2/bbl, US$1.2 above the Mediterranean net complex benchmark. The RUP project should add up to US$3/bbl to Tüpraş’s margin on our estimates.
8% 10% 18% 21%
39% 80%
94% 95% 98%
48.3%
0% 50% 100% 150%
NaphthaOthers
Lube oilLPG
DieselFuel oilJet fuel
GasolinesAsphalt
Total
10% 20% 24%
45% 53%
79% 93% 96% 98%
56%
0% 50% 100% 150%
NaphthaLube oil
LPGOthersDiesel
Fuel oilJet fuel
GasolinesAsphalt
Total
11% 19% 27%
54% 56% 60%
95% 96% 98%
60%
0% 50% 100% 150%
NaphthaLube oil
LPGFuel oilOthersFiesel
Jet fuelGasolines
AsphaltTotal
Tupras 19 March 2015
26
Chart 55: Net refining margins: Tüpraş vs. Med complex (US$/bbl)
Source: Company data, BofA Merrill Lynch Global Research estimates
Competition to challenge Tüpraş only from 2019 The state oil company of Azerbaijan, SOCAR, is building a new refinery in Turkey through the Star consortium (81.5% owned by SOCAR, 18.5% owned by TURCAS Rafineri Yatirimlari A.S), which could end Tüpraş’s domestic monopoly when completed in 2018. Located on the Aegean coast, the refinery will have 10MMt capacity (vs. 28.1MMt for Tüpraş), according to the current plan. The new refinery will feed its sister petrochemical company, Petkim, 1.7mn tons of naphta. In addition, Star will produce 0.5mn tons of jet fuel and 6mn tons of ULSD diesel.
Additional refining capacity coming on stream post 2018 should have only a limited impact on Tüpraş and the local market, given the considerable deficit of diesel. On our estimates, Turkey will still have to import close to 4MMt of diesel post the launch of Star in 2018.
Chart 56: Turkey diesel balance post the launch of Star refinery
Source: Company data, BofA Merrill Lynch Global Research estimates
5.3
3.3
2.5 3.2
4.6 5.1
1.2
4.2
1.7 2.0
2.8 2.4
0.0
1.0
2.0
3.0
4.0
5.0
6.0
FY11 FY12 FY13 FY14 FY15 FY16
Tupras net refining margin Med net refining margin
6.0 11.1 12.1 9.9 8.7 9.1 9.4
3.8
5.6 5.3 8.1 9.6 9.6 9.6 9.6
0
5
10
15
20
2013 2014 2015 2016 2017 2018 2019
Star production Imports Tupras production
Tupras 19 March 2015
27
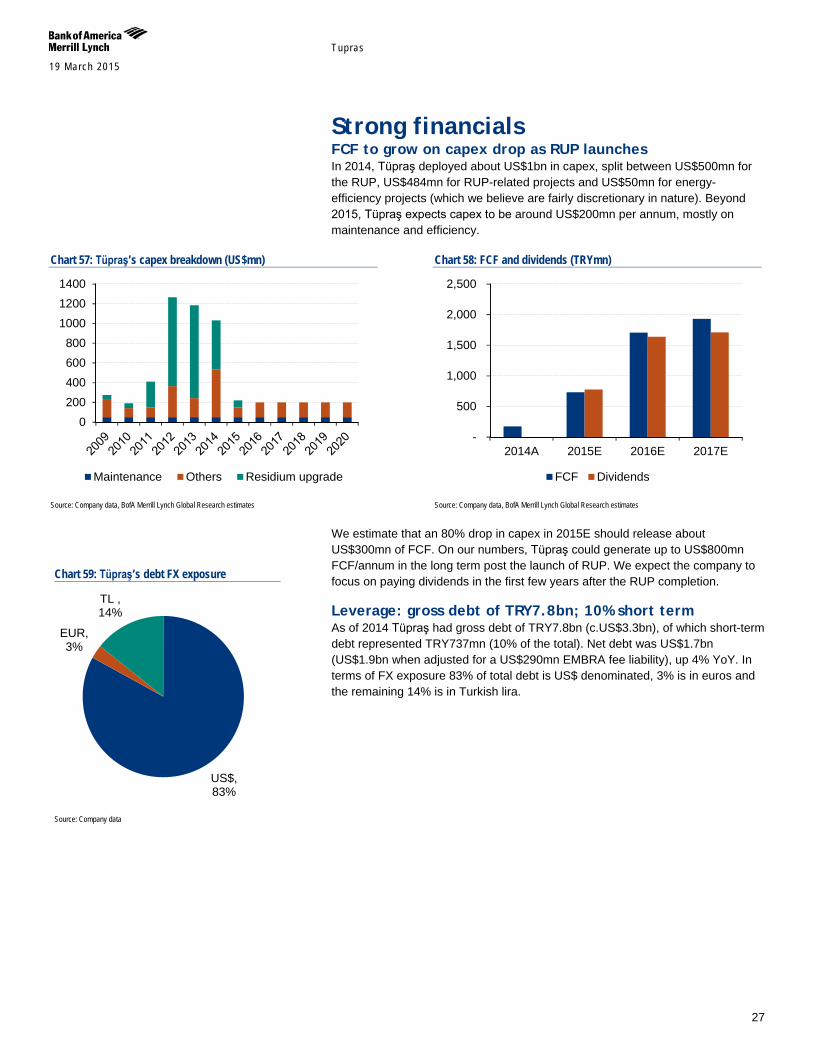
Strong financials FCF to grow on capex drop as RUP launches In 2014, Tüpraş deployed about US$1bn in capex, split between US$500mn for the RUP, US$484mn for RUP-related projects and US$50mn for energy-efficiency projects (which we believe are fairly discretionary in nature). Beyond 2015, Tüpraş expects capex to be around US$200mn per annum, mostly on maintenance and efficiency.
Chart 57: Tüpraş’s capex breakdown (US$mn)
Source: Company data, BofA Merrill Lynch Global Research estimates
Chart 58: FCF and dividends (TRYmn)
Source: Company data, BofA Merrill Lynch Global Research estimates
We estimate that an 80% drop in capex in 2015E should release about US$300mn of FCF. On our numbers, Tüpraş could generate up to US$800mn FCF/annum in the long term post the launch of RUP. We expect the company to focus on paying dividends in the first few years after the RUP completion.
Leverage: gross debt of TRY7.8bn; 10% short term As of 2014 Tüpraş had gross debt of TRY7.8bn (c.US$3.3bn), of which short-term debt represented TRY737mn (10% of the total). Net debt was US$1.7bn (US$1.9bn when adjusted for a US$290mn EMBRA fee liability), up 4% YoY. In terms of FX exposure 83% of total debt is US$ denominated, 3% is in euros and the remaining 14% is in Turkish lira.
0200400600800
100012001400
Maintenance Others Residium upgrade
-
500
1,000
1,500
2,000
2,500
2014A 2015E 2016E 2017E
FCF Dividends
Chart 59: Tüpraş’s debt FX exposure
Source: Company data
US$, 83%
EUR, 3%
TL , 14%

Tupras 19 March 2015
28
Chart 60: Tüpraş Debt Maturity profile (TRY mn)
Source: Company, BofA Merrill Lynch Global Research
We expect Tüpraş’s net debt/EBITDA to go down from 5.9x in 2014 to 1.1x in 2017E on the back of high earnings growth and gradual deleveraging post the RUP launch.
Chart 61: Net debt/EBITDA
Source: Company, BofA Merrill Lynch Global Research
Impact of FX on Tüpraş: positive in the long term Besides export revenues, which are US$-denominated, Tüpraş generates around 81% of its revenue domestically. These revenues are in Turkish lira but also US$-linked. The company may also incur gains and losses from inventory due to FX. That said, excluding raw materials, capex and finance costs, most of Tüpraş’s operating costs are in Turkish lira.
On the debt side, Tüpraş is exposed to FX risk as 83% of gross debt is US$-denominated, 3% is in euros and the remaining 14% is in Turkish lira. Weaker lira implies an FX loss owing to the US$-denominated debt revaluation.
All in all, on our estimates, a 10% weakening in TRY has 17% positive impact on Tupras EBITDA and mostly negligible below 2% negative impact of on the net income in 2015. In longer term, the company wins from weaker TRY once FX losses stemming from the debt revaluation are left behind and the products are priced based on a stronger USD.
737
1,489
840
2,343
477
1,827
-
500
1,000
1,500
2,000
2,500
2015 2016 2017 2018 2019 2020+
5.9
1.8 1.2 1.1
-
2.0
4.0
6.0
8.0
2014A 2015E 2016E 2017E

Tupras 19 March 2015
29
Turkey: the macro view Trimming GDP growth forecasts In its recent report Trimming GDP growth forecast, our macroeconomics research team highlighted that Turkey has largely missed a great opportunity to ride a strong cyclical tailwind and to address its macro vulnerabilities smoothly at a time when the Fed’s normalisation of rates is looming. As a result, first domestic politics hit the TRY and Turkish assets, and then soured EM risk sentiment on the back of increased concerns of an earlier-than-expected Fed hike took its toll.
Further volatility in both domestic politics and global financial markets in 2Q15 is likely to take its toll on economic activity and macro indicators. The risks are to the downside on GDP growth and the CAD, and to the upside on inflation in 2015 due to TRY weakness. Leading indicators suggest that both private consumption and investments have been slow to recover in 1Q15. Our 2015E GDP growth forecast was cut by 0.5ppt to 3.2%.
June elections key to the outlook Turkey is expected to hold parliamentary elections on 7 June. The elections have become the crossroads for the outlook for Turkish assets. President Erdogan has suggested that June elections could represent a break from the past in terms of both moving to a presidential system and introducing a new economic framework. The row between President Erdogan and the Central Bank of Turkey (CBT) on monetary policy caused the markets to question the CBT’s independence going forward. One concern is ‘interference’ with the CBT’s policy, which could lead to more aggressive rate cuts than desired and result in the TRY weakening.
Chart 62: Real GDP growth to bounce back, but recovery delayed
Source: Haver, BofA Merrill Lynch Global Research
Chart 63: Domestic demand is likely to strengthen
Source: Haver, BofA Merrill Lynch Global Research
-6
-4
-2
0
2
4
6
8
10
12
2003
2004
2005
2006
2007
2008
2009
2010
2011
2012
2013
2014
e
2015
F
2016
F
Real GDP growth (%yoy)
-5-3-113579
111315
03 04 05 06 07 08 09 10 11 12 13 1Q14 14F 15FPrivate cons. Public cons. GFCFInventories Net exports GDP growth
%

Tupras 19 March 2015
30
Chart 64: External demand pulling down Turkish IP growth
Source: Haver, BofA Merrill Lynch Global Research
Chart 65: Weaker TRY is likely to dent domestic confidence
Source: Haver, BofA Merrill Lynch Global Research
A ‘Robin Hood’ recovery Lower oil prices act as a significant tax cut for a large number of consumers, funded by a few oil exporters. This income redistribution from rich, saving countries to poor, non-saving peers should be positive for growth as the latter have a higher marginal propensity to consume. This is also the case for the EEMEA region and Turkey is comfortably at the receiving end of this transfer.
In a global backdrop with lower oil prices and global yields, Turkey stands out in EEMEA for four main reasons, in our view: 1) its economy is relatively more closed and depends more on domestic demand, with exports to GDP at 25%; 2) the average age of the population is a young 29.3 and this demographic has a higher tendency to spend; 3) it is one of the main energy importers, with energy imports to GDP at 7%; and 4) its growth model depends heavily on lower interest rates
Side effects of low oil price The side effect of lower oil prices on Turkey’s growth would be a rise in oil product exports because some 80% head to Europe and MENA. In addition, lower crude prices have a positive impact on inflation as fuel prices in TRY have come down by roughly 15% from July highs to end-2014 and by another 5% in January.
-30
-10
10
30
30
40
50
60
Jan-06 Jan-07 Jan-08 Jan-09 Jan-10 Jan-11 Jan-12 Jan-13 Jan-14 Jan-15
PMI_TUTurkish IP growth (rhs, % yoy)
60
70
80
90
100
110
120
55
60
65
70
75
80
85
Jan-
07
Jan-
08
Jan-
09
Jan-
10
Jan-
11
Jan-
12
Jan-
13
Jan-
14
Jan-
15
Consumer Confidence IndexReal Sector Confidence Index (sa)
Exhibit 1: Gross National Savings (% of GDP)
Source: Haver, Bank of America Global Research
Tupras 19 March 2015
31
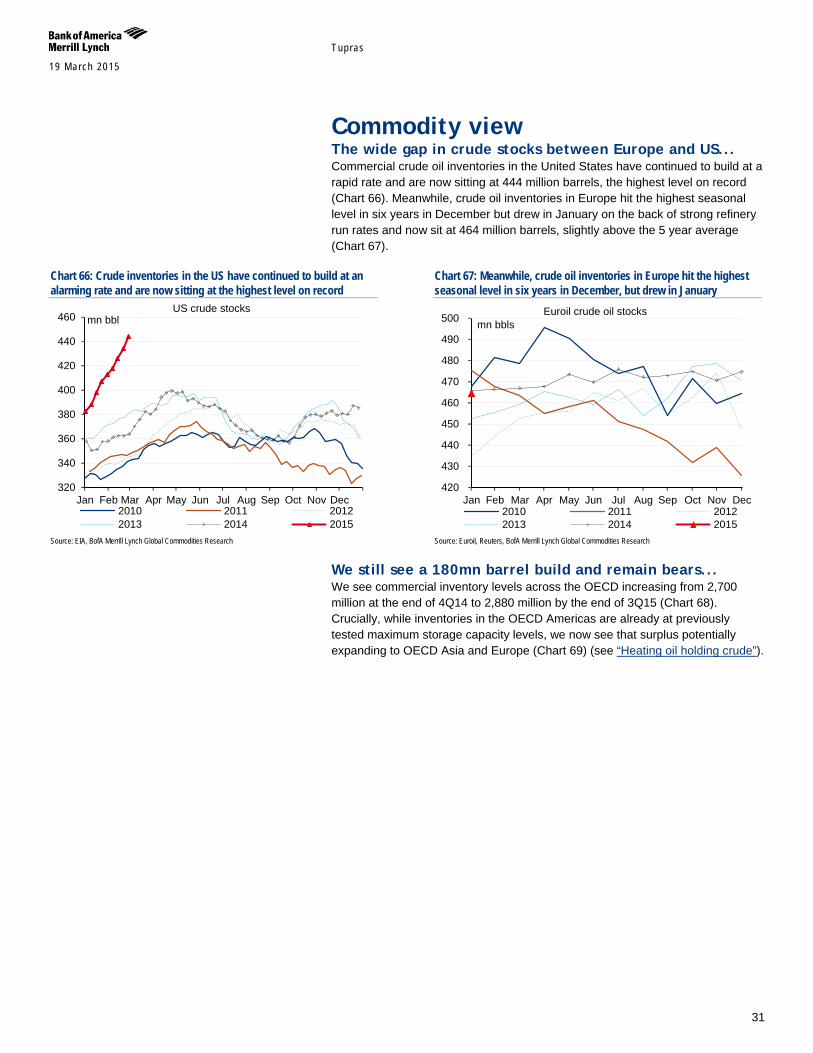
Commodity view The wide gap in crude stocks between Europe and US... Commercial crude oil inventories in the United States have continued to build at a rapid rate and are now sitting at 444 million barrels, the highest level on record (Chart 66). Meanwhile, crude oil inventories in Europe hit the highest seasonal level in six years in December but drew in January on the back of strong refinery run rates and now sit at 464 million barrels, slightly above the 5 year average (Chart 67).
Chart 66: Crude inventories in the US have continued to build at an alarming rate and are now sitting at the highest level on record
Source: EIA, BofA Merrill Lynch Global Commodities Research
Chart 67: Meanwhile, crude oil inventories in Europe hit the highest seasonal level in six years in December, but drew in January
Source: Euroil, Reuters, BofA Merrill Lynch Global Commodities Research
We still see a 180mn barrel build and remain bears... We see commercial inventory levels across the OECD increasing from 2,700 million at the end of 4Q14 to 2,880 million by the end of 3Q15 (Chart 68). Crucially, while inventories in the OECD Americas are already at previously tested maximum storage capacity levels, we now see that surplus potentially expanding to OECD Asia and Europe (Chart 69) (see “Heating oil holding crude”).
320
340
360
380
400
420
440
460
Jan Feb Mar Apr May Jun Jul Aug Sep Oct Nov Dec
mn bbl US crude stocks
2010 2011 20122013 2014 2015
420
430
440
450
460
470
480
490
500
Jan Feb Mar Apr May Jun Jul Aug Sep Oct Nov Dec2010 2011 20122013 2014 2015
Euroil crude oil stocks mn bbls

Tupras 19 March 2015
32
Chart 68: We see commercial stock levels in the OECD increasing from 2.70 bn at the end of 4Q14 to 2.88 bn by the end of 3Q15
Source: IEA, BofA Merrill Lynch Global Commodities Research
Chart 69: We now see the crude oil surplus potentially expanding to OECD Asia and Europe
Source: IEA, BofA Merrill Lynch Global Commodities Research
...but we mark our targets up given current price levels Since we still expect global oil supply to run above demand for at least six more months, we believe that downward pressure on petroleum prices will likely continue. Yet, the Brent market has been somewhat tighter than we projected on the back of unexpected disruptions. Meanwhile WTI weakness has become extremely pronounced even against domestic grades like Light Louisiana Sweet (Chart 70) that are only a pipeline move away. On the back of these reasons, we shift our WTI end of 1Q and 2Q target to $45 and $41, respectively, and move our Brent end of 1Q and 2Q target to $55 and $48 (Chart 71). So we remain bearish, but in a different shade of gray.
Chart 70: WTI weakness has become extremely pronounced even against domestic grades like Light Louisiana Sweet
Source: Bloomberg, BofA Merrill Lynch Global Commodities Research
Chart 71: We shift our WTI end of 1Q and 2Q target to $45 and $41 respectively, and our Brent end of 1Q and 2Q target to $55 and $48
Source: Bloomberg, BofA Merrill Lynch Global Commodities Research
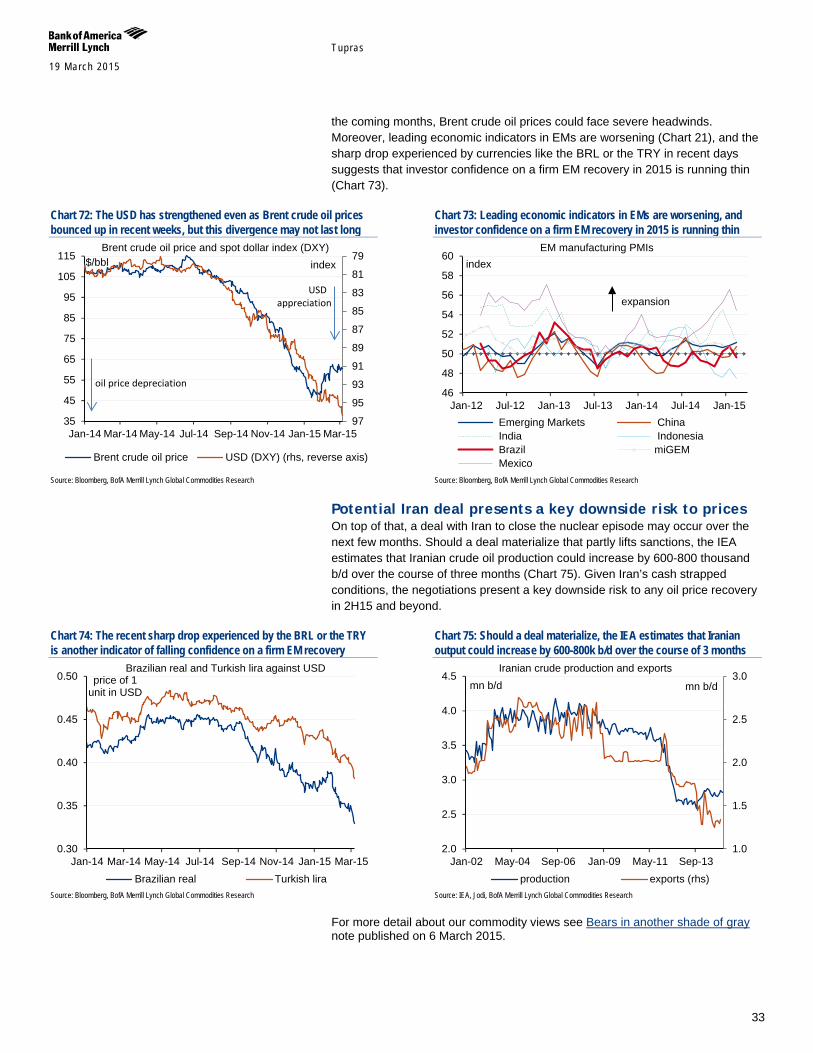
The strong USD, high stocks, and weak EMs cap oil prices Very high inventory levels are perhaps the main reason to remain cautious on the global crude oil price outlook over the next few months. While the microeconomics of the oil industry are poor, the global macro framework is not helping. To begin with, the USD has continued to strengthen even as Brent crude oil prices bounced up in recent weeks (Chart 72). Should the USD rally further in
2,500
2,600
2,700
2,800
2,900
Jan Feb Mar Apr May Jun Jul Aug Sep Oct Nov Dec
mn bbl
OECD total oil stocks (crude, ngl, products, feedstock)
2009 2010 2011 20122013 2014 2015
440450460470480490500510520530540
Jan Feb Mar Apr May Jun Jul Aug Sep Oct Nov Dec
mn bbl OECD Europe & Asia crude oil stocks
2009 2010 20112012 2013 2014
(7)
(6)
(5)
(4)
(3)
(2)
(1)
-
Oct-14 Feb-15 Jun-15 Oct-15 Feb-16 Jun-16
$/bbl
WTI-LLS
WTI-LLS (03-Mar-15) WTI-LLS (31-Dec-14)WTI-LLS (28-Nov-14) WTI-LLS (29-Oct-14)WTI-LLS (29-Sep-14)
30
40
50
60
70
80
90
100
110
120
Sep-12 Mar-13 Sep-13 Mar-14 Sep-14 Mar-15 Sep-15
$/bbl
Brent & WTI crude oil: forecast versus forward
WTI Brent
forward
BofAML EoQ fcast
Tupras 19 March 2015
33
the coming months, Brent crude oil prices could face severe headwinds. Moreover, leading economic indicators in EMs are worsening (Chart 21), and the sharp drop experienced by currencies like the BRL or the TRY in recent days suggests that investor confidence on a firm EM recovery in 2015 is running thin (Chart 73).
Chart 72: The USD has strengthened even as Brent crude oil prices bounced up in recent weeks, but this divergence may not last long
Source: Bloomberg, BofA Merrill Lynch Global Commodities Research
Chart 73: Leading economic indicators in EMs are worsening, and investor confidence on a firm EM recovery in 2015 is running thin
Source: Bloomberg, BofA Merrill Lynch Global Commodities Research
Potential Iran deal presents a key downside risk to prices On top of that, a deal with Iran to close the nuclear episode may occur over the next few months. Should a deal materialize that partly lifts sanctions, the IEA estimates that Iranian crude oil production could increase by 600-800 thousand b/d over the course of three months (Chart 75). Given Iran’s cash strapped conditions, the negotiations present a key downside risk to any oil price recovery in 2H15 and beyond.
Chart 74: The recent sharp drop experienced by the BRL or the TRY is another indicator of falling confidence on a firm EM recovery
Source: Bloomberg, BofA Merrill Lynch Global Commodities Research
Chart 75: Should a deal materialize, the IEA estimates that Iranian output could increase by 600-800k b/d over the course of 3 months
Source: IEA, Jodi, BofA Merrill Lynch Global Commodities Research
For more detail about our commodity views see Bears in another shade of gray note published on 6 March 2015.
79
81
83
85
87
89
91
93
95
9735
45
55
65
75
85
95
105
115
Jan-14 Mar-14 May-14 Jul-14 Sep-14 Nov-14 Jan-15 Mar-15
index $/bbl Brent crude oil price and spot dollar index (DXY)
Brent crude oil price USD (DXY) (rhs, reverse axis)
USD appreciation
oil price depreciation 46
48
50
52
54
56
58
60
Jan-12 Jul-12 Jan-13 Jul-13 Jan-14 Jul-14 Jan-15
index EM manufacturing PMIs
Emerging Markets China India Indonesia Brazil miGEM Mexico
expansion
0.30
0.35
0.40
0.45
0.50
Jan-14 Mar-14 May-14 Jul-14 Sep-14 Nov-14 Jan-15 Mar-15
price of 1 unit in USD
Brazilian real and Turkish lira against USD
Brazilian real Turkish lira
1.0
1.5
2.0
2.5
3.0
2.0
2.5
3.0
3.5
4.0
4.5
Jan-02 May-04 Sep-06 Jan-09 May-11 Sep-13
mn b/d Iranian crude production and exports
production exports (rhs)
mn b/d

Tupras 19 March 2015
34
Refining outlook in Europe Lower crude price boosts margins for some, at least for now Global crude oil prices have been in freefall in recent months, and we still see limited support for the market in the near term. The bulging surplus in crude oil is giving a mild boost to refiners via plunging feedstock costs.
In Europe, crude processing has seen a strong recovery since June when it averaged below 9.5 million b/d, the lowest refinery run rate since 1985, and utilisation rates are now above seasonal averages.
Retaining our US$5.5-6/bbl gross margin view The above may create the risk of refineries postponing closures, further aggravating a surplus in the product markets in 2015. Despite the recent strength in margins (US$7-8/bbl in 3-4Q14 and 1Q15), our long-term forecast for our benchmark margins in Europe remains about within US$5.5-6/bbl range.
Chart 76: European refining margins (US$/bbl)
Source: BofA Merrill Lynch Global Research estimates
We prefer to remain conservative on the European refining margin outlook in long-term as:
Diesel may suffer from too much supply. The impact of the new distillate-oriented refinery capacity, adding 700k b/d of distillates to the market, may be felt in 1H15. Tax changes in Russia are a strong incentive to export premium products, especially diesel, that however may be mitigated by some refineries closures. Net, distillate inventories should continue to build, likely putting pressure on cracks and keeping the gasoil forward curve in contango.
2.0
3.0
4.0
5.0
6.0
7.0
8.0
1Q13
A
2Q13
A
3Q13
A
4Q13
A
1Q14
A
2Q14
A
3Q14
A
4Q14
A
1Q15
E
2Q15
E
3Q15
E
4Q15
E
North West Europe (cracking) Mediterranean (complex)Chart 77: For the first time since 2009, refinery capacity is likely to outgrow global oil demand
Source: BP, IEA, BofA Merrill Lynch Global Commodities Research
-1
0
1
2
3
96 98 00 02 04 06 08 10 12 14 16
mn b/d Global oil demand & CDU
oil demand growth CDU capacity growth
BofAML fcast
Tupras 19 March 2015
35
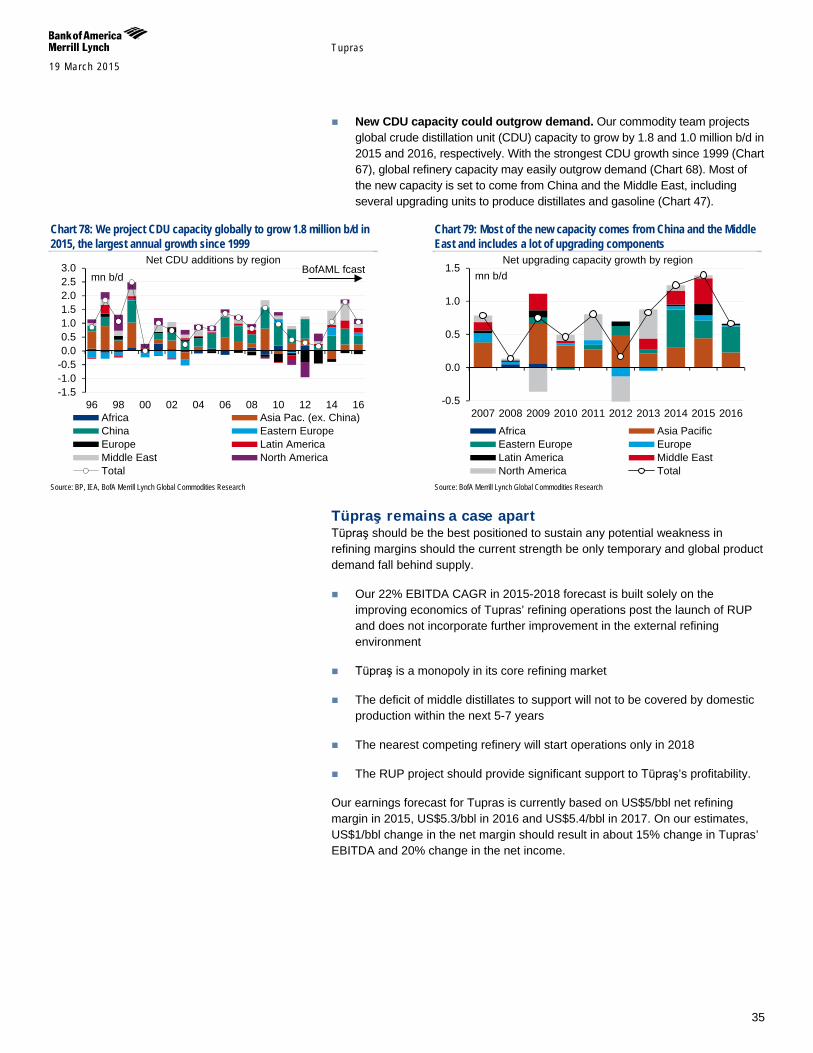
New CDU capacity could outgrow demand. Our commodity team projects global crude distillation unit (CDU) capacity to grow by 1.8 and 1.0 million b/d in 2015 and 2016, respectively. With the strongest CDU growth since 1999 (Chart 67), global refinery capacity may easily outgrow demand (Chart 68). Most of the new capacity is set to come from China and the Middle East, including several upgrading units to produce distillates and gasoline (Chart 47).
Chart 78: We project CDU capacity globally to grow 1.8 million b/d in 2015, the largest annual growth since 1999
Source: BP, IEA, BofA Merrill Lynch Global Commodities Research
Chart 79: Most of the new capacity comes from China and the Middle East and includes a lot of upgrading components
Source: BofA Merrill Lynch Global Commodities Research
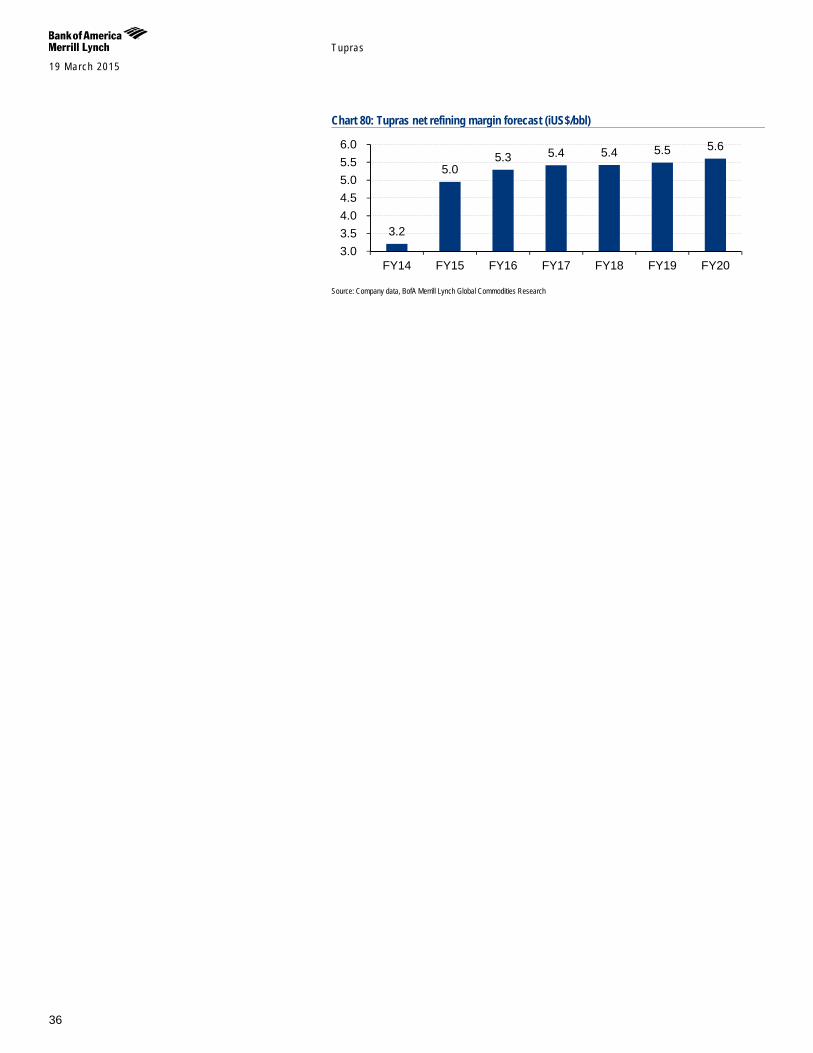
Tüpraş remains a case apart Tüpraş should be the best positioned to sustain any potential weakness in refining margins should the current strength be only temporary and global product demand fall behind supply.
Our 22% EBITDA CAGR in 2015-2018 forecast is built solely on the improving economics of Tupras’ refining operations post the launch of RUP and does not incorporate further improvement in the external refining environment
Tüpraş is a monopoly in its core refining market
The deficit of middle distillates to support will not to be covered by domestic production within the next 5-7 years
The nearest competing refinery will start operations only in 2018
The RUP project should provide significant support to Tüpraş’s profitability.
Our earnings forecast for Tupras is currently based on US$5/bbl net refining margin in 2015, US$5.3/bbl in 2016 and US$5.4/bbl in 2017. On our estimates, US$1/bbl change in the net margin should result in about 15% change in Tupras’ EBITDA and 20% change in the net income.
-1.5-1.0-0.50.00.51.01.52.02.53.0
96 98 00 02 04 06 08 10 12 14 16
mn b/d Net CDU additions by region
Africa Asia Pac. (ex. China)China Eastern EuropeEurope Latin AmericaMiddle East North AmericaTotal
BofAML fcast
-0.5
0.0
0.5
1.0
1.5
2007 2008 2009 2010 2011 2012 2013 2014 2015 2016
mn b/d Net upgrading capacity growth by region
Africa Asia PacificEastern Europe EuropeLatin America Middle EastNorth America Total
Tupras 19 March 2015
36
Chart 80: Tupras net refining margin forecast (iUS$/bbl)
Source: Company data, BofA Merrill Lynch Global Commodities Research
3.2
5.0 5.3 5.4 5.4 5.5 5.6
3.03.54.04.55.05.56.0
FY14 FY15 FY16 FY17 FY18 FY19 FY20

Tupras 19 March 2015
37
Risks to the investment case Our investment thesis may be prone to the following risks:
Changes in the refining outlook: Tüpraş is a pure play on refining margins and may be negatively affected should global supply of oil products outgrow demand. However, it is better positioned to withstand any macro shocks than its refining peers in EEMEA due to: (1) its dominant position in the Turkey market; and (2) flexible access to crude oil and ability to diversify its supply sources. In the meantime, our model is built based on our rather conservative long-term US$5.75/bbl in-house benchmark gross Med margin.
Risks to dividends: Tupras’ expected resumption and increase in dividends may come under question, if 1) Koc Holding acquires other assets in the oil & gas (i.e. upstream) via Tupras, 2) new upgrade projects in other refineries are launched (i.e. Kirikkale, Izmir).
Regulatory risk: 11% devaluation of TRY vs. USD year-to-date poses the risk of the regulators trying to put caps on the oil product prices in Turkey to curb down the inflation. In our view, such a risk is more relevant for the retail business rather than wholesale, as wholesale oil product prices in Turkey are linked to the CIF Mediterranean price quotes.
Currency Risk: Tüpraş does business with high monetary value in foreign currency, especially in case of procurements as needed by its field of activity. Foreign currency positions in connection with these transactions are followed up by Finance Department on a regular basis. The required amount of foreign currency assets is available, considering the fact that existing stocks are priced in foreign currency. Thus, a natural hedge is maintained to keep the open foreign exchange position in acceptable level.
Liquidity Risk: A significant portion of the receivables arising out of the sales to private sector customers is secured in order to get rid of the collection risk. Material part of the sales and receivables is attributable to public enterprises and free from the collection risk. Furthermore, average figures of receivables and stocks are kept shorter as far as practicable, due to Tüpraş’s policies and economic conjuncture. Long-term cash valuation is not done because of lower number of days. So, liquidity risk should be limited.
Commercial Risks: Tüpraş’s prices are based on the CIF Mediterranean (Genova/ Lavera), price quotes and foreign exchange rates pursuant to the Oil Market Law and Energy Market Regulation Authority’s applicable criteria. In order to mitigate the effects of quick changes in crude oil prices, the price averages of longer periods are used in the pricing of crude oil, rather than periods of a few days. Besides, the crude oil pricing days are determined closer to the potential selling days of products. Thus, time-related risks caused from the difference of purchasing and selling prices are eliminated as much as possible. Additionally, the crude oil and product stocks are kept in optimum level in order to eliminate the risks caused from price changes.
Supply/Transportation: Continuity of the production is maintained by using domestically supplied and predominantly imported raw materials. Purchase operations of raw materials have been optimized; in order to diversify supply sources, distribute risk in supply chain, provide advantage in price and freight costs; and to increase operational capability of the company.

Tupras 19 March 2015
38
Company background Brief history 10 July 1990 was a turning point in Tüpraş’s history, which had served for many years as a state economic enterprise, when it was handed over to the privatisation administration. The IPO was carried out in 1991. Following the sale of some of its shares to the private sector in 1991 and 2000, the long-awaited government privatisation of a majority stake in the company took place in 2005 when a consortium comprising Koc Holding (98%) and Shell Overseas Investments B.V. (2%) acquired a 51% controlling interest in Tüpraş for US$4.14bn.
The remaining 49% of the company's shares are now held privately and listed on the London and Istanbul stock exchanges. Almost entire trading share trading volumes are on Istanbul stock exchange.
Key refining assets Turkiye Petrol Rafinerileri A.S. (Tüpraş), a Turkish industrial company with core activities around oil refining and marketing, is Turkey’s only oil refiner. The refining operations are conducted at four sites around the country with a total capacity of 28.1mn tons per annum and a complexity of 7.3, which is higher than the Mediterranean refinery complexity (5.95). We expect Tupras’ NCI to reach 9.9 post the launch of full operation of RUP.
Major refineries and their product storage infrastructure are located near the biggest demand centres of the country; which implies low transport costs for these areas.
The company also has a 40% stake in Opet, the second-largest petroleum retailer in Turkey with more than 1,300 fuel stations. In addition, a majority stake (79.98%) in shipping company Ditaş creates synergies and adds value to the operations.
We describe Tüpraş’s four refineries below. Se the refining map in the end of this note for more detail:
The Izmit refinery is located at the centre of a consumption hub that accounts for around 33% of Turkish petroleum product consumption. The refinery is capable of producing at Euro-V standards in compliance with EU norms. Its Nelson Complexity Index is 7.78 but it will raise its NCI to 14.5 with the completion of the ongoing RUP, a US$ 3bn initiative.
The Izmir refinery started production in 1972. It has a 7.66 Nelson Complexity. The refinery’s capacity utilisation rate was 77.1% in 2013, including the processing of imported semi-finished products. Its production of main marketable petroleum products – consisting of LPG, naphtha, gasoline, jet fuel, diesel, base oil, heating oil, fuel oil, bitumen, wax, extracts and other products – reached 8.1 million tons per annum.
The Kirikkale refinery was established in 1986 to meet the petroleum demands of the Ankara, Central Anatolia, Eastern Mediterranean and Eastern Black Sea regions. With a Nelson Complexity of 6.32, Kırıkkale has Turkey’s largest road tanker filling capacity. The refinery’s capacity utilisation rate was 65.6% for crude oil or 67.4% including imported products used in processing. Its main products are LPG, gasoline, jet fuel, kerosene, diesel, fuel oil and bitumen. Approximately 3.19 million tons of petroleum products have been produced.
Table 10: Refining asset portfolio of Tüpraş Refinery Capacity Nelson
Complexity Year of
establishment Name mmt/year Izmit 11 7.8 1961 Izmir 11 7.7 1972 Kirikkale 5 6.3 1986 Batman 1.1 1.8 1955 Source: Company data, BofA Merrill Lynch research estimates

Tupras 19 March 2015
39
The Batman refinery was commissioned in 1955 and was the first refinery founded in Turkey. Batman’s crude oil processing capacity has reached 1.1 million tons a year. The refinery has the advantage of being located near domestic sources of crude oil; however, since it does not have upgrading units, its configuration is simple and its Nelson Complexity Index is 1.83.
Integration into retail and logistics Tüpraş is integrated into the downstream and logistics segments of the value chain via Opet (fuel distribution, 40% owned) and Ditaş (maritime oil transportation, 80% owned). It currently has no plans to move into upstream projects, including in Iraq, where it sources a significant share of its feedstock. Any such strategic decision would have to be made by the Board and the Koç family in particular.
Opet – second-largest fuel distributor Opet has the second-highest capacity in terms of terminal (major terminals in Marmara, Agean, Black Sea and Mediterranean) and high storage capacity (1.2mmcm). Thanks to Opet, Tüpraş has reached coverage of the entire country, including the market east of the Black Sea and Mediterranean regions, far from Tüpraş’s own refineries.
Opet has 19% and 13% market share in white and black products, respectively. It operates 1,361 stations under the Opet and Sunpet brands. In addition, Opet supplies jet fuel to domestic and international airlines through a JV with Turkish Airlines, THY-Opet, and produces lubricating oils through another JV with Fuchs (Germany).
Tüpraş holds a 40% stake and accounts for Opet using the equity method.
Ditaş – marine transportation Ditaş transports crude oil for Tüpraş, and transports petroleum products for both Tüpraş and other suppliers. It uses its own tankers and charters tankers. Ditaş transported 6.4 million tons of crude oil and 3.1 million tons of petroleum products in 2013. Revenues amounted to US$103mn, or just 0.4% of Tüpraş consolidated revenues.
Shareholder structure Tüpraş is a public company with shares listed on the Istanbul Stock Exchange and London Stock Exchange. The 51% stake is controlled by Koc Holding, Aygaz and Opet via joint entity Enerji Yatirimlari (see Exhibit 3). The remaining 49% is in the free float.
Tüpraş was established in 1983 by the Turkish government. In 2006, the company was privatised by Enerji Yatirimlari, which is 77% owned by Koç Holding. The remaining 23% is held by the Koç’s subsidiary Aygaz (20%) and Opet (3%).

Tupras 19 March 2015
40
Chart 81: Tüpraş shareholder structure
Source: Company data
Exhibit 2: Tüpraş shareholder scheme
Source: Company data
Koc Holding’s asset portfolio is diversified across several industries. The shareholder sees Tüpraş as part of the value asset group with a focus on high dividends. This should bode well for minorities, once RUP is fully launched and FCF rises.
Chart 82: KOC’s total asset & weightage of each sector
Source: : Company data
State supervision is carried out by the Privatisation Administration through the Group C (preferential) share. Class C shares do not hold any other privileges concerning voting rights, apart from veto rights at general meetings on actions that might hinder the supply of petroleum to the Turkish armed forces, such as closure or sale of one of the refineries, a reduction corresponding to more than 10% of capacity, or spin-off or merger and/or liquidation of the company.
Management team Tüpraş board of directors consists of 12 members, including four independent directors. The Turkish government has the right to nominate one of the independent members of the board. As discussed above, the government’s veto
Koc Holding ,
39%
Aygaz, 10% Opet, 2%
Free float, 49%
14%
7%
5%
66%
8%
Energy Automotive Customer Durables Finance Other

Tupras 19 March 2015
41
right can be used with regards to (1) Tüpraş actions concerning the needs of the Turkish armed forces, (2) articles of association and (3) the rights of the government’s shareholding.
Omer M. Koç has been the Chairman of the Board since 2008 after joining Tüpraş in 2006. He was previously on Koç Holding’s Board of Directors.
In January 2006, Yavuz Erkut became Tüpraş’s CEO after serving more than six years as Opet’s CEO. He has spent more than 28 years with the company.
As shown in the chart below, Tüpraş’s management executive compensation is performance-based and linked to a number of parameters including share price performance and economic profit. A similar incentive scheme is place for the management teams of other companies owned by Koc Holding.
Exhibit 3: Maximising Shareholder Value
Source: Company data

19 March 2015
Tupras
42
Table 11: Refiners valuation sheet
Mkt Cap Gearing % P/E EV/EBITDA FCF yield Div yield Performance
Performance v/s MSCI Global
Energy Index Nelson
Complexity
Light product
Yield 17-Mar-15 ($m) 2015e 2015e 2016e 2015e 2016e 2015e 2016e 2015e 2016e YTD 12m YTD 12m Europe Hellenic Pet 1,477 NA 14.5 9.0 5.5 4.3 42.3% 31.7% 5.1% 7.3% -2.89 -3.62 4.70 -42.98 9.60 75% Motor Oil 869 NA 6.1 5.7 4.8 4.4 25.7% 19.5% 6.9% 9.2% 7.69 -3.27 -0.62 -26.98 NA 87% Neste 6,521 NA 15.5 14.1 8.1 7.5 5.8% 5.9% 2.9% 3.0% 22.63 9.57 4.45 39.14 NA 80% PKN 6,404 19% 10.0 12.4 6.4 7.2 8.2% -1.7% 2.9% 2.9% 12.43 31.58 8.33 23.71 9.20 32% Tupras 5,435 20% 9.23 7.40 6.60 5.38 8% 12% 6.5% 12.2% -3.62 37.48 -8.57 39.84 9.90 84% Median (ex. Tupras) 12.2 10.7 6.0 5.8 17.0% 12.7% 5.1% 7.3% 10.06 3.15 4.57 -1.63 9.40 78% US Calumet 1,843 69% 32.7 29.1 9.8 9.5 7.8% 8.4% 10.4% 10.4% 18.03 -2.07 17.61 11.26 NA 53% Delek 1,895 10% 14.1 11.3 5.8 5.2 2.1% 6.6% 3.1% 3.1% 18.1 9.0 17.7 23.8 9.2 87% HollyFrontier 8,145 4% 15.9 12.8 5.5 4.8 3.5% 4.8% 8.0% 8.0% 9.69 -9.96 9.30 2.29 12.10 88% Marathon Petrol 30,299 36% 15.9 12.7 6.6 5.9 3.6% 5.3% 1.9% 1.9% 16.96 20.03 16.55 36.37 11.10 83% Northern Tier 2,046 30% 7.0 7.2 6.4 6.6 14.6% 13.9% 12.9% 12.5% 0.27 -8.26 -0.08 4.22 NA 80% PBF Energy 3,011 27% 10.0 9.2 5.3 5.0 14.5% 15.6% 3.9% 3.9% 16.0 19.5 15.6 35.8 11.3 NA Phillips 66 45,171 19% 13.7 12.5 9.1 8.5 -1.0% 1.4% 2.8% 3.1% 7.87 2.72 7.49 16.71 11.70 84% Tesoro 11,712 34% 15.8 14.0 6.9 6.3 4.2% 5.4% 1.9% 1.9% 21.83 80.01 21.40 104.51 11.50 85% Valero 31,635 12% 10.1 9.5 5.1 4.9 8.9% 10.5% 2.6% 2.6% 22.67 22.44 22.23 39.11 12.40 85% Median 14.1 12.5 6.4 5.9 4.2% 6.6% 3.1% 3.1% 16.96 9.00 16.55 23.83 11.50 85% Asia BPCL 8,622 45% 15.6 9.8 8.9 6.3 27.9% 12.3% 2.6% 3.4% 13.39 113.90 14.65 143.19 6.30 32% Formosa Pet 21,114 11% 25.0 23.6 15.4 14.6 9.5% 8.2% 2.8% 3.0% 1.75 -8.15 1.60 0.23 NA NA HPCL 3,278 70% 17.9 8.6 6.7 5.0 55.3% 39.3% 2.0% 4.2% 9.25 148.35 10.47 182.36 NA 30% IOC 12,998 52% 30.0 7.7 13.4 5.2 18.9% 22.7% 1.2% 4.2% -1.01 40.05 0.09 59.24 9.60 78% Reliance Industries 45,360 21% 12.2 11.4 8.7 7.5 -14.3% -3.0% 0.9% 0.9% -1.67 8.40 -0.58 23.24 12.70 68% S-Oil 6,416 25% 12.8 13.2 9.0 10.0 25.7% 18.6% 2.0% 2.1% 29.75 -4.70 28.97 5.35 NA NA Thai Oil 3,259 50% 10.8 10.7 8.2 8.2 17.8% 15.0% 4.2% 4.2% 23.81 -3.70 24.66 9.49 9.70 83% Median 15.6 10.7 8.9 7.5 18.9% 15.0% 2.0% 3.4% 9.25 8.40 10.47 23.24 9.65 68% Source: Bloomberg, BofA Merrill Lynch research estimates

19 March 2015
Tupras
43
Exhibit 4: Refining map of Turkey
Source: Company data, BofA Merrill Lynch Global Research estimates

Tupras 19 March 2015
44
Price objective basis & risk Tupras (TUPRF) Our price objective of TRY71/share for Tupras is DCF- and multiple-based. Our DCF valuation is based on 10.7% WACC estimate and 0% terminal growth rate. Our comparable multiple valuation is based on the average of 8x 2016E EV/EBITDA and 10x 2016E P/E target multiples Our target multiples are close to Tüpraş's five-year historical average one-year forward multiples. Downside risks to our price objective are: (1) Mediterranean refining margins and the heavy-light crude oil spread, which are the key drivers of the company's earnings stream, (2) increases in the oil price would increase Tupras's underlying energy costs, ultimately putting a squeeze on realized margins, (3) the high concentration of cash flows from two key refining assets (Izmit & Izmir) means that unplanned refinery downtime can have a material effect on earnings, (4) any changes in the domestic regulatory environment that may force Tupras to invest significantly to comply with such changes, and (5) cost overruns and delays in the full operational launch of RUP. Upside risks are (1) significant movements in refining margins and further decline in oil prices and (2) higher-than-expected cost cuts. Analyst Certification I, Anton Fedotov, hereby certify that the views expressed in this research report accurately reflect my personal views about the subject securities and issuers. I also certify that no part of my compensation was, is, or will be, directly or indirectly, related to the specific recommendations or view expressed in this research report.
EEMEA - Energy & Utilities Coverage Cluster
Investment rating Company BofA Merrill Lynch ticker Bloomberg symbol Analyst
BUY E.ON Russia FXGCF EONR RM Denis Derushkin Energa XEENF ENG PW Denis Derushkin Gazprom Neft XGSOF SIBN RM Karen Kostanian, CFA Gazprom Neft XXGAZ GAZ LI Karen Kostanian, CFA Inter RAO XEDGF IRAO RX Denis Derushkin KazMunaiGas-GDR XZKEF KMG LI Anton Fedotov Lukoil XLKOD LKOD LI Karen Kostanian, CFA Lukoil LUKOF LKOH RM Karen Kostanian, CFA Novatek XAOOF NVTK LI Karen Kostanian, CFA Novatek NVFIF NVTK RM Karen Kostanian, CFA PKN Orlen PSKOF PKN PW Anton Fedotov SURGUTNEFTEGAS-PFD SGTPY SGTPY US Anton Fedotov SURGUTNEFTEGAS-PFD XVRXF SNGSP RM Anton Fedotov Tupras TUPRF TUPRS TI Anton Fedotov NEUTRAL Rosneft OJSCF ROSN LI Karen Kostanian, CFA Rosneft RNFTF ROSN RM Karen Kostanian, CFA Sasol Limited SASOF SOL SJ Karen Kostanian, CFA Sasol Limited SSL SSL US Karen Kostanian, CFA Sistema JSFCF SSA LI Anton Fedotov Sistema XJSCF AFKS RM Anton Fedotov Surgutneftegas JSUGF SNGS RM Anton Fedotov Surgutneftegas SGTZY SGGD LI Anton Fedotov Tatneft preferred shares XUYRF TATNP RM Anton Fedotov Tauron XUTRF TPE PW Denis Derushkin
Tupras 19 March 2015
45
EEMEA - Energy & Utilities Coverage Cluster
Investment rating Company BofA Merrill Lynch ticker Bloomberg symbol Analyst
UNDERPERFORM CAT Oil CAOJF O2C GR Anton Fedotov CEZ CZAVF CEZ CK Denis Derushkin Gazprom OGZPY OGZD LI Karen Kostanian, CFA Gazprom RGZPF GAZP RM Karen Kostanian, CFA MOL MMGYF MOL HB Anton Fedotov MOL MGYOY MOLD LI Anton Fedotov PGE PPOEF PGE PW Denis Derushkin RusHydro XGFHF HYDR RM Denis Derushkin RusHydro RSHYY HYDR LI Denis Derushkin Tatneft OAOFY ATAD LI Anton Fedotov Tatneft OAOTF TATN RM Anton Fedotov TMK TMKOY TMKS LI Denis Derushkin TMK XNTYF TRMK RM Denis Derushkin Transneft Pref TRNFF TRNFP RM Anton Fedotov RSTR Aksa Enerji XAKJF AKSEN TI Fırat Topal RVW Bashneft BNSFF BANE RM Anton Fedotov Bashneft preferred shares XNPBF BANEP RM Anton Fedotov
iQmethod SM Measures Definitions Business Performance Numerator Denominator Return On Capital Employed NOPAT = (EBIT + Interest Income) * (1 - Tax Rate) + Goodwill
Amortization Total Assets – Current Liabilities + ST Debt + Accumulated Goodwill Amortization
Return On Equity Net Income Shareholders’ Equity Operating Margin Operating Profit Sales Earnings Growth Expected 5-Year CAGR From Latest Actual N/A Free Cash Flow Cash Flow From Operations – Total Capex N/A Quality of Earnings Cash Realization Ratio Cash Flow From Operations Net Income Asset Replacement Ratio Capex Depreciation Tax Rate Tax Charge Pre-Tax Income Net Debt-To-Equity Ratio Net Debt = Total Debt, Less Cash & Equivalents Total Equity Interest Cover EBIT Interest Expense Valuation Toolkit Price / Earnings Ratio Current Share Price Diluted Earnings Per Share (Basis As Specified) Price / Book Value Current Share Price Shareholders’ Equity / Current Basic Shares Dividend Yield Annualised Declared Cash Dividend Current Share Price Free Cash Flow Yield Cash Flow From Operations – Total Capex Market Cap. = Current Share Price * Current Basic Shares Enterprise Value / Sales EV = Current Share Price * Current Shares + Minority Equity + Net Debt
+ Other LT Liabilities Sales
EV / EBITDA Enterprise Value Basic EBIT + Depreciation + Amortization
iQmethod SMis the set of BofA Merrill Lynch standard measures that serve to maintain global consistency under three broad headings: Business Performance, Quality of Earnings, and validations. The key features of iQmethod are: A consistently structured, detailed, and transparent methodology. Guidelines to maximize the effectiveness of the comparative valuation process, and to identify some common pitfalls. iQdatabase ® is our real-time global research database that is sourced directly from our equity analysts’ earnings models and includes forecasted as well as historical data for income statements, balance sheets, and cash flow statements for companies covered by BofA Merrill Lynch. iQprofile SM, iQmethod SM are service marks of Merrill Lynch & Co., Inc.iQdatabase ®is a registered service mark of Merrill Lynch & Co., Inc.

Tupras 19 March 2015
46
Important Disclosures TUPRF Price Chart
0
9
18
27
36
45
54
63
1-Jan-13 1-Jan-14 1-Jan-15
B: Buy, N: Neutral, U: Underperform, PO: Price Objective, NA: No longer valid, NR:No RatingTUPRF
1-Mar NYavuz BirdalPO:TRY48
14-May PO:TRY46
13-Dec PO:TRY50
7-Jan PO:TRY51
6-Mar PO:TRY53
14-May PO:TRY55
5-Aug PO:TRY48
8-Nov PO:TRY50
10-Jan PO:TRY47
5-Feb BPO:TRY48
22-Apr PO:TRY52
Review Restricted No Coverage
The Investment Opinion System is contained at the end of the report under the heading "Fundamental Equity Opinion Key". Dark grey shading indicates the security is restricted with the opinion suspended. Medium grey shading indicates the security is under review with the opinion withdrawn. Light grey shading indicates the security is not covered. Chart is current as of February 28, 2015 or such later date as indicated. Investment Rating Distribution: Energy Group (as of 31 Dec 2014) Coverage Universe Count Percent Inv. Banking Relationships* Count Percent Buy 132 52.80% Buy 111 84.09% Neutral 60 24.00% Neutral 45 75.00% Sell 58 23.20% Sell 46 79.31% Investment Rating Distribution: Global Group (as of 31 Dec 2014) Coverage Universe Count Percent Inv. Banking Relationships* Count Percent Buy 1724 51.69% Buy 1271 73.72% Neutral 791 23.72% Neutral 587 74.21% Sell 820 24.59% Sell 520 63.41% * Companies that were investment banking clients of BofA Merrill Lynch or one of its affiliates within the past 12 months. For purposes of this distribution, a stock rated Underperform is included as a Sell.
FUNDAMENTAL EQUITY OPINION KEY: Opinions include a Volatility Risk Rating, an Investment Rating and an Income Rating. VOLATILITY RISK RATINGS, indicators of potential price fluctuation, are: A - Low, B - Medium and C - High. INVESTMENT RATINGS reflect the analyst’s assessment of a stock’s: (i) absolute total return potential and (ii) attractiveness for investment relative to other stocks within its Coverage Cluster (defined below). There are three investment ratings: 1 - Buy stocks are expected to have a total return of at least 10% and are the most attractive stocks in the coverage cluster; 2 - Neutral stocks are expected to remain flat or increase in value and are less attractive than Buy rated stocks and 3 - Underperform stocks are the least attractive stocks in a coverage cluster. Analysts assign investment ratings considering, among other things, the 0-12 month total return expectation for a stock and the firm’s guidelines for ratings dispersions (shown in the table below). The current price objective for a stock should be referenced to better understand the total return expectation at any given time. The price objective reflects the analyst’s view of the potential price appreciation (depreciation). Investment rating Total return expectation (within 12-month period of date of initial rating) Ratings dispersion guidelines for coverage cluster*
Buy ≥ 10% ≤ 70% Neutral ≥ 0% ≤ 30%
Underperform N/A ≥ 20% * Ratings dispersions may vary from time to time where BofA Merrill Lynch Research believes it better reflects the investment prospects of stocks in a Coverage Cluster.
INCOME RATINGS, indicators of potential cash dividends, are: 7 - same/higher (dividend considered to be secure), 8 - same/lower (dividend not considered to be secure) and 9 - pays no cash dividend. Coverage Cluster is comprised of stocks covered by a single analyst or two or more analysts sharing a common industry, sector, region or other classification(s). A stock’s coverage cluster is included in the most recent BofA Merrill Lynch Comment referencing the stock.
Price charts for the securities referenced in this research report are available at http://pricecharts.ml.com, or call 1-800-MERRILL to have them mailed. The company is or was, within the last 12 months, an investment banking client of MLPF&S and/or one or more of its affiliates: Tupras. MLPF&S or an affiliate has received compensation from the company for non-investment banking services or products within the past 12 months: Tupras. The company is or was, within the last 12 months, a non-securities business client of MLPF&S and/or one or more of its affiliates: Tupras. In the US, retail sales and/or distribution of this report may be made only in states where these securities are exempt from registration or have been qualified for
sale: Tupras. MLPF&S or an affiliate expects to receive or intends to seek compensation for investment banking services from this company or an affiliate of the company
within the next three months: Tupras. BofA Merrill Lynch Research personnel (including the analyst(s) responsible for this report) receive compensation based upon, among other factors, the overall
profitability of Bank of America Corporation, including profits derived from investment banking revenues.
Tupras 19 March 2015
47
Other Important Disclosures
Officers of MLPF&S or one or more of its affiliates (other than research analysts) may have a financial interest in securities of the issuer(s) or in related investments.
From time to time research analysts conduct site visits of covered companies. BofA Merrill Lynch policies prohibit research analysts from accepting payment or reimbursement for travel expenses from the company for such visits.
BofA Merrill Lynch Global Research policies relating to conflicts of interest are described at http://www.ml.com/media/43347.pdf. "BofA Merrill Lynch" includes Merrill Lynch, Pierce, Fenner & Smith Incorporated ("MLPF&S") and its affiliates. Investors should contact their BofA
Merrill Lynch representative or Merrill Lynch Global Wealth Management financial advisor if they have questions concerning this report. "BofA Merrill Lynch" and "Merrill Lynch" are each global brands for BofA Merrill Lynch Global Research.
Information relating to Non-US affiliates of BofA Merrill Lynch and Distribution of Affiliate Research Reports: MLPF&S distributes, or may in the future distribute, research reports of the following non-US affiliates in the US (short name: legal name): Merrill Lynch (France):
Merrill Lynch Capital Markets (France) SAS; Merrill Lynch (Frankfurt): Merrill Lynch International Bank Ltd., Frankfurt Branch; Merrill Lynch (South Africa): Merrill Lynch South Africa (Pty) Ltd.; Merrill Lynch (Milan): Merrill Lynch International Bank Limited; MLI (UK): Merrill Lynch International; Merrill Lynch (Australia): Merrill Lynch Equities (Australia) Limited; Merrill Lynch (Hong Kong): Merrill Lynch (Asia Pacific) Limited; Merrill Lynch (Singapore): Merrill Lynch (Singapore) Pte Ltd.; Merrill Lynch (Canada): Merrill Lynch Canada Inc; Merrill Lynch (Mexico): Merrill Lynch Mexico, SA de CV, Casa de Bolsa; Merrill Lynch (Argentina): Merrill Lynch Argentina SA; Merrill Lynch (Japan): Merrill Lynch Japan Securities Co., Ltd.; Merrill Lynch (Seoul): Merrill Lynch International Incorporated (Seoul Branch); Merrill Lynch (Taiwan): Merrill Lynch Securities (Taiwan) Ltd.; DSP Merrill Lynch (India): DSP Merrill Lynch Limited; PT Merrill Lynch (Indonesia): PT Merrill Lynch Indonesia; Merrill Lynch (Israel): Merrill Lynch Israel Limited; Merrill Lynch (Russia): OOO Merrill Lynch Securities, Moscow; Merrill Lynch (Turkey I.B.): Merrill Lynch Yatirim Bank A.S.; Merrill Lynch (Turkey Broker): Merrill Lynch Menkul Değerler A.Ş.; Merrill Lynch (Dubai): Merrill Lynch International, Dubai Branch; MLPF&S (Zurich rep. office): MLPF&S Incorporated Zurich representative office; Merrill Lynch (Spain): Merrill Lynch Capital Markets Espana, S.A.S.V.; Merrill Lynch (Brazil): Bank of America Merrill Lynch Banco Multiplo S.A.; Merrill Lynch KSA Company, Merrill Lynch Kingdom of Saudi Arabia Company.
This research report has been approved for publication and is distributed in the United Kingdom to professional clients and eligible counterparties (as each is defined in the rules of the Financial Conduct Authority and the Prudential Regulation Authority) by Merrill Lynch International and Bank of America Merrill Lynch International Limited, which are authorized by the Prudential Regulation Authority and regulated by the Financial Conduct Authority and the Prudential Regulation Authority, and is distributed in the United Kingdom to retail clients (as defined in the rules of the Financial Conduct Authority and the Prudential Regulation Authority) by Merrill Lynch International Bank Limited, London Branch, which is authorised by the Central Bank of Ireland and subject to limited regulation by the Financial Conduct Authority and Prudential Regulation Authority - details about the extent of our regulation by the Financial Conduct Authority and Prudential Regulation Authority are available from us on request; has been considered and distributed in Japan by Merrill Lynch Japan Securities Co., Ltd., a registered securities dealer under the Financial Instruments and Exchange Act in Japan; is distributed in Hong Kong by Merrill Lynch (Asia Pacific) Limited, which is regulated by the Hong Kong SFC and the Hong Kong Monetary Authority is issued and distributed in Taiwan by Merrill Lynch Securities (Taiwan) Ltd.; is issued and distributed in India by DSP Merrill Lynch Limited; and is issued and distributed in Singapore to institutional investors and/or accredited investors (each as defined under the Financial Advisers Regulations) by Merrill Lynch International Bank Limited (Merchant Bank) and Merrill Lynch (Singapore) Pte Ltd. (Company Registration No.’s F 06872E and 198602883D respectively). Merrill Lynch International Bank Limited (Merchant Bank) and Merrill Lynch (Singapore) Pte Ltd. are regulated by the Monetary Authority of Singapore. Bank of America N.A., Australian Branch (ARBN 064 874 531), AFS License 412901 (BANA Australia) and Merrill Lynch Equities (Australia) Limited (ABN 65 006 276 795), AFS License 235132 (MLEA) distributes this report in Australia only to 'Wholesale' clients as defined by s.761G of the Corporations Act 2001. With the exception of BANA Australia, neither MLEA nor any of its affiliates involved in preparing this research report is an Authorised Deposit-Taking Institution under the Banking Act 1959 nor regulated by the Australian Prudential Regulation Authority. No approval is required for publication or distribution of this report in Brazil and its local distribution is made by Bank of America Merrill Lynch Banco Múltiplo S.A. in accordance with applicable regulations. Merrill Lynch (Dubai) is authorized and regulated by the Dubai Financial Services Authority (DFSA). Research reports prepared and issued by Merrill Lynch (Dubai) are prepared and issued in accordance with the requirements of the DFSA conduct of business rules.
Merrill Lynch (Frankfurt) distributes this report in Germany. Merrill Lynch (Frankfurt) is regulated by BaFin. This research report has been prepared and issued by MLPF&S and/or one or more of its non-US affiliates. MLPF&S is the distributor of this research report in
the US and accepts full responsibility for research reports of its non-US affiliates distributed to MLPF&S clients in the US. Any US person receiving this research report and wishing to effect any transaction in any security discussed in the report should do so through MLPF&S and not such foreign affiliates. Hong Kong recipients of this research report should contact Merrill Lynch (Asia Pacific) Limited in respect of any matters relating to dealing in securities or provision of specific advice on securities. Singapore recipients of this research report should contact Merrill Lynch International Bank Limited (Merchant Bank) and/or Merrill Lynch (Singapore) Pte Ltd in respect of any matters arising from, or in connection with, this research report.
General Investment Related Disclosures: Taiwan Readers: Neither the information nor any opinion expressed herein constitutes an offer or a solicitation of an offer to transact in any securities or other
financial instrument. No part of this report may be used or reproduced or quoted in any manner whatsoever in Taiwan by the press or any other person without the express written consent of BofA Merrill Lynch.
This research report provides general information only. Neither the information nor any opinion expressed constitutes an offer or an invitation to make an offer, to buy or sell any securities or other financial instrument or any derivative related to such securities or instruments (e.g., options, futures, warrants, and contracts for differences). This report is not intended to provide personal investment advice and it does not take into account the specific investment objectives, financial situation and the particular needs of any specific person. Investors should seek financial advice regarding the appropriateness of investing in financial instruments and implementing investment strategies discussed or recommended in this report and should understand that statements regarding future prospects may not be realized. Any decision to purchase or subscribe for securities in any offering must be based solely on existing public information on such security or the information in the prospectus or other offering document issued in connection with such offering, and not on this report.
Securities and other financial instruments discussed in this report, or recommended, offered or sold by Merrill Lynch, are not insured by the Federal Deposit Insurance Corporation and are not deposits or other obligations of any insured depository institution (including, Bank of America, N.A.). Investments in general and, derivatives, in particular, involve numerous risks, including, among others, market risk, counterparty default risk and liquidity risk. No security, financial instrument or derivative is suitable for all investors. In some cases, securities and other financial instruments may be difficult to value or sell and reliable information about the value or risks related to the security or financial instrument may be difficult to obtain. Investors should note that income from such securities and other financial instruments, if any, may fluctuate and that price or value of such securities and instruments may rise or fall and, in some cases, investors may lose their entire principal investment. Past performance is not necessarily a guide to future performance. Levels and basis for taxation may change.
This report may contain a short-term trading idea or recommendation, which highlights a specific near-term catalyst or event impacting the company or the market that is anticipated to have a short-term price impact on the equity securities of the company. Short-term trading ideas and recommendations are different from and do not affect a stock's fundamental equity rating, which reflects both a longer term total return expectation and attractiveness for investment relative to other stocks within its Coverage Cluster. Short-term trading ideas and recommendations may be more or less positive than a stock's fundamental equity rating.

Tupras 19 March 2015
48
BofA Merrill Lynch is aware that the implementation of the ideas expressed in this report may depend upon an investor's ability to "short" securities or other financial instruments and that such action may be limited by regulations prohibiting or restricting "shortselling" in many jurisdictions. Investors are urged to seek advice regarding the applicability of such regulations prior to executing any short idea contained in this report.
Foreign currency rates of exchange may adversely affect the value, price or income of any security or financial instrument mentioned in this report. Investors in such securities and instruments, including ADRs, effectively assume currency risk.
UK Readers: The protections provided by the U.K. regulatory regime, including the Financial Services Scheme, do not apply in general to business coordinated by BofA Merrill Lynch entities located outside of the United Kingdom. BofA Merrill Lynch Global Research policies relating to conflicts of interest are described at http://www.ml.com/media/43347.pdf.
Officers of MLPF&S or one or more of its affiliates (other than research analysts) may have a financial interest in securities of the issuer(s) or in related investments.
MLPF&S or one of its affiliates is a regular issuer of traded financial instruments linked to securities that may have been recommended in this report. MLPF&S or one of its affiliates may, at any time, hold a trading position (long or short) in the securities and financial instruments discussed in this report.
BofA Merrill Lynch, through business units other than BofA Merrill Lynch Global Research, may have issued and may in the future issue trading ideas or recommendations that are inconsistent with, and reach different conclusions from, the information presented in this report. Such ideas or recommendations reflect the different time frames, assumptions, views and analytical methods of the persons who prepared them, and BofA Merrill Lynch is under no obligation to ensure that such other trading ideas or recommendations are brought to the attention of any recipient of this report.
In the event that the recipient received this report pursuant to a contract between the recipient and MLPF&S for the provision of research services for a separate fee, and in connection therewith MLPF&S may be deemed to be acting as an investment adviser, such status relates, if at all, solely to the person with whom MLPF&S has contracted directly and does not extend beyond the delivery of this report (unless otherwise agreed specifically in writing by MLPF&S). MLPF&S is and continues to act solely as a broker-dealer in connection with the execution of any transactions, including transactions in any securities mentioned in this report.
Copyright and General Information regarding Research Reports: Copyright 2015 Merrill Lynch, Pierce, Fenner & Smith Incorporated. All rights reserved. iQmethod, iQmethod 2.0, iQprofile, iQtoolkit, iQworks are service marks
of Bank of America Corporation. iQanalytics®, iQcustom®, iQdatabase® are registered service marks of Bank of America Corporation. This research report is prepared for the use of BofA Merrill Lynch clients and may not be redistributed, retransmitted or disclosed, in whole or in part, or in any form or manner, without the express written consent of BofA Merrill Lynch. BofA Merrill Lynch Global Research reports are distributed simultaneously to internal and client websites and other portals by BofA Merrill Lynch and are not publicly-available materials. Any unauthorized use or disclosure is prohibited. Receipt and review of this research report constitutes your agreement not to redistribute, retransmit, or disclose to others the contents, opinions, conclusion, or information contained in this report (including any investment recommendations, estimates or price targets) without first obtaining expressed permission from an authorized officer of BofA Merrill Lynch.
Materials prepared by BofA Merrill Lynch Global Research personnel are based on public information. Facts and views presented in this material have not been reviewed by, and may not reflect information known to, professionals in other business areas of BofA Merrill Lynch, including investment banking personnel. BofA Merrill Lynch has established information barriers between BofA Merrill Lynch Global Research and certain business groups. As a result, BofA Merrill Lynch does not disclose certain client relationships with, or compensation received from, such companies in research reports. To the extent this report discusses any legal proceeding or issues, it has not been prepared as nor is it intended to express any legal conclusion, opinion or advice. Investors should consult their own legal advisers as to issues of law relating to the subject matter of this report. BofA Merrill Lynch Global Research personnel’s knowledge of legal proceedings in which any BofA Merrill Lynch entity and/or its directors, officers and employees may be plaintiffs, defendants, co-defendants or co-plaintiffs with or involving companies mentioned in this report is based on public information. Facts and views presented in this material that relate to any such proceedings have not been reviewed by, discussed with, and may not reflect information known to, professionals in other business areas of BofA Merrill Lynch in connection with the legal proceedings or matters relevant to such proceedings.
This report has been prepared independently of any issuer of securities mentioned herein and not in connection with any proposed offering of securities or as agent of any issuer of any securities. None of MLPF&S, any of its affiliates or their research analysts has any authority whatsoever to make any representation or warranty on behalf of the issuer(s). BofA Merrill Lynch Global Research policy prohibits research personnel from disclosing a recommendation, investment rating, or investment thesis for review by an issuer prior to the publication of a research report containing such rating, recommendation or investment thesis.
Any information relating to the tax status of financial instruments discussed herein is not intended to provide tax advice or to be used by anyone to provide tax advice. Investors are urged to seek tax advice based on their particular circumstances from an independent tax professional.
The information herein (other than disclosure information relating to BofA Merrill Lynch and its affiliates) was obtained from various sources and we do not guarantee its accuracy. This report may contain links to third-party websites. BofA Merrill Lynch is not responsible for the content of any third-party website or any linked content contained in a third-party website. Content contained on such third-party websites is not part of this report and is not incorporated by reference into this report. The inclusion of a link in this report does not imply any endorsement by or any affiliation with BofA Merrill Lynch. Access to any third-party website is at your own risk, and you should always review the terms and privacy policies at third-party websites before submitting any personal information to them. BofA Merrill Lynch is not responsible for such terms and privacy policies and expressly disclaims any liability for them.
Subject to the quiet period applicable under laws of the various jurisdictions in which we distribute research reports and other legal and BofA Merrill Lynch policy-related restrictions on the publication of research reports, fundamental equity reports are produced on a regular basis as necessary to keep the investment recommendation current.
Certain outstanding reports may contain discussions and/or investment opinions relating to securities, financial instruments and/or issuers that are no longer current. Always refer to the most recent research report relating to a company or issuer prior to making an investment decision.
In some cases, a company or issuer may be classified as Restricted or may be Under Review or Extended Review. In each case, investors should consider any investment opinion relating to such company or issuer (or its security and/or financial instruments) to be suspended or withdrawn and should not rely on the analyses and investment opinion(s) pertaining to such issuer (or its securities and/or financial instruments) nor should the analyses or opinion(s) be considered a solicitation of any kind. Sales persons and financial advisors affiliated with MLPF&S or any of its affiliates may not solicit purchases of securities or financial instruments that are Restricted or Under Review and may only solicit securities under Extended Review in accordance with firm policies.
Neither BofA Merrill Lynch nor any officer or employee of BofA Merrill Lynch accepts any liability whatsoever for any direct, indirect or consequential damages or losses arising from any use of this report or its contents.