enterprise architecture blueprint – aligning people
TRANSCRIPT

Distr. GENERAL
WP.8 2 May 2012 ENGLISH ONLY
UNITED NATIONS ECONOMIC COMMISSION FOR EUROPE (UNECE) CONFERENCE OF EUROPEAN STATISTICIANS
EUROPEAN COMMISSION STATISTICAL OFFICE OF THE EUROPEAN UNION (EUROSTAT)
ORGANISATION FOR ECONOMIC COOPERATION AND DEVELOPMENT (OECD) STATISTICS DIRECTORATE
Meeting on the Management of Statistical Information Systems (MSIS 2012) (Washington, DC, 21-23 May 2012) Topic (i): Architecture
Enterprise Architecture Blueprint – Aligning People, Process, and Technology
Supporting Paper
Prepared by Rosemary McGrath, Collette O’Connor, Matjaz Jug, New Zealand
I. Introduction 1. Statistics New Zealand is currently undertaking an organisation-wide programme of change, Statistics 2020 Te Kāpehu Whetū (Stats 2020), to create the statistical system of the future. This programme has been developed to address challenges and opportunities in order to create a more dynamic, responsive, and sustainable organisation. The Enterprise Architecture (EA) blueprint will provide guidance and support to the organisation to ensure that Statistics New Zealand maximises its return on IT investment and enables our achievement of the Stats 2020 business objectives and benefits. 2. The purpose of this paper is to outline Statistics NZ’s end-to-end enterprise architecture. The document presents the context in which the EA blueprint has been created, EA blueprint and information on the current status of implementation.
II. Business context A. Partnering to achieve business outcomes
Statistics 2020 Te Käpehu Whetü and the EA approach
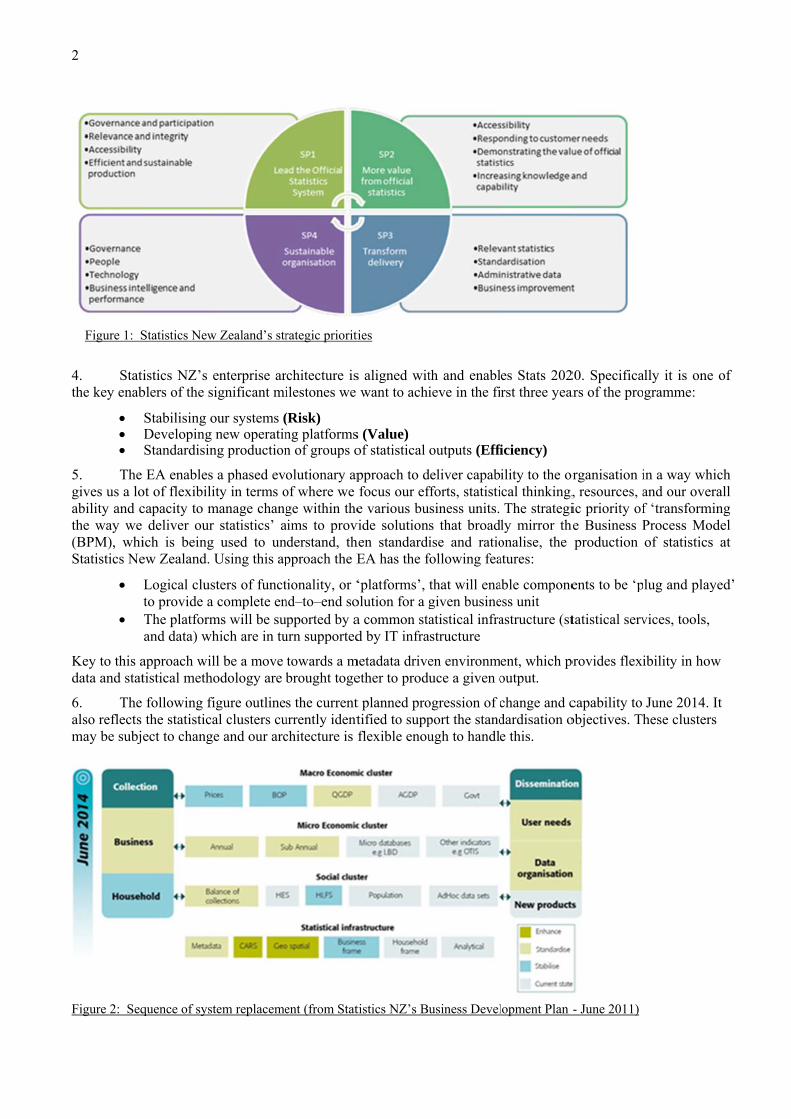
3. The Strategic Plan 2010-2020 sets out what the organisation is seeking to achieve over the next 10 years and how it plans to get there. The plan contains four key strategic priorities as shown in the following diagram:
2
Figure 1: S
4. Statithe key enab
5. The gives us a loability and cthe way we (BPM), whiStatistics Ne
Key to this adata and stat
6. The also reflects may be subje
Figure 2: Seq
Statistics New
istics NZ’s eblers of the si
Stabilising oDeveloping Standardisin
EA enables ot of flexibilicapacity to m
deliver our ich is being ew Zealand. U
Logical clusto provide a The platformand data) wh
approach wiltistical metho
following fithe statisticaect to change
quence of syst
w Zealand’s str
enterprise arignificant mi
our systems (new operatin
ng production
a phased evity in terms o
manage changstatistics’ aused to un
Using this ap
sters of functcomplete en
ms will be suhich are in tu
ll be a move odology are b
igure outlineal clusters cue and our arc
tem replaceme
rategic prioriti
rchitecture isilestones we
(Risk) ng platformsn of groups o
olutionary apof where we ge within the
aims to provnderstand, thpproach the E
tionality, or ‘nd–to–end soupported by aurn supported
towards a mbrought toge
s the currenturrently identchitecture is
ent (from Stat
ties
s aligned witwant to achi
s (Value) of statistical
pproach to dfocus our efe various bu
vide solutionhen standardiEA has the f
‘platforms’, olution for a ga common stad by IT infra
metadata driveether to produ
t planned protified to suppflexible enou
tistics NZ’s Bu
th and enablieve in the fi
outputs (Effi
deliver capabfforts, statistisiness units. s that broadise and ratio
following fea
that will enagiven busineatistical infra
astructure
en environmuce a given o
ogression of cport the standugh to handl
usiness Devel
es Stats 202rst three yea
iciency)
ility to the orical thinking,The strategi
ly mirror thonalise, the atures:
able componeess unit astructure (st
ent, which poutput.
change and cdardisation oe this.
lopment Plan
20. Specificaars of the pro
organisation i, resources, aic priority of
he Business Pproduction
ents to be ‘p
tatistical serv
provides flexi
capability to objectives. Th
- June 2011)
ally it is one gramme:
in a way whiand our overf ‘transformiProcess Modof statistics
lug and play
vices, tools,
ibility in how
June 2014. Ihese clusters
of
ich rall ing del at
yed’
w
It s

3
Risk
7. Statistics NZ has a proud IT history and a dedicated team of capable professionals delivering IT services to the organisation. In the last two decades many of our systems were developed using state-of-the-art technology of that time. Some of them were subsequently adopted and used by other international statistical institutions. 8. Through the years, Statistics NZ’s investment in statistical applications has resulted in an increasing stockpile of silo solutions. As with the associated legacy system issues (they are inextricably linked), silo solutions are an unwanted outcome of decentralised management. They have occurred because business units across the organisation have stood alone and not interacted effectively. Each business unit may have been operating well but they did not work together to create optimal efficiency for the organisation. 9. Many of Statistics NZ's systems and software are now out-of-date, are not supported by vendors, and only a few IT staff understand them. Resolving this system legacy problem is a major priority for the Board, as this issue could seriously affect Statistics NZ's reputation, plus its delivery and leadership roles in the Official Statistics System (OSS). 10. The platform roadmaps, developed as part of the EA, are aligned to provide an organisation-wide implementation plan of an enterprise architecture with shared systems. With the legacy migration plan, the roadmaps provide a staged transition plan from the old siloed architecture to the future state architecture of shared capability and common use platforms - an effective and standardised technology which allows continued delivery of statistical outputs. Transformation and responsiveness
11. “Statistics New Zealand is in the information business, which is a rapidly changing and fast moving one. Demand for information is increasing all the time. Technology changes by the day, increasing the ability of people to both use and produce information. We also face a tight fiscal environment and a challenging internal operating environment. The strategic direction outlined in this plan requires us to change. To remain relevant in the rapidly changing environment in which we operate we need to become more responsive and agile.” (Introduction to the Strategic Plan by Statistics NZ’s Chief Executive Geoff Bascand)
12. To be responsive Statistics NZ needs to move to the point where it can make assessments quickly and decisions effectively about change and the associated impacts and actions. Being responsive also includes the ability to recover quickly from a change without irreversible harm to reputation or delivery. The EA being implemented provides a framework whereby the impacts of changing business needs and emerging technologies can be quickly assessed. It provides input into informed decision making and highlights dependencies and the impacts of tactical decisions. The capability-based nature of the EA and the identification of the foundation elements, principles, and standards are important to increase levels of responsiveness. The ability for subject matter experts to manage and control their statistical processes is a key objective of this implementation.
13. The EA also provides a representation of the future state which can be communicated and discussed, and a means to improve the overall maturity of our business and technical capabilities. The future state can change rapidly based on decisions taken, shifts in technology, or changes in the operating environment. The EA provides improved information for effective long term planning. Standardisation
14. “Standardisation is about developing statistical infrastructures and approaches to clusters of “like” statistics, and functions (e.g. collection and analysis) within the statistical production process… Standardisation is not a one size fits all approach. Rather it focuses on natural production clusters or integrated functions which have similar characteristics, thereby facilitating the introduction of a common, standardised approach to their management” (The Strategic Priority 3 – Delivery Transformation Plan).

4
15. The EA and implementation approach undertaken to date (and proposed for the next three years) is a model with ever-increasing levels of standardised capability being introduced via the 'platform' approach. It is supported by a strategy of convergence, to ensure we continue to develop foundation capabilities
16. To surmise our role in partnering to achieve business outcomes, the EA blueprint is the document which provides the explicit linkage between Statistics NZ’s strategic priorities and benefits and the integral technology solutions that will enable these to be delivered. There is a clear line of sight between stated business goals, benefits, and the EA. B. Deliver a multi-platform approach
17. Within Statistics NZ we have identified statistical clusters, and within the Official Statistics System (OSS) we have identified statistical domains. For the EA implementation approach we have aligned with the statistical clusters but have allowed for flexibility:
to ‘re or de’ cluster in order to respond to the current maturity, pace of change, and risks/challenges of the statistical cluster
by providing services and capabilities that are not cluster/domain-specific designing the cluster based ‘platforms’ to not be closed off from one another
18. This approach, originally approved as part of Statistics NZ’s IT Strategy in 2009, allows us to consider the breadth and pace at which we need to transform as an organisation and the varying maturity and capabilities across the organisation. We will be able to respond quickly to change and have some great opportunities for innovative and potentially quantum gains in capability for Statistics NZ, the wider OSS, and the international statistical community.
C. Impact of future trends
19. Four main trends that will influence future versions of the EA blueprint are Government ICT, cloud service delivery model, international collaboration, and increasing access and mobility. These are significant trends and their impacts will have far reaching consequences throughout the organisation.
Government ICT
20. The New Zealand Government have set out a medium-term strategy, Directions and Priorities for Government ICT1, to indicate how central government will more collectively lead the use, development and purchasing of government ICT over the next three years. Under Cabinet Minute 10/35-5A chief executives of public service departments were directed to: use cross-government ICT products and services to meet relevant business needs where they are available, unless there is a compelling business reason not to, and work with the lead agencies providing such products and services to ensure that they meet business purposes. An initial assessment of the planned common capability initiatives has been undertaken, with respect to internet hosting options and disaster recovery/business continuity requirements. Further assessment will be undertaken through 2012/2013.
21. It is likely Statistics New Zealand’s adoption of, and collaboration within, the government ICT common capability framework will result in a mixed sourcing situation for the organisation. This will shift the current financial, software delivery, and project management practices used. While the EA blueprint does not inhibit the use, extension, or creation of common capability, a number of decisions around how our organisation interacts with the ICT framework are yet to be made - in terms of financial models, and project management and collaboration methodologies.
1 Directions and Priorities for Government ICT

5
* BASS is a New Zealand government programme that provides an annual administrative and support benchmarking service to larger government agencies to support value for money assessments, target-setting, and tracking of improvement over time.
Cloud service delivery model
22. For Statistics NZ the cloud computing paradigm represents a very significant shift. Currently we have a predominately ‘in-sourced’ IT environment. This is quite unique in the New Zealand Government, but is common across National Statistical Offices. Historical reasons for the in-source model have been legislation, privacy and security concerns and the data and ICT intensive operations involved in statistical processing, analysis, and dissemination. There are now significant drivers and pressure for the cloud computing model to be fully considered for some of Statistics NZ’s business activities. This includes government requirements under the Better Administrative and Support Services (BASS)* programme to reduce government spending. Another driver is the overall ability of our organisation to continue to be able to sustain the level of capital investment required to support strategic initiatives.
23. The EA blueprint incorporates providing and consuming cloud computing solutions, however no statistical capability is specifically identified at this time. International collaboration
24. There is a significant change underway across the national statistics community. The HLG-BAS has developed a strategic vision, which was endorsed by the 59th Plenary Session of the Conference of European Statisticians (14-16 June 2011, Geneva).
HLG-BAS has identified two strategic directions:
Statistical outputs: New and better products and services more tuned to the way the world is operating today, and created from a global perspective. This will help us stay relevant
Production methods: Different and better processes and methods tuned to delivering our products at minimal cost with greater flexibility and in cooperation between institutions. This will help us to improve efficiency and effectiveness
Within the two directions the following themes have emerged:
National Statistical Offices (NSOs) need to work together. The challenges are too big and too expensive for individual NSOs to tackle on their own
Industrialisation – “parts are cheap and available as variants of the same basic design. It is all about standardisation and the removal of cost from the production process” Statistics New Zealand is using new ways to collaborate, for example, working with other NSOs in the Statistical Network collaboration alliance where we lead Innovation in Dissemination project.
Standardisation – “Standardisation of methodology is not to impose a single solution. It implies adoption of the best or common solution. Any variations must be justified…” Statistics New Zealand develops components in a way that enables use by other NSOs and in turn we use components developed by other national statistical offices
25. The EA blueprint is currently founded on the Statistics NZ Generic Business Process Model (gBPM)2 model. Statistics NZ has not yet adopted the Generic Statistical Business Process Model (GSBPM), however EA will support any decision by the organisation to move to the international model without significant change. The Generic Statistical Information Model (GSIM)3 is currently under development and will be a valuable foundation element for the EA blueprint. Statistics NZ is currently participating in the GSIM development sprints. Future versions of the EA blueprint will incorporate advances made.
2 Generic Statistical Business Process Model 3 Generic Statistical Information Model (GSIM)

Increasing a
26. Trenand transpargovernment deliver statisexpectations
27. In adin the area o
III. End28. The strategic goacapability acartefacts incto-end capab A. Princi
29. Prinand support 32. Statiand our cornarchitecture
30. The to ensure tha3rd party inStatistics NZStatistical Don EA princ B. Conce
31. The high level vanother. Theof Statistics
Figure 3: Ent
4 The Declara
access and m
nds in globalrent governmwill lead to
stics. Statistis will continu
dapting to, aof confidentia
d-to-end enterprise a
als through cross the orluding princ
bility roadma
iples and st
nciples are gethe way in wistics NZ’s Inerstone prinprinciples to
purpose of at everyone ncluding “CoZ software.
Data and Metiples and sta
eptual EA m
enterprise aview of the oe base modelNZ’s IT Stra
terprise archit
ation on Open
mobility
l informationment4, and the
new understcs NZ’s servue to expand
and taking adality and data
enterprisarchitecture a ‘platform’
rganisation. iples and staap outlining
tandards
eneral rules which we set IT Principlesnciples (as oo guide the d
the Enterprisis familiar wommercial OAll metadat
tadata eXchaandards.
models and
rchitecture coverall EA dl is the Enterategy in 2009
tecture framew
and Transpar
n technology,e increasing eandings and
vices will be as device ca
dvantage of, ta security, an
e architecseeks to en
’ approach tThe End-to-
andards, concfuture capab
and guidelinabout fulfill, as outlined
outlined in thelivery and u
se Architectuwith and comOff The Sheta systems w
ange (SDMX
d capability
conceptual mdirection, corprise Archite9 and has no
work
rent Governme
, New Zealanexpectation opportunitieincreasingly
apability and
these trends nd EA will d
cture bluenable the stato building c-End Enterpceptual mode
bilities and tim
nes, intendedling our miss
d in the IT Strhe Strategic use of our IT
ure (EA) Stamplies with Eelf” (COTS)will align w
X) standards.
y specificati
models are prre layers of ecture Frame
ot significantl
ent, August 2
nd Governmof shared usees to support y accessed frod business int
we need to mdesign solutio
eprint atistical archcapability forise Architeels, capabilitmelines.
d to be endusion. rategy, applyPlan 2010-2
T assets and r
andards is toEA requirem), open sour
with the DataPlease refer
ions
imarily utilisthe architec
ework. Thisly changed.
011, New Zea
ment’s commie and commotransformati
om mobile ptelligence tec
maintain our ons with mob
itecture andor survey clucture Blueprty specificati
ring and seld
y to the EA b20) have beeresources.
clearly statements. These rce software a Documentar to Appendi
sed for commcture, and ho model was
aland Governm
itment towaron capabilityional change
platforms, andchniques imp
responsibilitbility in mind
d Statistics Nusters and rrint containsions and a dr
dom amende
blueprint. Then used to de
e the EA reqstandards ap
e and internatation Initiatiix III for mo
munication. Tow the layeroriginally ap
ment
rds an open y across e in the way wd user prove.
ties and valud.
New Zealande-using shars a number raft of the en
ed, that infor
he IT principlevelop a set
quirements apply equally ally developive (DDI) a
ore informati
They providers relate to opproved as p
6
we
ues
d’s red of
nd-
rm
les of
and to
ped and ion
e a one art

32. The overall caparequired capand below is
At tMicrdevespecstan
The socidataHowdata
The systetoolbused
The servthe mlayethe cprov
The comview
Figure 4: Pla 33. Sharcapability tInfrastructurthe stack. Thcluster usingunique to the
enterprise aability (insteapability throus a descriptio
the lowest larosoft Windelopment encialist tools idardisation data layer i
al, populatioa with structuwever, we alsa is collected
tools and seems in the ebox), technicd within HR
next layer vices to provmanagement
er provides Icapability tovides the cap
top layer imbine it withwing, unique
atforms and se
red tools andto the enterre, software, he ‘platformg foundatione platform.
architecture pad of that of ugh layers ofon of each:
ayer the IT Idows Operatinvironment (including SA
includes varon and econoural similaritso implemen, managed, a
ervices layer enterprise. Thcal tools (suand Financehas the Fou
vide access tot of all statisInformation A search, disc
pability to anais the platfoh the elemenstatistical to
ervices
d services, arprise. We tools and se
m approach’ rnal elements
provides the individual syf tools, servi
Infrastructureing environm(including M
AS Server an
rious data clomic data, aties is implemnt data with sand shared vi
provides thehese include ch as metada) undation Sero broader arstical metadaAccess and
cover, and acalyse data an
orm layer. Ents specificools) where it
and infrastruccan also st
ervices acrossrefers to the s, tools and
ability to loystems, projices, and pla
e continues ment, MicroMicrosoft Annd EG, and B
lusters and tadministrativmented in gespecific strucia the tools ae capability t statistical toata and conf
rvices. Thesreas of capabata. ImportanInformation
ccess all infond produce stEach platform
to the statist is required.
cture ensuretage and tas the differenimplementaservices, da
ook at the arect by projec
atforms. Ther
to be standasoft SQL Senalysis, InteBlaise. This
types. Exame data, and eneric data sctures in sepaand services lto perform spools (such asfiguration too
e combine ability such asntly, from thAnalysis ca
ormation in thtatistics readm will provstical area (. This is illus
e we are ablearget improvnt layers wit
ation of the bata and infra
rchitecture oct). The EA re are five la
ardised with erver data enegration and
layer contin
ples includegeospatial dtores (eg miarate data stolayer pecialised tas those in theols), and cor
and add to s the managhe point of vapability: Infhe enterprise
dy for dissemide access te.g. unique
strated in the
e to effectivevements, adth the benefitbusiness procastructure. T
of Statistics Ndelivers our
ayers in the E
the implemenvironment,
d Reporting nues to unde
e: the framesdata. Storing icro-economores where a
asks and are e Standard Mrporate tools
the lower lagement of claview of the formation Ae and Inform
mination to standard data storage
e diagram bel
ely and efficdditions, andts flowing bacess model f
These may b
New Zealandr organisationEA framewo
entation of tthe MicrosoServices) a
ergo significa
s, all collectand managiic, househol
appropriate. A
available to Methodologic
(such as tho
ayer tools aassifications platforms, th
Access providmation Analy
capability ae, unique dalow:
ciently provid upgrades ack up throufor a statisticbe common
7
d’s n’s ork
the oft
and ant
ted ing d). All
all cal ose
and or
his des sis
and ata
ide to
ugh cal or

34. A caabout the beThe capabilcoded to madevelopmenvisual repres C. End-t
35. The a timeline. Tand when iArchitecture
36. The the EA teamcapability, p
37. The project teamThere are cuthe respectivfrom very efive statuses
Figure 5: Ind
IV. Go
A. Respo
38. Comwho approvendorse the Portfolio Coarchitecture
apability speenefits and felity specificaatch the five
nt. Please refsentation of w
to-end capa
capability roThis quicklyit will be ae team.
roadmaps prm members position withi
roadmaps ams. The roadmurrently 12 rove project starly ideas an
s for the road
dividual roadm
vernance
onsibilities
mpliance withve the EA as
annual reviommittee or where a con
ecification iseatures of theations are coe layers of fer to Appenwhere capab
ability road
oadmap is a y identifies fravailable. It
resent a fourare involvedin the Enterp
are developemaps providoadmaps andteering commnd concepts
dmaps accord
map status
e and revi
and autho
h the EA is s part of theision of the
Steering Conflict cannot b
s a brief dese capability aontinually uthe EA stac
ndix I for anilities sit on
dmap and i
visual represfrom where i
is an align
r year outlined in. The roprise Archite
ed in conjunce an agreed vd the goal is mittees by Ato having ac
dingly:
ews
rity
required. The IT strategyEA and pro
ommittee (ube resolved o
scription of and how it al
under develock model ann example othe EA fram
individual
sentation of ain the enterp
nment of the
e of capabilitadmaps com
ecture, and a
ction with thview which i to have tho
August 2012chieved sign
he highest-levy. The IT Aovide adviceusing the advor where the
each capabiligns to Stati
opment and nd the statusf a capabilit
mework diagr
roadmaps
all capabilitiprise architece individual
ties for the inmprise inform
developmen
he platform is also represse currently . The roadm
n off by a pr
vel authorityAdvisory Boae on the archvice of the Ire is a very s
lity in the estics New Zereview. The
s reflects if ty specificatiam.
es aligned tocture the cap
roadmaps
ndividual promation aboutt timetable.
or capabilitysented in proin draft and
maps are at vroject steerin
y for the EA ard (ITAB) hhitecture revITAB) can dsignificant de
enterprise wiealand’s stra
e specificatioit is an exision and App
o the EA stacpability is/wicreated by
ojects and prt current cap
y owners anoject/program
consultationvarying leveng committee
A is the Statishas delegate
view processdecide on thecision to be
8
ith a statemeategic prioritions are colosting or futupendix II for
ck model aloill be providthe Enterpri
rogrammes thpability, futu
nd the delivemme plans. n signed off els of maturie. We have s
stics NZ Boaed authority s. The relevahe approach taken.
ent ies. our ure r a
ong ded ise
hat ure
ery
by ity, set
ard to
ant to

9
39. The Architecture Review Panel (ARP) has responsibility through the architecture review process to ensure compliance with the EA and issue waivers/exemptions to projects/programmes.
The ARP has authority in two key areas:
Ensuring projects remain compliant with the architecture that was approved through the architecture review process. In cases where the project strays considerably from the approved architecture, the Senior Solution Architect has the authority to refer the project back through the architecture review process
Determining whether a change project must go through architecture review. If, in the opinion of the Enterprise Architecture Manager, the project is deemed a low architectural risk, he or she may conditionally exempt the project from the architecture review process although the project is still expected to comply with the EA
40. All individual roadmaps are developed in conjunction with the business owner and the project team. The approval authority for the individual roadmap is the relevant steering committee. B. Architecture review process
41. All changes to information, technology, and solutions are subject to Architecture Review. This step ensures that all changes are compliant with the EA. If they are not compliant, then projects must seek a waiver from the ARP. All developments, enhancements, introductions of new tools or third party software are required to submit an Architecture Review Proposal. 42. Projects with a budget of over $100,000 require an additional architecture review at the strategic level prior to the initiation phase (this is usually undertaken in conjunction with the development of the Business Case). The architecture review is a formal check that is performed to:
1) Review the architecture being proposed with respect to the project's purpose and context (gBPM, EA)
2) Discuss the possible architecture options 3) Make recommendations on how to proceed so that there is consistency with Statistics NZ’s EA
The architecture review helps to identify vulnerabilities in a proposed architecture through analysis of the overall design of the solution. It also provides an opportunity to challenge the existing architecture making architectural change a managed process.
43. The architecture review is performed by panel chaired by the Enterprise Architecture Manager and the following roles representing the project: IT Delivery Manager, Project Manager/SMPM, Solution (or appropriate) Architect and the Senior Developer from the development team. The outcome of an Architecture Review is an Architecture Action Plan. C. External reviews
44. In November 2010, as part of the external reviews undertaken for the Statistics 2020 Te Kāpehu Whetū business case process, Horizon Consulting undertook two reviews. The first review provided a risk assessment of the current state of Statistics NZ IT systems from a sustainability perspective (life-cycle management, maintenance, skill availability and adaptability to external change) and technology perspective (age, versions, mix of technology used).
45. The second review provided a set of recommendations to mitigate the risks identified in the first review and an assessment of the degree to which the proposed programme of work, specifically the Legacy Mitigation Programme and the Enterprise Architecture, would be successful in mitigating the risks identified in the first review (collectively these are referred to as the Horizon Consulting Review).

46. The Planning andStatistics Ne
Whithe b
Perhand corp
In mchal
As presserv
47. In thevolve and himplementatprogramme
V. EA
A. Role o
48. The business are
Adviseare del
Assist and fra
Work plan an
Comm Educat Promo
and inn
overarchingd Enterprise ew Zealand’s
ile well thoubusiness (HRhaps there is
“Data” layporate sides omoving to a llenges that So Who ‘owo How cano How canStatistics 20
ssures. The vice the Statis
he year sinchas taken intion of the EStats 2020.
A team
of the EA te
EA team ias and are le
e and commlivered in positioni
ameworks with technicnd design
municate newte and guide
ote and guidnovation
g finding wasArchitecture
s enterprise a
ght out, the R, Finance, sh
another layeers and whof the busine
model of sStatistics Newwns’ shared mn administratn we ensure 020 ramps uEA team es
stics 2020 po
ce the reviewnto consideraEA through
eam
is composeded by the Ent
municate so t
ng and plan
cal teams an
w and currentthe impleme
de research
s "Statistics Ne developmenarchitecture t
draft EA conhared corporer to be addeich compris
ess as alludedshared compw Zealand hamodules? tive data be sthat the archup these arrstimates thatortfolio of pr
w was underation the find
delivery pro
d of solutionterprise Arch
that the best
ning using r
nd business
directions entation of thand develop
New Zealandnt in a prudethe review ou
nceptual modrate applicatied to the moses “Commod to above ponents, the as not encou
shared amonhitecture is wrangements at they will nrojects.
rtaken Statisdings of the
rogrammes a
n, security, ahitecture man
Figu
t systems
roadmaps
teams to
he EA pment
d is proceedinent well thouutlined the fo
del does not ions, “under-del that sits
on Facilities
draft EA thuntered befor
ngst a varietywell understoo
are likely toneed to grow
stics NZ’s ene Horizon Coand projects
and data arcnager. The ro
ure 6: Role of
ng with bothght out mannollowing gap
appear to ad-the-hood” enbetween the ” utilised o
hrows up some.
y of business od and followo be stresse
w by approxi
nterprise arconsulting revvia our org
chitects whoole of EA tea
f the EA team
h its Legacy Mner". In relatps and challe
ddress the coenabling tech
“Statistical on both the
me interestin
units? wed? ed not least imately 50%
chitecture haview, and isganisation’s
o engage wiam is to:
10
Migration tion to nges:
orporate side hnologies, etc
Infrastructurstatistical a
ng governan
by resourci% to be able
as continued learning fro
transformati
ith the vario
of c) re” and
nce
ing to
to om ion
ous

11
B. Value Proposition
49. An important objective of the Enterprise Architecture team is to provide guidance to ensure Statistics NZ maximises its return on IT investments through:
Promoting an enterprise view of technology across all software development projects and major technology initiatives
Facilitating the integration of business strategies into technology planning, including input into IT investment strategies
Promoting a culture of re-use at the business service level leading to improved delivery time frames and lower implementation costs
Leveraging existing appropriate technical and support infrastructure to reduce the total cost of ownership (costs and manageability)
Facilitating, in combination with relevant research and development efforts, the efficient and effective introduction of new technology to maximise the return on IT investments
Basic concepts for operating this knowledge portal are to develop a department culture like that shown in Figure 6 above, and to aim for staged growth by building trust and establishing value.
VI. Lessons learned and conclusions
A. Lessons learned
50. Statistics NZ’s EA has been evolving for a number of years. During this period we learned some important lessons:
Alignment to statistical architecture: EA has to be aligned with statistical architecture, however in an NSI we often have multiple statistical architectures (eg economic, social etc) at different levels of maturity and implementation. We approached this challenge by using the platform approach to allow EA to consider the breadth and pace at which the organisation needs to transform
Business ownership: implementation of enterprise architecture through the business projects can be very difficult if ownership isn’t clear. Governance framework (SW Owners Forum, Platforms Owners, and Project Steering Committees) was established to assure decisions are being taken at the appropriate levels and progress is monitored across the portfolios of projects
EA has to be proactive and directly engaged with the implementation teams on an ongoing basis to ensure two-way connection between high level EA work and detailed design and implementation
Management of change and migration is often underestimated. A huge effort is required to implement new enterprise architecture at the organisational-wide scale
EA has to start with small successes and build on top of these. This improves business buy-in and removes the risk associated with big bang delivery
We must always be aware of the end goal but keep in mind that this can change as the environment is constantly changing/evolving (eg relatively recent availability of cloud options, recent changes in mobile capabilities)
B. Conclusions
51. EA is a business-driven process that describes the impact of business change on the organisation's business processes, information, solutions and technology. Therefore the primary deliverable is the EA and its successful implementation. The majority of artefacts, concepts, and diagrams detailed in this document are not new, however it is the first time they have been presented together in a coherent framework.

12
References Statistics New Zealand Strategic Plan 2010 – 20, http://www.stats.govt.nz/~/media/Statistics/about-us/corporate-publications/strategic-plan/snz-strategic-plan-2010-20-new.pdf Statistics New Zealand IT Strategy 2009 – 2012, internal document Statistics NZ’s Business Development Plan - June 2011, internal document NZ Government, Directions and Priorities for Government ICT, http://ict.govt.nz/directions-and-priorities A strategic vision for the products and processes of official statistics – report by the High-level Group for Strategic Developments in Business Architecture in Statistics, 59th Plenary Session of the Conference of European Statisticians (14-16 June 2011, Geneva) Horizon Consulting: IT Risk Review, Statistics New Zealand - Current IT Environment, November 2010, internal document Horizon Consulting: IT Risk Mitigation, Statistics New Zealand - Legacy Migration Plan and Enterprise Architecture, December 2010, internal document
13
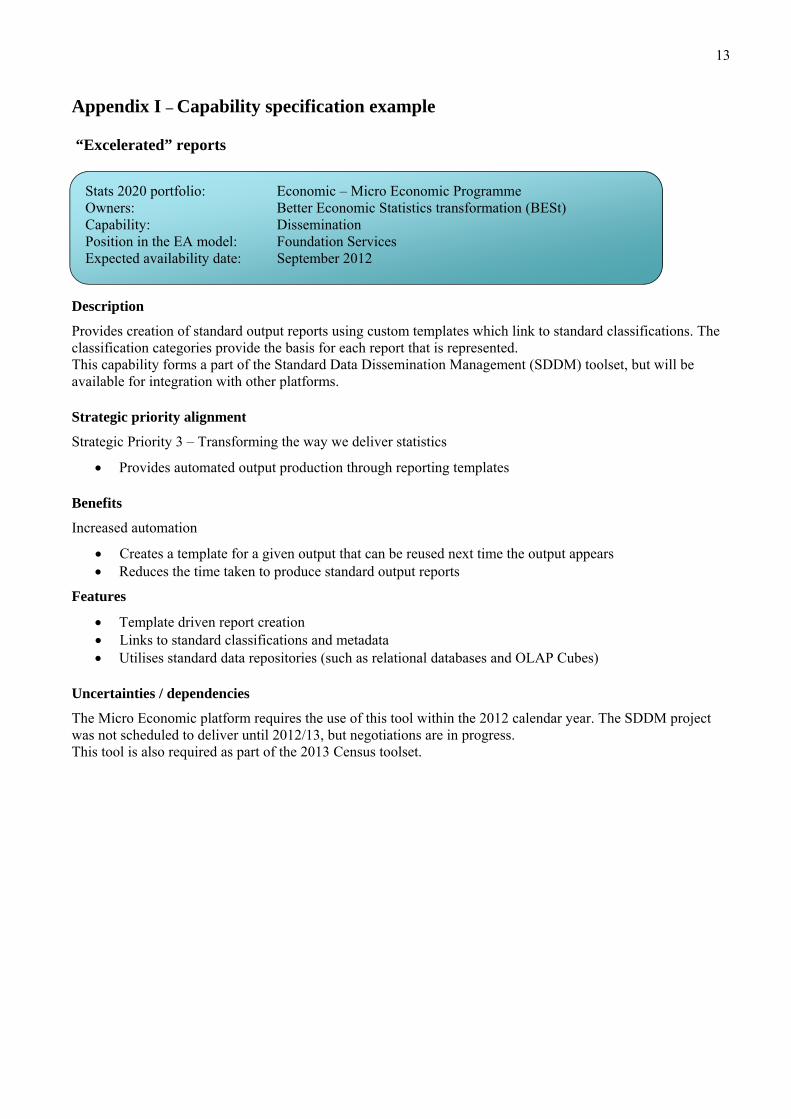
Appendix I – Capability specification example
“Excelerated” reports
Description
Provides creation of standard output reports using custom templates which link to standard classifications. The classification categories provide the basis for each report that is represented. This capability forms a part of the Standard Data Dissemination Management (SDDM) toolset, but will be available for integration with other platforms.
Strategic priority alignment
Strategic Priority 3 – Transforming the way we deliver statistics
Provides automated output production through reporting templates
Benefits
Increased automation
Creates a template for a given output that can be reused next time the output appears Reduces the time taken to produce standard output reports
Features
Template driven report creation Links to standard classifications and metadata Utilises standard data repositories (such as relational databases and OLAP Cubes)
Uncertainties / dependencies
The Micro Economic platform requires the use of this tool within the 2012 calendar year. The SDDM project was not scheduled to deliver until 2012/13, but negotiations are in progress. This tool is also required as part of the 2013 Census toolset.
Stats 2020 portfolio: Economic – Micro Economic Programme Owners: Better Economic Statistics transformation (BESt) Capability: Dissemination Position in the EA model: Foundation Services Expected availability date: September 2012

Appendix The Capabilthe EA fram Note: This iinitiatives orof all. Diagram ke
R
R
Rus
R Reusability
Our aim for EA stack so
For example
x II – Cap
lities by posimework diagr
s a first draftr programme
ey
Represents a c
Represents a p
Represents a rsed by the va
Represents a c
goal
the future is it’s available
e, capabilities
pabilities
tion in EA dam.
ft where the fes. Future ver
current capab
proposed cap
reusable capaarious platfor
capability tha
to try and ine to a wider
s available in
by positio
diagram (next
focus has beersions will in
bility that is
pability
ability that isrms
at is provide
ncrease the amaudience.
n Platform
on in EA
t page) is a v
en to highlighnclude all ex
specific to a
s provided at
d elsewhere
mount of reu
are provms
view of the c
ht capabilityisting capabi
layer or plat
t a lower lay
outside of S
use by provid
vided by T
apabilities an
delivered orilities and ind
tform
er (eg Tools
tatistics NZ
ding the capa
Tools & Serv
nd shows wh
r proposed fodicate the lif
and Service
ability furthe
vices
14
here they sit
or current fecycle status
s) and can be
er down the
on
s
e

Capabil
lities by posi
Figure 7: Cap
ition in EA
pabilities by pposition in EAA version 0.1 (Deliveries supported by llegacy systems are not incluuded in this ve
ersion)

Appenndix III -
Figure 8: EA
Statistics
A poster
New Zea
aland’s EAA informaation postter