enterprise manager performance tips (2)
TRANSCRIPT
Enterprise Manager Performance Tips + The tips below are related to common situations customers experience when their Enterprise Manager(s) are not
performing consistent with performance goals. If you are experiencing missing data points in graphs or dashboards, agent /collectors disconnections, OutOfMemory messages or other like symptoms, review the tips below for possible solutions to reconcile performance in line with your goals.
Question/Tip Situation Action Steps
Check Outgoing Message Queue Properties
Gaps in metrics can be the result of insufficient capacity to send and receive messages between collectors and the MOM. Increasing the size of the outgoing message queue increases the buffer size and increasing the thread pool size allows more worker threads to send outgoing messages. Both of these enable more threads and larger buffers to send messages between collectors and MOM, which can alleviate performance bottlenecks.
Confirm the appropriate settings to increase buffer size for the message queue and thread pool size are defined for the MOM and all collectors.
1. Confirm the following settings are defined in *ALL*EMS (MOM and Collectors) IntroscopeEnterpriseManager.properties files: transport.outgoingMessageQueueSize=6000 transport.override.isengard.high.concurrency.pool.min.size=10 transport.override.isengard.high.concurrency.pool.max.size=10
2. Restart EM for changes to take effect.
Do not run the EM with DEBUG logging Enabled
The DEBUG log is used to capture data to facilitate problem identification and resolution and should NOT be always enabled. You should enable and disable it only when troubleshooting with
Verify that the DEBUG log is disabled. If it is not, follow the steps to the right to disable it.
Disable DEBUG logging in the IntroscopeEnterpriseManager.properties ################################# # Logging Configuration # ================ # # Logging properties support hot config.
Page 1 of 13
Copyright © 2012 CA. All rights reserved.
CA Technologies Support. Keeping it enabled results in unnecessary resource consumption which can degrade performance.
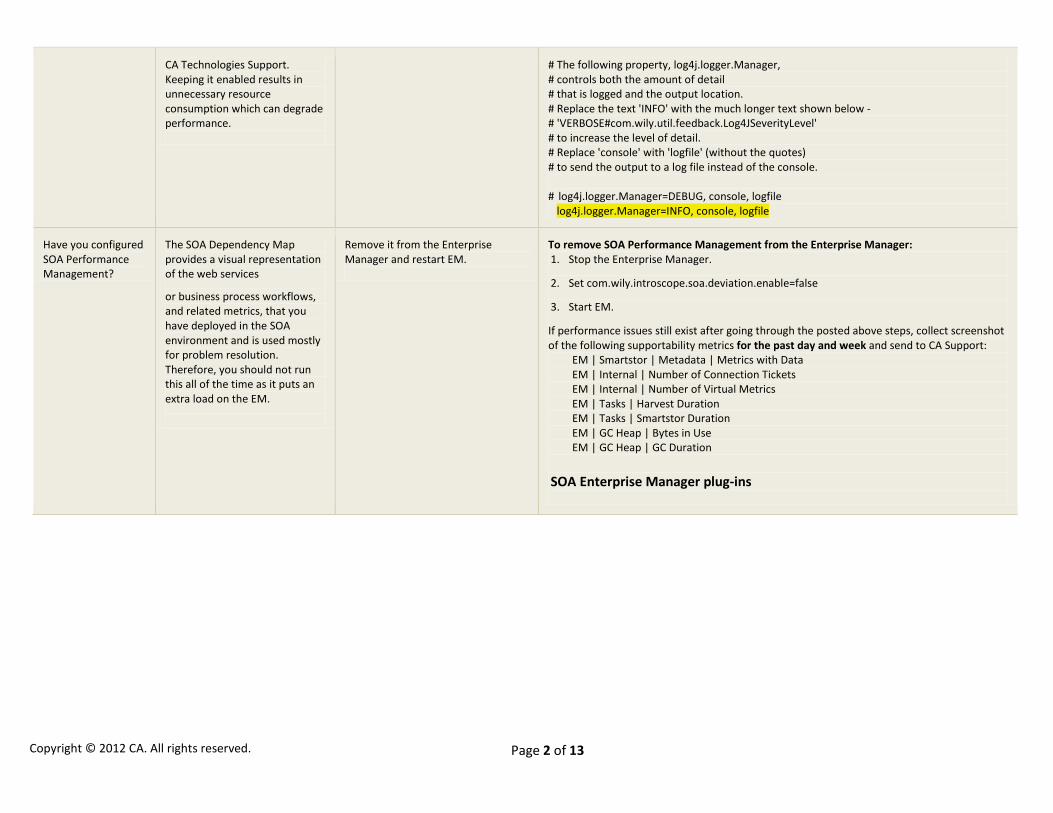
# The following property, log4j.logger.Manager, # controls both the amount of detail # that is logged and the output location. # Replace the text 'INFO' with the much longer text shown below - # 'VERBOSE#com.wily.util.feedback.Log4JSeverityLevel' # to increase the level of detail. # Replace 'console' with 'logfile' (without the quotes) # to send the output to a log file instead of the console. # log4j.logger.Manager=DEBUG, console, logfile
log4j.logger.Manager=INFO, console, logfile
Have you configured SOA Performance Management?
The SOA Dependency Map provides a visual representation of the web services
or business process workflows, and related metrics, that you have deployed in the SOA environment and is used mostly for problem resolution. Therefore, you should not run this all of the time as it puts an extra load on the EM.
Remove it from the Enterprise Manager and restart EM.
To remove SOA Performance Management from the Enterprise Manager: 1. Stop the Enterprise Manager.
2. Set com.wily.introscope.soa.deviation.enable=false
3. Start EM.
If performance issues still exist after going through the posted above steps, collect screenshot of the following supportability metrics for the past day and week and send to CA Support:
EM | Smartstor | Metadata | Metrics with Data EM | Internal | Number of Connection Tickets EM | Internal | Number of Virtual Metrics EM | Tasks | Harvest Duration EM | Tasks | Smartstor Duration EM | GC Heap | Bytes in Use EM | GC Heap | GC Duration
SOA Enterprise Manager plug-ins
Page 2 of 13
Copyright © 2012 CA. All rights reserved.
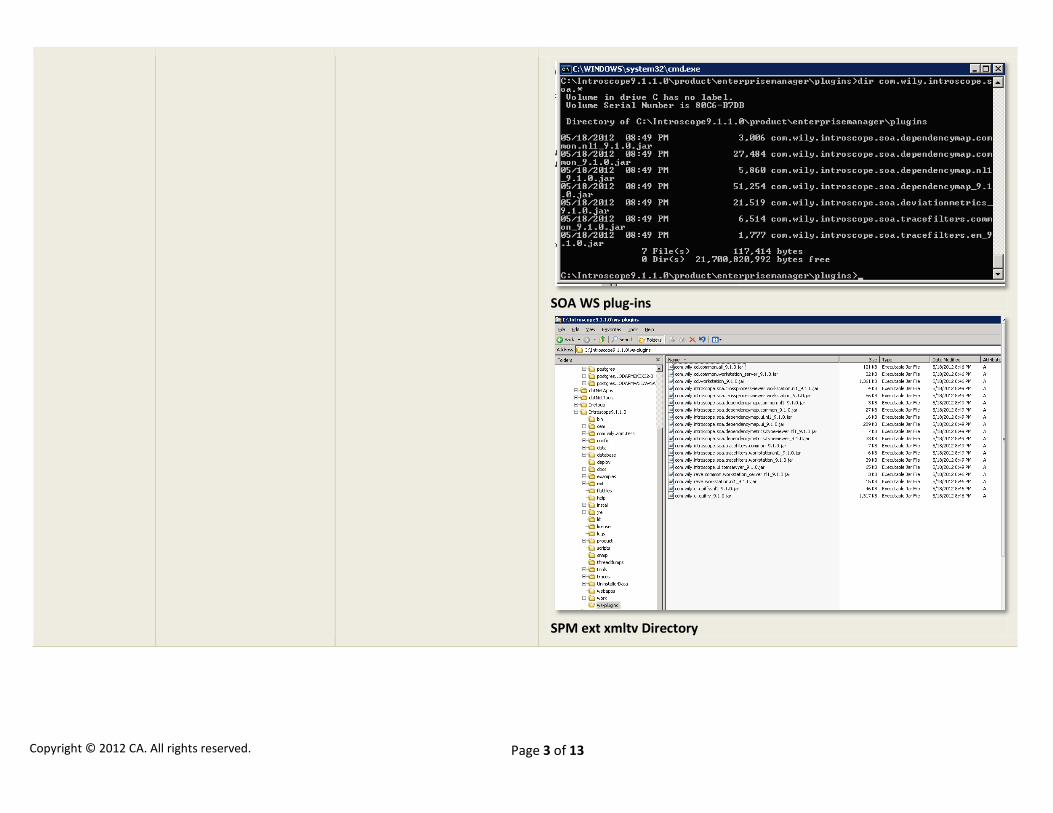
SOA WS plug-ins
SPM ext xmltv Directory
Page 3 of 13
Copyright © 2012 CA. All rights reserved.
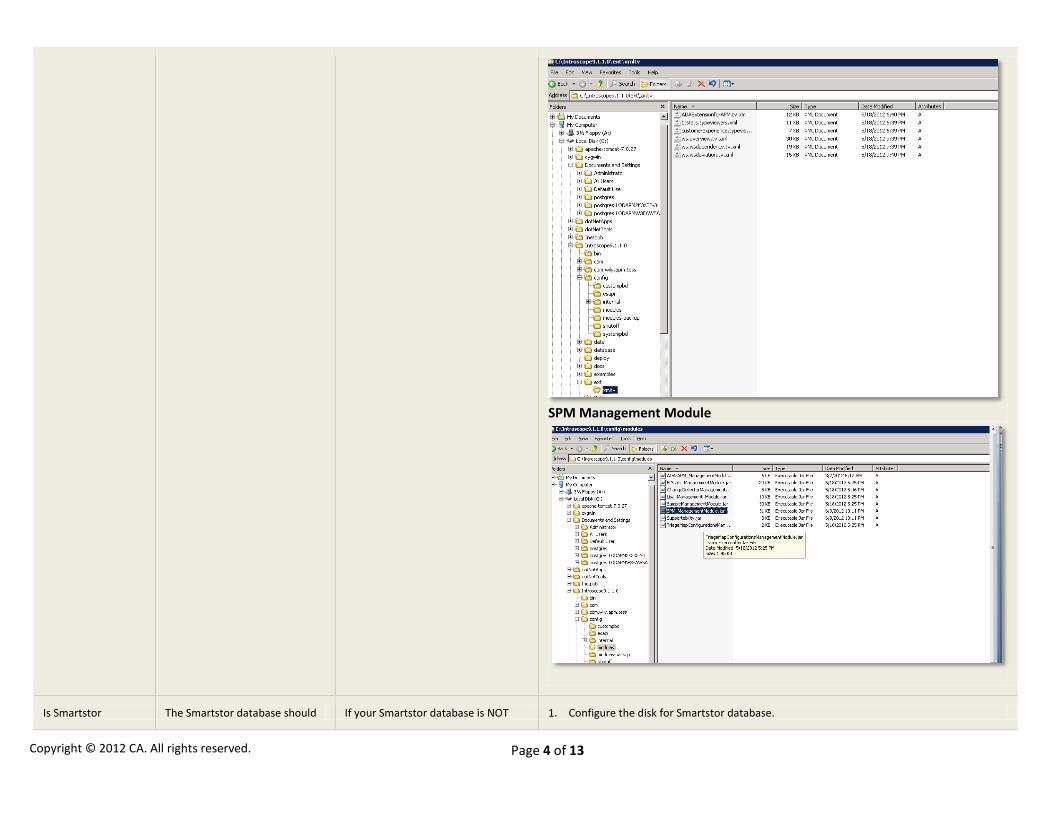
SPM Management Module
Is Smartstor The Smartstor database should If your Smartstor database is NOT 1. Configure the disk for Smartstor database.
Page 4 of 13
Copyright © 2012 CA. All rights reserved.

database pointing to a dedicated disk?
be configured to have its own disk. This mitigates resource contention and allows for:
• Multiple I/O tasks to run simultaneously in the EM environment
• SmartStor to write to disk less frequently
• Less activity from the disk's seek pointer
pointing to a dedicated disk, configure it to do so AND change the EM property as shown in the next column. If you configure a dedicated disk for SmartStor, AND do not set the property to true, there is no performance gain by having a separate disk for SmartStor.
2. Confirm the EM property introscope.enterprisemanager.smartstor.dedicatedcontroller=true
3. Restart EM.
Are you Using SAN (Storage Area Network) for SmartStor?
Each logical unit number (LUN) requires a dedicated physical disk.
If you have configured two or more LUNs to represent partitions or subsets of the same physical disk, you will not reap the advantages of having SmartStor on a dedicated hd/disk controller.
Configure each LUN to a dedicated physical disk, and then configure introscope.enterprisemanager.smartstor.dedicatedcontroller to true.
1. Configure each LUN to a dedicated physical disk. Consult with your Network Administrator for more information as well as the CA Wily APM Data Storage Requirements and Recommendations › Enterprise Manager internal database settings and capacity topic in the APM Sizing and Performance Guide.
2. Configure introscope.enterprisemanager.smartstor.dedicatedcontroller to true in IntroscopeEnterpriseManager.properties file
3. Restart EM.
Is the Enterprise Manager | Data | Smartstor | Metadata | Metrics with Data" supportability metric higher than 300K for v8.x and 600K for v9.x.?
If this metric is high, there are likely too many metrics being stored in the SmartStor database and the database file needs to be tuned. You can use the Smartstor Tool Utility to do so.
Often metrics are stored too long and are no longer needed and need to be removed from the database.
Bring down Smartstor. Use the SmartStor Tool Utility to “tune” the data in the file; i.e. reduce the historical metric count.
Cleaning the Smartstor file is unique to each environment. Consult the Configuring Enterprise Manager Databases › Using SmartStor Tools to Tune SmartStor Data topic in the APM Configuration and Administration Guide, for specific guidelines for how to approach tuning your Smartstor file.
Page 5 of 13
Copyright © 2012 CA. All rights reserved.
Have you configured Virtual Agents in agentclusters.xml?
Virtual Agents are used for special circumstances and will consume additional resources, if you implement them. A virtual agent is essentially a calculator, and the resource you have to watch is CPU. Calculator overload is also reflected in harvest duration. After confirming that you need the virtual agents, check to ensure that you have enough capacity in your EM environment to manage them. By default, metrics are displayed for each agent independently. If you want to view web service metrics aggregated across multiple agents or client and server namespaces, you must define a Virtual Agent. If you want multiple agents to monitor separate instances of a clustered application, you must configure those agents as Virtual Agents, which allow you to aggregate metrics at the application level. This aggregation can cause an extra load on the EM, and could cause performance issues, so be sure you have the capacity to manage them.
A virtual agent is essentially a calculator, and the resource you have to watch is CPU. Calculator overload is also reflected in harvest duration.
If you are experiencing performance degradations and are using multiple virtual agents, consider removing them from the EM\config\agentclusters.xml or increase the capacity of your EM environment.
If you choose to remove any virtual agents, do so from the EM\config\agentclusters.xml and restart EM.
EM running on UNIX as a nohup process but configured incorrectly
If the Enterprise Manager is running in a UNIX environment, it should run in no hangup or “nohup mode.” “Nohup” allows the Enterprise Manager to continue operating after the user who started it “hangs up” or logs out. Output that normally goes to the terminal will go to a file named, “nohup.out.”
Confirm nohup mode has been configured in the relevant property files and start the Enterprise Manager with the nohup variable as shown in the next column.
To run the Introscope Enterprise Manager in nohup mode on UNIX: 1. In the Introscope_Enterprise_Manager.lax file, in the <EM_Home>/ directory, set the
lax.stdin.redirect property to blank, and save the file.
2. Start the Enterprise Manager with this command:
nohup Introscope_Enterprise_Manager&
Page 6 of 13
Copyright © 2012 CA. All rights reserved.
The UNIX nohup (no hangup) command runs a command, but suppresses the action of the HUP (hang up) signal, enabling the command to continue running after the user who issued it logs out.
Incorrect Memory setting
Setting the initial and maximum heap size to be equal prevents the overhead associated with expansion or contraction of the files, which can result in significant performance gains in some situations.
Set the initial heap size (-Xms) equal to the maximum heap size (-Xmx) in the Introscope Enterprise Manager.lax or EMService.conf and restart EM.
1. To set the initial heap size (-Xms) equal to the maximum heap size (-Xmx) in the Introscope Enterprise Manager.lax or if you are starting EM as a Windows Service, EMService.conf, follow these examples: IntroscopeEnterpriseManager.lax file Example lax.nl.java.option.additional=-Xms1024m -Xmx1024m -Djava.awt.headless=false -XX:MaxPermSize=256m -Dmail.mime.charset=UTF-8 -showversion -XX:+UseConcMarkSweepGC -XX:+UseParNewGC -XX:CMSInitiatingOccupancyFraction=50 -Xss256k EMService.conf Example # Initial Java Heap Size (in MB) wrapper.java.initmemory=1024 # Maximum Java Heap Size (in MB) wrapper.java.maxmemory=1024
2. Restart the EM after making these changes.
Transaction Traces database size increasing rapidly, too many events
EM creates the traces.db file each day to keep track of things like transaction traces, events data, and error snapshots. One file is created per day and spans multiple files. It is kept for the number of days specified in the IntroscopeEnterpriseManager.properties file. If you see the size of this database larger than 500K and increasing rapidly, it may be causing performance degradations.
Delete the file if it is greater than 500K and increasing rapidly as shown in the next column.
To delete the current traces.db file:
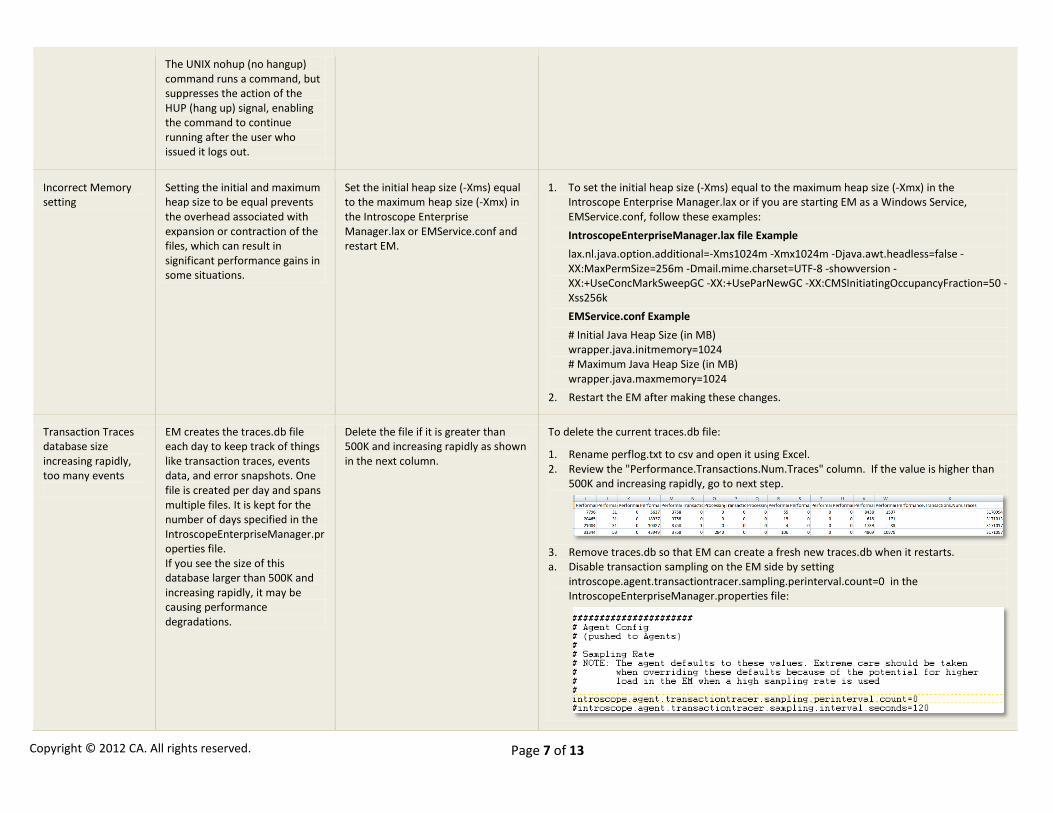
1. Rename perflog.txt to csv and open it using Excel. 2. Review the "Performance.Transactions.Num.Traces" column. If the value is higher than
500K and increasing rapidly, go to next step.
3. Remove traces.db so that EM can create a fresh new traces.db when it restarts. a. Disable transaction sampling on the EM side by setting
introscope.agent.transactiontracer.sampling.perinterval.count=0 in the IntroscopeEnterpriseManager.properties file:
Page 7 of 13
Copyright © 2012 CA. All rights reserved.
4. Set introscope.enterprisemanager.transactionevents.storage.max.data.age=1.
5. Restart the EM
If cluster: Are the collectors running on the same server?
The file cache is important for Collectors when doing SmartStor maintenance, for example, spooling and reperiodization. File cache resides in the physical RAM, and is dynamically adjusted by the OS during runtime based on the available physical RAM. To alleviate resource contention of the multiple collectors running on the same server, allocate RAM to each of the different collectors.
Assign each collector its own memory cache to alleviate resource contention. Tip: The Baseline.db and Traces.db files from up to four Collectors can reside on a separate single disk. Up to four Collectors can share the same physical disk to store all of their baseline.db and traces.db files.
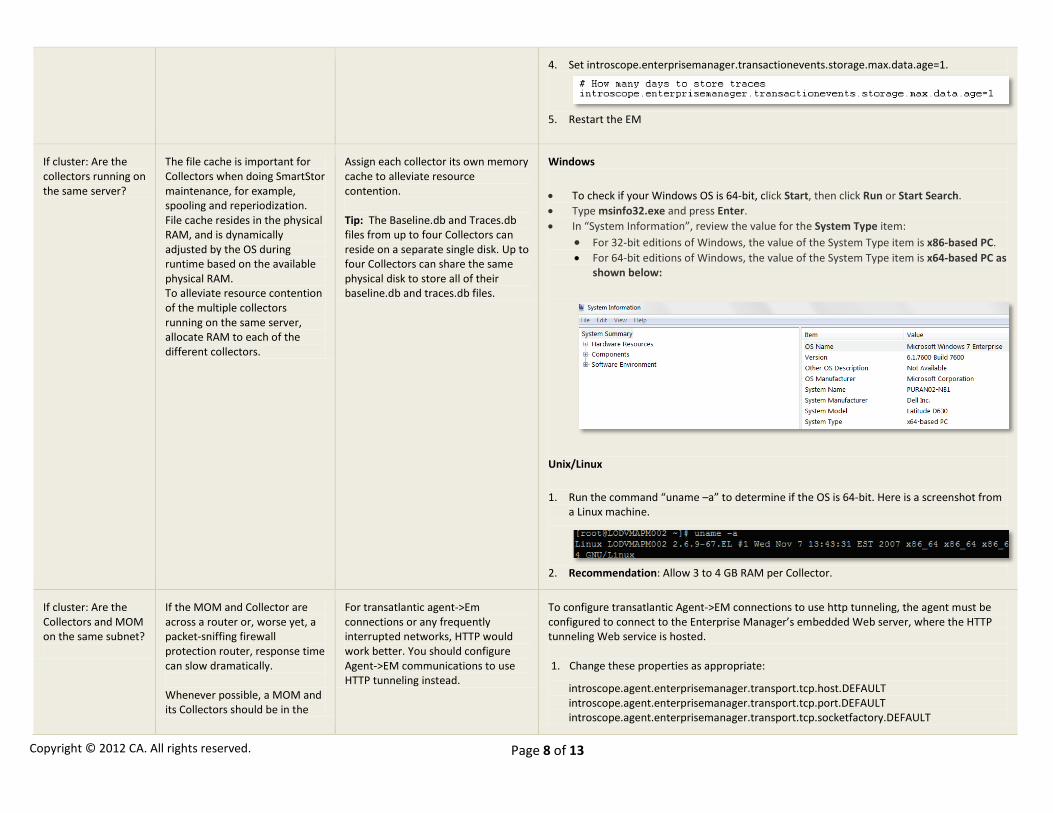
Windows
• To check if your Windows OS is 64-bit, click Start, then click Run or Start Search. • Type msinfo32.exe and press Enter. • In “System Information”, review the value for the System Type item:
• For 32-bit editions of Windows, the value of the System Type item is x86-based PC. • For 64-bit editions of Windows, the value of the System Type item is x64-based PC as
shown below:
Unix/Linux
1. Run the command “uname –a” to determine if the OS is 64-bit. Here is a screenshot from a Linux machine.
2. Recommendation: Allow 3 to 4 GB RAM per Collector.
If cluster: Are the Collectors and MOM on the same subnet?
If the MOM and Collector are across a router or, worse yet, a packet-sniffing firewall protection router, response time can slow dramatically. Whenever possible, a MOM and its Collectors should be in the
For transatlantic agent->Em connections or any frequently interrupted networks, HTTP would work better. You should configure Agent->EM communications to use HTTP tunneling instead.
To configure transatlantic Agent->EM connections to use http tunneling, the agent must be configured to connect to the Enterprise Manager’s embedded Web server, where the HTTP tunneling Web service is hosted. 1. Change these properties as appropriate:
introscope.agent.enterprisemanager.transport.tcp.host.DEFAULT introscope.agent.enterprisemanager.transport.tcp.port.DEFAULT introscope.agent.enterprisemanager.transport.tcp.socketfactory.DEFAULT
Page 8 of 13
Copyright © 2012 CA. All rights reserved.
same data center; preferably in the same subnet, even when crossing through a firewall or passing through any kind of router.
For transatlantic agent->Em connections or any frequently interrupted networks, HTTP works better. You should configure Agent->EM communications to use HTTP tunneling instead.
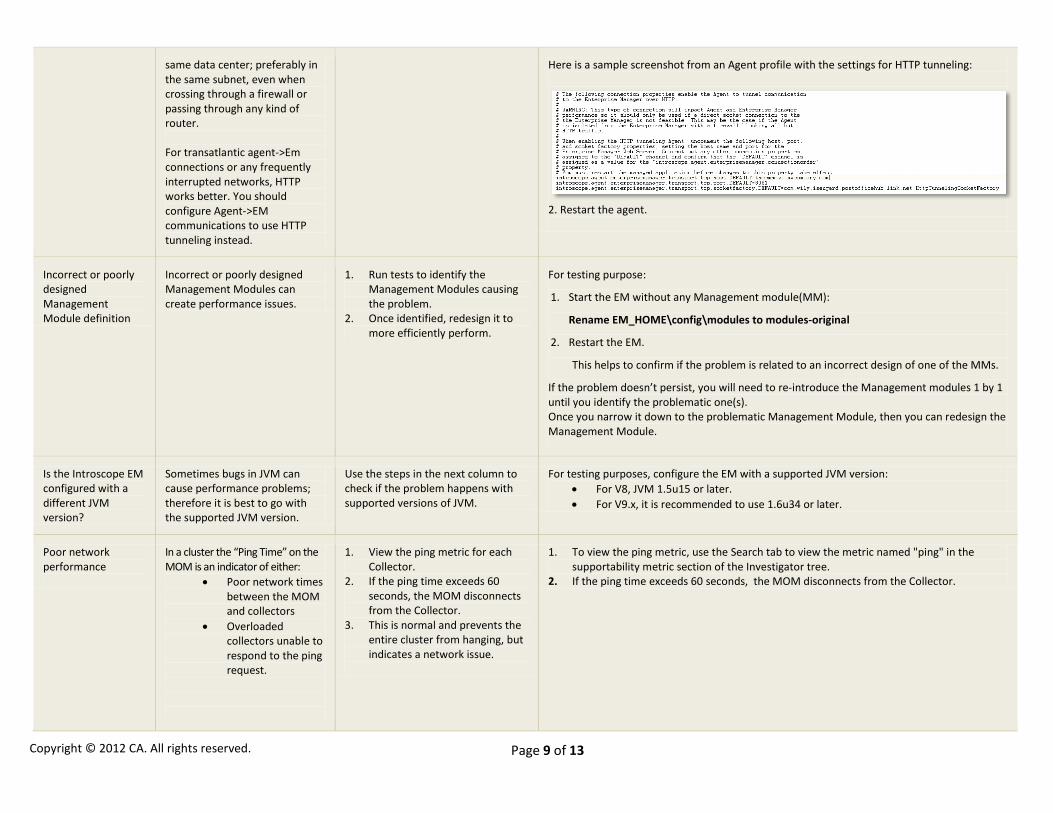
Here is a sample screenshot from an Agent profile with the settings for HTTP tunneling:
2. Restart the agent.
Incorrect or poorly designed Management Module definition
Incorrect or poorly designed Management Modules can create performance issues.
1. Run tests to identify the Management Modules causingthe problem.
2. Once identified, redesign it tomore efficiently perform.
For testing purpose:
1. Start the EM without any Management module(MM):
Rename EM_HOME\config\modules to modules-original
2. Restart the EM.
This helps to confirm if the problem is related to an incorrect design of one of the MMs.
If the problem doesn’t persist, you will need to re-introduce the Management modules 1 by 1 until you identify the problematic one(s). Once you narrow it down to the problematic Management Module, then you can redesign the Management Module.
Is the Introscope EM configured with a different JVM version?
Sometimes bugs in JVM can cause performance problems; therefore it is best to go with the supported JVM version.
Use the steps in the next column to check if the problem happens with supported versions of JVM.
For testing purposes, configure the EM with a supported JVM version: • For V8, JVM 1.5u15 or later.• For V9.x, it is recommended to use 1.6u34 or later.
Poor network performance
In a cluster the “Ping Time” on the MOM is an indicator of either:
• Poor network timesbetween the MOM and collectors
• Overloaded collectors unable to respond to the ping request.
1. View the ping metric for each Collector.
2. If the ping time exceeds 60seconds, the MOM disconnectsfrom the Collector.
3. This is normal and prevents theentire cluster from hanging, butindicates a network issue.
1. To view the ping metric, use the Search tab to view the metric named "ping" in the supportability metric section of the Investigator tree.
2. If the ping time exceeds 60 seconds, the MOM disconnects from the Collector.
Page 9 of 13 Copyright © 2012 CA. All rights reserved.
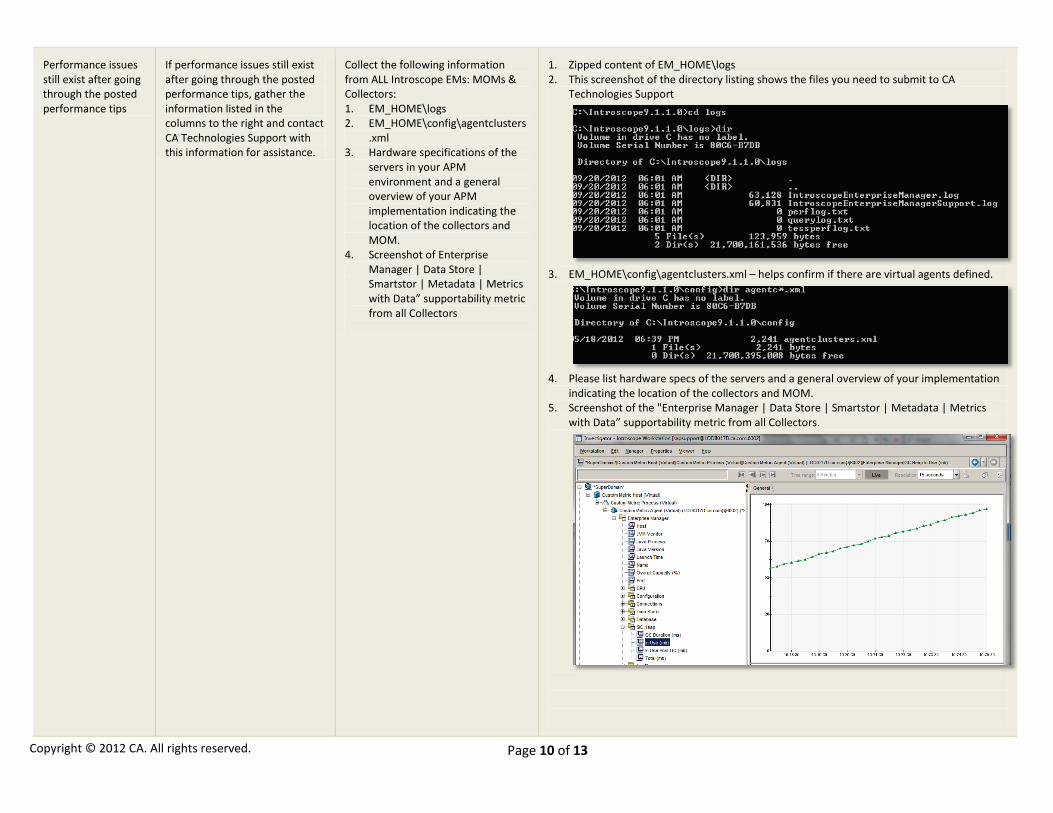
Performance issues still exist after going through the posted performance tips
If performance issues still exist after going through the posted performance tips, gather the information listed in the columns to the right and contact CA Technologies Support with this information for assistance.
Collect the following information from ALL Introscope EMs: MOMs & Collectors: 1. EM_HOME\logs 2. EM_HOME\config\agentclusters
.xml 3. Hardware specifications of the
servers in your APM environment and a general overview of your APM implementation indicating the location of the collectors and MOM.
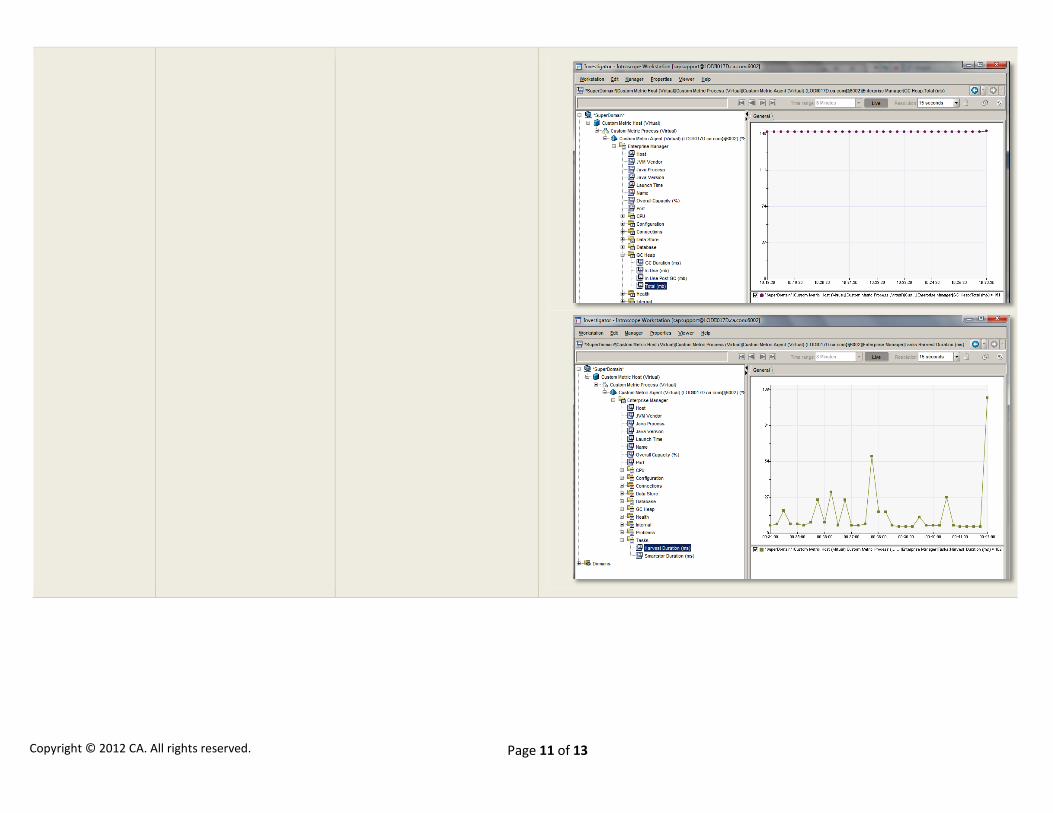
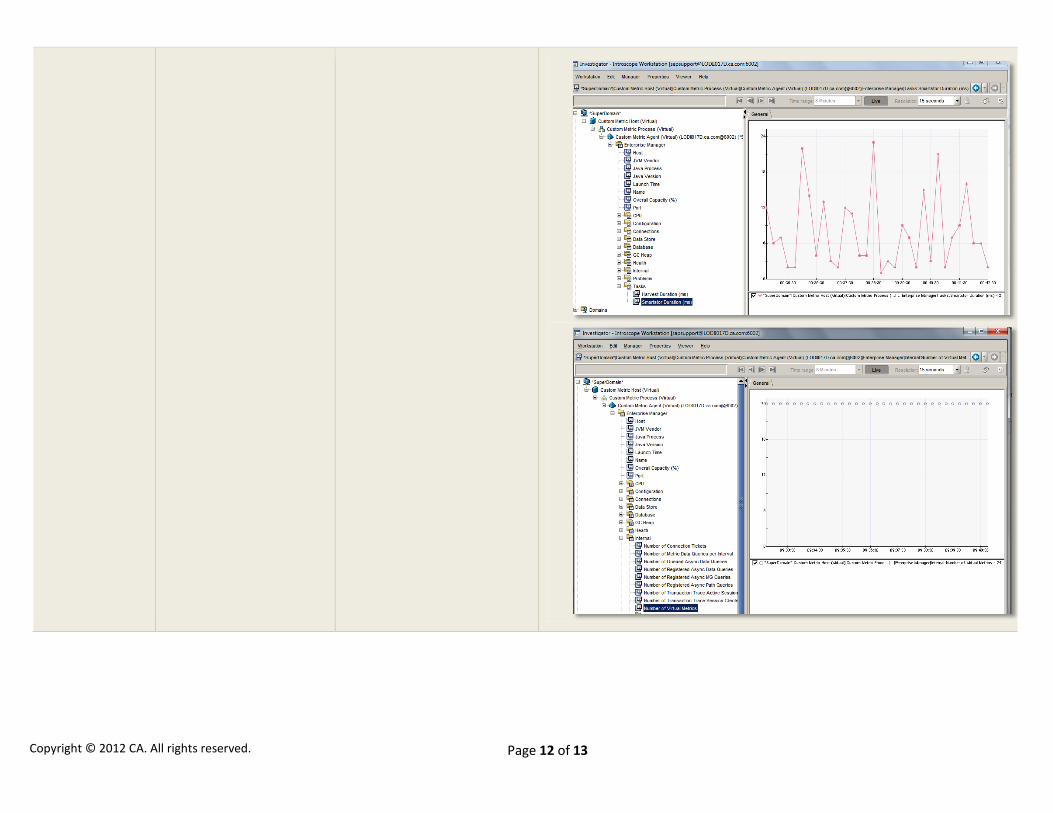
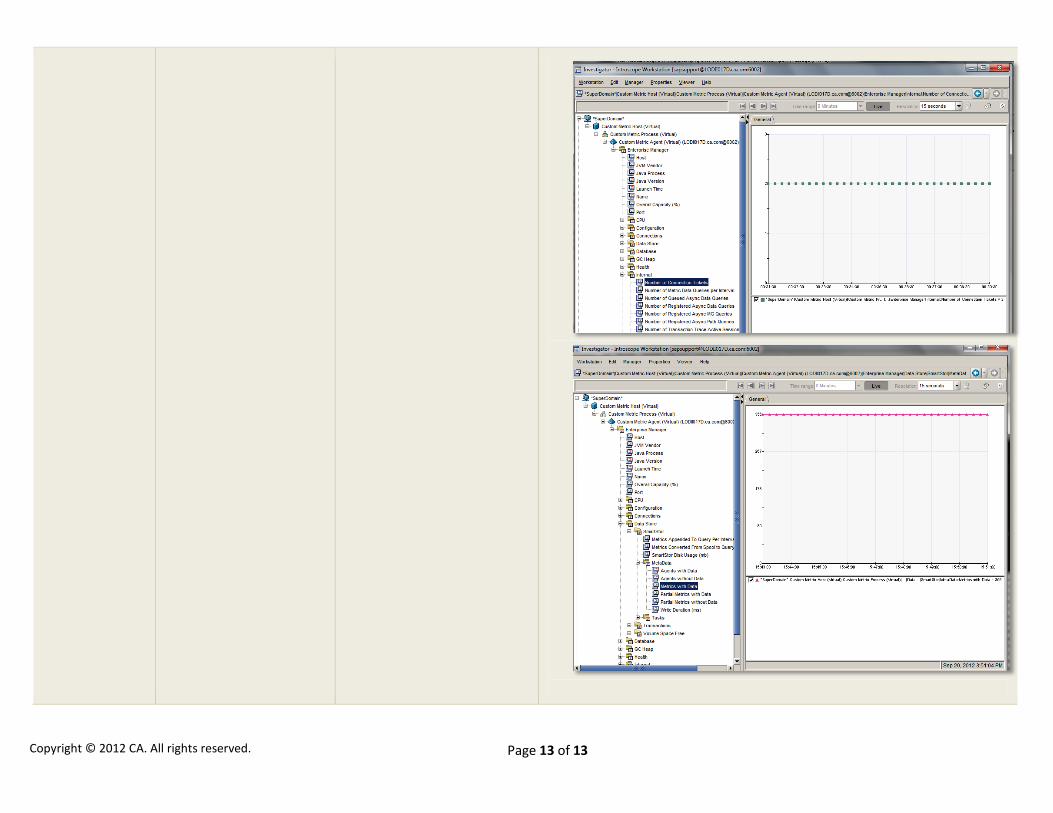
4. Screenshot of Enterprise Manager | Data Store | Smartstor | Metadata | Metrics with Data” supportability metric from all Collectors
1. Zipped content of EM_HOME\logs 2. This screenshot of the directory listing shows the files you need to submit to CA
Technologies Support
3. EM_HOME\config\agentclusters.xml – helps confirm if there are virtual agents defined.
4. Please list hardware specs of the servers and a general overview of your implementation
indicating the location of the collectors and MOM. 5. Screenshot of the "Enterprise Manager | Data Store | Smartstor | Metadata | Metrics
with Data” supportability metric from all Collectors.
Page 10 of 13
Copyright © 2012 CA. All rights reserved.
Page 11 of 13
Copyright © 2012 CA. All rights reserved.
Page 12 of 13
Copyright © 2012 CA. All rights reserved.
Page 13 of 13
Copyright © 2012 CA. All rights reserved.