enterprise performance management (epm) - pwc india · enterprise performance management (epm) ......
TRANSCRIPT
Enterprise performance management (EPM)Driving finance effectiveness
www.pwc.com/india
October 2012 Introductionp3/EPM for the 21st century CFOp4/Planning for successp10/Finance consolidation - achieving efficiencies through EPM solutionsp14/Driving financial performance through spend analyticsp19/ XBRL for business reportingp21

Enterprise performance management (EPM) 3
Preface
The profile of the Chief Financial Officer (CFO) has changed immeasurably in the last decade. While much has been written about the new expectations from the CFO to be an effective business partner and a change catalyst, the reality on the ground is that most finance functions feel overworked and substantially handicapped on their efficiency index.
In last few years, advancement of technology has been significant, especially for the office of the CFO. But the perfect harmony of an optimised process balanced with an apt scalable technology infrastructure has often remained an unfulfilled dream. Enterprise performance management (EPM) framework provides that bridge between process and technology to drive performance.
While the cult of EPM has existed for several years, it is only in the recent times, that there is a focussed attention towards leveraging the framework for tangible corporate gains. In our view, EPM comprises the following discrete, yet overlapping layers of attributes:
1. Business strategy formulation and identification of KPIs to measure performance to link up to the strategy
2. Planning, budgeting and forecasting
3. Financial consolidation for uniform business performance analysis
4. Advanced analytics for key business drivers
This publication attempts to identify the current challenges in EPM implementation for these attributes and how the finance communities are trying to scale up. We have shared relevant best practices and industry learnings to provide a “hands on” view of EPM for the actual users in the finance teams.
As it is true for any framework, the application of knowledge is what differentiates the winners from the laggards. The post-recession world will have new sets of demands on the CFOs with intense focus on measurement and delivery. Application of EPM in real life will be a key differentiating factor to decide the efficiency and effectiveness of the finance function.
Rajiv MundhraPresident - Indian Chamber of Commerce
Ambarish DasguptaExecutive Director/Partner and Consulting Leader - PwC India
4 ICC - PwC
EPM for the 21st century CFOTools, techniques and trends
The term CFO (Chief Finance Officer) is more of an anachronism in the 21st century. Gone are the days when the responsibility was only to prepare the statutory financial reports and play the role of a bookkeeper for the organisation. The expectation now is to play the role of a strategic advisor to the board and be the custodian of the enterprise performance management (EPM).
EPM is about ensuring that the organisation is translating its strategy into measurable indicators and targets and monitoring its performance. It also means that there is an effective people alignment across the enterprise where the individual key result areas (KRAs) are aligned with the corporate objectives. Moreover, the reward and recognition mechanism encourages behaviours, which directly contribute to the overall strategy of the organisation in a direct or indirect manner. This ensures that the organisation runs like a well-oiled machine where every part of the same is contributing to the overall success.
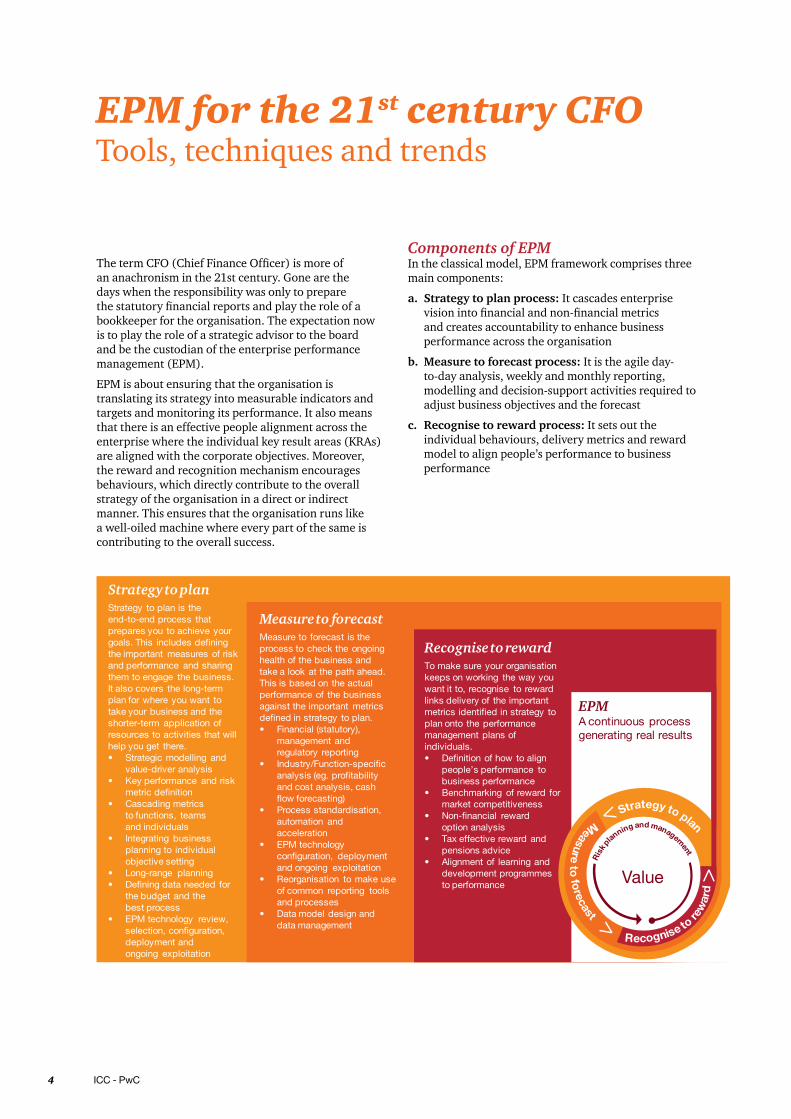
Components of EPMIn the classical model, EPM framework comprises three main components:
a. Strategy to plan process: It cascades enterprise vision into financial and non-financial metrics and creates accountability to enhance business performance across the organisation
b. Measure to forecast process: It is the agile day- to-day analysis, weekly and monthly reporting, modelling and decision-support activities required to adjust business objectives and the forecast
c. Recognise to reward process: It sets out the individual behaviours, delivery metrics and reward model to align people’s performance to business performance
Enterprise performance management (EPM) 5
EPM for the 21st century CFOTools, techniques and trends
Implementing an EPM framework Implementing an EPM framework requires a focus on some of the key areas such as:
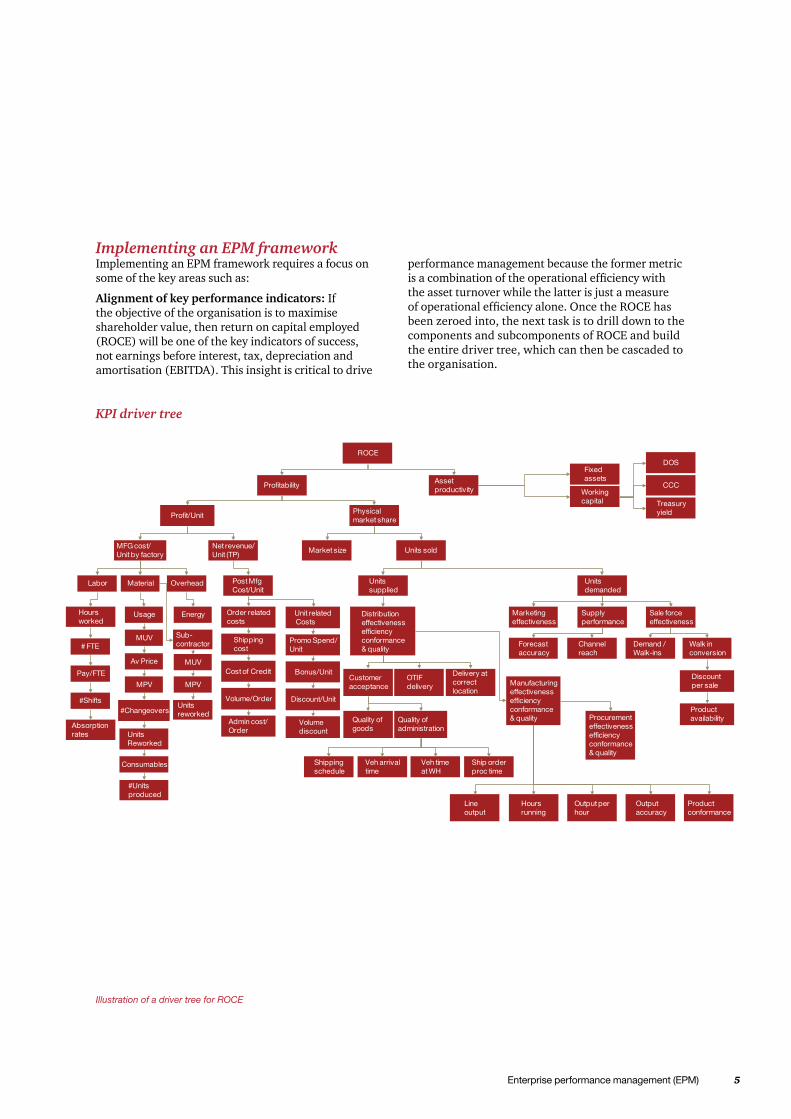
Alignment of key performance indicators: If the objective of the organisation is to maximise shareholder value, then return on capital employed (ROCE) will be one of the key indicators of success, not earnings before interest, tax, depreciation and amortisation (EBITDA). This insight is critical to drive
KPI driver tree
Illustration of a driver tree for ROCE
performance management because the former metric is a combination of the operational efficiency with the asset turnover while the latter is just a measure of operational efficiency alone. Once the ROCE has been zeroed into, the next task is to drill down to the components and subcomponents of ROCE and build the entire driver tree, which can then be cascaded to the organisation.
6 ICC - PwC
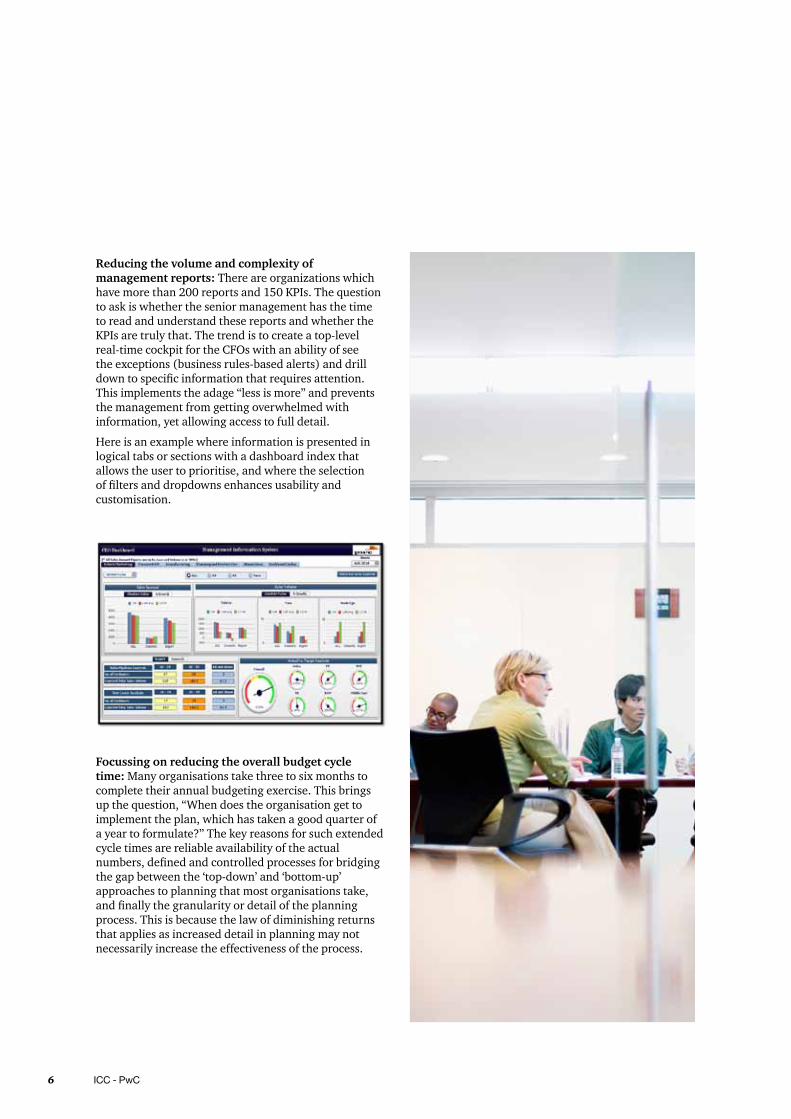
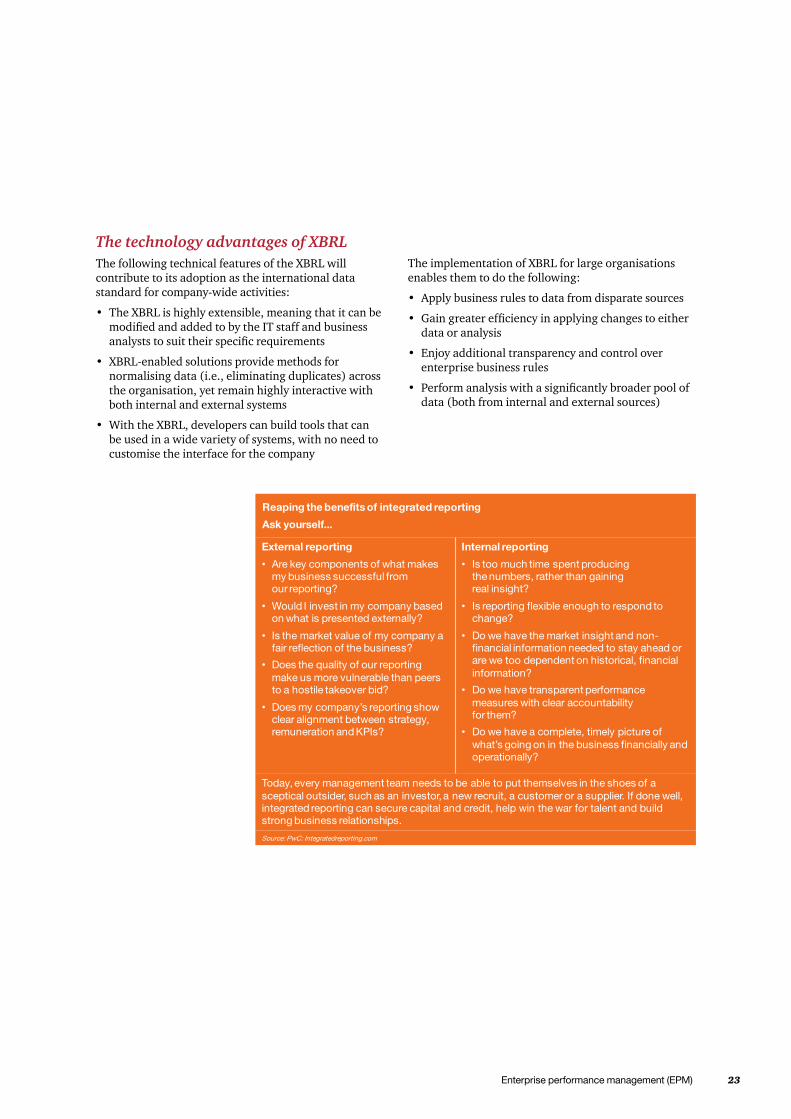
Reducing the volume and complexity of management reports: There are organizations which have more than 200 reports and 150 KPIs. The question to ask is whether the senior management has the time to read and understand these reports and whether the KPIs are truly that. The trend is to create a top-level real-time cockpit for the CFOs with an ability of see the exceptions (business rules-based alerts) and drill down to specific information that requires attention. This implements the adage “less is more” and prevents the management from getting overwhelmed with information, yet allowing access to full detail.
Here is an example where information is presented in logical tabs or sections with a dashboard index that allows the user to prioritise, and where the selection of filters and dropdowns enhances usability and customisation.
Focussing on reducing the overall budget cycle time: Many organisations take three to six months to complete their annual budgeting exercise. This brings up the question, “When does the organisation get to implement the plan, which has taken a good quarter of a year to formulate?” The key reasons for such extended cycle times are reliable availability of the actual numbers, defined and controlled processes for bridging the gap between the ‘top-down’ and ‘bottom-up’ approaches to planning that most organisations take, and finally the granularity or detail of the planning process. This is because the law of diminishing returns that applies as increased detail in planning may not necessarily increase the effectiveness of the process.

Enterprise performance management (EPM) 7
Approximately how much time does it currently take your company to prepare its budget?
Findings of the survey conducted by CFO research services and PwC in 2011
Approximately how long does it take your company to generate a forecast?
A joined up planning process
Creating a plan at the beginning of each year may soon become an academic exercise if rolling forecasts are not embedded into the process. The variance analysis will not truly reveal the root cause of the focus area and can only result in incorrect conclusions. The ability to do driver-based planning using non-financial or leading indicators like customer satisfaction and complaints for forecasting sales and external data inputs, like future cost of commodities for forecasting raw material costs, becomes an integral part of such rolling plans.
The advancements in technology by way of automated planning workflow tools, easier bottom-up data availability by means of automated templates and intuitive dashboards and reports with focus on causes of variance are some of the key enablers for making this a reality. A holistic and inter-related process which links corporate objectives to KPIs and then closes the feedback loop by accurately reporting the data and links it to individual objectives provides the necessary platform for improving the effectiveness and efficiency of the planning process.
Understanding the business and increasing the accuracy of the plan numbers: Benchmarks confirm that there is an opportunity to generate considerable value by making the planning process more accurate. An empirical study by PwC suggested that for companies with a forecasting accuracy of +/- 5% or more, shareholder value increased by 46% in the last three years as opposed to just 36% increase for the rest. At the heart of the accuracy lies the sanctity of the assumptions and the model used for deriving the plan values. An important aspect of this model is the use of non-financial KPIs and external information which is still not very widely used as an integral part of the planning process.

8 ICC - PwC
External market information, not internal data, is most likely to improve the quality of forecasts
In your opinion, which of the following factors are most likely to lead to variances between forecasts and actual performance at your company?
Shifting focus from mere compliance to true leadership: No other office embodies this change in the imperative more than the office of the CFO. The trend is to make your annual reports and disclosures ‘compelling’ and not just ‘compliant’. The need of the hour is to provide the answers to the ‘whys’ and ‘what-ifs’ and not just of ‘whats’ and ‘hows’. This is where drawing analysis and insight from the data becomes truly important. Investments in the state-of-the-art ERP and other transactional systems are efficient in capturing transactions so that organisations can prepare even daily balance sheets and profit-and-loss account statements if they want to.
However, the challenge lies in understanding the reasons behind these numbers. Financial analytics starting from procurement analytics to cost of production and subsequently to cost of distribution is the key focus for understanding the drivers of cost and for optimising it. This also requires capturing external data (like inflation, taxation changes, future prices of commodities, transportation cost changes) and embedding them with the internal cost data (like production costs, storage costs, overheads) to arrive at strategic decisions (like buy vs. build decisions, production and warehouse location, contract management) along with operational decisions (like raw material mix optimisation, balancing distribution
vs. inventory carrying costs) to decide which products to focus on.
Building a smart and efficient financial close to report (C2R) cycle: Externally, stakeholders and regulators demand more transparent and reliable information in less time. Internally, business leaders require fast and accurate information to support smart, informed business decisions. This requires organisations to do the following:
• Improve accountability and control throughout the cycle: Technology as an enabler can play a big role in providing Web-based workflow and collaboration tools, which automate manual activity and provide centralised access to the documents
• Simplify and standardise processes to eliminate complexity and inconsistencies: Usually the time spent in reconciliation and format changes of the data can be addressed by defining the data lineage and doing away with multiple versions and formats of the same report
• Enhance effectiveness by assigning clear roles, measuring effectively and linking them with the reward cycle: It is important to define the roles of other supporting functions like legal, treasury, IT and investor relations with specific activities and clear due dates for completion and approval
Findings of the survey conducted by CFO research services and PwC in 2011

Enterprise performance management (EPM) 9
Harvesting the investments in process and IT changes: The onus is on the finance function to keep an eye on realising the benefits of the investments in ERP and other technologies. In a recent benchmark study conducted by PwC among the Indian CFOs (State of Finance function in India – 2010), it became evident that transactional costs have increased particularly for average performing finance functions, whose transactional costs are 40% higher than their top quartile counterparts. Standardisation and automation are not merely finance subjects, but are pervasive across the organisation’s value chain. However, there is a danger in focussing on point solutions rather than achieving sustainable performance improvement.
Many organisations have embraced the above trends and aligned their processes with technological enablement to improve the effectiveness of the finance function. Instead of just depending on spreadsheets for doing the planning and forecasting, organisations are investing in robust planning tools which not only provide a reliable workflow with an audit trail, but also provide abilities for driver-based what-if analysis and scenario planning.
Advancements in data storage and reporting technologies have enabled organisations to have one consistent version of the truth available centrally so that manual reconciliations between multiple spreadsheets can be eliminated.
More time is available now for analysis of the data using intuitive visualisation techniques on a real-time basis rather than just collecting and reconciling data. Advancements in the mode of information dissemination includes use of handheld devices like smartphones and iPads for not only participating actively in the planning and budgeting process, but also for receiving timely alerts and dashboards to derive insights from the data.
Data mining technologies now enable organisations to prepare causal and predictive models which look at leading or forward-looking indicators in order to increase the effectiveness of the planning process. Concepts on big data analytics are helping organisations make sense of both structured and unstructured content generated either inside or external to the organisation in order to understand customer trends, competitive dynamics, vendor behaviour, production and supply chain efficiency.
From being a custodian of the bookkeeping requirements in the 19th century to cementing its status and influence over the course of recessionary periods in the early 20th century, the role of the finance function has now evolved in the early 21st century to deliver business insights. Organisations are navigating themselves against ever-complex regulatory and competitive forces and have to grapple with potentially disruptive technological innovations. The 21st century CFO needs to rise to the occasion and perform the ‘business partnering’ role now expected by many CEOs.
10 ICC - PwC
Planning for success
The financial crisis provided an acid test for the effectiveness of planning capabilities. Smart businesses saw the warnings and responded quickly, while others were caught unawares. Bringing planning capabilities up to the mark is going to be equally important in anticipating and making the most of the opportunities ahead.
Some insightsWe recently published the annual benchmark report, which outlines the latest findings of our benchmark analysis of more than 200 participating companies. The report includes an in-depth comparative assessment of the finance functions of 72 companies with operations around the world, which were carried out between January and December 2011.
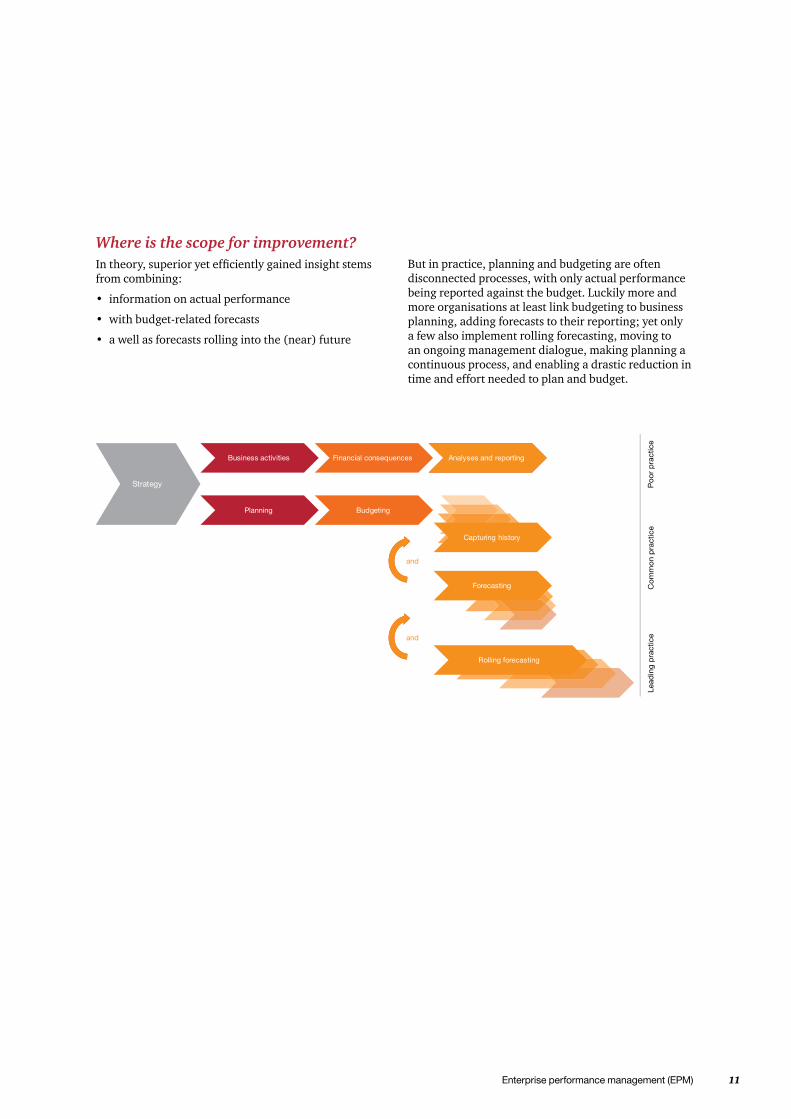
While 80% of benchmark participants rely on the accuracy of their forecasts, only 45% believe they are materially correct. At 120 elapsed days for budgets and 19 days for forecasts, the typical cycle times are also far too long to have much validity in today’s fluctuating conditions (see figure below). The more agile businesses are concentrating on the key business drivers (top-down) rather than spending time building budgets from the bottom up. Cash flow projections and scenario analysis are often an integral part of these forecasts, highlighting the increased emphasis on risk factors and probability of outcomes.
Budgeting and forecasting cycle (days)
Other key findings from that report are as follows:
• Historical weaknesses in the budgeting and forecasting process persist, limiting the perceived value of the financial planning process within the organization
• Business changes and uncertainty are leading factors cited as causes for planning variability from actual performance
• Extensive detail in account planning often extends planning cycle times, making the information dated by the time the outputs are finalised
• The concept of continuous forecasting based on changing business conditions (versus predetermined monthly or quarterly projections) is hitting the right chords both with finance and operations
• Rolling forecasts are no longer an emerging trend but becoming an established leading practice, extending the forecasting horizon to rolling quarters beyond year-end to provide additional visibility
• Increasing forecasting accuracy is on top of the improvement agenda; however it remains an elusive target for many
• There is an increased need to link sales and operational planning activities and outputs with the financial planning process
• Best-of-breed financial planning applications can significantly improve the overall planning process and reduce manual planning activities and disparate spreadsheets
Enterprise performance management (EPM) 11
Planning for success
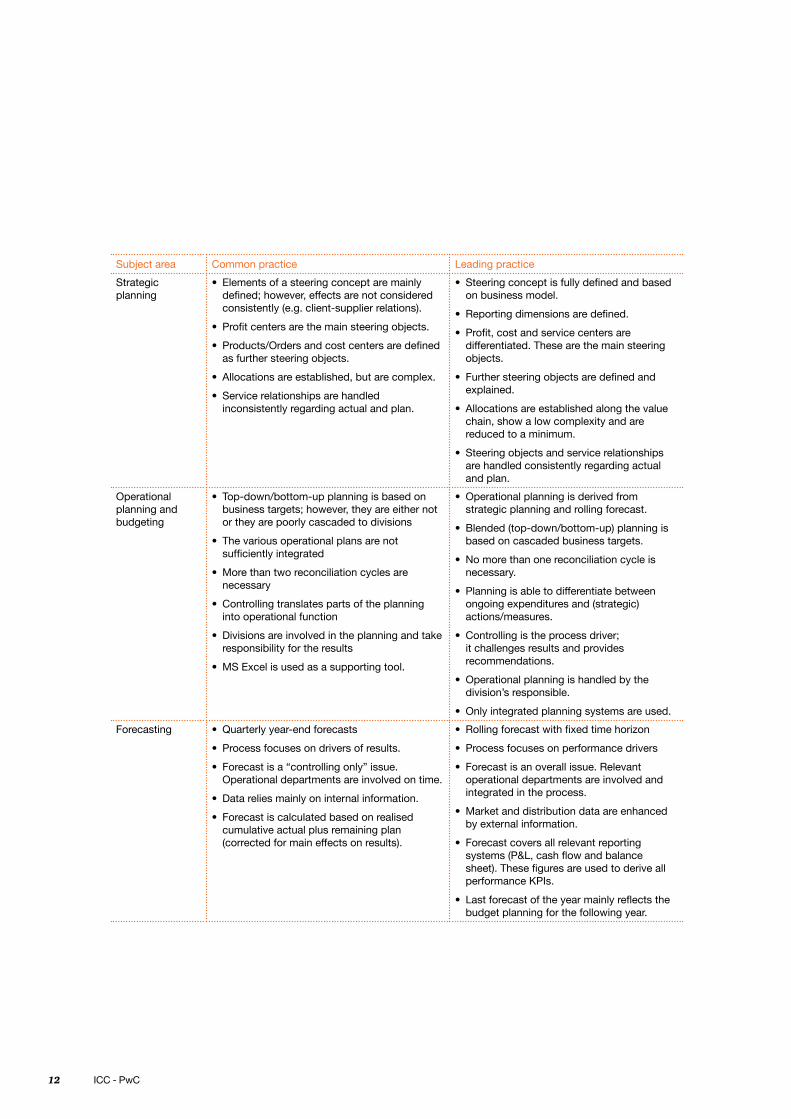
Where is the scope for improvement?In theory, superior yet efficiently gained insight stems from combining:
• information on actual performance
• with budget-related forecasts
• a well as forecasts rolling into the (near) future
But in practice, planning and budgeting are often disconnected processes, with only actual performance being reported against the budget. Luckily more and more organisations at least link budgeting to business planning, adding forecasts to their reporting; yet only a few also implement rolling forecasting, moving to an ongoing management dialogue, making planning a continuous process, and enabling a drastic reduction in time and effort needed to plan and budget.
12 ICC - PwC
Subject area Common practice Leading practice
Strategic planning
• Elements of a steering concept are mainly defined;however,effectsarenotconsideredconsistently (e.g. client-supplier relations).
• Profitcentersarethemainsteeringobjects.
• Products/Ordersandcostcentersaredefinedasfurthersteeringobjects.
• Allocationsareestablished,butarecomplex.
• Servicerelationshipsarehandledinconsistently regarding actual and plan.
• Steeringconceptisfullydefinedandbasedon business model.
• Reportingdimensionsaredefined.
• Profit,costandservicecentersaredifferentiated.Thesearethemainsteeringobjects.
• Furthersteeringobjectsaredefinedandexplained.
• Allocationsareestablishedalongthevaluechain,showalowcomplexityandarereduced to a minimum.
• Steeringobjectsandservicerelationshipsarehandledconsistentlyregardingactualand plan.
Operational planning and budgeting
• Top-down/bottom-up planning is based on businesstargets;however,theyareeithernotortheyarepoorlycascadedtodivisions
• Thevariousoperationalplansarenotsufficientlyintegrated
• Morethantworeconciliationcyclesarenecessary
• Controllingtranslatespartsoftheplanninginto operational function
• Divisionsareinvolvedintheplanningandtakeresponsibilityfortheresults
• MSExcelisusedasasupportingtool.
• Operationalplanningisderivedfromstrategic planning and rolling forecast.
• Blended (top-down/bottom-up) planning is based on cascaded business targets.
• Nomorethanonereconciliationcycleisnecessary.
• Planning is able to differentiate between ongoingexpendituresand(strategic)actions/measures.
• Controllingistheprocessdriver;itchallengesresultsandprovidesrecommendations.
• Operationalplanningishandledbythedivision’sresponsible.
• Only integrated planning systems are used.
Forecasting • Quarterly year-end forecasts
• Processfocusesondriversofresults.
• Forecast is a “controlling only” issue. Operationaldepartmentsareinvolvedontime.
• Data relies mainly on internal information.
• Forecast is calculated based on realised cumulativeactualplusremainingplan(corrected for main effects on results).
• Rollingforecastwithfixedtimehorizon
• Processfocusesonperformancedrivers
• Forecastisanoverallissue.Relevantoperationaldepartmentsareinvolvedandintegratedintheprocess.
• Marketanddistributiondataareenhancedbyexternalinformation.
• Forecastcoversallrelevantreportingsystems(P&L,cashflowandbalancesheet).Thesefiguresareusedtoderiveallperformance KPIs.
• Lastforecastoftheyearmainlyreflectsthebudgetplanningforthefollowingyear.
Enterprise performance management (EPM) 13
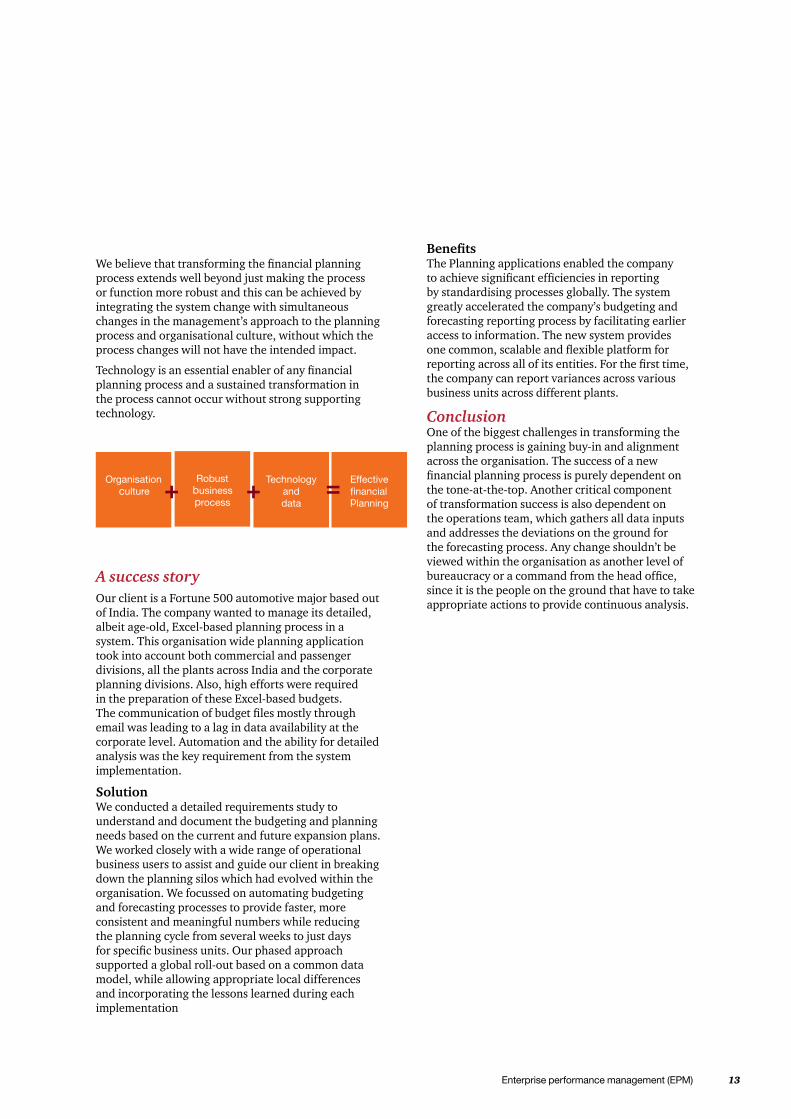
We believe that transforming the financial planning process extends well beyond just making the process or function more robust and this can be achieved by integrating the system change with simultaneous changes in the management’s approach to the planning process and organisational culture, without which the process changes will not have the intended impact.
Technology is an essential enabler of any financial planning process and a sustained transformation in the process cannot occur without strong supporting technology.
A success story Our client is a Fortune 500 automotive major based out of India. The company wanted to manage its detailed, albeit age-old, Excel-based planning process in a system. This organisation wide planning application took into account both commercial and passenger divisions, all the plants across India and the corporate planning divisions. Also, high efforts were required in the preparation of these Excel-based budgets. The communication of budget files mostly through email was leading to a lag in data availability at the corporate level. Automation and the ability for detailed analysis was the key requirement from the system implementation.
SolutionWe conducted a detailed requirements study to understand and document the budgeting and planning needs based on the current and future expansion plans. We worked closely with a wide range of operational business users to assist and guide our client in breaking down the planning silos which had evolved within the organisation. We focussed on automating budgeting and forecasting processes to provide faster, more consistent and meaningful numbers while reducing the planning cycle from several weeks to just days for specific business units. Our phased approach supported a global roll-out based on a common data model, while allowing appropriate local differences and incorporating the lessons learned during each implementation
BenefitsThe Planning applications enabled the company to achieve significant efficiencies in reporting by standardising processes globally. The system greatly accelerated the company’s budgeting and forecasting reporting process by facilitating earlier access to information. The new system provides one common, scalable and flexible platform for reporting across all of its entities. For the first time, the company can report variances across various business units across different plants.
ConclusionOne of the biggest challenges in transforming the planning process is gaining buy-in and alignment across the organisation. The success of a new financial planning process is purely dependent on the tone-at-the-top. Another critical component of transformation success is also dependent on the operations team, which gathers all data inputs and addresses the deviations on the ground for the forecasting process. Any change shouldn’t be viewed within the organisation as another level of bureaucracy or a command from the head office, since it is the people on the ground that have to take appropriate actions to provide continuous analysis.
14 ICC - PwC
Finance consolidation - achieving efficiencies through EPM solutionsThe world of the CFO has changed beyond recognition in the last two decades. From being a custodian of financial numbers, the CFO is now increasingly being considered as a valued business partner, who shapes the business strategies and works closely with the CEO to drive enterprise priorities. The average CFO today gets to spend far less time on his routine finance and accounting processes than his predecessors. He has to often assume an ambidextrous role between his stewardship responsibilities towards finance and strategist responsibilities towards the business.
In a recent CFO survey we conducted, 30% of the CFOs surveyed in India recognised ‘building the capability to provide business insights’ as a key focus area for the next 12 months. However, the finance function is still trying to come to terms with its new role as the business partner. The surveys indicate this dilemma through the following statistics:
• 63% of respondents indicated that they have a finance team of more than 25 people
• However, 48% of these teams have less than five people dedicated to business partnering and decision support roles
• 58% of the respondents also indicated that their finance team spends less than 20% of its time on value-added analysis and planning and its time is consumed to a large extent by data crunching and manual routines
There is a clear mismatch between the expectations and enablers in the finance teams. Organisations around the world are increasingly realising the need to meet this gap through a host of initiatives and interventions such as process reengineering, technology innovations and shared service, and outsourcing of transactional functions.
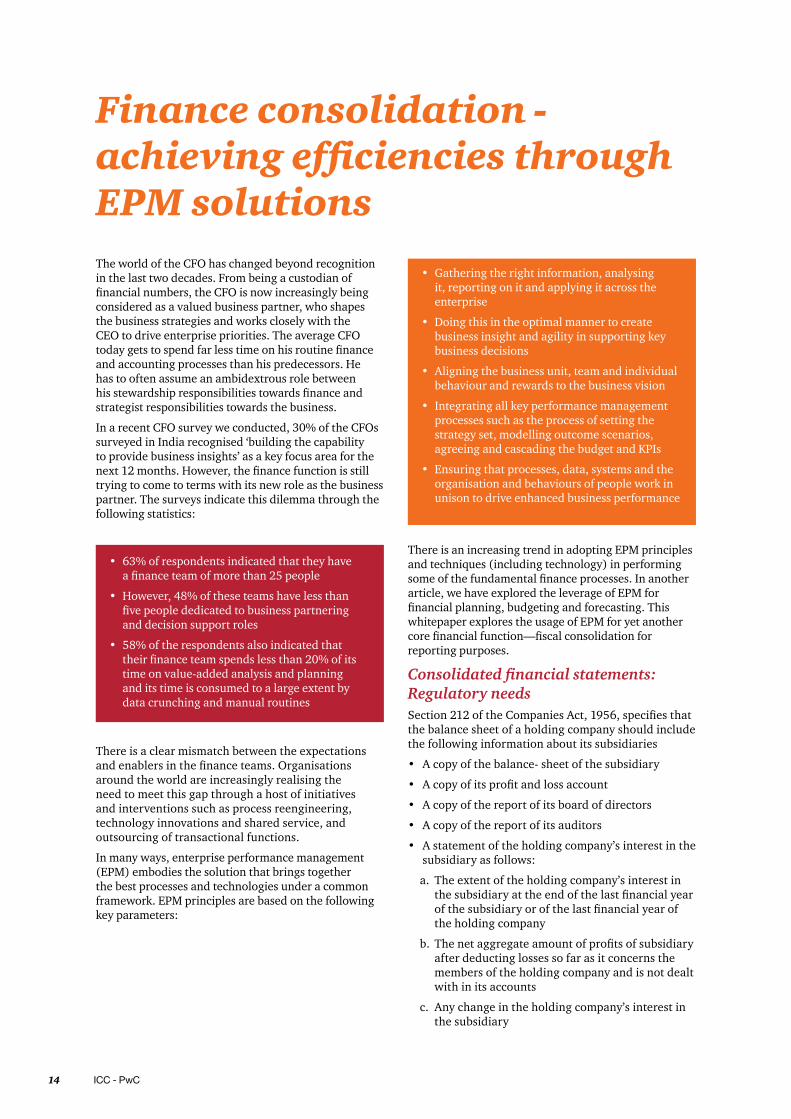
In many ways, enterprise performance management (EPM) embodies the solution that brings together the best processes and technologies under a common framework. EPM principles are based on the following key parameters:
• Gathering the right information, analysing it, reporting on it and applying it across the enterprise
• Doing this in the optimal manner to create business insight and agility in supporting key business decisions
• Aligning the business unit, team and individual behaviour and rewards to the business vision
• Integrating all key performance management processes such as the process of setting the strategy set, modelling outcome scenarios, agreeing and cascading the budget and KPIs
• Ensuring that processes, data, systems and the organisation and behaviours of people work in unison to drive enhanced business performance
There is an increasing trend in adopting EPM principles and techniques (including technology) in performing some of the fundamental finance processes. In another article, we have explored the leverage of EPM for financial planning, budgeting and forecasting. This whitepaper explores the usage of EPM for yet another core financial function—fiscal consolidation for reporting purposes.
Consolidated financial statements: Regulatory needsSection 212 of the Companies Act, 1956, specifies that the balance sheet of a holding company should include the following information about its subsidiaries
• A copy of the balance- sheet of the subsidiary
• A copy of its profit and loss account
• A copy of the report of its board of directors
• A copy of the report of its auditors
• A statement of the holding company’s interest in the subsidiary as follows:
a. The extent of the holding company’s interest in the subsidiary at the end of the last financial year of the subsidiary or of the last financial year of the holding company
b. The net aggregate amount of profits of subsidiary after deducting losses so far as it concerns the members of the holding company and is not dealt with in its accounts
c. Any change in the holding company’s interest in the subsidiary
Enterprise performance management (EPM) 15
The Indian Accounting Standards 14 (Amalgamations) and 21 (Consolidation of Financial Statements) lay down the basic accounting foundation of finance consolidation. In addition, the IASB has recently issued IFRS 10 - Consolidated Financial Statements, which establishes principles for the presentation and preparation of consolidated financial statements when an entity controls one or more other entities. The IFRS 10 builds on existing principles by identifying the concept of control as the factor that determines whether an entity should be included within the consolidated financial statement of the parent company.
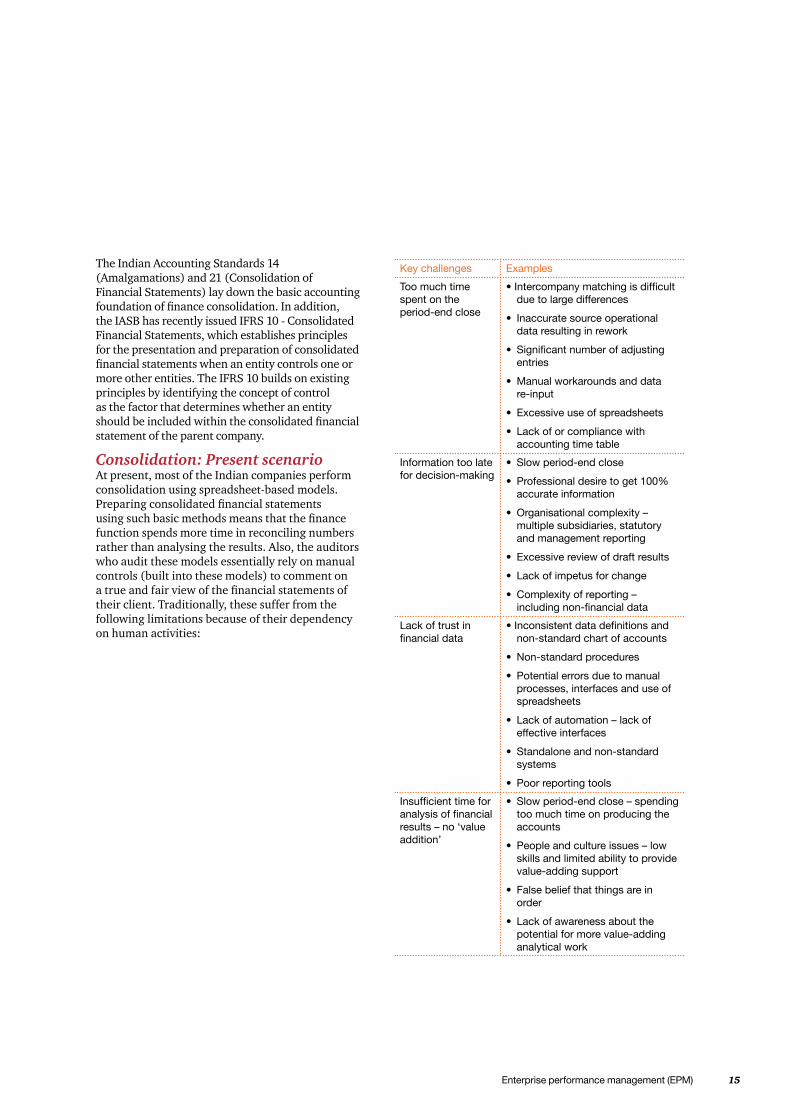
Consolidation: Present scenarioAt present, most of the Indian companies perform consolidation using spreadsheet-based models. Preparing consolidated financial statements using such basic methods means that the finance function spends more time in reconciling numbers rather than analysing the results. Also, the auditors who audit these models essentially rely on manual controls (built into these models) to comment on a true and fair view of the financial statements of their client. Traditionally, these suffer from the following limitations because of their dependency on human activities:
Keychallenges Examples
Toomuchtimespentontheperiod-end close
•Intercompanymatchingisdifficultdue to large differences
• Inaccurate source operational dataresultinginrework
• Significantnumberofadjustingentries
• Manualworkaroundsanddatare-input
• Excessiveuseofspreadsheets
• Lackoforcompliancewithaccounting time table
Information too late fordecision-making
• Slow period-end close
• Professional desire to get 100% accurate information
• Organisationalcomplexity–multiplesubsidiaries,statutoryand management reporting
• Excessivereviewofdraftresults
• Lackofimpetusforchange
• Complexityofreporting–includingnon-financialdata
Lackoftrustinfinancialdata
•Inconsistentdatadefinitionsandnon-standardchartofaccounts
• Non-standard procedures
• Potential errors due to manual processes,interfacesanduseofspreadsheets
• Lackofautomation–lackofeffectiveinterfaces
• Standalone and non-standard systems
• Poor reporting tools
Insufficienttimeforanalysisoffinancialresults–no‘valueaddition’
• Slowperiod-endclose–spendingtoomuchtimeonproducingtheaccounts
• Peopleandcultureissues–lowskillsandlimitedabilitytoprovidevalue-addingsupport
• Falsebeliefthatthingsareinorder
• Lackofawarenessaboutthepotentialformorevalue-addinganalyticalwork
16 ICC - PwC
EPM solutions for financial consolidation To help overcome these challenges, finance functions are focussing on a mix of process improvements and technology innovations to reduce cycle time, improve controls and analytics and drive down costs. In the following section we have discussed the standard features and benefits of implementing automation solutions with process reengineering. It may be pertinent to note that there are several IT solutions available in the market and the selection of the best fitment option should be done by weighing in all the relevant parameters, qualitative and quantitative.
Key features of an automated consolidation solution:Intercompany reconciliation is the biggest challenge in any consolidation process. These specialised solutions allow counterparty-wise inter-company transactions to be entered at the individual entity level. Counterparty input can be viewed online to resolve differences immediately. The ability to enter the original transaction currency (such as the invoicing currency) helps distinguish currency differences from real differences. Real differences are automatically eliminated from predefined accounts. Differences can be posted to accounts receivable or accounts payable as required. Intercompany elimination is carried out in stages, regardless of consolidation structure, with all transactions handled at the point of origin.
Consolidation tools support all currency conversion methods. It translates data in a foreign currency into the group’s default currency using predefined rates. Consequent translation effects are calculated automatically and reported in detail.
Such solutions support all methods of capital consolidation and can perform staged eliminations in legal or management structures. After entering the investment value at the individual holding company level and entering relevant acquisition data, share capital is automatically eliminated. Goodwill is written off and can be booked to the individual company as required. The development of reserves, such as the identification of and changes in any impact of currency movements on the initial consolidation, can be reconciled at any time.
These solutions have built-in intelligence options to accommodate changes such as mergers, acquisitions and reorganisations. Structure and business rule updates are made but once, and are then reflected throughout the application, supporting statutory consolidation, management consolidation, planning, monitoring and strategy management.
Changes to entity structures can be saved with a time stamp. By linking entity structures to a time axis, structural changes can be easily carried out, enabling users to follow development in the group structure. If a company is bought or sold either internally or externally, relevant postings like acquisition or adjustment of opening balance are automatically carried out according to previously defined system configuration. The treatment of foreign currency effects is included.
Consolidation solutions help users translate corporate objectives and visions into concrete financial and tactical plans. Managers can quickly model and assess the impact of alternative business scenarios. With global targets and key drivers, initiatives can be modelled or simulated by entity, business area, product or customer. Simulations are possible for all legal, operative, planning or forecast scenarios, enabling detailed ‘what-if’ analyses. Currency-adjusted analysis is also supported. Consolidating actual data at budget rates or using various currency rates is simple to set up and requires no additional data capture. Financial information from consolidation solutions automatically feeds the enterprise-planning process, establishing an initial base for a plan or updates a plan with the latest actual to facilitate a reliable rolling forecast.
By providing access to accurate data, reports and analyses, such solutions help compress cycle times and meet increasingly stringent reporting requirements. Different users have different analytical needs. For financial analysts and those responsible for the close process that need access to financial data quickly, these tools offer readily configurable, out-of-the-box reports.
Consolidation solutions have built-in validation processes, which reduce lead times and ensure data consistency. Once entry or upload is complete, data is readily reconciled for accuracy, while users are immediately notified of inconsistencies. Monitoring is vital to the performance management process. Users can monitor and analyse results, identify shifts in trends, model alternative plans and take timely action.
Successful performance management demands a single view of reality under multiple GAAPs: consolidated actual, consolidated budgets, forecasts and plans. Consolidated management data that fails to stand up to scrutiny alongside consolidated plans forms a weak base for future decision-making. But a reliable view of current conditions, based on a clear link between statutory and management consolidation provides a firm foundation for both operational decisions and strategic action.

Enterprise performance management (EPM) 17
These solutions handle all the process and control steps necessary to gather financial information from multiple sources and systems. Both quantitative and qualitative data may be entered automatically or manually in specialised solutions. Financial data may be collected and presented in multiple reporting and transaction currencies. Some of the solutions support users can attach documents to reported figures to broaden perspectives beyond quantitative information; text notes and reporting manuals can be collected to explain the reported information and facilitate its analysis. This is one of the key benefits and helps the finance team to gain more comfort through the controls established by organisations.
Getting the right process solution:Reducing the time to consolidate is not just a tool-driven but also process-driven exercise. Some of the key process challenges in financial consolidation that a robust EPM framework attempts to overcome are as follows:
• One of the fundamental obstacles to a smooth consolidation process is the lack of homogeneous chart of accounts (CoA) across the holding and subsidiary organisations. As a result, comparison of data becomes difficult as the underlying account codes are non-standard and not aggregated. While standardisation of CoA is a desirable option, many organisations find it difficult to evolve to a single CoA in a timely manner. Implementing an automation solution in such cases needs a complex mapping of the HQ reporting accounts to the subsidiary accounts to consistently permit aggregations and eliminations
• Unavailability of data can cause delays in the closing process and there could be many cases where the sub-systems data may not be available at the expected levels of granularity. Putting the right data capture process in place first is a key consideration before implementing a consolidated solution
• Increased use of estimation can raise audit and reliability risks due to the demands of a faster closing process. It is essential to define an estimation and accrual process that draws upon the past trends and actual incidence and restricts the use of judgement for estimations
• Conversion of historical data is always a challenge in implementing a new tech solution, and for a consolidation solution in particular, this assumes importance due to the needs for prior period. reporting (including segment reporting) for regulatory purposes
• Identifying the right users for training and ensuring that the training covers process optimisations and subsequent technology changes is another challenge. In most cases, EPM solutions require a significant change management effort from the finance function and having robust training materials is a great starting point
A case study The client is the Indian arm of a global conglomerate with multiple business units in heavy manufacturing verticals. While individual businesses reported their financial numbers to their corporate headquarters both for management and statutory reporting, there was no system available for a country-level consolidated reporting. With a change in the reporting structure and creation of country-level management authority, the need for having a consolidated country-level profit and loss statement for management and statutory reporting evolved. As a part of the engagement, the client requested us to carry out the following tasks:
• Assess the readiness of its businesses for the above mentioned India-level consolidated financial statements
• Based on the analysis, suggest a road map to consolidate country-level financial statements for the purpose of management reporting (with relevant details) and statutory reporting
• Suggest and implement a tool that will help in automating the process of consolidating country-level financial statements
SolutionWe, at PwC, applied our EPM framework to assess all the entities and presented the client with areas to make investments, proposed a technical architecture and evaluated the best fit for its consolidation tool. In the course of the assignment, assessment was done across areas like information availability, system maturity and process standardisation. We recommended the use of a consolidated automation solution coupled with process transformations to meet the client’s needs for having a simple, scalable and world-class solution for HQ reporting purposes.
18 ICC - PwC
Benefits• Improved the efficiency and accuracy of management
reporting and steered all businesses towards the common vision
• Provided the management with a view of the consolidated results across 20 business units at levels of granularity that were not possible until then, enabling faster decision-making aided by accurate data points
• Enabled the use of advanced reporting and analytics on the platform of a common reporting solution
• More than 30% reduction in the cycle time for the closing process
Long short storyAs the world of finance evolves in the 21st century and the CFOs are expected to be alert business partners, EPM can act as a powerful toolkit for the CFOs.
The introduction of EPM will lead to a sea change in the efficiency and effectiveness of the finance function and free up time for more value-added work. As a recent PwC survey shows, a strong EPM framework will translate organisational strategy into financial and forward-looking operational performance leading to an improvement of return on capital employed (ROCE). On one hand, the EPM framework improves the ability to accurately predict earnings and reduces variances from budgets. Similarly, it also helps in reducing the financial close cycle through smart consolidation processes and appropriate automation solutions. It makes sense for the CFOs to wake up to discover these benefits and create a plan for adoption in their organisations.
Enterprise performance management (EPM) 19
Driving financial performance through spend analytics
In the present times, organisations are forced to look at their internal processes and programmes as a means of driving value to their overall organisation. Spend analytics has emerged as a viable tool to dig deep into the spend data and utilise it in forecasting future savings and working capital or cash management initiatives and programmes.
A recent Aberdeen research shows spend analytics as a great value to the CFO and his or her finance group as 63% of organisations’ finance teams are using spend analysis.
Historically, spend analytics has been used by the procurement function to drive superior negotiations, key spending patterns and trends. It also helps them to negotiate favourable contracts with their suppliers. However, more of the finance function is nowadays looking to utilise spend analytics as a high-value function.
Spend analytics in financeThe AMR research study suggests that most organisations only capture portions of their spending, which is spread across far too many systems and business processes. The majority of companies today have multiple ERP systems and utilise third-party applications.
Some also generate other non-purchase-order spend. Typically, only the larger data systems are utilised for spend data aggregation.
This murkiness from spend management can easily be removed once proper technologies and processes are deployed. Spend analytics tools provide an effective measure and transparency into the total aggregate spending data, and enriches it with other information for the management to make the right decisions at the right time.
Having the tool though is just one part; the other critical part is the interpretation of the output and information provided by the analytical tool. The organisation must understand what they are viewing and how it impacts their spend strategies. The ‘what-if analysis’ is a critical tool in the hands of the CFOs and, in general, the CXOs.
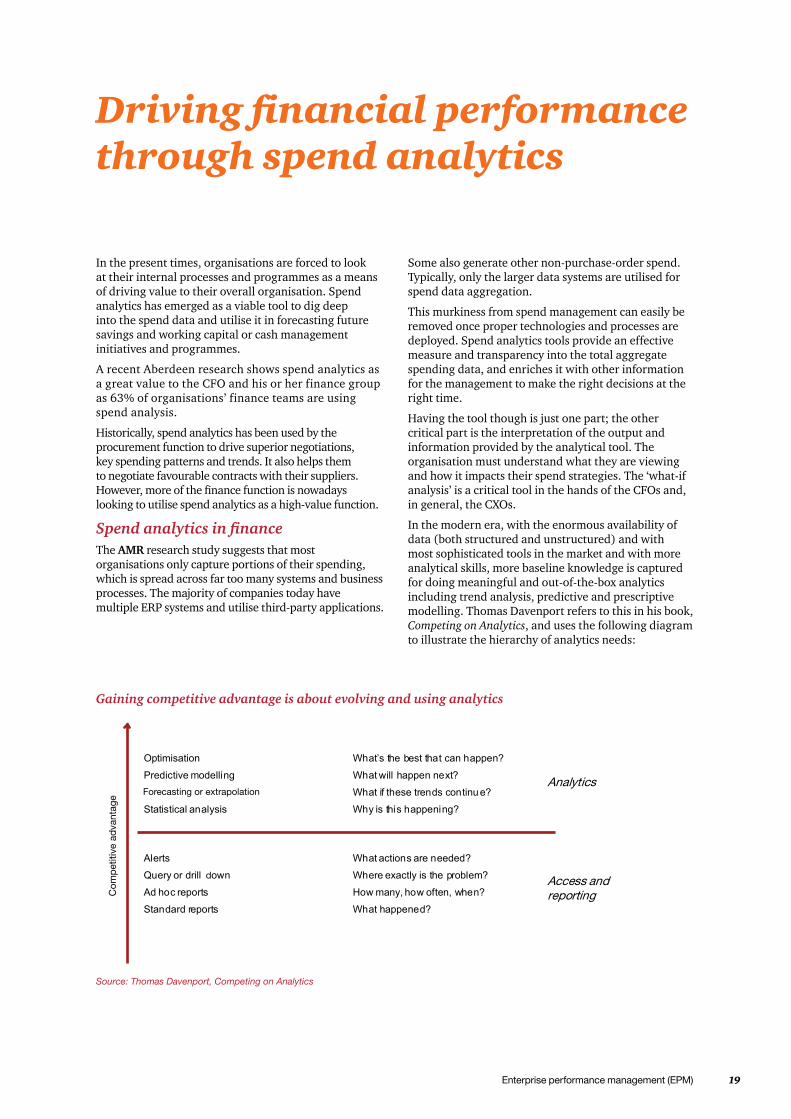
In the modern era, with the enormous availability of data (both structured and unstructured) and with most sophisticated tools in the market and with more analytical skills, more baseline knowledge is captured for doing meaningful and out-of-the-box analytics including trend analysis, predictive and prescriptive modelling. Thomas Davenport refers to this in his book, Competing on Analytics, and uses the following diagram to illustrate the hierarchy of analytics needs:
Optimisation
Predictive odelling
Forecasting/extrapolation
Statistical analysis
What’s the best that can happen?
What will happen next?
What if these trends continue?
Why is this happening?
Alerts
Query or drill own
Ad hoc reports
Standard reports
What actions are needed?
Where exactly is the problem?
How many, how often, when?
What happened?
Analytics
Access and reporting
Gaining competitive advantage is about evolving and using analytics
Source: Thomas Davenport, Competing on Analytics
20 ICC - PwC
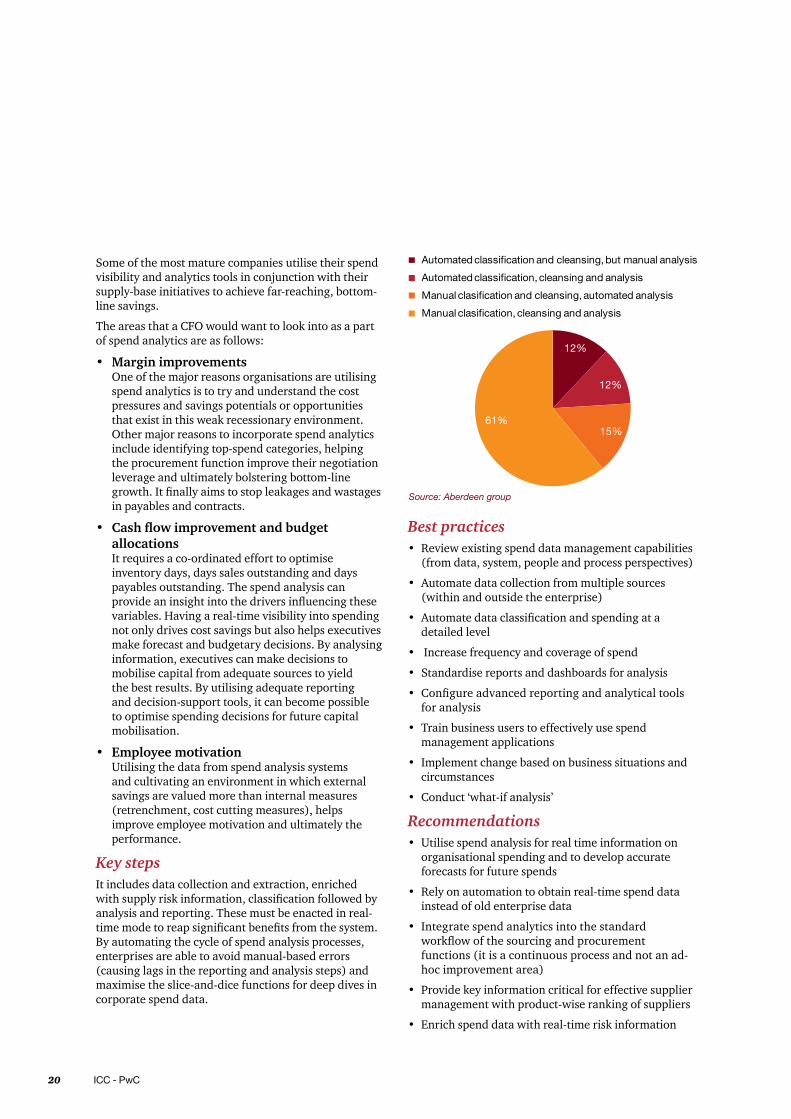
Some of the most mature companies utilise their spend visibility and analytics tools in conjunction with their supply-base initiatives to achieve far-reaching, bottom-line savings.
The areas that a CFO would want to look into as a part of spend analytics are as follows:
• Margin improvementsOne of the major reasons organisations are utilising spend analytics is to try and understand the cost pressures and savings potentials or opportunities that exist in this weak recessionary environment. Other major reasons to incorporate spend analytics include identifying top-spend categories, helping the procurement function improve their negotiation leverage and ultimately bolstering bottom-line growth. It finally aims to stop leakages and wastages in payables and contracts.
• Cash flow improvement and budget allocationsIt requires a co-ordinated effort to optimise inventory days, days sales outstanding and days payables outstanding. The spend analysis can provide an insight into the drivers influencing these variables. Having a real-time visibility into spending not only drives cost savings but also helps executives make forecast and budgetary decisions. By analysing information, executives can make decisions to mobilise capital from adequate sources to yield the best results. By utilising adequate reporting and decision-support tools, it can become possible to optimise spending decisions for future capital mobilisation.
• Employee motivationUtilising the data from spend analysis systems and cultivating an environment in which external savings are valued more than internal measures (retrenchment, cost cutting measures), helps improve employee motivation and ultimately the performance.
Key stepsIt includes data collection and extraction, enriched with supply risk information, classification followed by analysis and reporting. These must be enacted in real-time mode to reap significant benefits from the system. By automating the cycle of spend analysis processes, enterprises are able to avoid manual-based errors (causing lags in the reporting and analysis steps) and maximise the slice-and-dice functions for deep dives in corporate spend data.
Source: Aberdeen group
Best practices• Review existing spend data management capabilities
(from data, system, people and process perspectives)
• Automate data collection from multiple sources (within and outside the enterprise)
• Automate data classification and spending at a detailed level
• Increase frequency and coverage of spend
• Standardise reports and dashboards for analysis
• Configure advanced reporting and analytical tools for analysis
• Train business users to effectively use spend management applications
• Implement change based on business situations and circumstances
• Conduct ‘what-if analysis’
Recommendations• Utilise spend analysis for real time information on
organisational spending and to develop accurate forecasts for future spends
• Rely on automation to obtain real-time spend data instead of old enterprise data
• Integrate spend analytics into the standard workflow of the sourcing and procurement functions (it is a continuous process and not an ad-hoc improvement area)
• Provide key information critical for effective supplier management with product-wise ranking of suppliers
• Enrich spend data with real-time risk information
Enterprise performance management (EPM) 21
XBRL for business reporting
The quest for a solution to meet the challenge of providing timely information to users has seen the emergence of various technology platforms and applications. In recent times, XBRL has emerged as a popular, effective alternative for reporting and analysis.
XBRL is a freely available, market-driven, open and global standard for exchanging business information, allowing information modelling and the expression of semantic meaning commonly required in business reporting. It provides major benefits in the preparation, analysis and communication of business information and offers cost savings, greater efficiency and improved accuracy and reliability to suppliers or users of financial data.
The use of XBRL goes beyond financial reporting. It can be used to cover the broad range of business reporting requirements that companies are required to report including sustainability and environmental reporting obligations.
Integrating XBRL in business reporting infrastructure accelerates reporting cycle times and significantly reduces the cost of business and financial reporting.
More business information is becoming available in XBRL every day. This will result in new and more interactive use of business information to compare and analyse businesses across the globe. XBRL is becoming the new lingua franca of business information around the world.
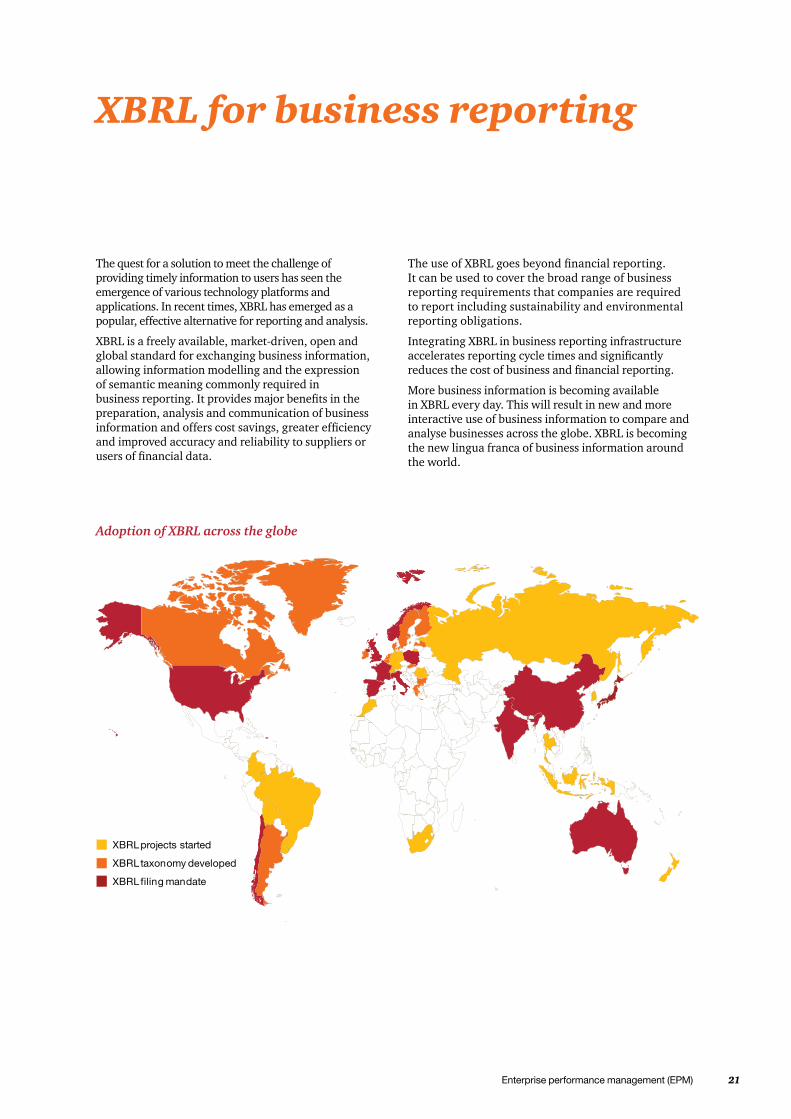
Adoption of XBRL across the globe
22 ICC - PwC
While early adoption of XBRL has been driven by regulatory mandates, it will evolve beyond compliance to more value-added use.
An increasing number of companies are confronted with the application of XBRL either voluntarily or because it has been made mandatory.
The most notable XBRL initiatives are as follows:
Across the globe:• SEC, US
• Her Majesty’s Revenue and Customs, UK
• Standard Business reporting (Netherlands, Australia and other countries)
In India:
• MCA mandate for C&I
• SEBI’s pilot programme for mutual funds
• Basel II online returns filing system (ORFS), the Reserve Bank of India
In the process of meeting these regulatory mandates companies have realised that XBRL is here to stay and can be turned into a competitive advantage instead of a burden when taken as a core element in the disclosure process.
The current situation To understand the importance of XBRL it is necessary to understand the way business reporting is conducted presently. Business information is consumed and created at various points in the enterprise that are often not connected to each other. The management and reporting of business information does not follow an agreed vocabulary and its dispersion limits an organisation’s ability to re-use and share information.
All organisations are required to summarise, consolidate, prepare analyse and often share this information within and outside their boundaries.
These activities are motivated by a number of factors including the following:
• Managers need to drill down into detailed-level information stores to answer questions that might surface while reviewing summary information.
• Requirements for regulatory compliances such as tax, oversight of securities market, etc.
• Capital markets increasing expectations of transparency in business reporting.
• Companies need to communicate with business partners and stakeholders.
XBRL benefits and uses for businessWhether big or small, companies can gain the following extensive benefits from the XBRL:
• Companies will be able to save costs by preparing data in one form and automatically generate multiple outputs. This would avoid re-keying of data and hence will lead to fewer errors while reporting.
• By using XBRL, companies can automatically generate the processes of data collection.
For example, data from different company divisions with different accounting systems can be assembled quickly, cheaply and efficiently if the sources of information have been upgraded to using XBRL.
XBRL will improve the accuracy and reliability of financial data:
• By using XBRL companies will be able to focus on analysis, forecasting and decision-making rather than on laborious tasks in gathering, compiling and preparing data. It thus frees up the management’s time for quality decision-making.
• XBRL makes more effective use of the Internet in communicating with investors. Companies will benefit from the growing importance of websites as a means of communication. In the long run it helps improve investor relations by providing more transparent and user-friendly information.
• It enhances efficiencies and cost savings throughout the regulatory filing process as it helps control cost of compliance by establishing common or shared vocabularies
• It helps in obtaining quicker responses from counterparties, including banks and regulators.
• One unique thing about the XBRL is that it is an independent platform or OS and its integrations with existing business process is a very simple task.
• It facilitates integrated business reporting through information standardisation.
Enterprise performance management (EPM) 23
The technology advantages of XBRL The following technical features of the XBRL will contribute to its adoption as the international data standard for company-wide activities:
• The XBRL is highly extensible, meaning that it can be modified and added to by the IT staff and business analysts to suit their specific requirements
• XBRL-enabled solutions provide methods for normalising data (i.e., eliminating duplicates) across the organisation, yet remain highly interactive with both internal and external systems
• With the XBRL, developers can build tools that can be used in a wide variety of systems, with no need to customise the interface for the company
The implementation of XBRL for large organisations enables them to do the following:
• Apply business rules to data from disparate sources
• Gain greater efficiency in applying changes to either data or analysis
• Enjoy additional transparency and control over enterprise business rules
• Perform analysis with a significantly broader pool of data (both from internal and external sources)
24 ICC - PwC
XBRL implementation and readiness challengesThough the XBRL has several benefits there are significant challenges in its implementation.
Some of the challenges experienced while implementing the XBRL with respect to the MCA mandate for the companies are as follows:
• Stable taxonomy: Last year, was the first ever implementation of the XBRL for corporate financial reporting in India. Till then the old Schedule VI format was used to prepare and present the financials of companies. With a roadmap drawn to converge to IFRS, the MCA recently revised the content and format of Schedule VI
With the revision, a new XBRL taxonomy was developed this year with major architectural changes in line with the recent IFRS taxonomy and global taxonomy guidelines. The Indian taxonomy, till now, has been an unstable one by not giving much time for research and review
• Low awareness: A significant number of finance executives still don’t know what the XBRL is, how it works or what problems it can solve. Introduction of the XBRL will place increased obligations and co-ordination of the financial reporting process. The key stakeholders should take out time to learn and educate themselves about the XBRL and discuss the potential implication of implementing it
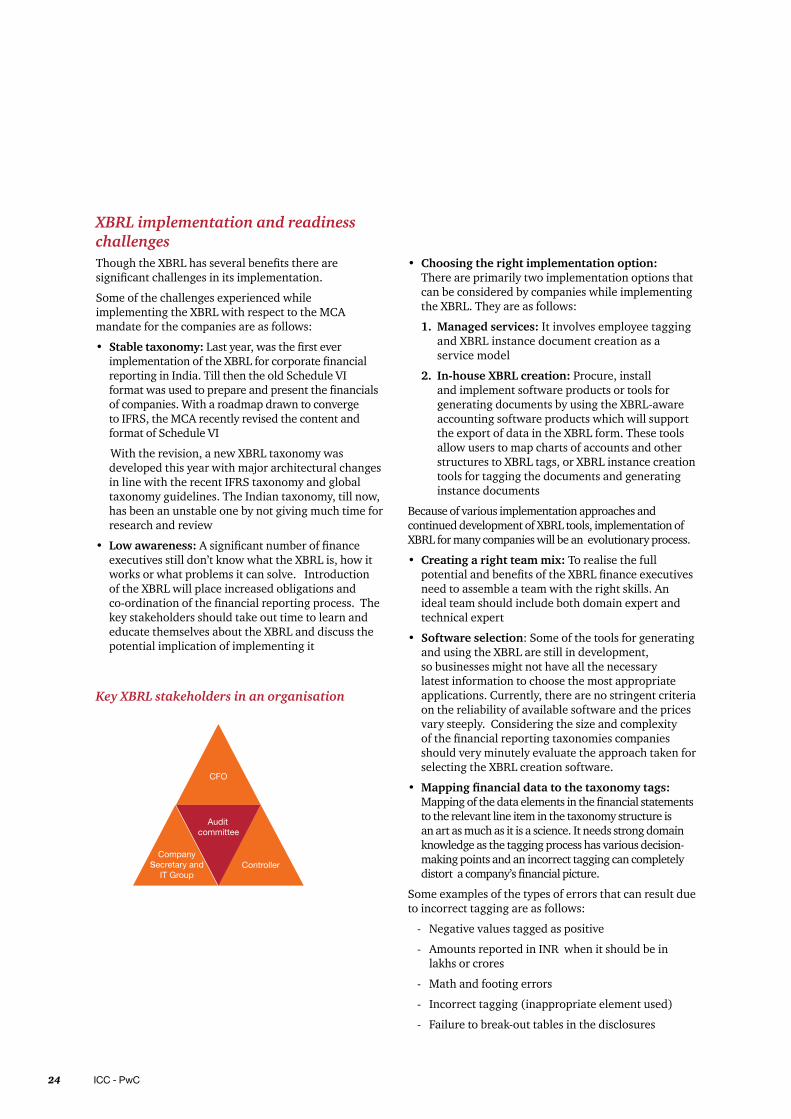
Key XBRL stakeholders in an organisation
• Choosing the right implementation option:There are primarily two implementation options that can be considered by companies while implementing the XBRL. They are as follows:
1. Managed services: It involves employee tagging and XBRL instance document creation as a service model
2. In-house XBRL creation: Procure, install and implement software products or tools for generating documents by using the XBRL-aware accounting software products which will support the export of data in the XBRL form. These tools allow users to map charts of accounts and other structures to XBRL tags, or XBRL instance creation tools for tagging the documents and generating instance documents
Because of various implementation approaches and continued development of XBRL tools, implementation of XBRL for many companies will be an evolutionary process.
• Creating a right team mix: To realise the full potential and benefits of the XBRL finance executives need to assemble a team with the right skills. An ideal team should include both domain expert and technical expert
• Software selection: Some of the tools for generating and using the XBRL are still in development, so businesses might not have all the necessary latest information to choose the most appropriate applications. Currently, there are no stringent criteria on the reliability of available software and the prices vary steeply. Considering the size and complexity of the financial reporting taxonomies companies should very minutely evaluate the approach taken for selecting the XBRL creation software.
• Mapping financial data to the taxonomy tags: Mapping of the data elements in the financial statements to the relevant line item in the taxonomy structure is an art as much as it is a science. It needs strong domain knowledge as the tagging process has various decision-making points and an incorrect tagging can completely distort a company’s financial picture.
Some examples of the types of errors that can result due to incorrect tagging are as follows:
- Negative values tagged as positive
- Amounts reported in INR when it should be in lakhs or crores
- Math and footing errors
- Incorrect tagging (inappropriate element used)
- Failure to break-out tables in the disclosures

Enterprise performance management (EPM) 25
individually
- General inconsistencies compared to prior periods
- A wide range of other errors and inappropriate tagging results
Each of these errors adversely impacts the use of the structured XBRL data by analysts, investors and regulators.
However, for the XBRL to take hold in the marketplace, and its benefits to become widespread, it is important for financial executives to take an active leadership role in developing and adopting it for regular use in business reporting. The most immediate benefit will be a better managed company using the right information to make decisions and reporting that information across a more useful medium. Further, benefits include a lower cost of capital and more accurate stock price valuation based on more efficient and complete analysis of the company’s reported performance. Soon, companies not reporting in this fashion will be at a real disadvantage as compared to companies who are utilising the XBRL.

26 ICC - PwC
About ICC
Founded in 1925, Indian Chamber of Commerce (ICC) is the leading and only National Chamber of Commerce operating from Kolkata, and one of the most pro-active and forward-looking Chambers in the country today. Its membership spans some of the most prominent and major industrial groups in India. ICC is the founder member of FICCI, the apex body of business and industry in India. ICC’s forte is its ability to anticipate the needs of the future, respond to challenges, and prepare the stakeholders in the economy to benefit from these changes and opportunities. Set up by a group of pioneering industrialists led by Mr G D Birla, the Indian Chamber of Commerce was closely associated with the Indian Freedom Movement, as the first organised voice of indigenous Indian Industry. Several of the distinguished industry leaders in India, such as Mr B M Birla, Sir Ardeshir Dalal, Sir Badridas Goenka, Mr S P Jain, Lala Karam Chand Thapar, Mr Russi Mody, Mr Ashok Jain, Mr.Sanjiv Goenka, have led the ICC as its President. Currently, Mr. Rajiv Mundhra is leading the Chamber as it’s President.
ICC is the only Chamber from India to win the first prize in World Chambers Competition in Quebec, Canada.
ICC’s North-East Initiative has gained a new momentum and dynamism over the last few years, and the Chamber has been hugely successful in spreading awareness about the great economic potential of the North-East at national and international levels. Trade & Investment shows on North-East in countries like Singapore, Thailand and Vietnam have created new vistas of economic co-operation between the North-East of India and South-East Asia. ICC has a special focus upon India’s trade & commerce relations with South & South-East Asian nations, in sync with India’s ‘Look East’ Policy, and has played a key role in building synergies between India and her Asian neighbours like Singapore, Indonesia, Bangladesh, and Bhutan through Trade & Business Delegation Exchanges, and large Investment Summits.
ICC also has a very strong focus upon Economic Research & Policy issues - it regularly undertakes Macro-economic Surveys/Studies, prepares State Investment Climate Reports and Sector Reports, provides necessary Policy Inputs & Budget Recommendations to Governments at State & Central levels.
The Indian Chamber of Commerce headquartered in Kolkata, over the last few years has truly emerged as a national Chamber of repute, with full-fledged offices in New Delhi, Guwahati, Patna and Bhubaneshwar functioning efficiently, and building meaningful synergies among Industry and Government by addressing strategic issues of national significance.
Dr Rajeev SinghDirector GeneralIndian Chamber of Commerce4 India Exchange PlaceKolkata 700 001
Phone: 033 2230 3242Fax: 033 2231 3380, 3377Email: [email protected]: http://www.indianchamber.net
Contacts
Enterprise performance management (EPM) 27
PwC firms help organisations and individuals create the value they’re looking for. We’re a network of firms in 158 countries with close to 169,000 people who are committed to delivering quality in assurance, tax and advisory services. Tell us what matters to you and find out more by visiting us at www.pwc.com.
In India, PwC (www.pwc.com/India) offers a comprehensive portfolio of Advisory and Tax & Regulatory services; each, in turn, presents a basket of finely defined deliverables. Network firms of PwC in India also provide services in Assurance as per the relevant rules and regulations in India.
Providing organisations with the advice they need, wherever they may be located, our highly qualified, experienced professionals, who have sound knowledge of the Indian business environment, listen to different points of view to help organisations solve their business issues and identify and maximise the opportunities they seek. Our industry specialisation allows us to help co-create solutions with our clients for their sector of interest.
We are located in these cities: Ahmedabad, Bangalore, Bhubaneshwar, Chennai, Delhi NCR, Hyderabad, Kolkata, Mumbai and Pune.
About PwC
ContactsAmbarish DasguptaExecutive Director/Partner and Consulting LeaderPhone: +91 33 4404 4294Email: [email protected]
Debdas SenExecutive Director/Partner and Technology LeaderPhone:+91 33 4404 6404Email: [email protected]
Pawan Kumar Executive Director/Partner and Information Management Practice LeaderPhone: +91 80 40794004Email: [email protected]
Sudipta Ghosh Executive Director/Partner and EPM Leader, Information ManagementPhone: +91 33 4404 4199Email: [email protected]
Soumen Mukerji Associate Director - Information ManagementPhone: +91 33 4404 4193Email: [email protected]

pwc.com/india©2012PricewaterhouseCoopersPrivateLimited.Allrightsreserved.Inthisdocument,“PwC”referstoPricewaterhouseCoopersPrivateLimited(alimitedliabilitycompanyinIndia),whichisamemberfirmofPricewaterhouseCoopersInternationalLimited(PwCIL),eachmemberfirmofwhichisaseparate legal entity.
MS389-September2012Healthcarefinancingreort.inddDesignedby:PwCBrandandCommunications,India