enterprise products partners l.p. morgan keegan equity...
TRANSCRIPT
All rights reserved. Enterprise Products Partners L.P.
Enterprise Products Partners L.P.Morgan Keegan Equity Conference
September 6, 2007
W. Randall FowlerExecutive Vice President and CFO
All rights reserved. Enterprise Products Partners L.P. 2
This presentation contains forward-looking statements and information that are based on Enterprise’s beliefs and those of its general partner, as well as assumptions made by and information currently available to them. When used in this presentation, words such as “anticipate,” “project,” “expect,” “plan,” “goal,”“forecast,” “intend,” “could,” “believe,” “may,” and similar expressions and statements regarding the contemplated transaction and the plans and objectives of Enterprise for future operations, are intended to identify forward-looking statements. Although Enterprise and its general partner believe that such expectations reflected in such forward looking statements are reasonable, neither it nor its general partner can give assurances that such expectations will prove to be correct. Such statements are subject to a variety of risks, uncertainties and assumptions. If one or more of these risks or uncertainties materialize, or if underlying assumptions prove incorrect, actual results may vary materially from those Enterprise anticipated, estimated, projected or expected. Among the key risk factors that may have a direct bearing on Enterprise’s results of operations and financial condition are:
Fluctuations in oil, natural gas and NGL prices and production due to weather and other natural and economic forces;A reduction in demand for its products by the petrochemical, refining or heating industries;The effects of its debt level on its future financial and operating flexibility;A decline in the volumes of NGLs delivered by its facilities;The failure of its credit risk management efforts to adequately protect it against customer non-payment;Actual construction and development costs could exceed forecasted amounts;Operating cash flows from our capital projects may not be immediate;Terrorist attacks aimed at its facilities; andThe failure to successfully integrate its operations with assets or companies, if any, that it may acquire in the future.
Enterprise has no obligation to publicly update or revise any forward-looking statement, whether as a result of new information, future events or otherwise.
Forward Looking Statements
All rights reserved. Enterprise Products Partners L.P. 3
Non-GAAP Financial Measures
This presentation utilizes the Non-GAAP financial measures of Gross Operating Margin and Consolidated EBITDA. In general, we define Gross Operating Margin as operating income before (i) depreciation, amortization and accretion expense; (ii) operating lease expense for which we do not have the payment obligation; (iii) gains and losses on the sale of assets and (iv) general and administrative expenses. The GAAP measure most directly comparable to Gross Operating Margin is net cash flows provided by operating activities.This presentation includes references to Consolidated EBITDA, which is a term defined in the $1.25 billion revolving credit facility of Enterprise Products Operating LLC, EPD’s operating subsidiary. Consolidated EBITDA is used by certain of our lenders to evaluate our ability to support debt service. The GAAP measure most directly comparable to Consolidated EBITDA is net cash flows provided by operating activities. Please see slides 28 through 30 for our calculations of these Non-GAAP financial measures along with the appropriate reconciliations.
All rights reserved. Enterprise Products Partners L.P. 4
Overview
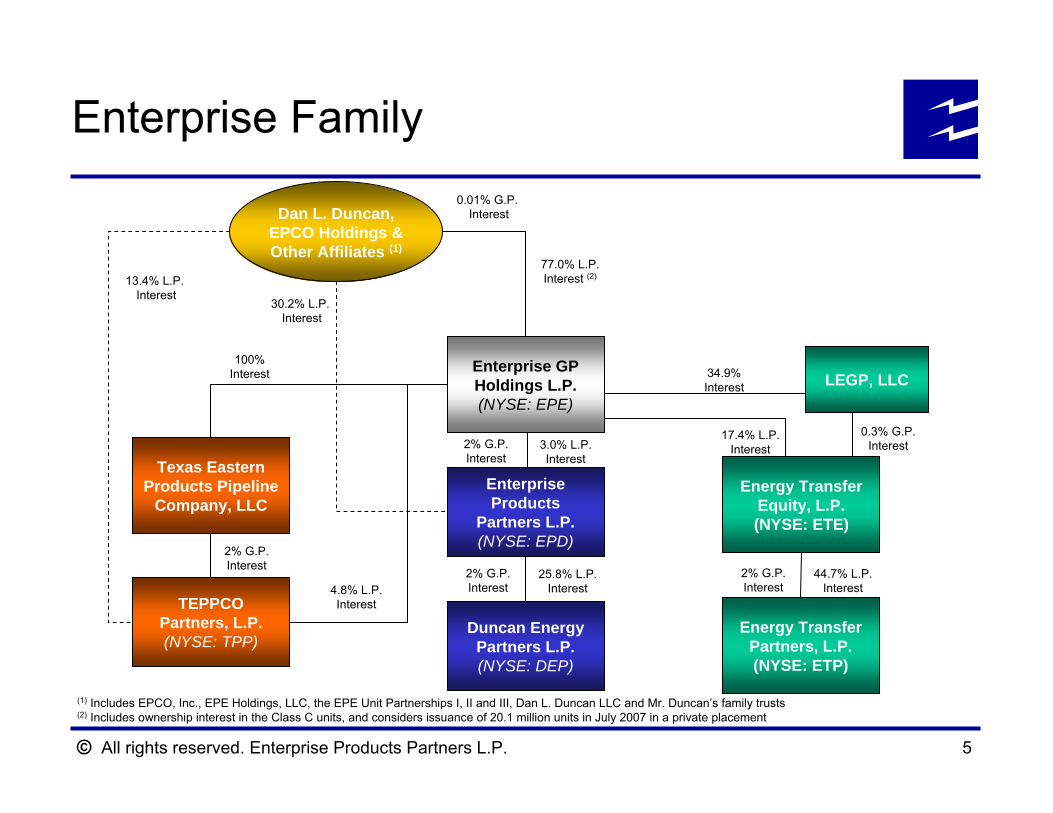
Enterprise Products Partners L.P. (NYSE: EPD) is the primary partnership in the Enterprise family, which includes Enterprise GP Holdings L.P. (NYSE: EPE) and Duncan Energy Partners L.P. (NYSE: DEP)
Combined family of partnerships has an equity market capitalization of approximately $18 billion and an enterprise value of more than $23 billion
EPD is one of the largest publicly traded partnerships with an equity market capitalization of approximately $13 billion, assets of more than $15 billion and an enterprise value of over $19 billion
Ranks 177th on the Fortune 500 (EPE)Delivered record performance in 2006 and in most recent quarter
On track to complete approximately $2.5 billion of growth projects in 2007 generating significant incremental cash flowEPD’s lower long-term cost of equity capital results in more cash accretion from investments, which provides more cash to increase distributions and reinvest in growth
All rights reserved. Enterprise Products Partners L.P. 5
Enterprise Family
77.0% L.P.Interest (2)
Enterprise GP Holdings L.P.(NYSE: EPE)
Enterprise Products
Partners L.P.(NYSE: EPD)
Dan L. Duncan, EPCO Holdings & Other Affiliates (1)
30.2% L.P. Interest
0.01% G.P. Interest
2% G.P. Interest
3.0% L.P. Interest
Energy Transfer Equity, L.P.(NYSE: ETE)
Energy Transfer Partners, L.P.(NYSE: ETP)
Texas Eastern Products Pipeline
Company, LLC
TEPPCO Partners, L.P.(NYSE: TPP)
Duncan Energy Partners L.P.(NYSE: DEP)
2% G.P. Interest
25.8% L.P. Interest
100% Interest
2% G.P. Interest
4.8% L.P. Interest
13.4% L.P. Interest
0.3% G.P. Interest
2% G.P. Interest
44.7% L.P. Interest
17.4% L.P. Interest
LEGP, LLC34.9% Interest
(1) Includes EPCO, Inc., EPE Holdings, LLC, the EPE Unit Partnerships I, II and III, Dan L. Duncan LLC and Mr. Duncan’s family trusts(2) Includes ownership interest in the Class C units, and considers issuance of 20.1 million units in July 2007 in a private placement
All rights reserved. Enterprise Products Partners L.P. 6
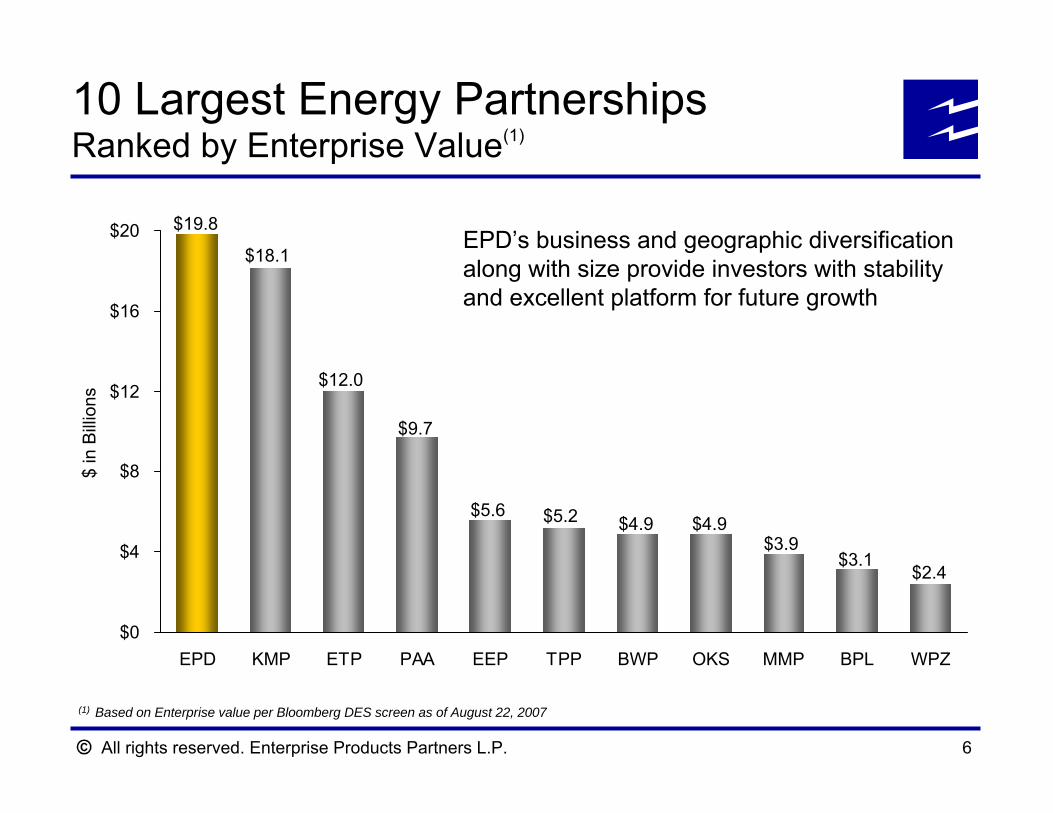
10 Largest Energy PartnershipsRanked by Enterprise Value(1)
$18.1
$12.0
$9.7
$5.6 $5.2 $4.9 $4.9$3.9
$3.1$2.4
$19.8
$0
$4
$8
$12
$16
$20
EPD KMP ETP PAA EEP TPP BWP OKS MMP BPL WPZ
$ in
Bill
ions
(1) Based on Enterprise value per Bloomberg DES screen as of August 22, 2007
EPD’s business and geographic diversification along with size provide investors with stability and excellent platform for future growth
All rights reserved. Enterprise Products Partners L.P. 7
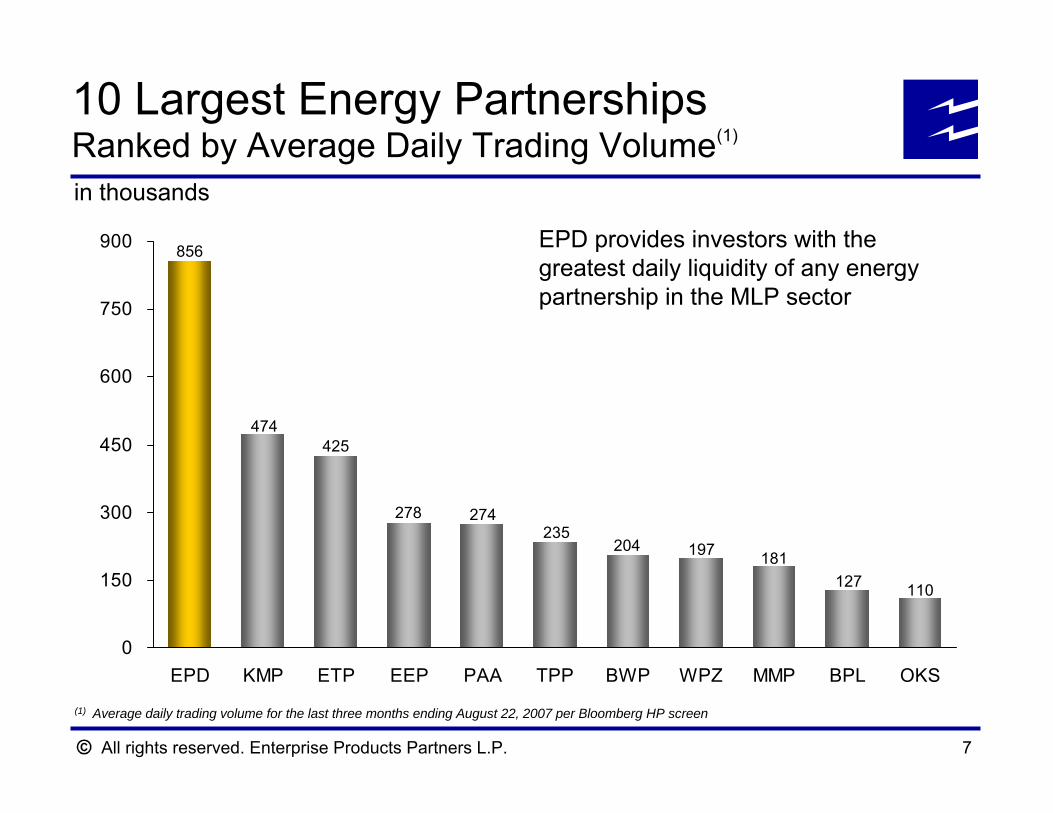
10 Largest Energy PartnershipsRanked by Average Daily Trading Volume(1)
110127181197204
235274278
425474
856
0
150
300
450
600
750
900
EPD KMP ETP EEP PAA TPP BWP WPZ MMP BPL OKS
(1) Average daily trading volume for the last three months ending August 22, 2007 per Bloomberg HP screen
EPD provides investors with the greatest daily liquidity of any energy partnership in the MLP sector
in thousands
All rights reserved. Enterprise Products Partners L.P. 8
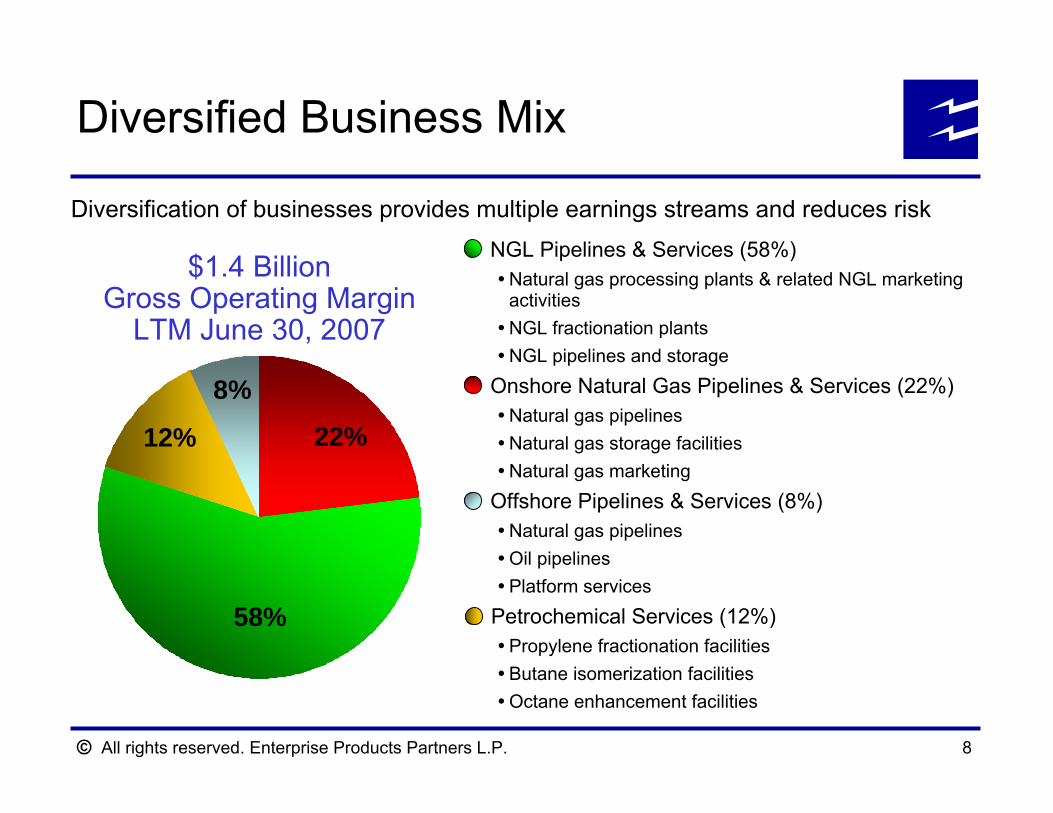
NGL Pipelines & Services (58%)Natural gas processing plants & related NGL marketing activitiesNGL fractionation plants NGL pipelines and storage
Onshore Natural Gas Pipelines & Services (22%)Natural gas pipelinesNatural gas storage facilitiesNatural gas marketing
Offshore Pipelines & Services (8%)Natural gas pipelinesOil pipelinesPlatform services
Petrochemical Services (12%)Propylene fractionation facilitiesButane isomerization facilitiesOctane enhancement facilities
Diversified Business Mix
Diversification of businesses provides multiple earnings streams and reduces risk
$1.4 BillionGross Operating Margin
LTM June 30, 2007
58%
22%
8%
12%
All rights reserved. Enterprise Products Partners L.P. 9
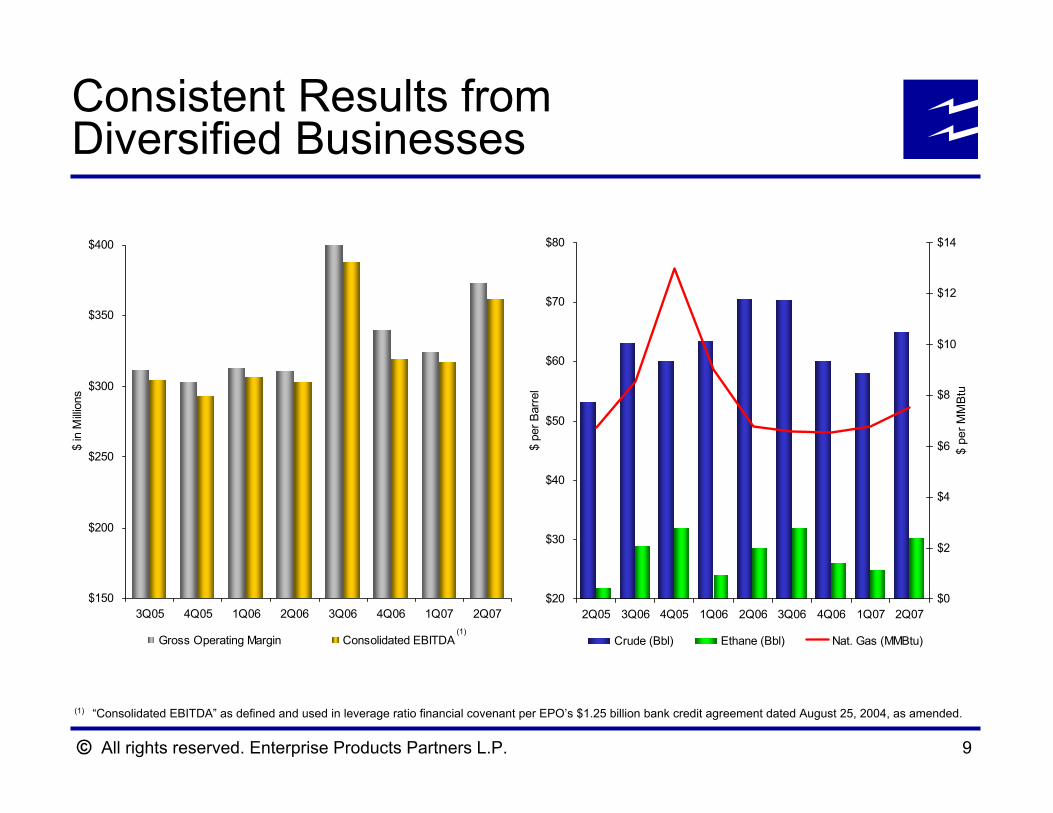
(1) “Consolidated EBITDA” as defined and used in leverage ratio financial covenant per EPO’s $1.25 billion bank credit agreement dated August 25, 2004, as amended.
Consistent Results fromDiversified Businesses
(1)
$150
$200
$250
$300
$350
$400
3Q05 4Q05 1Q06 2Q06 3Q06 4Q06 1Q07 2Q07
$ in
Milli
ons
Gross Operating Margin Consolidated EBITDA
$20
$30
$40
$50
$60
$70
$80
2Q05 3Q06 4Q05 1Q06 2Q06 3Q06 4Q06 1Q07 2Q07
$ pe
r Bar
rel
$0
$2
$4
$6
$8
$10
$12
$14
Crude (Bbl) Ethane (Bbl) Nat. Gas (MMBtu)
$ pe
r MM
Btu
All rights reserved. Enterprise Products Partners L.P. 10
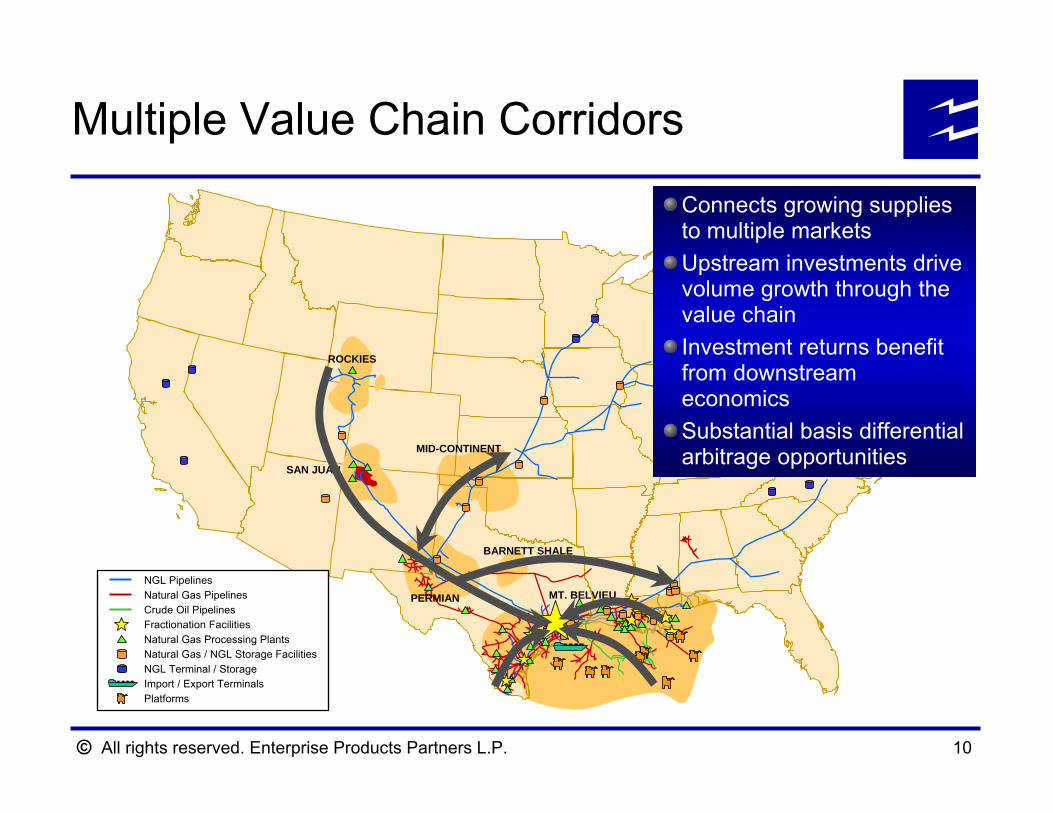
Multiple Value Chain Corridors
BARNETT SHALE
MID-CONTINENT
MT. BELVIEU
ROCKIES
SAN JUAN
PERMIANNGL PipelinesNatural Gas PipelinesCrude Oil PipelinesFractionation FacilitiesNatural Gas Processing PlantsNatural Gas / NGL Storage FacilitiesNGL Terminal / StorageImport / Export TerminalsPlatforms
Connects growing supplies to multiple marketsUpstream investments drive volume growth through the value chainInvestment returns benefit from downstream economicsSubstantial basis differential arbitrage opportunities

All rights reserved. Enterprise Products Partners L.P. 11
Expanding Our Rocky Mountain Franchise
Acquired the Mid-America / Seminole pipelines in 2002Only NGL pipeline out of the Rocky MountainsWaited for appropriate time and market conditions to expand into natural gas gathering and processing supported by growth in Piceance and Jonah / Pinedale basins
Committing approximately $1.9 billion in growth capital in the Rockies Attractive long-term fundamentals (long-lived reserves, low F&D costs) in Piceance, Jonah / Pinedale and San Juan producing areasRecently announced completion of Phase I of the Meeker gas processing complex in the Piceance basin, new NGL fractionator at Hobbs and the last of the 50 MBPD expansion of MAPL’s Rocky Mountain legSupported by firm commitments by major producers
ExxonMobil announced that it plans to drill 200 new wells and they are reported to have 35 Tcf of gas reserves in the Piceance Basin by the end of 2008The Piceance Basin is ExxonMobil’s only planned land-based drilling operation in North America

All rights reserved. Enterprise Products Partners L.P. 12
1
2
34
5
67
8
9
1011
12
Western Value Chain: Downstream Economics
1) Jonah Gas Gathering2) Pioneer Processing Plant3) Piceance Creek Gathering4) Meeker Processing Plant5) San Juan Gathering6) Chaco Processing Plant7) Mid-America Pipeline8) Hobbs NGL Fractionator & Storage9) Seminole Pipeline10) Mont Belvieu – Fractionator11) Mont Belvieu – Storage12) Mont Belvieu – Distribution P/Ls
All rights reserved. Enterprise Products Partners L.P. 13
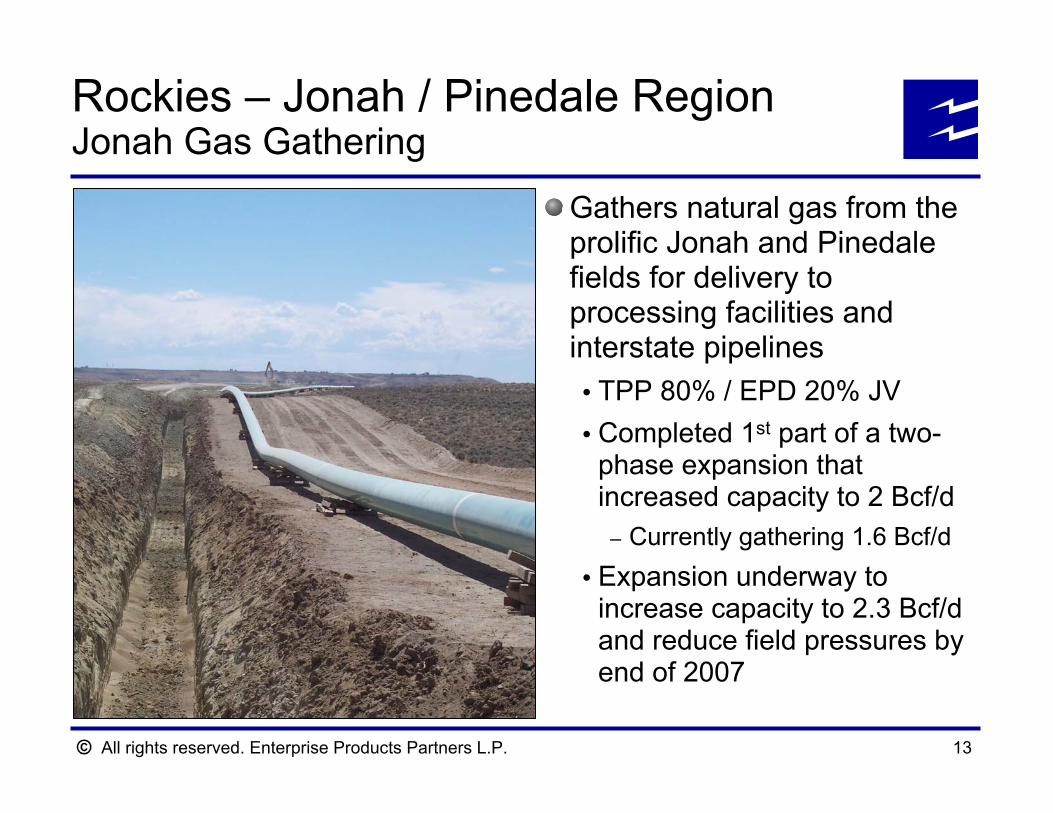
Rockies – Jonah / Pinedale RegionJonah Gas Gathering
Gathers natural gas from the prolific Jonah and Pinedale fields for delivery to processing facilities and interstate pipelines
TPP 80% / EPD 20% JV Completed 1st part of a two-phase expansion that increased capacity to 2 Bcf/d
– Currently gathering 1.6 Bcf/dExpansion underway to increase capacity to 2.3 Bcf/dand reduce field pressures by end of 2007
All rights reserved. Enterprise Products Partners L.P. 14
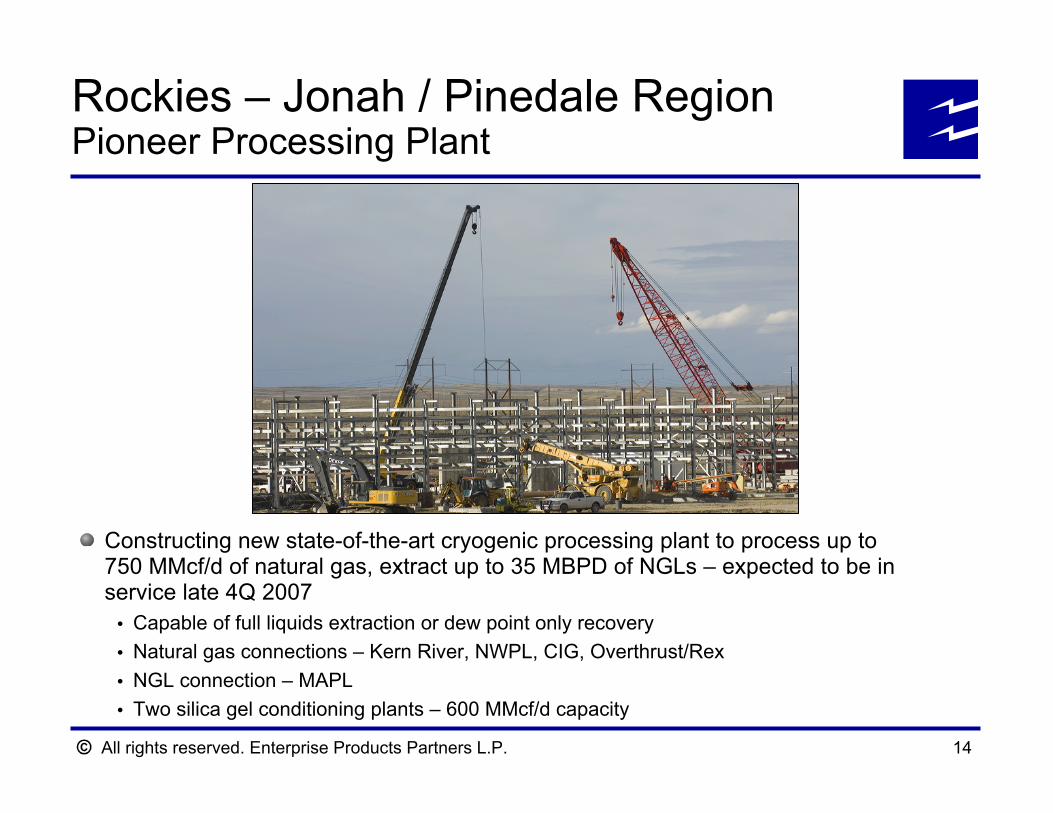
Rockies – Jonah / Pinedale RegionPioneer Processing Plant
Constructing new state-of-the-art cryogenic processing plant to process up to 750 MMcf/d of natural gas, extract up to 35 MBPD of NGLs – expected to be in service late 4Q 2007
Capable of full liquids extraction or dew point only recovery Natural gas connections – Kern River, NWPL, CIG, Overthrust/RexNGL connection – MAPLTwo silica gel conditioning plants – 600 MMcf/d capacity
All rights reserved. Enterprise Products Partners L.P. 15
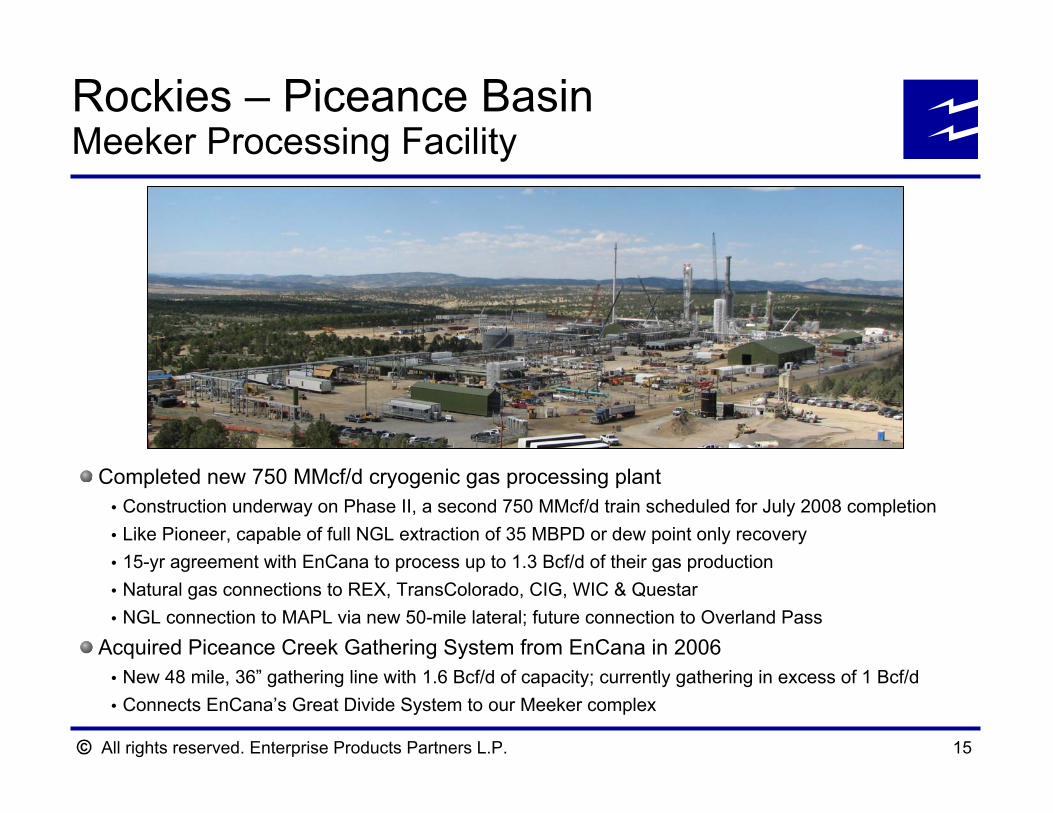
Rockies – Piceance BasinMeeker Processing Facility
Completed new 750 MMcf/d cryogenic gas processing plantConstruction underway on Phase II, a second 750 MMcf/d train scheduled for July 2008 completionLike Pioneer, capable of full NGL extraction of 35 MBPD or dew point only recovery15-yr agreement with EnCana to process up to 1.3 Bcf/d of their gas productionNatural gas connections to REX, TransColorado, CIG, WIC & QuestarNGL connection to MAPL via new 50-mile lateral; future connection to Overland Pass
Acquired Piceance Creek Gathering System from EnCana in 2006New 48 mile, 36” gathering line with 1.6 Bcf/d of capacity; currently gathering in excess of 1 Bcf/dConnects EnCana’s Great Divide System to our Meeker complex
All rights reserved. Enterprise Products Partners L.P. 16
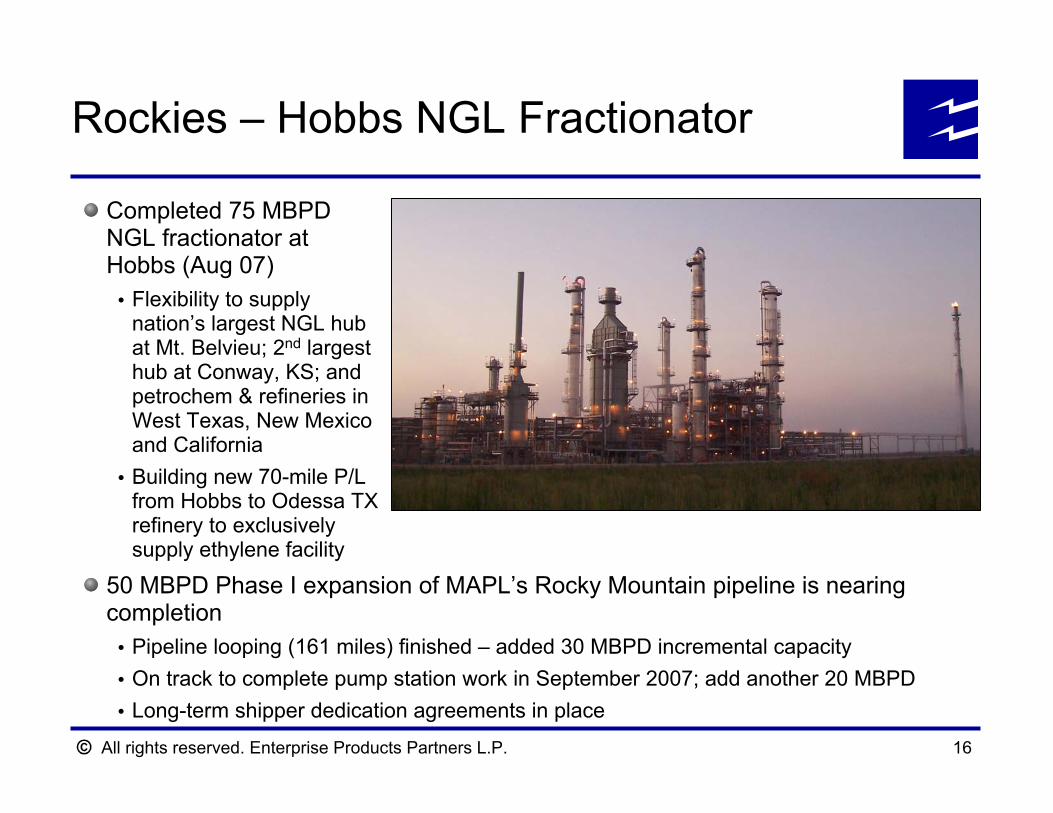
Rockies – Hobbs NGL Fractionator
50 MBPD Phase I expansion of MAPL’s Rocky Mountain pipeline is nearing completion
Pipeline looping (161 miles) finished – added 30 MBPD incremental capacityOn track to complete pump station work in September 2007; add another 20 MBPDLong-term shipper dedication agreements in place
Completed 75 MBPDNGL fractionator at Hobbs (Aug 07)
Flexibility to supply nation’s largest NGL hub at Mt. Belvieu; 2nd largest hub at Conway, KS; and petrochem & refineries in West Texas, New Mexico and CaliforniaBuilding new 70-mile P/L from Hobbs to Odessa TX refinery to exclusively supply ethylene facility
All rights reserved. Enterprise Products Partners L.P.
Other Major Projects Update
All rights reserved. Enterprise Products Partners L.P. 18
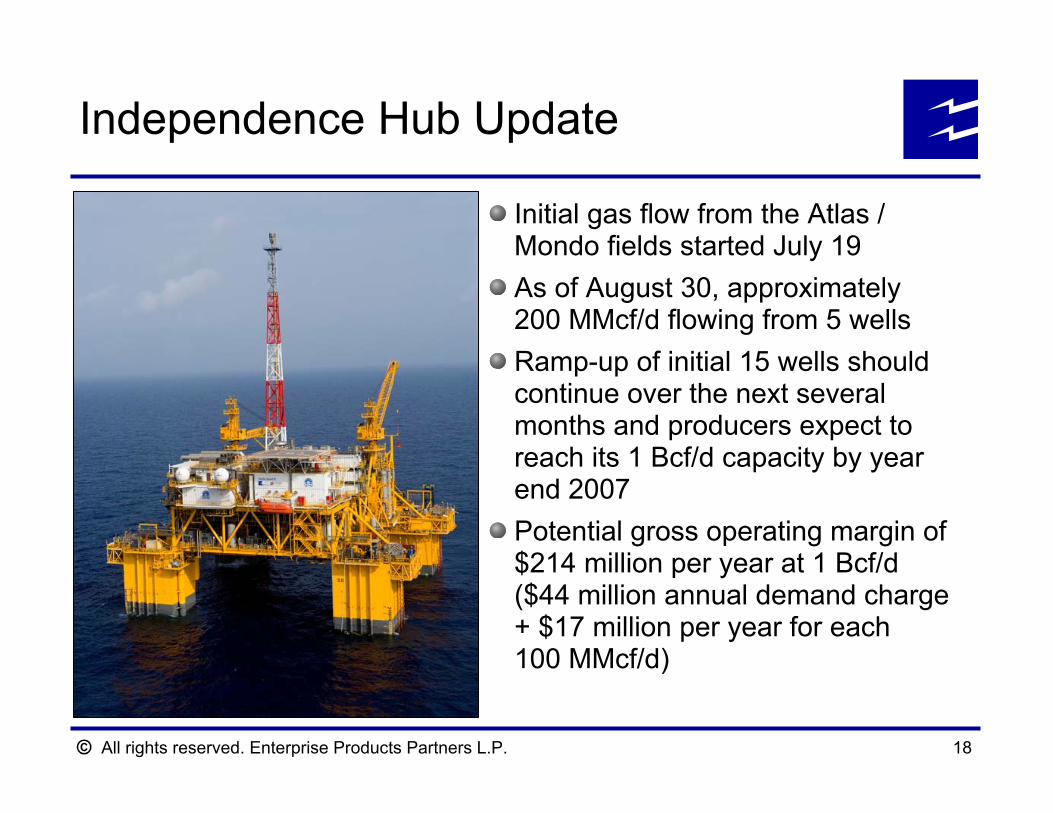
Initial gas flow from the Atlas / Mondo fields started July 19As of August 30, approximately 200 MMcf/d flowing from 5 wellsRamp-up of initial 15 wells should continue over the next several months and producers expect to reach its 1 Bcf/d capacity by year end 2007Potential gross operating margin of $214 million per year at 1 Bcf/d($44 million annual demand charge + $17 million per year for each 100 MMcf/d)
Independence Hub Update
All rights reserved. Enterprise Products Partners L.P. 19
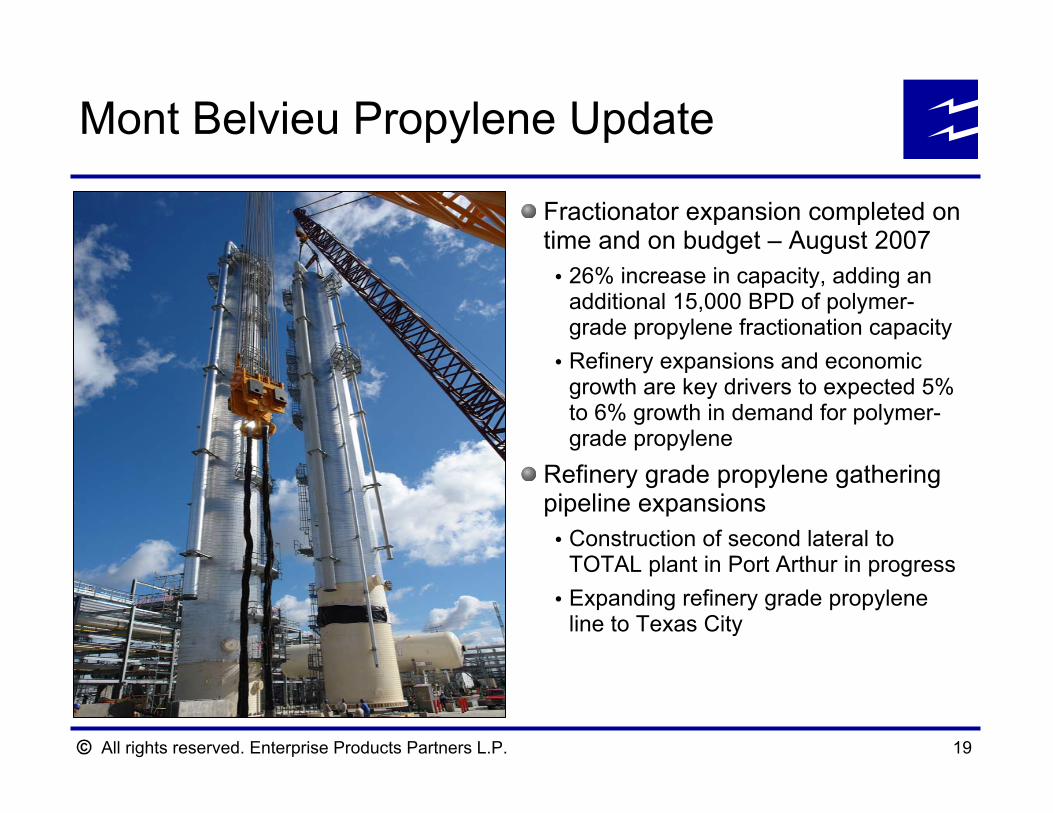
Fractionator expansion completed on time and on budget – August 2007
26% increase in capacity, adding an additional 15,000 BPD of polymer-grade propylene fractionation capacityRefinery expansions and economic growth are key drivers to expected 5% to 6% growth in demand for polymer-grade propylene
Refinery grade propylene gathering pipeline expansions
Construction of second lateral to TOTAL plant in Port Arthur in progressExpanding refinery grade propylene line to Texas City
Mont Belvieu Propylene Update

All rights reserved. Enterprise Products Partners L.P. 20
Barnett Shale current production is 2.1 Bcf/d with forecasted peak of 3.5 Bcf/d by 2011New 1.1 Bcf/d 178-mile, pipeline extends EPD’s Texas Intrastate System through growing Barnett Shale region to interconnect with Boardwalk’s Gulf Crossing Project near Sherman, TexasSupported by long-term contracts with Devon Energy (largest Barnett Shale producer); ties to 8 processing plantsProvides attractive export option for Waha (Permian) and Bossier (East Texas) producersIn-service: 4Q 2008
DFW
Austin
CarthageWaha
Barnett Shale
San Antonio
HSC
Agua Dulce
Bossier Barnett Shale
Sherman Extension ProjectBarnett Shale Update
8 existing and proposed processing plants
Devon (2)Enbridge (2)Crosstex (2)Targa (1)Momentum (1)
Existing plant volumes exceed 1 Bcf/dAdditional growth of 1.2 Bcf/d is expected for this area of the Barnett Shale
All rights reserved. Enterprise Products Partners L.P. 21
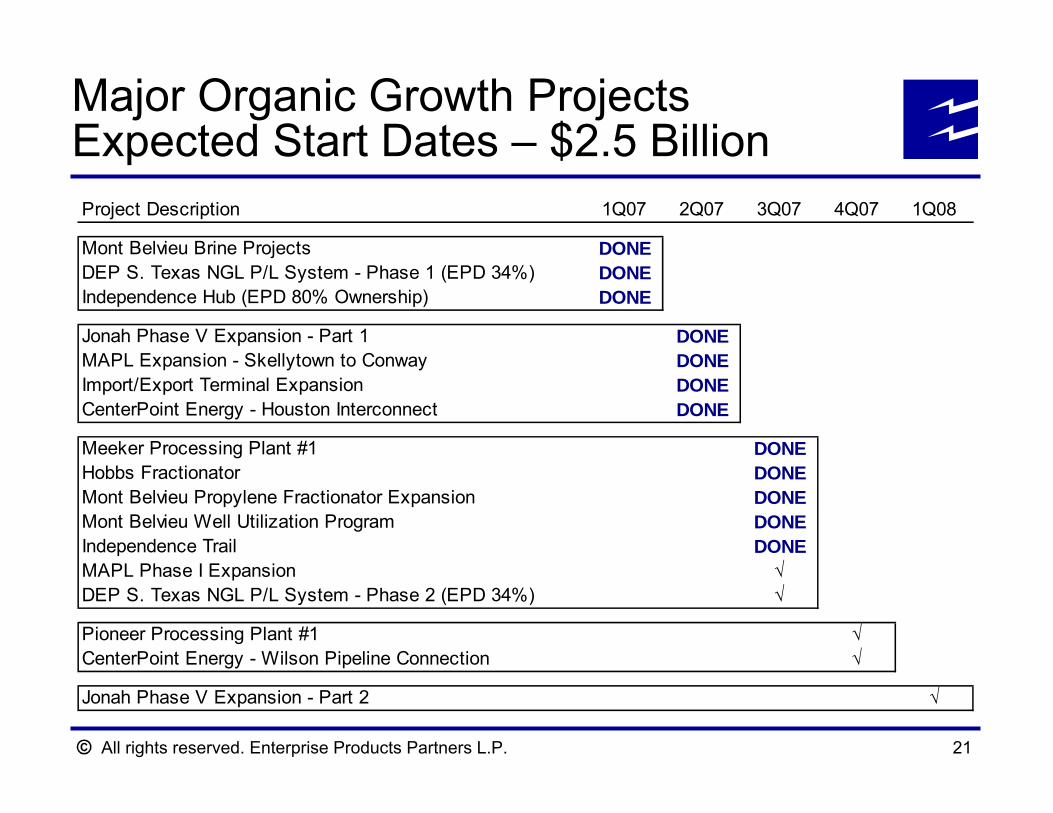
Project Description 1Q07 2Q07 3Q07 4Q07 1Q08
Mont Belvieu Brine Projects DONEDEP S. Texas NGL P/L System - Phase 1 (EPD 34%) DONEIndependence Hub (EPD 80% Ownership) DONE
Jonah Phase V Expansion - Part 1 DONEMAPL Expansion - Skellytown to Conway DONEImport/Export Terminal Expansion DONECenterPoint Energy - Houston Interconnect DONE
Meeker Processing Plant #1 DONEHobbs Fractionator DONEMont Belvieu Propylene Fractionator Expansion DONEMont Belvieu Well Utilization Program DONEIndependence Trail DONEMAPL Phase I Expansion √DEP S. Texas NGL P/L System - Phase 2 (EPD 34%) √
Pioneer Processing Plant #1 √CenterPoint Energy - Wilson Pipeline Connection √
Jonah Phase V Expansion - Part 2 √
Major Organic Growth Projects Expected Start Dates – $2.5 Billion

All rights reserved. Enterprise Products Partners L.P.
Financial Overview
All rights reserved. Enterprise Products Partners L.P. 23
Maintain a strong balance sheet and credit metrics that support investment grade credit ratings
Key financial objective since IPOPrudently invest to expand the partnership through organic growth, acquisitions and joint ventures with strategic partners Manage capital and distributable cash flow to strengthen balance sheet and provide financial flexibility
Financial Objectives
All rights reserved. Enterprise Products Partners L.P. 24
Financial discipline while executing EPD’s growth strategyFinanced 59% of $14.2 billion in capital investment since 1999 with equity (includes total estimate of capital investment for 2007)Financed 65% of $6 billion GTM merger with equitySuccessfully and rapidly integrated businesses after GTM merger
– Refinanced GTM debt to reduce annual interest expense by approximately $50 million– Recognized synergies well in excess of street expectations
Strong track record of management supportManagement has invested approximately $450 million in new equity issues since EPD’s IPOReduced long-term cost of equity capital by eliminating the 50% GP incentive distribution rights (IDRs) in December 2002, resulting in more cash being retained by partnership
Strong coverage of distributions to limited partners1.2x coverage since 1999
History of Financial Discipline
All rights reserved. Enterprise Products Partners L.P. 25
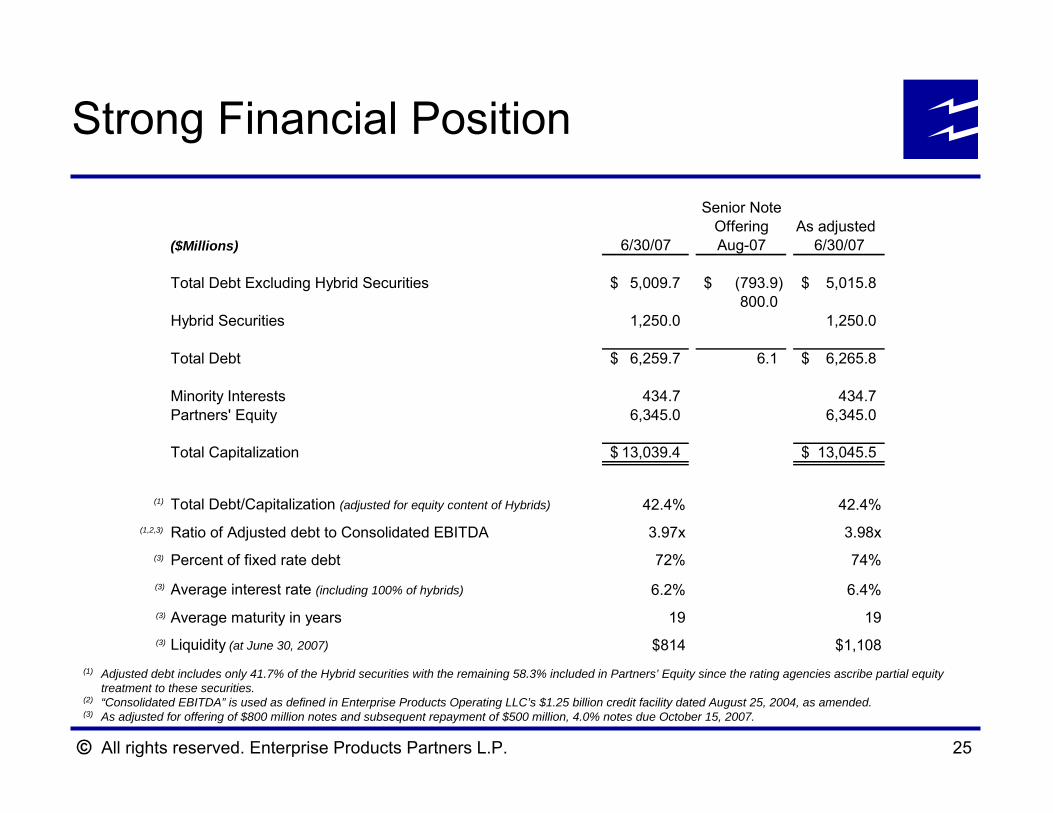
Strong Financial Position
(1) Adjusted debt includes only 41.7% of the Hybrid securities with the remaining 58.3% included in Partners’ Equity since the rating agencies ascribe partial equity treatment to these securities.
(2) “Consolidated EBITDA” is used as defined in Enterprise Products Operating LLC’s $1.25 billion credit facility dated August 25, 2004, as amended.(3) As adjusted for offering of $800 million notes and subsequent repayment of $500 million, 4.0% notes due October 15, 2007.
(1)
(1,2,3)
(3)
(3)
(3)
(3)
Senior NoteOffering As adjusted
($Millions) 6/30/07 Aug-07 6/30/07
Total Debt Excluding Hybrid Securities 5,009.7$ (793.9)$ 5,015.8$ 800.0
Hybrid Securities 1,250.0 1,250.0
Total Debt 6,259.7$ 6.1 6,265.8$
Minority Interests 434.7 434.7 Partners' Equity 6,345.0 6,345.0
Total Capitalization 13,039.4$ 13,045.5$
Total Debt/Capitalization (adjusted for equity content of Hybrids) 42.4% 42.4%
Ratio of Adjusted debt to Consolidated EBITDA 3.97x 3.98x
Percent of fixed rate debt 72% 74%
Average interest rate (including 100% of hybrids) 6.2% 6.4%
Average maturity in years 19 19
Liquidity (at June 30, 2007) $814 $1,108

All rights reserved. Enterprise Products Partners L.P. 26
Outlook
Continued strong operating fundamentals Generate substantial incremental gross operating margin and cash flow from $2.5 billion of new projects
Independence – $214 million of annual gross operating margin at full rates (equals 16% of EPD’s total 2006 gross operating margin) Ramp up of new projects will continue for the remainder of 2007 and 2008
Implementing new gas marketing business to lever existing natural gas processing, pipeline and storage franchiseIncrease distribution rate to partners at year end 2007 to a minimum of $1.99/unit based on current expectations
All rights reserved. Enterprise Products Partners L.P.
Non-GAAP Reconciliations
All rights reserved. Enterprise Products Partners L.P. 28
Non-GAAP Reconciliations
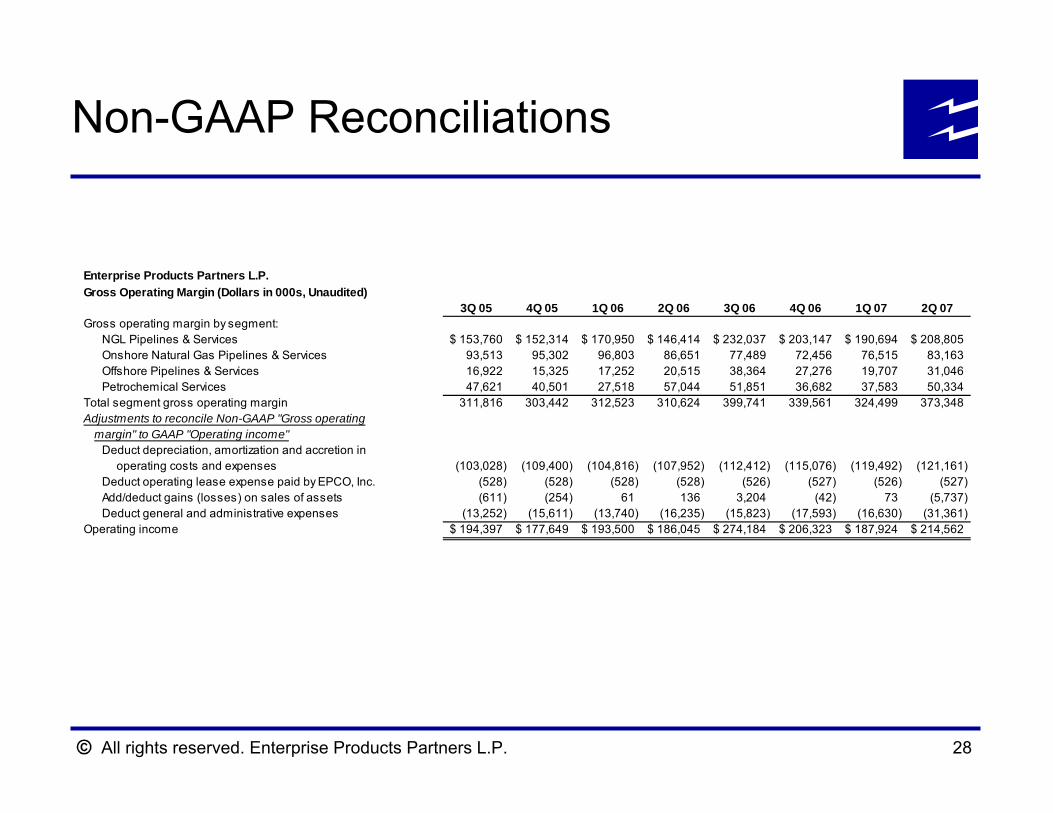
Enterprise Products Partners L.P.Gross Operating Margin (Dollars in 000s, Unaudited)
3Q 05 4Q 05 1Q 06 2Q 06 3Q 06 4Q 06 1Q 07 2Q 07Gross operating margin by segment:
NGL Pipelines & Services 153,760$ 152,314$ 170,950$ 146,414$ 232,037$ 203,147$ 190,694$ 208,805$ Onshore Natural Gas Pipelines & Services 93,513 95,302 96,803 86,651 77,489 72,456 76,515 83,163 Offshore Pipelines & Services 16,922 15,325 17,252 20,515 38,364 27,276 19,707 31,046 Petrochemical Services 47,621 40,501 27,518 57,044 51,851 36,682 37,583 50,334
Total segment gross operating margin 311,816 303,442 312,523 310,624 399,741 339,561 324,499 373,348 Adjustments to reconcile Non-GAAP "Gross operating margin" to GAAP "Operating income"
Deduct depreciation, amortization and accretion in operating costs and expenses (103,028) (109,400) (104,816) (107,952) (112,412) (115,076) (119,492) (121,161) Deduct operating lease expense paid by EPCO, Inc. (528) (528) (528) (528) (526) (527) (526) (527) Add/deduct gains (losses) on sales of assets (611) (254) 61 136 3,204 (42) 73 (5,737) Deduct general and administrative expenses (13,252) (15,611) (13,740) (16,235) (15,823) (17,593) (16,630) (31,361)
Operating income 194,397$ 177,649$ 193,500$ 186,045$ 274,184$ 206,323$ 187,924$ 214,562$
All rights reserved. Enterprise Products Partners L.P. 29
Non-GAAP Reconciliations
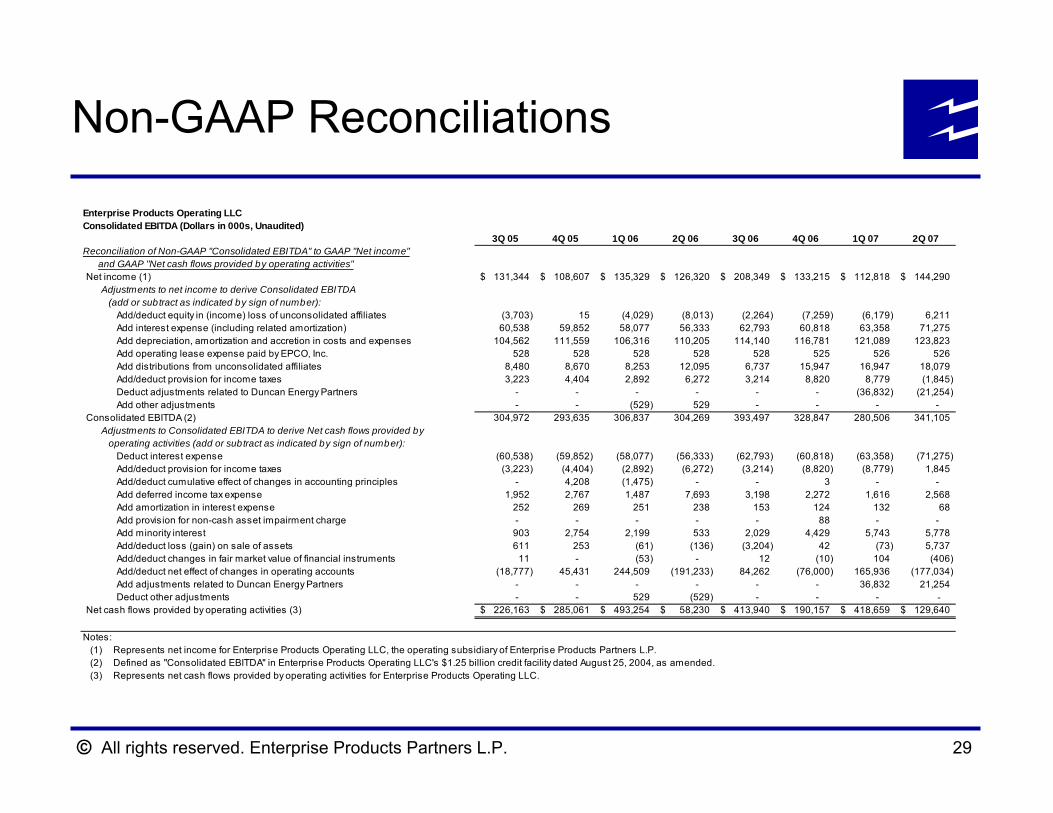
Enterprise Products Operating LLCConsolidated EBITDA (Dollars in 000s, Unaudited)
3Q 05 4Q 05 1Q 06 2Q 06 3Q 06 4Q 06 1Q 07 2Q 07Reconciliation of Non-GAAP "Consolidated EBITDA" to GAAP "Net income"
and GAAP "Net cash flows provided by operating activities"Net income (1) 131,344$ 108,607$ 135,329$ 126,320$ 208,349$ 133,215$ 112,818$ 144,290$
Adjustments to net income to derive Consolidated EBITDA (add or subtract as indicated by sign of number):
Add/deduct equity in (income) loss of unconsolidated affiliates (3,703) 15 (4,029) (8,013) (2,264) (7,259) (6,179) 6,211 Add interest expense (including related amortization) 60,538 59,852 58,077 56,333 62,793 60,818 63,358 71,275 Add depreciation, amortization and accretion in costs and expenses 104,562 111,559 106,316 110,205 114,140 116,781 121,089 123,823 Add operating lease expense paid by EPCO, Inc. 528 528 528 528 528 525 526 526 Add distributions from unconsolidated affiliates 8,480 8,670 8,253 12,095 6,737 15,947 16,947 18,079 Add/deduct provision for income taxes 3,223 4,404 2,892 6,272 3,214 8,820 8,779 (1,845) Deduct adjustments related to Duncan Energy Partners - - - - - - (36,832) (21,254) Add other adjustments - - (529) 529 - - - -
Consolidated EBITDA (2) 304,972 293,635 306,837 304,269 393,497 328,847 280,506 341,105 Adjustments to Consolidated EBITDA to derive Net cash flows provided by operating activities (add or subtract as indicated by sign of number):
Deduct interest expense (60,538) (59,852) (58,077) (56,333) (62,793) (60,818) (63,358) (71,275) Add/deduct provision for income taxes (3,223) (4,404) (2,892) (6,272) (3,214) (8,820) (8,779) 1,845 Add/deduct cumulative effect of changes in accounting principles - 4,208 (1,475) - - 3 - - Add deferred income tax expense 1,952 2,767 1,487 7,693 3,198 2,272 1,616 2,568 Add amortization in interest expense 252 269 251 238 153 124 132 68 Add provision for non-cash asset impairment charge - - - - - 88 - - Add minority interest 903 2,754 2,199 533 2,029 4,429 5,743 5,778 Add/deduct loss (gain) on sale of assets 611 253 (61) (136) (3,204) 42 (73) 5,737 Add/deduct changes in fair market value of financial instruments 11 - (53) - 12 (10) 104 (406) Add/deduct net effect of changes in operating accounts (18,777) 45,431 244,509 (191,233) 84,262 (76,000) 165,936 (177,034) Add adjustments related to Duncan Energy Partners - - - - - - 36,832 21,254 Deduct other adjustments - - 529 (529) - - - -
Net cash flows provided by operating activities (3) 226,163$ 285,061$ 493,254$ 58,230$ 413,940$ 190,157$ 418,659$ 129,640$
Notes:Represents net income for Enterprise Products Operating LLC, the operating subsidiary of Enterprise Products Partners L.P.Defined as "Consolidated EBITDA" in Enterprise Products Operating LLC's $1.25 billion credit facility dated August 25, 2004, as amended.Represents net cash flows provided by operating activities for Enterprise Products Operating LLC.(3)
(1)(2)
All rights reserved. Enterprise Products Partners L.P. 30
Non-GAAP Reconciliations
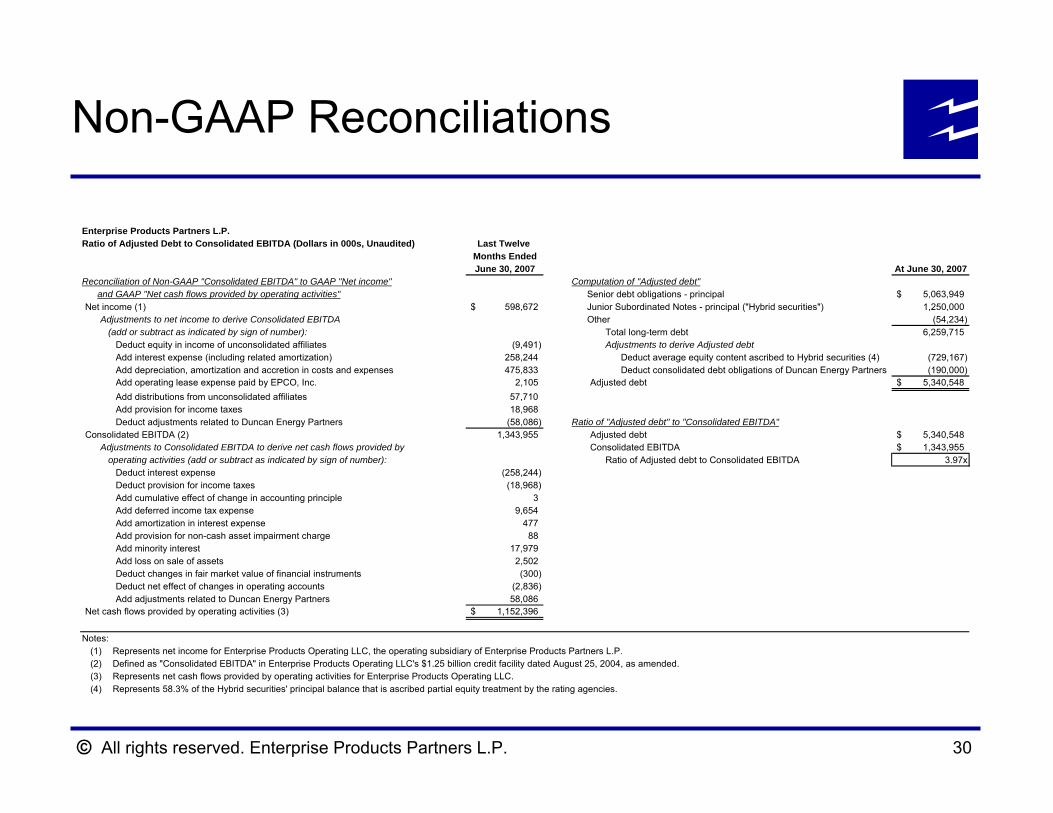
Enterprise Products Partners L.P.Ratio of Adjusted Debt to Consolidated EBITDA (Dollars in 000s, Unaudited) Last Twelve
Months EndedJune 30, 2007 At June 30, 2007
Reconciliation of Non-GAAP "Consolidated EBITDA" to GAAP "Net income" Computation of "Adjusted debt"and GAAP "Net cash flows provided by operating activities" Senior debt obligations - principal 5,063,949$
Net income (1) 598,672$ Junior Subordinated Notes - principal ("Hybrid securities") 1,250,000 Adjustments to net income to derive Consolidated EBITDA Other (54,234) (add or subtract as indicated by sign of number): Total long-term debt 6,259,715
Deduct equity in income of unconsolidated affiliates (9,491) Adjustments to derive Adjusted debtAdd interest expense (including related amortization) 258,244 Deduct average equity content ascribed to Hybrid securities (4) (729,167) Add depreciation, amortization and accretion in costs and expenses 475,833 Deduct consolidated debt obligations of Duncan Energy Partners (190,000) Add operating lease expense paid by EPCO, Inc. 2,105 Adjusted debt 5,340,548$ Add distributions from unconsolidated affiliates 57,710 Add provision for income taxes 18,968 Deduct adjustments related to Duncan Energy Partners (58,086) Ratio of "Adjusted debt" to "Consolidated EBITDA"
Consolidated EBITDA (2) 1,343,955 Adjusted debt 5,340,548$ Adjustments to Consolidated EBITDA to derive net cash flows provided by Consolidated EBITDA 1,343,955$ operating activities (add or subtract as indicated by sign of number): Ratio of Adjusted debt to Consolidated EBITDA 3.97x
Deduct interest expense (258,244) Deduct provision for income taxes (18,968) Add cumulative effect of change in accounting principle 3 Add deferred income tax expense 9,654 Add amortization in interest expense 477 Add provision for non-cash asset impairment charge 88 Add minority interest 17,979 Add loss on sale of assets 2,502 Deduct changes in fair market value of financial instruments (300) Deduct net effect of changes in operating accounts (2,836) Add adjustments related to Duncan Energy Partners 58,086
Net cash flows provided by operating activities (3) 1,152,396$
Notes:Represents net income for Enterprise Products Operating LLC, the operating subsidiary of Enterprise Products Partners L.P.Defined as "Consolidated EBITDA" in Enterprise Products Operating LLC's $1.25 billion credit facility dated August 25, 2004, as amended.Represents net cash flows provided by operating activities for Enterprise Products Operating LLC.Represents 58.3% of the Hybrid securities' principal balance that is ascribed partial equity treatment by the rating agencies.
(1)(2)(3)(4)