enterprise risk management, performance measurement ... · 312 enterprise risk management,...
TRANSCRIPT
International Journal of Business and Society, Vol. 18 No. 2, 2017, 311-328
ENTERPRISE RISK MANAGEMENT, PERFORMANCE MEASUREMENT SYSTEMS AND ORGANIZATIONAL
PERFORMANCE IN MALAYSIAN PUBLIC LISTED FIRMS
Siti Zaleha Abdul Rasid UTM International Business School
Nargess Golshan
University of Missouri
Mozhdeh Mokhber UTM International Business School
Gi-Gi Tan
UTM International Business School
Nor Aiza Mohd-Zamil UTM International Business School
ABSTRACT
There has been a call for integrating a strategic performance measurement system and enterprise risk management
(ERM) as a proposed best practice for risk management. This study examines the effects of ERM and performance
measurement systems (PMS) on organizational performance. In addition, this study also examines the effects of a
linked ERM-PMS tool on organizational performance. The research method involved administering an online
questionnaire survey to 196 public listed firms. The respondents were the head of risk management department of
the firms. In the case of ERM and PMS effects on organizational performance, the result of simple linear regression
supported the research hypotheses. However the results from the moderated multiple regression which was
employed to test the joint effect of ERM and PMS on organizational performance did not support the research
hypothesis. Based on the study results it is recommended that firms may practice ERM and PMS separately rather
than linking them together, since their integration may complicate the PMS framework.
Keywords: Enterprise Risk Management; Performance Measurement System; Balanced Scorecard; Organizational
Performance.
1. INTRODUCTION
Risk can be anything that would hinder an organization from achieving its objectives (Woods, 2007). Therefore, risk management may be defined as any set of actions taken by individuals or corporations in an effort to alter the risk arising from their primary lines of business (Cummins, Phillips, & Smith, 1998). The generic risk management framework includes four major risk management components, risk identification, risk measurement, risk mitigation and risk monitoring and reporting (Bessis, 2011).
Corresponding author: International Business School, Universiti Teknologi Malaysia, Kuala Lumpur, Malaysia. Email: [email protected]
312 Enterprise Risk Management, Performance Measurement Systems and Organizational Performance in
Malaysian Public Listed Firms
Due to the recent global financial crisis and corporate failures, stakeholders are demanding for a greater oversight of key risks faced by the organizations to ensure value preservation and growth. One response to these growing expectations is the emergence of a new paradigm known as “Enterprise Risk Management” or “ERM” as an internal control system. ERM is sometimes referred to as strategic risk management, integrated risk management or holistic risk management and moves away from the silo approach of managing different risks within an organization separately and distinctly to a more comprehensive view of risk and risk management (CAS, 2003; Kleffner, Lee, & McGannon, 2003; Liebenberg & Hoyt, 2003). Organizations can use ERM to manage the various strategic, market, credit, operational and financial risks that they confront (Banham, 2004). ERM also broadens the focus of risk management from a protective stance to a strategic stance (Collier, Fishwick, & Floyd, 2004) as it increases the ability of the board and senior management to oversee the portfolio of risks facing an enterprise (Beasley, Clune, & Hermanson, 2005). At the same time, organizations have been implementing Performance Measurement System (PMS) as one of the management control systems vital for corporate success. Choong (2013) suggested that a holistic view which included several criteria such as balanced between financial and non-financial perspectives, improve learning and growth, and strengthen management initiatives and performance should be applied in measuring various business activities. Balanced Scorecard (BSC) is the most widely used performance measurement system (Woods, 2007). The preliminary idea behind the BSC is that financial measures do not apprehend adequately the companies’ performance; thus equal prominence should be laid upon non-monetary metric, which should be seen as supplementary to the conventional financial measures (Tapinos et al., 2011). There has been a call for integrating the BSC as a strategic performance measurement system and ERM as a proposed best practice for risk management (Ballou, Brewer, & Heitger, 2006; McWhorter, Matherly, & Frizzell, 2006; Beasley, Clune, & Hermanson, 2006; Scholey, 2006). Beasley et al. (2006) proposed some guidelines on how the integration can be done. In order to ensure that all employees embrace a common set of definitions and perspectives on risk management, training objectives and performance measures related to learning and education about risk management can be added to the learning and growth perspective of the BSC. Risk goals and performance measures related to customers, markets and reputation in the customer satisfaction perspective needs to be included. Considering the importance of these two control systems, the possibility of incorporating ERM into the existing PMS needs to be explored. It is expected that risk management will complement PMS by identifying and mitigating risks in achieving strategic objectives. Despite the calls for integrating ERM and performance measurement (Ballou et al., 2006; Beasley, Pagach, & Warr, 2008; McWhorter et al., 2006; Scholey, 2006), empirical evidence on this issue is still lacking (Woods, 2007) and academic research on this issue in Malaysia is almost non-existent. Risk management systems appeared to improve an organization’s capacity to process information, which leads to improved organizational performance (Collier et al., 2004; Soin, 2005). When ERM is linked to strategic performance measurement, it will lead to improved internal business processes by eliminating or reducing risk exposure. Improved business processes will then improve customer satisfaction, which in turn should lead to improved performance (Ballou et al., 2006; Beasley et al., 2006). Hence, it is important to investigate whether putting these two control systems together will further enhance organizational performance. Although there is a growing body of literature that examines the effect of ERM and organizational performance(e.g. Florio and Leoni, 2017; Lai and Samad, 2010; Gordon, Loeb, & Tseng, 2009; Hoyt & Liebenberg, 2011; Segal, 2011)as well as the performance measurement system (PMS) and organizational performance(De Geuser, Mooraj, & Oyon, 2009; Hoque & James, 2000; Pollanen & Xi,
Siti Zaleha Abdul Rasid, Nargess Golshan, Mozhdeh Mokhber, Gi-Gi Tan and Nor Aiza Mohd-Zamil 313
2011), there is a gap in the literature of how linking ERM and PMS can enhance the organizational performance. Previous studies on this issue are still limited and they are either conceptual (Ballou et al., 2006; Beasley et al., 2006; Calandro Jr and Lane, 2006) or case studies based on one or two organizations (Nagumo, 2005; Woods, 2007). This study fills the gap in the literature by giving empirical evidence on the ERM-PMS link on organizational performance. Hence the objectives of this study are to (1) identify the effect of ERM adoption on organizational performance; (2) identify the effect of performance measurement systems on organizational performance; (3) explore the effects of a linked ERM-PMS framework on organizational performance. The remainder of the paper is structured as follows. The next section reviews the relevant literature and develops the hypotheses, followed by the research method. Results are then discussed and finally conclusions are drawn and research implications are presented in the final section.
2. LITERATURE REVIEW AND HYPOTHESES DEVELOPMENT
2.1. Enterprise Risk Management (ERM)
Risk is a phenomenon that by definition and by nature cannot be eliminated. Although risk and uncertainty are often used interchangeably, there is a distinction between them. Uncertainty is referred to not being sure of what will happen in the future and risk is the degree of this uncertainty. In old days, self-assurance was considered as a method for risk management, and later risk management was implemented through a silo-based perspective among firms. Thekdi and Aven (2016) argued that even though the processes of traditional risk management are motivated by risk control and losses prevention which stands in stark contrast to other organizational processes that concentrated on managing performance and value generation, risk management inevitably adds a notable contribution to these processes. Now we have come to the era of ERM (Rochette, 2009) in which the risk profession has evolved gradually and stopped considering risk only as negative. Today’s risk professionals also reveal the opportunities that come along with risk-taking activities. ERM includes methods and processes that organizations use to manage risks and capture existing opportunities in order to achieve their goals. Indeed ERM addresses the requirements of various stakeholders, who desire to realize the broad spectrum of risks facing the organization, to ensure that the organization is being properly managed. The ERM framework developed by the Committee of Sponsoring Organizations of the Treadway Commission (COSO) (2004) is one of the most popular ERM frameworks being implemented in different firms across the globe (Daud, Yazid, & Hussin, 2010). COSO emphasizes that risk management’s primary focus is on identifying, understanding, and assessing intrinsic business risks and then it considers control as one possible risk response. 2.2. Performance Measurement System (PMS)
Performance measurement can be defined as the process of quantifying the efficiency and effectiveness of action (Neely, Gregory, & Platts, 2005). The primary goal of PMS is to assess the progress of achieving objectives including both financial and non-financial. Meanwhile the output of PMS will be used to assure the efficiency and effectiveness of resource allocation in an organization (Acharyya, 2007). On top to meet the cost parameters, performance measurement development in management has gone along with the impact of general push in enhancing service and quality (Amaratunga and Baldry, 2002). Since poor predictions could be obtained from historical data-based metrics owing to unforeseen future changes, different types of models like purpose performance models, probabilistic analysis
314 Enterprise Risk Management, Performance Measurement Systems and Organizational Performance in
Malaysian Public Listed Firms
predictions, and uncertainty characterizations can be acquired as example for judgments of potential optimization in performance (Thekdi and Aven, 2016). Beamon (1996) has claimed that an effective PMS has four main characteristics including inclusiveness, measurability, consistency, and universality. Moreover, a PMS should be able to evaluate both internal and external environment of an organization. The output of PMS should be used by the senior management level of an organization to decide on setting new goals for the organization. PMS is a vital tool, which assist organizations to translate their strategy in terms of desired behaviour and results. It helps organizations to communicate their expectations, monitor the business processes, providing feedbacks, and motivating employees through performance-based compensations (Banker, Potter, & Srinivasan, 2000; Chenhall & Langfield-Smith, 2003; Ittner & Larcker, 1998; Kaplan & Norton, 2001). There are many tools and techniques suggested in the literature to measure performance in an organization and the most widely used tools is BSC (Woods, 2007). The best advantage of BSC is that it translates the organization’s vision and strategy into measurable metrics (Acharyya, 2007). Therefore by using a BSC it can be precisely assessed if the organization is moving across the defined strategy and is on the right way of achieving its objectives at any point of time. 2.3. Enterprise Risk Management and Performance Measurement System
According to Arena and Arnaboldi (2014), managerial attention could be dragged by the “key” data with possible beneficial effects in terms of decision making quality within an integrated risk and PMS based on practitioners’ literature; at the same time, it could also assist in boosting stakeholders’ confidence. Several authors (Ballou et al., 2006; Beasley et al., 2006; Calandro Jr & Lane, 2006; McWhorter et al., 2006; Nagumo, 2005; Scholey, 2006; Woods, 2007) have proposed that the BSC as a strategic PMS and ERM are complementing each other as ERM and BSC have some common components. First, both ERM and BSC recognize the importance of non-financial measures in overall organizational performance. Second, both ERM and BSC are aligned with organization’s strategy and they ensure that the organization’s objectives are achieved. While BSC creates a control mechanism that guarantees the implementation of strategy, ERM complements this by identifying and mitigating any potential risks to strategy implementation (Woods, 2007). Third, ERM and BSC arise from the fact that they both take an enterprise-wide perspective for measuring performance and risks respectively. Fourth, both ERM and BSC take a top-down approach to work effectively in an organization. Fifth, both ERM and BSC require understanding among all hierarchical levels of the organization and each individual should be aware of his/her responsibilities. BSC makes strategy everyone’s job via cascading from the highest level to the lowest level of the organization. Likewise ERM suggests that every individual in the organization has some responsibilities for risk management. Sixth, for both ERM and BSC effective communication throughout the whole organization is vital (Woods, 2007). Finally, both ERM and BSC follow a regular and ongoing approach and the process never ends in the organization (Beasley et al., 2006). Based on the aforementioned similarities, BSC provides a suitable infrastructure for implementation of ERM in an organization. Leveraging a BSC to include ERM strengthens the scope of management’s focus by precisely and clearly linking risk management to performance measurement. If risks would be managed separately from other strategic objective, which indicates that ERM and BSC would run in parallel, managers may have difficulty in prioritizing the defined targets. Rather if the two systems would be integrated, the influences of various types of risks on the strategic objectives become explicit. Therefore, on one hand BSC provides a suitable base for ERM implementation. On the other hand the integration of ERM and BSC will result in a more effective BSC (Beasley et al., 2006). Meanwhile, when ERM would be embedded in the existing BSC of an organization, there would be less requirement of creating a new function of risk management, since risk components are incorporated into every staff’s
Siti Zaleha Abdul Rasid, Nargess Golshan, Mozhdeh Mokhber, Gi-Gi Tan and Nor Aiza Mohd-Zamil 315
responsibility. However, the ultimate responsible party for risk control will remain to be the board of directors. The final outcome of integrated performance and risk management is not necessarily to reduce risk exposure, the quantified potential losses of business but rather to understand the risk matters in a performance-oriented setting (Thekdi and Aven, 2016). 2.4. ERM Adoption and Organizational Performance
In the academic literature there are various studies, which have linked implementation of the new financial technology of ERM with improved firm performance (e.g. COSO, 2004; Lai and Samad, 2010; Gordon et al., 2009; Hoyt & Liebenberg, 2010; Segal, 2011). In recent years the benefits of ERM have astonished managers. These benefits include: (1) reduced cost of capital; (2) reduced earnings volatility which results in enhancing shareholders’ value; (3) reduced stock price volatility which results in enhancing shareholders’ value; (4) gaining competitive advantage through identifying those risks that can be exploited; (5) enhanced informed decision making ability and (6) builds confidence for investors (Liebenberg & Hoyt, 2003; Miccolis & Shah, 2000). Meanwhile Woon et al. (2011) have proved that successful ERM implementation will result in value creation for shareholders through lowered cost of capital (via lowered risk premium) and enhanced business performance (i.e. higher price-to-earnings ratio for the firm’s shares). Pagach and Warr (2011) have also indicated that firms adopt ERM for direct economic benefits rather than merely to comply with regulations’ pressure. Florio and Leoni (2017) provided evidence of a positive effect between ERM implementation and firm performance relationship; their tests verified how organizations with sophisticated ERM systems have lower firm risk, and relatively better performance. In fact many organizations have intuitively recognized the benefits of ERM and have started to implement some form of it in the organization. Various studies have shown that ERM implementation affects organizational performance extensively (e.g. Lai and Samad, 2010; Gordon et al., 2009; Hoyt & Liebenberg, 2011; Segal, 2011). Based on the reviewed studies the following hypothesis is developed to be tested in this study: H1: ERM adoption positively influences organizational performance. 2.5. Performance Measurement System (PMS) and Organizational Performance
PMS plays a key role in developing strategic plans, evaluating the achievement of organizational objectives, and deciding about employees’ compensation (Ittner & Larcker, 1998). A well-designed PMS will include a sense of direction and purpose. PMS provides useful tools for restructuring and for organizational performance management if they are effectively linked to the revised strategies and accompanied with appropriate rewards (Kaplan & Norton, 1992; Otley, 1999). It is also an important part of continuous improvement. Meanwhile PMS helps managers to focus their attention on achieving objectives, and use it as a crucial agent of change. Further, PMS has a significant role for the improvement of individual and organizational performance. The BSC has proven to be an effective tool to capture, describe, and translate organization’s strategy into performance metrics and targets (Niven, 2002). Since its emergence in the early 90s, many companies have adopted it for measuring financial and non-financial performance of the organization. Consequently many studies have been conducted to gauge its effectiveness and to assess whether the BSC really adds value to the organizations (De Geuser et al., 2009; Hoque & James, 2000; Pollanen & Xi, 2011). As an example, De Geuser et al. (2009) in their study of 76 business units found that the BSC has a positive impact on organizational performance and more specifically it improves the integration
316 Enterprise Risk Management, Performance Measurement Systems and Organizational Performance in
Malaysian Public Listed Firms
of management processes via a better translation of strategy into operational terms. Moreover, BSC makes strategizing a continuous process, and it results in greater alignment of various processes within the organization. Meanwhile, Pollanen and Xi (2011) in their research of 330 firms found that firm performance is a function of increased fit between BSC and firm characteristics such as strategy, industry, size, quality, structure, culture, and ownership. Based on these studies the following hypothesis is shaped to be examined in this study. H2: The use of PMS or BSC as a comprehensive PMS framework positively influences organizational performance. 2.6. Integrated ERM-BSC Effect on Organizational Performance
Few studies (Nagumo, 2005; Woods, 2007) have considered how ERM and BSC can be linked. The focus of a BSC is on continuous improvement and it links an organization’s vision and strategy to certain performance measures (Beasley et al., 2006). Basically, other convincing way for companies to examine their risk management system effectiveness is to connect it with their PMS (Khameneh et al., 2016). Due to the ultimate objective of risk management system is to protect stakeholders’ interests and make better profits, hence, a higher overall organization performance can be achieved with an effective risk management system (Khameneh et al., 2016). Saraiva and Alves (2015) found that BSC adoption in the organizations gives them a global view of the firm, which they declared that its usage allows strategic learning and advancement and also enables them to improve employee engagement by implementing effective personal and departmental goal alignment to well-defined strategy. Therefore it is obvious that the BSC takes a holistic enterprise wide approach for measuring organization’s performance. Hence it provides an excellent infrastructure for an enterprise-wide risk management system.
Organizations recognized the advantages in applying BSC; it has been a valuable tool for intensifying financial instability, complementing internal communication and strategic learning (Saraiva and Alves, 2015). BSCs assess an organization’s progress towards achieving strategic goals. Organizational enablers are utilizing BSC to focus on the achievement of strategic goals and priorities in the time to come, likewise portray the past systems’ effectiveness and efficiency (Kalender and Vayvay, 2016). On the other hand, ERM is a tool for organization leaders to detect the positive and negative events that may affect achievement of their goals. Thus a combination of the BSC and ERM will increase the probability of achieving goals and objectives. Various types of risk may threaten the organization for not being able to fulfill its strategic objectives. Therefore solutions should be planned to create a consciousness culture of how to manage risks at all hierarchical levels within the organization. If the risks that an organization may face can be classified into the four perspectives of the BSC, then the management of the risks can be integrated into the BSC (Woods, 2007). As discussed in the previous sections ERM and BSC are similar in many aspects. Meanwhile, after almost two decades since the inception of BSC by Kaplan and Norton (1992), many companies all around the world have adopted it as a PMS tool. On the other hand ERM is a relatively new concept and still not many companies have adopted this framework. In fact adoption of ERM is still a voluntary concept among the firms. The empirical evidences are the studies of Liebenberg and Hoyt (2003) who have identified only 26 firms in the US that have adopted ERM during 1997 to 2001, and even Pagach and Warr (2011) detected only 138 firms in the US, which have adopted ERM framework during 1999 to 2005. Another example is the survey results of the Economist Intelligence unit, which discovered that only 41 percent of companies in Europe, North America, and Asia have adopted some form of ERM. As scholars have tried to find the reason behind low adoption rates of ERM, they cite some common barriers and challenges such as the resistance of board of directors or senior executives. Another
Siti Zaleha Abdul Rasid, Nargess Golshan, Mozhdeh Mokhber, Gi-Gi Tan and Nor Aiza Mohd-Zamil 317
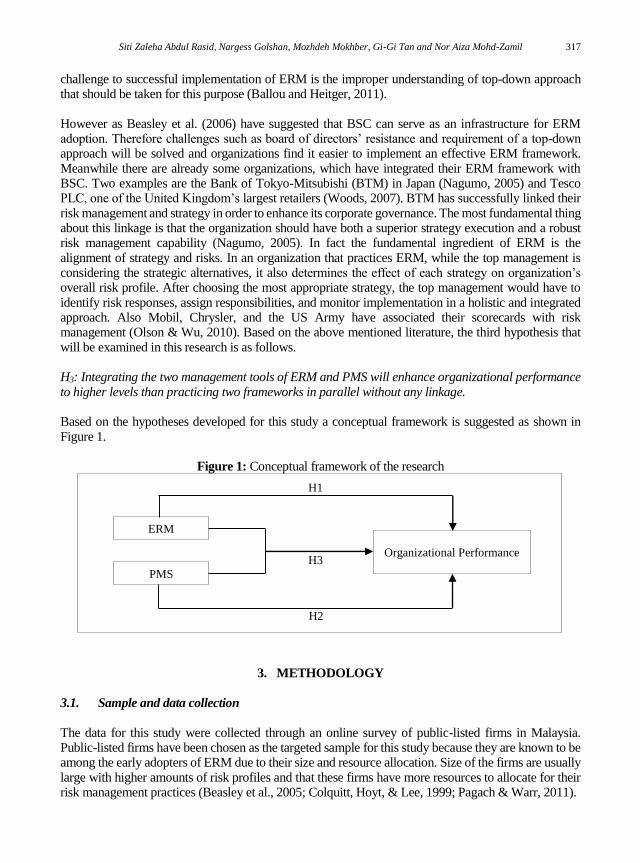
challenge to successful implementation of ERM is the improper understanding of top-down approach that should be taken for this purpose (Ballou and Heitger, 2011). However as Beasley et al. (2006) have suggested that BSC can serve as an infrastructure for ERM adoption. Therefore challenges such as board of directors’ resistance and requirement of a top-down approach will be solved and organizations find it easier to implement an effective ERM framework. Meanwhile there are already some organizations, which have integrated their ERM framework with BSC. Two examples are the Bank of Tokyo-Mitsubishi (BTM) in Japan (Nagumo, 2005) and Tesco PLC, one of the United Kingdom’s largest retailers (Woods, 2007). BTM has successfully linked their risk management and strategy in order to enhance its corporate governance. The most fundamental thing about this linkage is that the organization should have both a superior strategy execution and a robust risk management capability (Nagumo, 2005). In fact the fundamental ingredient of ERM is the alignment of strategy and risks. In an organization that practices ERM, while the top management is considering the strategic alternatives, it also determines the effect of each strategy on organization’s overall risk profile. After choosing the most appropriate strategy, the top management would have to identify risk responses, assign responsibilities, and monitor implementation in a holistic and integrated approach. Also Mobil, Chrysler, and the US Army have associated their scorecards with risk management (Olson & Wu, 2010). Based on the above mentioned literature, the third hypothesis that will be examined in this research is as follows. H3: Integrating the two management tools of ERM and PMS will enhance organizational performance to higher levels than practicing two frameworks in parallel without any linkage. Based on the hypotheses developed for this study a conceptual framework is suggested as shown in Figure 1.
Figure 1: Conceptual framework of the research
3. METHODOLOGY
3.1. Sample and data collection
The data for this study were collected through an online survey of public-listed firms in Malaysia. Public-listed firms have been chosen as the targeted sample for this study because they are known to be among the early adopters of ERM due to their size and resource allocation. Size of the firms are usually large with higher amounts of risk profiles and that these firms have more resources to allocate for their risk management practices (Beasley et al., 2005; Colquitt, Hoyt, & Lee, 1999; Pagach & Warr, 2011).
ERM
PMS
Organizational Performance
H1
H3
H2
318 Enterprise Risk Management, Performance Measurement Systems and Organizational Performance in
Malaysian Public Listed Firms
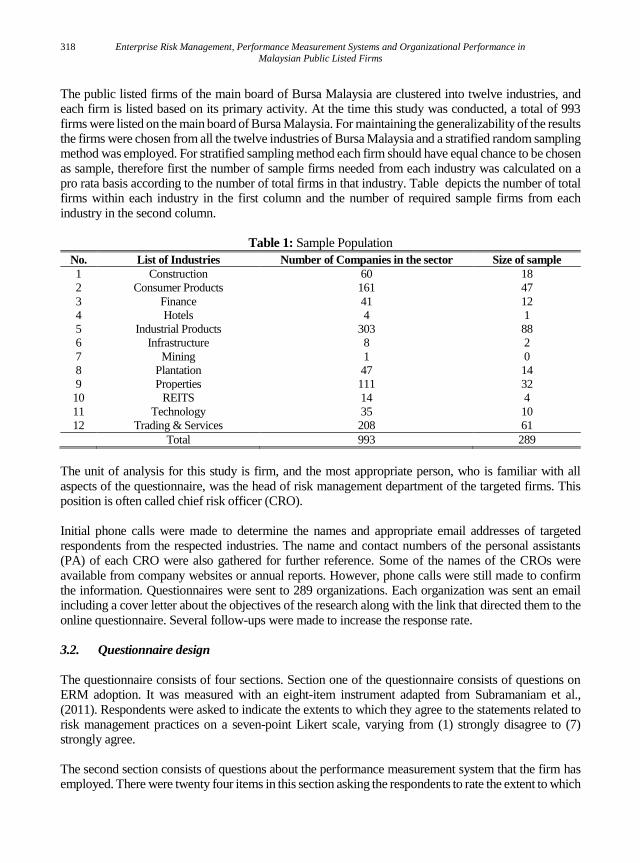
The public listed firms of the main board of Bursa Malaysia are clustered into twelve industries, and each firm is listed based on its primary activity. At the time this study was conducted, a total of 993 firms were listed on the main board of Bursa Malaysia. For maintaining the generalizability of the results the firms were chosen from all the twelve industries of Bursa Malaysia and a stratified random sampling method was employed. For stratified sampling method each firm should have equal chance to be chosen as sample, therefore first the number of sample firms needed from each industry was calculated on a pro rata basis according to the number of total firms in that industry. Table depicts the number of total firms within each industry in the first column and the number of required sample firms from each industry in the second column.
Table 1: Sample Population
No. List of Industries Number of Companies in the sector Size of sample
1 Construction 60 18
2 Consumer Products 161 47
3 Finance 41 12
4 Hotels 4 1
5 Industrial Products 303 88
6 Infrastructure 8 2
7 Mining 1 0
8 Plantation 47 14
9 Properties 111 32
10 REITS 14 4
11 Technology 35 10
12 Trading & Services 208 61
Total 993 289
The unit of analysis for this study is firm, and the most appropriate person, who is familiar with all aspects of the questionnaire, was the head of risk management department of the targeted firms. This position is often called chief risk officer (CRO). Initial phone calls were made to determine the names and appropriate email addresses of targeted respondents from the respected industries. The name and contact numbers of the personal assistants (PA) of each CRO were also gathered for further reference. Some of the names of the CROs were available from company websites or annual reports. However, phone calls were still made to confirm the information. Questionnaires were sent to 289 organizations. Each organization was sent an email including a cover letter about the objectives of the research along with the link that directed them to the online questionnaire. Several follow-ups were made to increase the response rate. 3.2. Questionnaire design
The questionnaire consists of four sections. Section one of the questionnaire consists of questions on ERM adoption. It was measured with an eight-item instrument adapted from Subramaniam et al., (2011). Respondents were asked to indicate the extents to which they agree to the statements related to risk management practices on a seven-point Likert scale, varying from (1) strongly disagree to (7) strongly agree. The second section consists of questions about the performance measurement system that the firm has employed. There were twenty four items in this section asking the respondents to rate the extent to which
Siti Zaleha Abdul Rasid, Nargess Golshan, Mozhdeh Mokhber, Gi-Gi Tan and Nor Aiza Mohd-Zamil 319
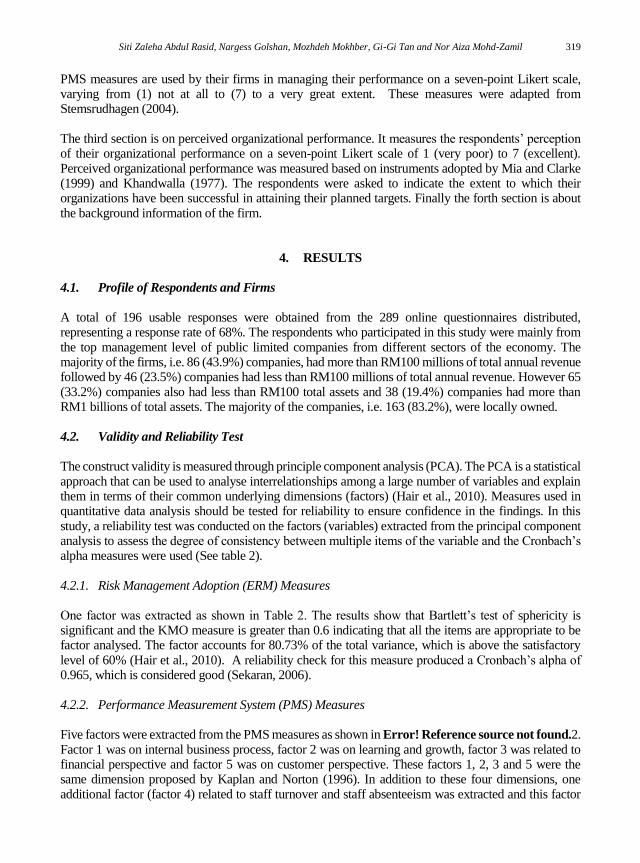
PMS measures are used by their firms in managing their performance on a seven-point Likert scale, varying from (1) not at all to (7) to a very great extent. These measures were adapted from Stemsrudhagen (2004). The third section is on perceived organizational performance. It measures the respondents’ perception of their organizational performance on a seven-point Likert scale of 1 (very poor) to 7 (excellent). Perceived organizational performance was measured based on instruments adopted by Mia and Clarke (1999) and Khandwalla (1977). The respondents were asked to indicate the extent to which their organizations have been successful in attaining their planned targets. Finally the forth section is about the background information of the firm.
4. RESULTS
4.1. Profile of Respondents and Firms
A total of 196 usable responses were obtained from the 289 online questionnaires distributed, representing a response rate of 68%. The respondents who participated in this study were mainly from the top management level of public limited companies from different sectors of the economy. The majority of the firms, i.e. 86 (43.9%) companies, had more than RM100 millions of total annual revenue followed by 46 (23.5%) companies had less than RM100 millions of total annual revenue. However 65 (33.2%) companies also had less than RM100 total assets and 38 (19.4%) companies had more than RM1 billions of total assets. The majority of the companies, i.e. 163 (83.2%), were locally owned.
4.2. Validity and Reliability Test
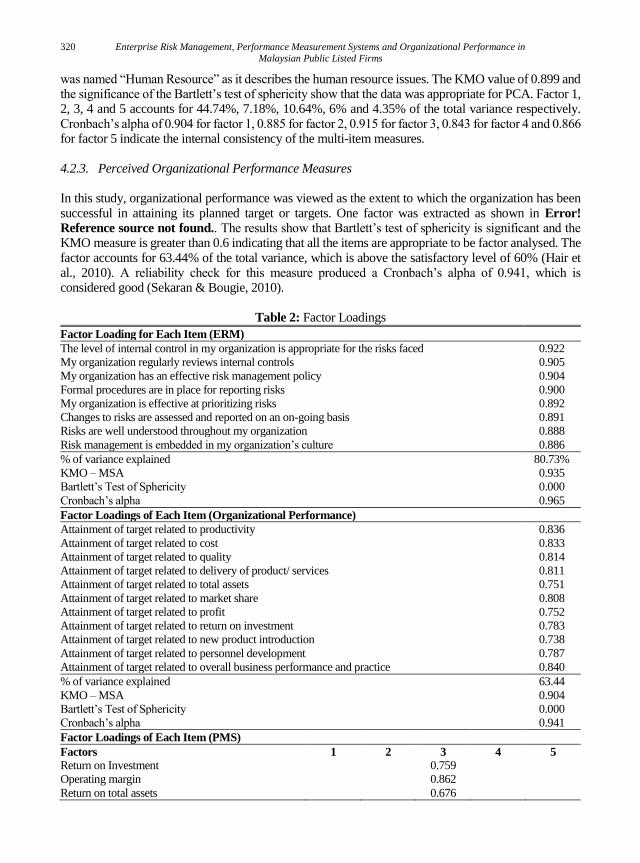
The construct validity is measured through principle component analysis (PCA). The PCA is a statistical approach that can be used to analyse interrelationships among a large number of variables and explain them in terms of their common underlying dimensions (factors) (Hair et al., 2010). Measures used in quantitative data analysis should be tested for reliability to ensure confidence in the findings. In this study, a reliability test was conducted on the factors (variables) extracted from the principal component analysis to assess the degree of consistency between multiple items of the variable and the Cronbach’s alpha measures were used (See table 2). 4.2.1. Risk Management Adoption (ERM) Measures One factor was extracted as shown in Table 2. The results show that Bartlett’s test of sphericity is significant and the KMO measure is greater than 0.6 indicating that all the items are appropriate to be factor analysed. The factor accounts for 80.73% of the total variance, which is above the satisfactory level of 60% (Hair et al., 2010). A reliability check for this measure produced a Cronbach’s alpha of 0.965, which is considered good (Sekaran, 2006). 4.2.2. Performance Measurement System (PMS) Measures Five factors were extracted from the PMS measures as shown in Error! Reference source not found.2. Factor 1 was on internal business process, factor 2 was on learning and growth, factor 3 was related to financial perspective and factor 5 was on customer perspective. These factors 1, 2, 3 and 5 were the same dimension proposed by Kaplan and Norton (1996). In addition to these four dimensions, one additional factor (factor 4) related to staff turnover and staff absenteeism was extracted and this factor
320 Enterprise Risk Management, Performance Measurement Systems and Organizational Performance in
Malaysian Public Listed Firms
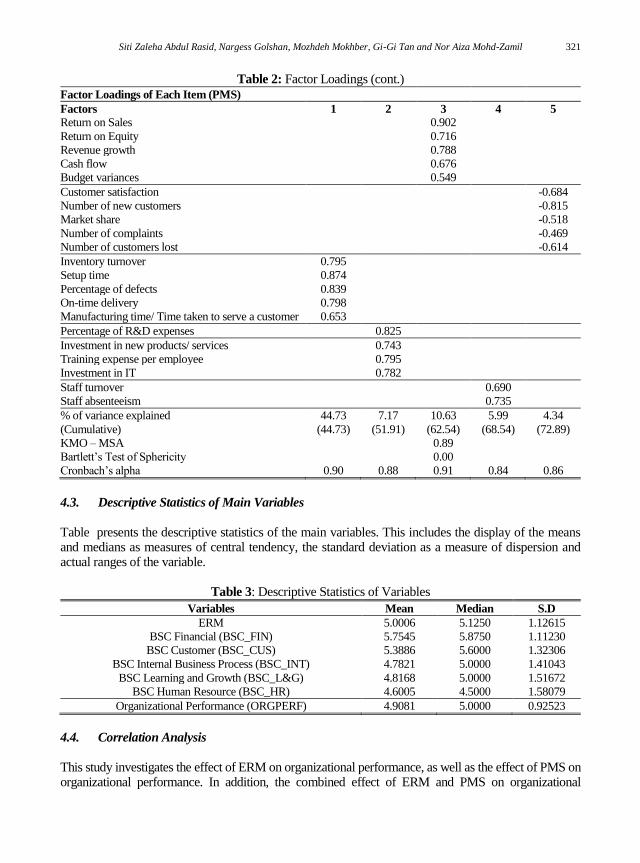
was named “Human Resource” as it describes the human resource issues. The KMO value of 0.899 and the significance of the Bartlett’s test of sphericity show that the data was appropriate for PCA. Factor 1, 2, 3, 4 and 5 accounts for 44.74%, 7.18%, 10.64%, 6% and 4.35% of the total variance respectively. Cronbach’s alpha of 0.904 for factor 1, 0.885 for factor 2, 0.915 for factor 3, 0.843 for factor 4 and 0.866 for factor 5 indicate the internal consistency of the multi-item measures. 4.2.3. Perceived Organizational Performance Measures In this study, organizational performance was viewed as the extent to which the organization has been successful in attaining its planned target or targets. One factor was extracted as shown in Error!
Reference source not found.. The results show that Bartlett’s test of sphericity is significant and the KMO measure is greater than 0.6 indicating that all the items are appropriate to be factor analysed. The factor accounts for 63.44% of the total variance, which is above the satisfactory level of 60% (Hair et al., 2010). A reliability check for this measure produced a Cronbach’s alpha of 0.941, which is considered good (Sekaran & Bougie, 2010).
Table 2: Factor Loadings
Factor Loading for Each Item (ERM)
The level of internal control in my organization is appropriate for the risks faced 0.922
My organization regularly reviews internal controls 0.905
My organization has an effective risk management policy 0.904
Formal procedures are in place for reporting risks 0.900
My organization is effective at prioritizing risks 0.892
Changes to risks are assessed and reported on an on-going basis 0.891
Risks are well understood throughout my organization 0.888
Risk management is embedded in my organization’s culture 0.886
% of variance explained 80.73%
KMO – MSA 0.935
Bartlett’s Test of Sphericity 0.000
Cronbach’s alpha 0.965
Factor Loadings of Each Item (Organizational Performance)
Attainment of target related to productivity 0.836
Attainment of target related to cost 0.833
Attainment of target related to quality 0.814
Attainment of target related to delivery of product/ services 0.811
Attainment of target related to total assets 0.751
Attainment of target related to market share 0.808
Attainment of target related to profit 0.752
Attainment of target related to return on investment 0.783
Attainment of target related to new product introduction 0.738
Attainment of target related to personnel development 0.787
Attainment of target related to overall business performance and practice 0.840
% of variance explained 63.44
KMO – MSA 0.904
Bartlett’s Test of Sphericity 0.000
Cronbach’s alpha 0.941
Factor Loadings of Each Item (PMS)
Factors 1 2 3 4 5
Return on Investment 0.759
Operating margin 0.862
Return on total assets 0.676
Siti Zaleha Abdul Rasid, Nargess Golshan, Mozhdeh Mokhber, Gi-Gi Tan and Nor Aiza Mohd-Zamil 321
Table 2: Factor Loadings (cont.)
Factor Loadings of Each Item (PMS)
Factors 1 2 3 4 5
Return on Sales 0.902
Return on Equity 0.716
Revenue growth 0.788
Cash flow 0.676
Budget variances 0.549
Customer satisfaction -0.684
Number of new customers -0.815
Market share -0.518
Number of complaints -0.469
Number of customers lost -0.614
Inventory turnover 0.795
Setup time 0.874
Percentage of defects 0.839
On-time delivery 0.798
Manufacturing time/ Time taken to serve a customer 0.653
Percentage of R&D expenses 0.825
Investment in new products/ services 0.743
Training expense per employee 0.795
Investment in IT 0.782
Staff turnover 0.690
Staff absenteeism 0.735
% of variance explained
(Cumulative)
44.73
(44.73)
7.17
(51.91)
10.63
(62.54)
5.99
(68.54)
4.34
(72.89)
KMO – MSA 0.89
Bartlett’s Test of Sphericity 0.00
Cronbach’s alpha 0.90 0.88 0.91 0.84 0.86
4.3. Descriptive Statistics of Main Variables
Table presents the descriptive statistics of the main variables. This includes the display of the means and medians as measures of central tendency, the standard deviation as a measure of dispersion and actual ranges of the variable.
Table 3: Descriptive Statistics of Variables
Variables Mean Median S.D
ERM 5.0006 5.1250 1.12615
BSC Financial (BSC_FIN) 5.7545 5.8750 1.11230
BSC Customer (BSC_CUS) 5.3886 5.6000 1.32306
BSC Internal Business Process (BSC_INT) 4.7821 5.0000 1.41043
BSC Learning and Growth (BSC_L&G) 4.8168 5.0000 1.51672
BSC Human Resource (BSC_HR) 4.6005 4.5000 1.58079
Organizational Performance (ORGPERF) 4.9081 5.0000 0.92523
4.4. Correlation Analysis
This study investigates the effect of ERM on organizational performance, as well as the effect of PMS on organizational performance. In addition, the combined effect of ERM and PMS on organizational
322 Enterprise Risk Management, Performance Measurement Systems and Organizational Performance in
Malaysian Public Listed Firms
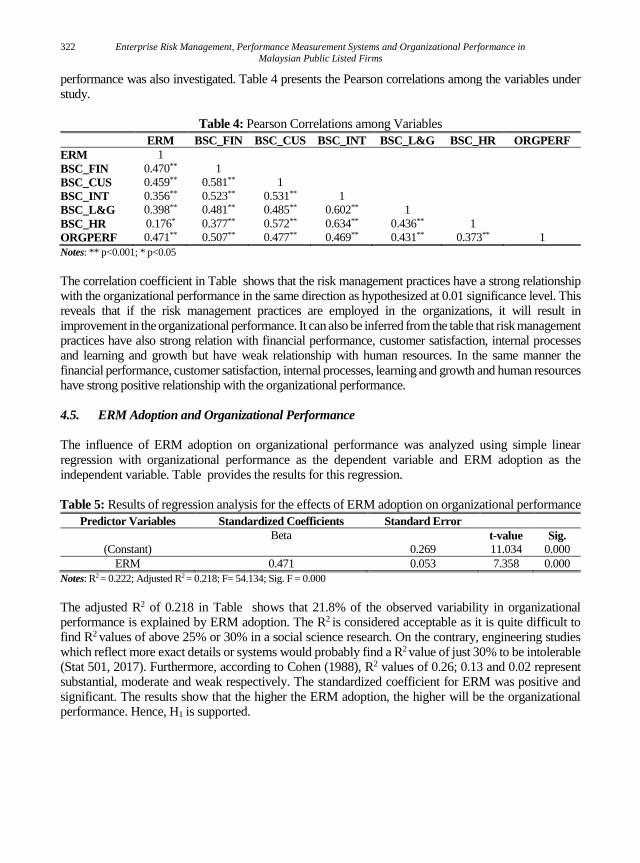
performance was also investigated. Table 4 presents the Pearson correlations among the variables under study.
Table 4: Pearson Correlations among Variables
ERM BSC_FIN BSC_CUS BSC_INT BSC_L&G BSC_HR ORGPERF
ERM 1
BSC_FIN 0.470** 1
BSC_CUS 0.459** 0.581** 1
BSC_INT 0.356** 0.523** 0.531** 1
BSC_L&G 0.398** 0.481** 0.485** 0.602** 1
BSC_HR 0.176* 0.377** 0.572** 0.634** 0.436** 1
ORGPERF 0.471** 0.507** 0.477** 0.469** 0.431** 0.373** 1
Notes: ** p<0.001; * p<0.05
The correlation coefficient in Table shows that the risk management practices have a strong relationship with the organizational performance in the same direction as hypothesized at 0.01 significance level. This reveals that if the risk management practices are employed in the organizations, it will result in improvement in the organizational performance. It can also be inferred from the table that risk management practices have also strong relation with financial performance, customer satisfaction, internal processes and learning and growth but have weak relationship with human resources. In the same manner the financial performance, customer satisfaction, internal processes, learning and growth and human resources have strong positive relationship with the organizational performance. 4.5. ERM Adoption and Organizational Performance
The influence of ERM adoption on organizational performance was analyzed using simple linear regression with organizational performance as the dependent variable and ERM adoption as the independent variable. Table provides the results for this regression. Table 5: Results of regression analysis for the effects of ERM adoption on organizational performance
Predictor Variables Standardized Coefficients Standard Error
Beta t-value Sig.
(Constant) 0.269 11.034 0.000
ERM 0.471 0.053 7.358 0.000
Notes: R2 = 0.222; Adjusted R2 = 0.218; F= 54.134; Sig. F = 0.000
The adjusted R2 of 0.218 in Table shows that 21.8% of the observed variability in organizational performance is explained by ERM adoption. The R2 is considered acceptable as it is quite difficult to find R2 values of above 25% or 30% in a social science research. On the contrary, engineering studies which reflect more exact details or systems would probably find a R2 value of just 30% to be intolerable (Stat 501, 2017). Furthermore, according to Cohen (1988), R2 values of 0.26; 0.13 and 0.02 represent substantial, moderate and weak respectively. The standardized coefficient for ERM was positive and significant. The results show that the higher the ERM adoption, the higher will be the organizational performance. Hence, H1 is supported.
Siti Zaleha Abdul Rasid, Nargess Golshan, Mozhdeh Mokhber, Gi-Gi Tan and Nor Aiza Mohd-Zamil 323
4.6. Performance Measurement System and Organizational Performance
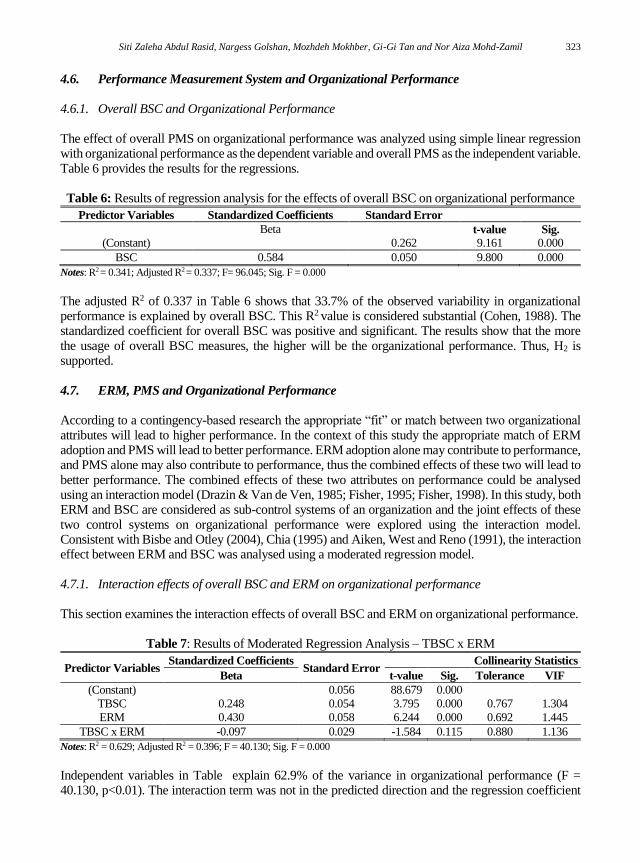
4.6.1. Overall BSC and Organizational Performance The effect of overall PMS on organizational performance was analyzed using simple linear regression with organizational performance as the dependent variable and overall PMS as the independent variable. Table 6 provides the results for the regressions. Table 6: Results of regression analysis for the effects of overall BSC on organizational performance
Predictor Variables Standardized Coefficients Standard Error
Beta t-value Sig.
(Constant) 0.262 9.161 0.000
BSC 0.584 0.050 9.800 0.000
Notes: R2 = 0.341; Adjusted R2 = 0.337; F= 96.045; Sig. F = 0.000
The adjusted R2 of 0.337 in Table 6 shows that 33.7% of the observed variability in organizational performance is explained by overall BSC. This R2 value is considered substantial (Cohen, 1988). The standardized coefficient for overall BSC was positive and significant. The results show that the more the usage of overall BSC measures, the higher will be the organizational performance. Thus, H2 is supported. 4.7. ERM, PMS and Organizational Performance
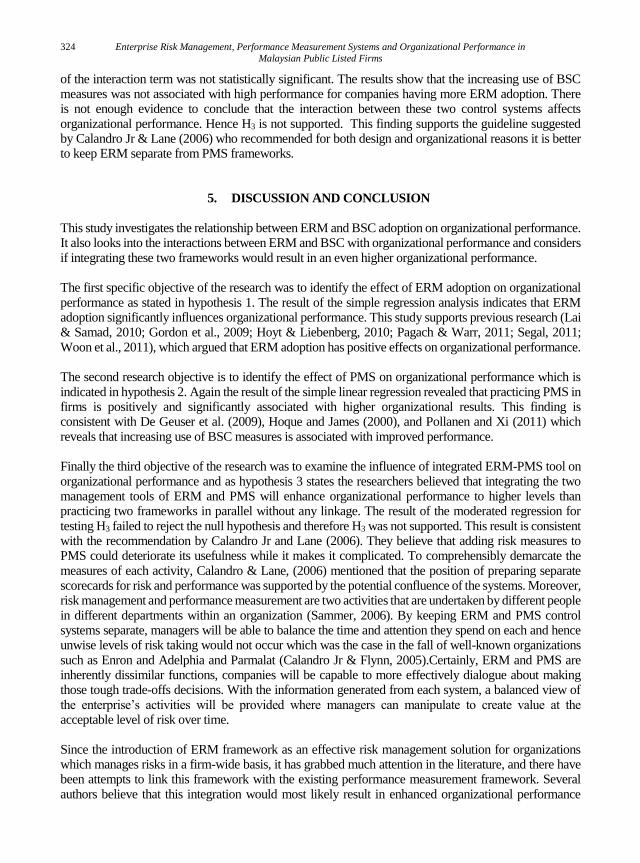
According to a contingency-based research the appropriate “fit” or match between two organizational attributes will lead to higher performance. In the context of this study the appropriate match of ERM adoption and PMS will lead to better performance. ERM adoption alone may contribute to performance, and PMS alone may also contribute to performance, thus the combined effects of these two will lead to better performance. The combined effects of these two attributes on performance could be analysed using an interaction model (Drazin & Van de Ven, 1985; Fisher, 1995; Fisher, 1998). In this study, both ERM and BSC are considered as sub-control systems of an organization and the joint effects of these two control systems on organizational performance were explored using the interaction model. Consistent with Bisbe and Otley (2004), Chia (1995) and Aiken, West and Reno (1991), the interaction effect between ERM and BSC was analysed using a moderated regression model. 4.7.1. Interaction effects of overall BSC and ERM on organizational performance This section examines the interaction effects of overall BSC and ERM on organizational performance.
Table 7: Results of Moderated Regression Analysis – TBSC x ERM
Predictor Variables Standardized Coefficients
Standard Error Collinearity Statistics
Beta t-value Sig. Tolerance VIF
(Constant) 0.056 88.679 0.000
TBSC 0.248 0.054 3.795 0.000 0.767 1.304
ERM 0.430 0.058 6.244 0.000 0.692 1.445
TBSC x ERM -0.097 0.029 -1.584 0.115 0.880 1.136
Notes: R2 = 0.629; Adjusted R2 = 0.396; F = 40.130; Sig. F = 0.000
Independent variables in Table explain 62.9% of the variance in organizational performance (F = 40.130, p<0.01). The interaction term was not in the predicted direction and the regression coefficient
324 Enterprise Risk Management, Performance Measurement Systems and Organizational Performance in
Malaysian Public Listed Firms
of the interaction term was not statistically significant. The results show that the increasing use of BSC measures was not associated with high performance for companies having more ERM adoption. There is not enough evidence to conclude that the interaction between these two control systems affects organizational performance. Hence H3 is not supported. This finding supports the guideline suggested by Calandro Jr & Lane (2006) who recommended for both design and organizational reasons it is better to keep ERM separate from PMS frameworks.
5. DISCUSSION AND CONCLUSION
This study investigates the relationship between ERM and BSC adoption on organizational performance. It also looks into the interactions between ERM and BSC with organizational performance and considers if integrating these two frameworks would result in an even higher organizational performance. The first specific objective of the research was to identify the effect of ERM adoption on organizational performance as stated in hypothesis 1. The result of the simple regression analysis indicates that ERM adoption significantly influences organizational performance. This study supports previous research (Lai & Samad, 2010; Gordon et al., 2009; Hoyt & Liebenberg, 2010; Pagach & Warr, 2011; Segal, 2011; Woon et al., 2011), which argued that ERM adoption has positive effects on organizational performance. The second research objective is to identify the effect of PMS on organizational performance which is indicated in hypothesis 2. Again the result of the simple linear regression revealed that practicing PMS in firms is positively and significantly associated with higher organizational results. This finding is consistent with De Geuser et al. (2009), Hoque and James (2000), and Pollanen and Xi (2011) which reveals that increasing use of BSC measures is associated with improved performance. Finally the third objective of the research was to examine the influence of integrated ERM-PMS tool on organizational performance and as hypothesis 3 states the researchers believed that integrating the two management tools of ERM and PMS will enhance organizational performance to higher levels than practicing two frameworks in parallel without any linkage. The result of the moderated regression for testing H3 failed to reject the null hypothesis and therefore H3 was not supported. This result is consistent with the recommendation by Calandro Jr and Lane (2006). They believe that adding risk measures to PMS could deteriorate its usefulness while it makes it complicated. To comprehensibly demarcate the measures of each activity, Calandro & Lane, (2006) mentioned that the position of preparing separate scorecards for risk and performance was supported by the potential confluence of the systems. Moreover, risk management and performance measurement are two activities that are undertaken by different people in different departments within an organization (Sammer, 2006). By keeping ERM and PMS control systems separate, managers will be able to balance the time and attention they spend on each and hence unwise levels of risk taking would not occur which was the case in the fall of well-known organizations such as Enron and Adelphia and Parmalat (Calandro Jr & Flynn, 2005).Certainly, ERM and PMS are inherently dissimilar functions, companies will be capable to more effectively dialogue about making those tough trade-offs decisions. With the information generated from each system, a balanced view of the enterprise’s activities will be provided where managers can manipulate to create value at the acceptable level of risk over time. Since the introduction of ERM framework as an effective risk management solution for organizations which manages risks in a firm-wide basis, it has grabbed much attention in the literature, and there have been attempts to link this framework with the existing performance measurement framework. Several authors believe that this integration would most likely result in enhanced organizational performance
Siti Zaleha Abdul Rasid, Nargess Golshan, Mozhdeh Mokhber, Gi-Gi Tan and Nor Aiza Mohd-Zamil 325
(Beasley et al., 2006; e.g see Calandro Jr & Lane, 2006; Nagumo, 2005; Maziol, 2009; Woods, 2007), however all these studies are either conceptual studies or case studies focusing on either one or a few number of firms. To the authors’ knowledge there is still no empirical study investigating if the linked ERM-PMS framework would lead to higher levels of performance. This research study fills the gap in the literature by testing empirically if the linked framework of ERM-PMS would result in enhanced organizational performance. The findings of this study reveal that although both ERM and PMS utilization by firms would result in increased organizational performance, linking these two frameworks would not lead to higher levels of organizational performance. In the light of the findings, there are several important implications that need to be addressed by top management of organizations, especially the public listed ones which were the samples for this research. Nowadays, information is a crucial asset of an organization, thus availability and use of sophisticated information provided by PMS and ERM systems are required to make better decisions. ERM provides information on the risks that the organization encounters. PMS provides information on the performance measures the firm has chosen. Moreover the findings of this study indicated that organizations who have adopted ERM and PMS are experiencing better results. Therefore organizations should focus on effective and efficient programs for their risk management and performance measurements. The other implication of the finding is that linking ERM and PMS frameworks together would not necessarily result in a significantly better organizational performance and that it would even deteriorate it. Hence, it is better that firms would employ these frameworks separately and different departments focus on each of them. Managers should equally focus their attention and time for each of PMS and ERM. In other words the new ERM phenomenon should obtain equal attention as PMS and both should be aligned with firm’s strategies to provide the best results for the firm. Moreover adhering to ERM and PMS assists in meeting the compliances of Code of Corporate Governance. The findings of this study also have some policy implications. Regulatory bodies of publically listed companies in Malaysia must emphasize the importance of having effective ERM and PMS programs as internal reporting and control functions that supports transparency in external reporting. Although the public listed companies should have an effective performance measurement and risk management programs as a part of compliance with the Code of Corporate Governance (SCM, 2012), the positive effect of these two management control systems on organizational performance as demonstrated by this study, highlights the importance of having effective ERM and PMS.
REFERENCES
Acharyya, M. (2007). Proposing a conceptual framework to measure the performance of Enterprise Risk Management from an empirical study of four major European insurers. Paper presented at The 34th Seminar of the European Group of Risk and Insurance Economists, University of Cologne, Cologne.
Aiken, L. S., West, S. G., & Reno, R. R. (1991). Multiple regression: Testing and interpreting interactions. California: Sage Publications, Inc.
Amaratunga, D., & Baldry, D. (2002). Moving from performance measurement to performance management. Facilities, 20(5/6), 217-223.
Arena, M., & Arnaboldi, M. (2014). Risk and performance management: are they easy partners? Management Research Review, 37(2), 152-166.
Ballou, B., & Heitger, D. (2011). Coordinating Risk Management and Performance Measurement. Accounting Policy and Practice Series.
326 Enterprise Risk Management, Performance Measurement Systems and Organizational Performance in
Malaysian Public Listed Firms
Ballou, B., Brewer, P. C., & Heitger, D. L. (2006). Integrating the balanced scorecard and enterprise risk management. Internal Auditing-Boston-Warren Gorham And Lamont Incorporated-, 21(3), 34-38.
Banham, R. (2004). Enterprising views of risk management: Businesses can use ERM to manage a wide variety of risks. Journal of Accountancy, 197(6), 14-20.
Banker, R. D., Potter, G., & Srinivasan, D. (2000). An empirical investigation of an incentive plan that includes nonfinancial performance measures. The Accounting Review, 75(1), 65-92.
Beamon, B. M. (1996). Performance measures in supply chain management. Proceedings of the 1996 Conference on Agile and Intelligent Manufacturing Systems. NY: Rensselaer Polytechnic Institute.
Beasley, M. S., Clune, R., & Hermanson, D. R. (2005). Enterprise risk management: An empirical analysis of factors associated with the extent of implementation. Journal of Accounting and Public Policy, 24(6), 521-531. doi: 10.1016/j.jaccpubpol.2005.10.001
Beasley, M. S., Clune, R., & Hermanson, D. R. (2006). The impact of enterprise risk management on the internal audit function. Kennesaw, GA: DigitalCommons@Kennesaw State University.
Beasley, M., Chen, A., Nunez, K., & Wright, L. (2006). Working hand in hand: Balanced scorecards and enterprise risk management. Strategic Finance, 87(9), 49-55.
Beasley, M., Pagach, D., & Warr, R. (2008). Information conveyed in hiring announcements of senior executives overseeing enterprise-wide risk management processes. Journal of Accounting, Auditing & Finance, 23(3), 311-332.
Bessis, J. (2011). Risk management in banking. Chichester: John Wiley& Sons. Bisbe, J., & Otley, D. (2004). The effects of the interactive use of management control systems on
product innovation. Accounting, Organizations and Society, 29(8), 709-737. Calandro Jr, J., & Flynn, R. (2005). Premium growth, underwriting return and segment analysis.
Measuring Business Excellence, 9(4), 27-36. Calandro Jr, J., & Lane, S. (2006). An introduction to the enterprise risk scorecard. Measuring Business
Excellence, 10(3), 31-40. Casualty Actuarial Society (CAS). (2003). Overview of Enterprise Risk Management Committee
Report. Arlington: Casualty Actuarial Society Forum. Chenhall, R. H., & Langfield-Smith, K. (2003). Performance measurement and reward systems, trust,
and strategic change. Journal of Management Accounting Research, 15(1), 117-143. Chia, Y. M. (1995). Decentralization, management accounting system (MAS) information
characteristics and their interaction effects on managerial performance: a Singapore study. Journal of Business Finance & Accounting, 22(6), 811-830.
Choong, K. K. (2013). Understanding the features of performance measurement system: a literature review. Measuring Business Excellence, 17(4), 102-121.
Cohen, J. (1988). Statistical Power Analysis for the Behavioral Sciences (2nd Ed.). Hillsdale, NJ: Lawrence Earlbaum Associates.
Collier, N., Fishwick, F., & Floyd, S. W. (2004). Managerial involvement and perceptions of strategy process. Long Range Planning, 37(1), 67-83.
Colquitt, L. L., Hoyt, R. E., & Lee, R. B. (1999). Integrated risk management and the role of the risk manager. Risk Management and Insurance Review, 2(3), 43-61.
Committee of Sponsoring Organizations of the Treadway Commission (COSO). (2004). Enterprise Risk Management-Integrated Framework. New Jersey: COSO.
Cummins, J. D., Phillips, R. D., & Smith, S. D. (1998). The rise of risk management. Economic review - Federal Reserve bank of Atlanta, 83(1), 30-40.
Daud, W. N. W., Yazid, A. S., & Hussin, H. M. R. (2010). The effect of chief risk officer (CRO) on enterprise risk management (ERM) practices: Evidence from Malaysia. International Business & Economics Research Journal, 9(11), 55-64.
De Geuser, F., Mooraj, S., & Oyon, D. (2009). Does the balanced scorecard add value? Empirical evidence on its effect on performance. European Accounting Review, 18(1), 93-122.
Siti Zaleha Abdul Rasid, Nargess Golshan, Mozhdeh Mokhber, Gi-Gi Tan and Nor Aiza Mohd-Zamil 327
Drazin, R., & Van de Ven, A. H. (1985). Alternative forms of fit in contingency theory. Administrative science quarterly, 30(4), 514-539.
Fisher, J. (1995). Contingency-based research on management control systems: Categorization by level of complexity. Journal of Accounting Literature, 14, 24-53.
Fisher, J. G. (1998). Contingency theory, management control systems and firm outcomes: Past results and future directions. Behavioral Research in Accounting, 10, 47-64.
Florio, C., & Leoni, G. (2017). Enterprise risk management and firm performance: The Italian case. The British Accounting Review, 49(1), 5-74.
Gordon, L. A., Loeb, M. P., & Tseng, C. Y. (2009). Enterprise risk management and firm performance: A contingency perspective. Journal of Accounting and Public Policy, 28(4), 301-327.
Hair Jr, J. F., Black, W. C., Babin, B. J. & Anderson, R. E. (2010). Multivariate data analysis. Essex: Prentice Hall.
Hoque, Z., & James, W. (2000). Linking balanced scorecard measures to size and market factors: Impact on organizational performance. Journal of Management Accounting Research, 12(1), 1-17.
Hoyt, R. E., & Liebenberg, A. P. (2011). The value of enterprise risk management. The Journal of Risk and Insurance, 78(4), 795-822.
Ittner, C. D., & Larcker, D. F. (1998). Innovations in performance measurement: Trends and research implications. Journal of Management Accounting Research, 10, 205-238.
Kalender, Z. T., & Vayvay, Ö. (2016). The Fifth Pillar of the Balanced Scorecard: Sustainability. Procedia-Social and Behavioral Sciences, 235, 76-83.
Kaplan, R. S., & Norton, D. P. (1992). The balanced scorecard--measures that drive performance. Harvard business review, 70(1), 71-79.
Kaplan, R. S., & Norton, D. P. (1996). Using the balanced scorecard as a strategic management system. Harvard business review, 74(1), 75-85.
Kaplan, R. S., & Norton, D. P. (2001). Transforming the balanced scorecard from performance measurement to strategic management: Part 1. Accounting Horizons, 15(1), 87-104.
Khameneh, A. H., Taheri, A., & Ershadi, M. (2016). Offering a Framework for Evaluating the Performance of Project Risk Management System. Procedia-Social and Behavioral Sciences, 226, 82-90.
Khandwalla, P. N. (1977). The design of organizations. New York: Harcourt Brace Jovanovich. Kleffner, A. E., Lee, R. B., & McGannon, B. (2003). The effect of corporate governance on the use of
enterprise risk management: Evidence from Canada. Risk Management and Insurance Review, 6(1), 53-73.
Lai, F-W., & Samad, F. A. (2010). Enterprise risk management framework and the empirical determinants of its implementation. Proceedings of the 2010 International Conference on Business and Economics Research. Kuala Lumpur, Malaysia: IACSIT Press.
Liebenberg, A. P., & Hoyt, R. E. (2003). The determinants of enterprise risk management: Evidence from the appoitnment of chief risk officers. Risk Management and Insurance Review, 6(1), 37-52. doi: 10.1111/1098-1616.00019/.
Maziol, S. (2009). Risk management: Protect and maximize stakeholder value. California, USA: Oracle Corporation.
McWhorter, L. B., Matherly, M., & Frizzell, D. M. (2006). The connection between performance measurement and risk management. Strategic Finance-Montvale, 87(8), 50-55.
Mia, L., & Clarke, B. (1999). Market competition, management accounting systems and business unit performance. Management Accounting Research, 10(2), 137-158.
Miccolis, J., & Shah, S. (2000). Enterprise risk management – An analytic approach. New Jersey: Tillinghast –Towers Perrin Monograph.
Nagumo, T. (2005). Aligning enterprise risk management with strategy through the BSC: The Bank of Tokyo-Mitsubishi approach. Balanced Scorecard Report, September-October, 3-6.
328 Enterprise Risk Management, Performance Measurement Systems and Organizational Performance in
Malaysian Public Listed Firms
Neely, A., Gregory, M., & Platts, K. (2005). Performance measurement system design: A literature review and research agenda. International Journal of Operations & Production Management, 25(12), 1228-1263.
Niven, P. R. (2002). Balanced scorecard step-by-step: Maximizing performance and maintaining results. New York:John Wiley& Sons, Inc.
Olson, D. L., & Wu, D. (2010). Enterprise Risk Management Models. Heidelberg: Springer. Otley, D. (1999). Performance management: a framework for management control systems research.
Management Accounting Research, 10(4), 363-382. Pagach, D., & Warr, R. (2011). The characteristics of firms that hire chief risk officers. Journal of Risk
and Insurance, 78(1), 185-211. Pollanen, R., & Xi, K. K. (2011). The Use of Balanced Scorecard Measures in Executive Incentives and
Firm Performance. Paper presented at the CAAA Annual Conference 2011, Toronto, Canada. Rochette, M. (2009). From risk management to ERM. Journal of Risk Management in Financial
Institutions, 2(4), 394-408. Sammer, J. (2006). Measuring the cost of risk. Business Finance, March, 49-52. Saraiva, H. I. B., & Alves, M. C. G. (2015). The use of the Balanced Scorecard in Portugal: Evolution
and effects on management changes in Portuguese large companies. Tékhne, 13(2), 82-94. Scholey, C. (2006). Risk and the balanced scorecard. CMA Management, 32, 32-35. Securities Commission Malaysia (SCM). (2012). Malaysian Code on Corporate Governance. Kuala
Lumpur, Malaysia: Securities Commission Malaysia. Segal, S. (2011). Corporate Value of Enterprise Risk Management: The Next Step in Business
Management (Vol. 3). Hoboken: John Wiley & Sons, Inc. Sekaran, U. (2006). Research methods for business: A skill building approach (4th Edition). New Delhi:
Wiley India Pvt. Limited. Sekaran, U., & Bougie, R. (2010). Research methods for business: A skill building approach (5th
Edition). Chichester: John Wiley & Sons. Soin, K. (2005). Risk, regulation and the role of management accounting and control in UK financial
services. Paper presented at the Critical Perspectives in Accounting Conference, Baruch College at the City University of New York, New York.
Stat 501. (2017). The Coefficient of Determination, R-squared. Retrieved from https://onlinecourses.science.psu.edu/stat501
Stemsrudhagen, J. I. (2004). The structure of balanced scorecards: Empirical evidence from Norwegian manufacturing industry. In M. J. Epstein & J. Manzoni (Eds.), Studies in Managerial and Financial Accounting: Performance Measurement and Managerial Control: Superior Organizational Performancce (pp. 303-321). Oxford, UK: Elsevier.
Subramaniam, N., Collier, P., Phang, M., & Burke, G. (2011). The effects of perceived business uncertainty, external consultants and risk management on organisational outcomes. Journal of Accounting &Organizational Change, 7(2), 132-157.
Tapinos, E., Dyson, R. G., & Meadows, M. (2011). Does the Balanced Scorecard make a difference to the strategy development process? Journal of the Operational Research Society, 62(5), 888-899.
Thekdi, S., & Aven, T. (2016). An enhanced data-analytic framework for integrating risk management and performance management. Reliability Engineering & System Safety, 156, 277-287.
Woods, M. (2007). Linking risk management to strategic controls: A case study of Tesco plc. International Journal of Risk Assessment and Management, 7(8), 1074-1088.
Woon, L. F., Azizan, N. A., & Samad, M. F. A. (2011). A Strategic Framework For Value Enhancing Enterprise Risk Management. Journal of Global Business and Economics, 2(1), 23-48.