enterprise surveys country profile tanzania · enterprise surveys country profile tanzania 2006 ......
TRANSCRIPT

Enterprise SurveysCountry Profile
Tanzania2006
Region: AfricaIncome Group: Low Income
Population(2006): 38.4 millionGNI per capita (2006): US$340
http://www.EnterpriseSurveys.org
PUT COUNTRY MAP HERE
World Bank, 1818 H Street, N.W. Washington DC, 20433 Tel. (202) 458-4808 Fax (202) 522-2029 Email: [email protected]

Introduction 3Snapshot 4Infrastructure 5Finance 6Labor Force 7Corruption & Regulatory Burden 8Courts & Crime 9Innovations & Technology 10Trade 11
Summary of Enterprise Survey Indicators 12

Introduction
http://www.enterprisesurveys.org Country Profile: TANZANIA 3
Enterprise Surveys The Enterprise Surveys focus on the many factors that shape the decisions of firms to invest. These factors can be accommodating or constraining and play an important role in whether a country will prosper or not. An accommodating business environment is one that encourages firms to operate efficiently. Such conditions strengthen incentives for firms to innovate and to increase productivity—key factors for sustainable development. A more productive private sector, in turn, expands employment and contributes taxes necessary for public investment in health, education, and other services. In contrast, a poor business environment increases the obstacles to conducting business activities and decreases a country’s prospects for reaching its potential in terms of employment, production, and welfare. Enterprise Surveys are conducted by the World Bank and its partners across all geographic regions and cover small, medium, and large companies. The surveys are applied to a representative sample of firms in the non-agricultural economy. The sample is consistently defined in all countries and includes the entire manufacturing sector, the services sector, and the transportation and construction sectors. Public utilities, government services, health care, and financial services sectors are not included in the sample. Enterprise Surveys collect a wide array of qualitative and quantitative information through face-to-face interviews with firm managers and owners regarding the business environment in their countries and the productivity of their firms. The topics covered in Enterprise Surveys include the obstacles to doing business, infrastructure, finance, labor, corruption and regulation, law and order, innovation and technology, trade, and firm productivity. The qualitative and quantitative data collected through the surveys connect a country’s business environment characteristics with firm productivity and performance. The Enterprise Survey database is intended to be useful for both policymakers and researchers. The surveys are to be repeated over time to track changes and benchmark the effects of reforms on firm performance. Country Profiles The Country Profiles produced by the Enterprise Analysis Unit (FPDEA) of the World Bank Group provide an overview of key business environment indicators in each country, benchmarking against their respective geographic region and group of countries with similar incomes. Breakdowns by firm size are presented in the Appendix of the document along with all statistics used to make the graphs. The same topics are covered for all countries with slight variations in indicators (subject to data availability). This format allows cross country comparisons. All indicators are based on the responses of firms. To learn more about the firms sampled for this country profile (tabulations for these and other indicators by industry, exports, and type of ownership) or to obtain profiles of other countries, please visit the web page http://www.enterprisesurveys.org. Currently available at the Enterprise Survey website are survey results on the business environment in over 97 countries, based on data from more than 61,000 firms.

http://www.enterprisesurveys.org Enterprise Surveys: TANZANIA 4
AMÉRICA LATINA Y EL CARIBE 2006
Snapshot of the Business Environment in Tanzania
TanzaniaThe country profile for Tanzania is based on data from the Enterprise Surveys conducted by the WorldBank in 2006. The benchmarks include the averages for the group of countries in Africa and theTanzania income group.
Below is a snapshot of the constraints to investment and doing business as perceived by firms. Thefirst graph presents the top 10 constraints as identified by firms in Tanzania benchmarked against theregional average. The second graph shows the top 3 constraints broken down by large medium, andsmall firms in Tanzania.
Percent of Firms Identifying the Problem as the Main Obstacle
0
10
20
30
40
50
60
70
80
Electricity Access toFinancing
(Availabilityand Cost)
Tax Rates Transportation Access to Land Crime, Theftand Disorder
Skills andEducation of
AvailableWorkers
Anti-Competitive or
InformalPractices
TaxAdministration
BusinessLicensing and
OperatingPermits
Africa
0
10
20
30
40
50
60
70
80
90
100
Electricity Access toFinancing
(Availabilityand Cost)
Transportation Electricity Tax Rates Access toFinancing
(Availabilityand Cost)
Electricity Tax Rates Access toFinancing
(Availabilityand Cost)
Small firms(1-19 employees)
Medium firms(20-99 employees)
Large firms(100 employees or more)
Percent of Firms Identifying the Problem as the Main Obstacle

http://www.enterprisesurveys.org Enterprise Surveys: TANZANIA 5
Infrastructure A strong infrastructure enhances the competitiveness of an economy and improves the quality of life of the population. Good infrastructure connects firms to their customers and suppliers, and enables the use of modern production technologies. Conversely, deficiencies in infrastructure create barriers to productive opportunities and increase costs for all firms, from micro-enterprises to large multinational corporations. Enterprise Surveys capture the dual challenge of providing strong infrastructure: the physical construction of roads, power lines, water systems, etc., and the development of institutions that effectively provide and maintain public services. The first set of indicators shows the extent to which firms perceive two components of infrastructure as constraints: transportation and electricity. Inadequate transportation and problems with electricity increase costs, disrupt production, and lower revenue. The second set of indicators measures the quality of infrastructure: the number of power outages and insufficiencies in water supply per month and losses due to power outages. The third set of indicators evaluates the efficiency of infrastructure services by quantifying the delays in obtaining electricity, water, and telephone connections. Service delays impose additional costs on firms and may act as barriers to entry and investment.
Service Delays
0
5
10
15
20
25
30
35
40
45
50
Delays in ObtainingElectricity Connections
(Days)
Delays in ObtainingWater Connections
(Days)*
Delays in ObtainingTelephone
Connections (Days)
Day
s
Tanzania Africa Low Income
Infrastructure as a Constraint
0
10
20
30
40
50
60
70
80
90
100
% of Firms IdentifyingTransportation as a Major
Constraint
% of Firms Identifying Electricityas a Major Constraint
Perc
ent
of F
irms
Tanzania Africa Low Income
0
2
4
6
8
10
12
% of Sales Lost to PowerOutages
Perc
ent
* Manufacturing Sector
Quality of Infrastructure
* Manufacturing Sector
Tanzania Africa Low Income
0
2
4
6
8
10
12
14
16
18
Incidents/TypicalMonth of Power
Outages
Incidents/Yearof InsufficientWater Supply*
Inci
dent
s in
a T
ypic
al M
onth
http://www.enterprisesurveys.org Enterprise Surveys: TANZANIA 6
Access to Finance as a Constraint
0
10
20
30
40
50
60
% of Firms IdentifyingAccess/Cost of Finance as a Major
Constraint
% of Firms Using Banks toFinance Investments or Expenses
Perc
ent
of F
irms
Tanzania Africa Low Income
0
2
4
6
8
10
12
% of Firms with BankLoans/Line of Credit
Perc
ent
of F
irms
Value of Collateral
110
115
120
125
130
135
140
145
Value of Collateral (% ofLoan Value)
Perc
ent
How Firms Finance Investment
0 20 40 60 80 100
Low Income
Africa
Tanzania
% of Investments Financed by Internal Funds% of Investments Financed by Banks% of Investments Financed by Trade Credits% of Investments Financed by Equity% of Investments Financed by Other Sources
Access to Finance
Tanzania Africa Low Income
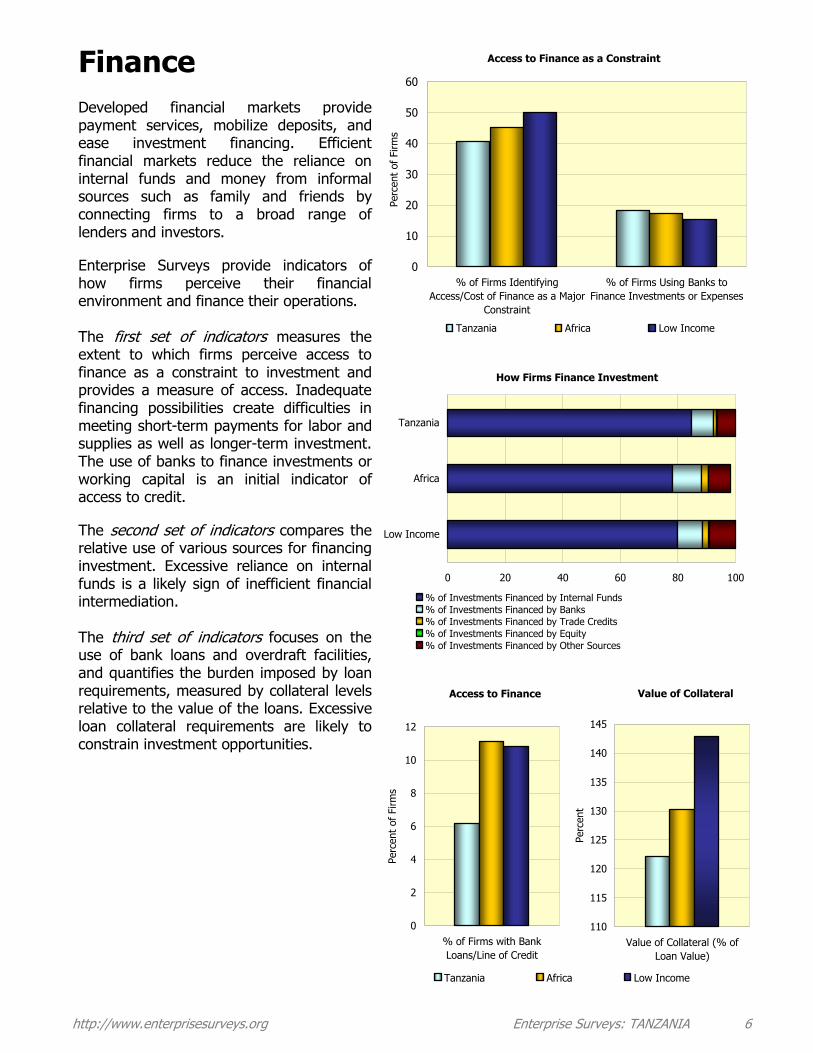
Finance Developed financial markets provide payment services, mobilize deposits, and ease investment financing. Efficient financial markets reduce the reliance on internal funds and money from informal sources such as family and friends by connecting firms to a broad range of lenders and investors. Enterprise Surveys provide indicators of how firms perceive their financial environment and finance their operations. The first set of indicators measures the extent to which firms perceive access to finance as a constraint to investment and provides a measure of access. Inadequate financing possibilities create difficulties in meeting short-term payments for labor and supplies as well as longer-term investment. The use of banks to finance investments or working capital is an initial indicator of access to credit. The second set of indicators compares the relative use of various sources for financing investment. Excessive reliance on internal funds is a likely sign of inefficient financial intermediation. The third set of indicators focuses on the use of bank loans and overdraft facilities, and quantifies the burden imposed by loan requirements, measured by collateral levels relative to the value of the loans. Excessive loan collateral requirements are likely to constrain investment opportunities.

http://www.enterprisesurveys.org Enterprise Surveys: TANZANIA 7
Labor Jobs are the main source of income for people—and the main pathway out of poverty for the poor. A sound investment climate contributes to the creation of employment opportunities, investment in the workforce, increases in wages, and, ultimately, a more productive and prosperous society. Enterprise Surveys collect information on the labor market constraints faced by firms and also on the characteristics of workers in the firms surveyed. The first set of indicators measures the extent to which firms perceive labor regulations and labor skill level as constraints. The second set of indicators highlights firm investment in the skills and capabilities of their workforce. Incidence and intensity of training is measured by the percent of manufacturing firms that offer formal training and the share of workers receiving training. The quality of labor is measured by the share of skilled workers in the manufacturing industry. The third set of indicators presents the composition of the firms’ workforce by type of contract and gender. Labor regulations have a direct effect on the type of employment and may have a differentiated impact by gender. The first two indicators present the composition of the workforce broken down by permanent and temporary workers. The following indicator reflects the participation of women in temporary employment.
Labor Regulations and Labor Force Education as a Constraint
0
5
10
15
20
25
% of Firms Identifying LaborRegulations as a Major Constraint
% of Firms Identifying Labor SkillLevel as a Major Constraint
Perc
ent
of F
irms
Tanzania Africa Low Income
Invesment in the Working Force
0
10
20
30
40
50
60
70
% of Firms OfferingFormal Training
% of WorkersOffered Formal
Training
% of SkilledProduction Workers
Perc
ent
Tanzania Africa Low Income
Labor Force Composition
0
10
20
30
Permanent FullTime Workers
TemporaryWorkers
Aver
age
Num
ber
of W
orke
rs
Percent of Temporary Female Workers
0
10
20
30
40
Tanzania Africa LowIncome
Perc
ent
Tanzania Africa Low Income

http://www.enterprisesurveys.org Enterprise Surveys: TANZANIA 8
Corruption and Regulatory Burden The regulatory environment plays a significant role in shaping investment decisions and how firms do business. Effective regulations address market failures that inhibit productive investment and reconcile private and public interests. Conversely, inefficient regulations present major administrative and financial burdens on firms. In some environments, regulations present opportunities for soliciting bribes when firms are required to make “unofficial” payments to public officials to get things done. Enterprise Surveys provide qualitative and quantitative measures of corruption and regulatory burdens. The first set of indicators focuses on the perception of firms regarding corruption and the share of firms making unofficial payments, i.e., paying the “bribe tax”. The second set of indicators identifies the extent to which specific regulatory and administrative officials require bribe payments with tax payments or to obtain a license. The third set of indicators captures the “time tax” imposed by regulation. The first indicator measures the time spent by senior management in meetings with public officials in order to comply with government regulations and the second measures the average number of tax inspections or meetings with tax inspectors.
Bribe Tax
0
5
10
15
20
25
30
35
% of Firms Expectedto Give Gifts in
Meetings with TaxInspectors
% of Firms Expectedto Give Gifts to
Obtain OperatingLicenses
% of Firms Expectedto Give Gifts toObtain Import
Licenses
Perc
ent
of F
irms
Tanzania Africa Low Income
Regulation Time Tax
0
1
2
3
4
5
6
7
8
Tanzania Africa Low Income
Perc
ent
of
Tim
e
0
0.5
1
1.5
2
2.5
3
3.5
4
4.5
Meetings /Year
% Senior Management Time Dealing with GovernmentRegulations
Time Spent in Tax Inspection Meetings (Meetings/Year)
17
18
19
20
21
22
23
24
% of Firms IdentifyingCorruption as Major
Constraint
Perc
ent
of F
irms
0
5
10
15
20
25
30
35
40
45
50
55
60
65
% Firms Making UnofficialPayments to Get Things
Done
Perc
ent
of F
irms
Corruption
Tanzania Africa Low Income
http://www.enterprisesurveys.org Enterprise Surveys: TANZANIA 9
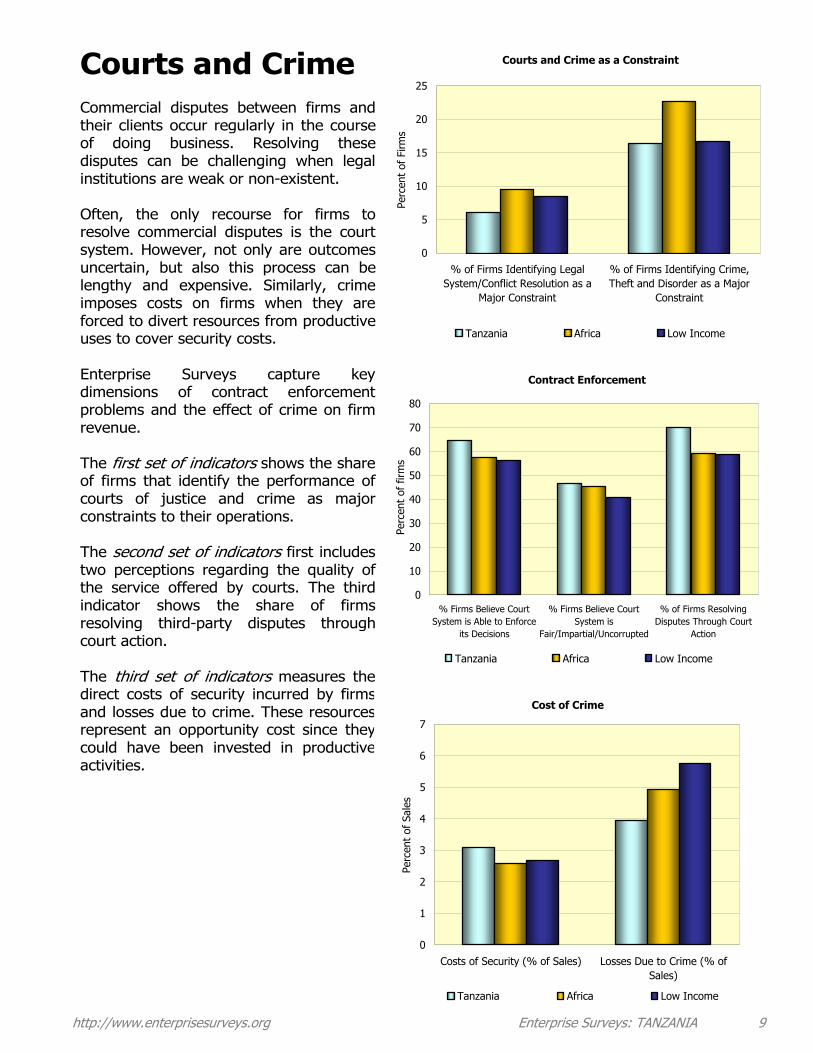
Courts and Crime Commercial disputes between firms and their clients occur regularly in the course of doing business. Resolving these disputes can be challenging when legal institutions are weak or non-existent. Often, the only recourse for firms to resolve commercial disputes is the court system. However, not only are outcomes uncertain, but also this process can be lengthy and expensive. Similarly, crime imposes costs on firms when they are forced to divert resources from productive uses to cover security costs. Enterprise Surveys capture key dimensions of contract enforcement problems and the effect of crime on firm revenue. The first set of indicators shows the share of firms that identify the performance of courts of justice and crime as major constraints to their operations. The second set of indicators first includes two perceptions regarding the quality of the service offered by courts. The third indicator shows the share of firms resolving third-party disputes through court action. The third set of indicators measures the direct costs of security incurred by firms and losses due to crime. These resources represent an opportunity cost since they could have been invested in productive activities.
Courts and Crime as a Constraint
0
5
10
15
20
25
% of Firms Identifying LegalSystem/Conflict Resolution as a
Major Constraint
% of Firms Identifying Crime,Theft and Disorder as a Major
Constraint
Perc
ent
of F
irms
Tanzania Africa Low Income
Contract Enforcement
0
10
20
30
40
50
60
70
80
% Firms Believe CourtSystem is Able to Enforce
its Decisions
% Firms Believe CourtSystem is
Fair/Impartial/Uncorrupted
% of Firms ResolvingDisputes Through Court
Action
Perc
ent
of f
irms
Tanzania Africa Low Income
Cost of Crime
0
1
2
3
4
5
6
7
Costs of Security (% of Sales) Losses Due to Crime (% ofSales)
Perc
ent
of S
ales
Tanzania Africa Low Income

http://www.enterprisesurveys.org Enterprise Surveys: TANZANIA 10
Innovation and Technology In order to survive and prosper in a competitive marketplace, firms must innovate and increase their productivity. A sound investment climate encourages firms to experiment and learn; it rewards success and punishes failure. Enterprise Surveys provide indicators that describe several dimensions of technological efficiency and innovation. The first set of indicators measures the extent to which manufacturing firms invest in industry-recognized level of quality as well as the share of firms undertaking innovation. In this context, innovation encompasses the development or upgrade of product lines and the introduction of new production technologies. The second set of indicators quantifies the effect of foreign and domestic competition in lowering production costs for manufacturing firms. The third set of indicators demonstrates the use of information and communications technologies (ICT) in business transactions. ICT, such as the Internet, are important tools for all firms because they provide even the smallest of enterprises with the ability to reach national and international markets at low cost.
Use of Internet
0
10
20
30
40
50
% of Firms Using E-mail toInteract with
Buyers/Suppliers/Customers
% of Firms Using Website toInteract with
Buyers/Suppliers/Customers
Perc
ento
f Fi
rms
Tanzania Africa Low Income
0
2
4
6
8
10
12
14
16
% of Firms With anInternationally-Recognized
Quality Certification
Perc
ent
of F
irms
54
56
58
60
62
64
66
68
70
72
% of Firms UndertakingInnovation
Perc
ent
of F
irms
0
10
20
30
40
50
60
70
80
% of Firms Identifying ForeignCompetition as Important
Influence in Lowering ProductionCosts
% of Firms Identifying DomesticCompetition as Important
Influence in Lowering ProductionCosts
Perc
ent
of F
irms
Tanzania Africa Low Income
Innovative Capability of the Manufacturing Sector
External Competition as Driver of Efficiency
Tanzania Africa Low Income

http://www.enterprisesurveys.org Enterprise Surveys: TANZANIA 11
Customs and Trade Regulations as a Constraint
0
2
4
6
8
10
12
14
16
18
% of Firms That Trade % of Firms That TradeIdentifying Customs & Trade
Regulations as a Major Constraint
Perc
ent
of F
irms
Tanzania Africa Low Income
Inefficiencies in Customs
0
2
4
6
8
10
12
14
16
Days on Average to Claim ImportsFrom Customs*
Days on Average to Clear Customsfor Exports
Day
s
Tanzania Africa Low Income* Manufacturing Sector
Exports Activity
0
0.5
1
1.5
2
2.5
3
3.5
% Value of Exports Lost Due toTheft
% Value of Exports Lost Due toBreakage or Spoilage
Perc
ent
Tanzania Africa Low Income
Trade Open markets allow firms to expand, force greater efficiencies on exporters, and enable the import of lower-cost supplies. However, trading also forces firms to deal with customs services and trade regulations, obtain export and import licenses, and in some cases, face additional costs due to losses during transport. Enterprise Surveys collect information on the constraints faced by exporters and importers and also capture the trade activity of firms. The first set of indicators shows the extent to which firms that trade directly, i.e. those that export or import without going through a distributor, consider customs and trade regulations to be a constraint. The second set of indicators measures the average number of days to clear customs for imports and exports. The delay in clearing customs for imports or exports creates additional costs to the firm and can interrupt production, interfere with sales, and result in damaged supplies or merchandise. The third set of indicators shows the percent value of exports lost during transport due to theft or merchandise breakage or spoilage, reflecting the transport risks that firms must cover during the export process.

TanzaniaSmall (1-19
employees)
Medium (20-99
employees)
Large (100+ employees)
Africa Low Income
Electricity 73.6 70.1 79.0 91.4 37.2 48.7
Transportation 3.2 4.0 1.8 0.0 4.0 4.6
Access to Land 2.6 3.4 0.8 0.0 3.6 3.2
Tax Rates 3.9 3.1 6.9 2.9 10.6 9.5
Tax Administration 0.7 0.6 1.2 0.8 1.5 1.8
Customs and Trade Regulations 0.3 0.0 1.3 0.0 2.5 2.5
Labor Regulations 0.0 0.0 0.0 0.0 0.6 0.0
Skills and Education of Available Workers 1.5 2.1 0.0 0.0 2.9 1.3
Business Licensing and Operating Permits 0.5 0.6 0.5 0.0 2.2 0.9
Access to Financing (Availability and Cost) 9.5 11.6 5.2 1.7 14.5 14.0
Political Instability 0.5 0.7 0.0 0.0 2.6 3.5
Corruption 0.5 0.6 0.3 0.0 3.9 2.1
Crime, Theft and Disorder 1.9 1.6 2.9 1.7 5.0 1.4
Anti-Competitive or Informal Practices 1.2 1.6 0.0 1.5 8.3 5.7
Legal System/Conflict Resolution 0.0 0.0 0.0 0.0 0.7 0.6
% of Firms Identifying Transportation as a Major Constraint 14.1 13.6 16.4 11.2 22.4 24.3
% of Firms Identifying Electricity as a Major Constraint 88.4 85.4 94.7 100.0 55.3 70.5
Incidents/Typical Month of Power Outages 12.8 11.4 13.5 22.2 12.5 15.8
Incidents/Year of Insufficient Water Supply 12.4 18.1 12.9 6.6 8.0 9.5
% of Sales Lost to Power Outages 9.6 9.5 10.2 8.9 7.2 9.0
Delays in Obtaining Electricity Connections (Days) 44.0 36.9 19.6 160.8 28.7 31.3
Delays in Obtaining Water Connections (Days) 26.8 22.7 19.9 36.8 44.1 31.7
Delays in Obtaining Telephone Connections (Days) 23.2 21.1 28.0 17.4 29.1 32.2
% of Firms Identifying Access/Cost of Finance as a Major Constraint 40.6 40.9 43.8 27.2 45.4 50.0
% of Firms Using Banks to Finance Investments or Expenses 18.2 12.1 25.0 61.8 17.4 15.5
% of Investments Financed by Internal Funds 84.6 88.7 81.9 65.7 78.0 80.1
% of Investments Financed by Banks 7.8 4.4 9.0 26.5 10.3 8.5
% of Investments Financed by Trade Credits 1.2 0.9 0.3 5.4 2.5 2.3
% of Investments Financed by Equity 0.2 0.0 0.0 2.1 0.1 0.1
% of Investments Financed by Other Sources 6.2 6.0 8.8 0.2 7.7 9.0
% of Firms with Bank Loans/Line of Credit 6.2 3.4 6.1 35.8 11.1 10.8
Value of Collateral (% of Loan Value) 122.1 120.1 116.3 127.0 130.3 142.9
http://www.enterprisesurveys.org Enterprise Surveys: TANZANIA 12
Summary of Enterprise Survey Indicators
Infrastructure Indicators
Finance Indicators
Percent of Firms Identifying the Problem as the Main Obstacle

TanzaniaSmall (1-19
employees)
Medium (20-99
employees)
Large (100+ employees)
Africa Low Income
% of Firms Identifying Labor Regulations as a Major Constraint 4.8 3.1 10.2 5.1 6.9 3.8
% of Firms Identifying Labor Skill Level as a Major Constraint 19.7 17.7 28.2 12.4 17.1 13.9
% of Firms Offering Formal Training 36.5 28.8 37.1 64.2 29.5 24.1
% of Workers Offered Formal Training 55.6 65.3 47.5 50.4 52.6 51.6
% of Skilled Production Workers 60.2 69.5 53.5 38.0 45.0 44.8
Number of Permanent Full Time Workers 25.7 8.2 36.4 187.9 18.2 17.1
Total Number of Temporary Workers 9.5 2.3 11.0 84.9 9.2 11.9
Percent of Temporary Workers - Female 37.2 38.3 36.9 31.1 27.8 23.7
% of Firms Identifying Corruption as Major Constraint 19.7 17.1 28.7 18.1 23.4 22.9
% Firms Making Unofficial Payments to Get Things Done 49.1 50.9 50.3 25.8 48.1 60.1
% of Firms Expected to Give Gifts in Meetings with Tax Inspectors 14.7 14.4 15.8 13.7 21.2 29.2
% of Firms Expected to Give Gifts to Obtain Operating Licenses 20.1 13.0 45.9 0.0 20.6 29.8
% of Firms Expected to Give Gifts to Obtain Import Licenses 6.6 7.6 14.8 0.0 21.2 27.9
% Senior Management Time Dealing with Government Regulations 5.2 4.7 6.0 7.6 6.7 6.2
Time Spent in Tax Inspection Meetings (Meetings/Year) 3.6 3.8 3.3 3.6 3.2 3.9
% of Firms Identifying Legal System/Conflict Resolution as a Major Constraint 6.0 4.7 10.8 5.1 9.4 8.5
% of Firms Identifying Crime, Theft and Disorder as a Major Constraint 16.4 16.3 14.8 23.8 22.6 16.7
% Firms Believe Court System is Able to Enforce its Decisions 64.6 60.3 73.0 83.2 57.6 56.4
% Firms Believe Court System is Fair/Impartial/Uncorrupted 46.6 47.7 37.0 67.7 45.4 40.8
% of Firms Resolving Disputes Through Court Action 70.1 59.3 75.0 87.0 59.4 58.9
Costs of Security (% of Sales) 3.1 3.3 3.3 0.6 2.6 2.7
Losses Due to Crime (% of Sales) 3.9 5.5 1.6 1.1 4.9 5.8
% of Firms With an Internationally-Recognized Quality Certification 14.7 0.1 0.2 0.6 11.8 10.4
% of Firms Undertaking Innovation 70.1 65.4 70.2 87.8 63.2 60.4
% of Firms Identifying Foreign Competition as Important Influence in LoweringProduction Costs
48.2 42.4 49.3 67.3 40.9 34.6
% of Firms Identifying Domestic Competition as Important Influence in LoweringProduction Costs
70.5 69.0 76.3 64.6 59.4 56.5
% of Firms Using E-mail to Interact with Buyers/Suppliers/Customers 41.7 29.3 65.4 98.3 37.4 33.9
% of Firms Using Website to Interact with Buyers/Suppliers/Customers 16.3 5.6 35.0 70.2 13.9 11.5
http://www.enterprisesurveys.org Enterprise Surveys: TANZANIA 13
Regulatory Burden and Corruption Indicators
Courts and Crime Indicators
Innovation and Technology Indicators
Labor Force Indicators
Summary of Enterprise Survey Indicators

TanzaniaSmall (1-19
employees)
Medium (20-99
employees)
Large (100+ employees)
Africa Low Income
% of Firms That Trade 4.8 2.8 6.4 19.8 7.4 7.8
% of Firms That Trade Identifying Customs & Trade Regulations as a MajorConstraint 11.6 8.6 21.1 12.3 17.0 16.4
Days on Average to Claim Imports From Customs* 14.3 20.2 13.7 13.4 9.7 9.9
Days on Average to Clear Customs for Exports 5.2 4.0 5.1 7.2 5.3 4.6
% Value of Exports Lost Due to Theft 2.8 2.7 1.1 4.9 1.7 1.5
% Value of Exports Lost Due to Breakage or Spoilage 2.8 0.7 2.0 5.5 3.0 2.3
Notes:
a. Africa : Africa: Angola, Botswana, Burundi, Capeverde, Democratic Republic of Congo, Gambia, Guinea, Guinea Bissau, Mauritania, Namibia, Rwanda, Swaziland, Tanzania, Uganda. b. Low income group: Burundi, Democartic Republic of Congo, Gambia, Guinea, Guinea Bissau, Mauritania, Rwanda, Tanzania, Uganda.c. Lower middle income group: Angola, Cape Verde, Namibia, Swaziland.d. Upper middle income group : Botswana* Manufacturing sector only
Selected manufacturing industriesManufacturing sector 273Retail 70Other sectors 76Total 419
http://www.enterprisesurveys.org Enterprise Surveys: TANZANIA 14
Trade Indicators
2- Indicators for Africa, the low middle income group, the lower middle income group, and the upper middle income group were calculated using country data available at the time ofpublication.
Summary of Enterprise Survey Indicators
3. The sample for each country is stratified by industry, firm size, and geographic region. For stratification by industry the main manufacturing sectors in each country in terms of value added,number of firms, and contribution to employment are selected. The retail trade sector is also included in all countries as a representative of the services sector, and depending on the size of theeconomy, the information technology (IT) sector is included. The rest of the universe is included in a residual stratum. Stratification by size follows the three levels presented in the text: small,medium, and large. Regional stratification includes the main economic regions in each country. Through this methodology estimates for the different stratification levels can be calculated on aseparate basis while at the same time inferences can be made for the economy as a whole, weighting individual observations by corresponding sample weights. Sample sizes for eachstratification level are defined ensuring a minimum precision level of 7.5% with 95% confidence intervals for estimates with population proportions (for more technical details on the samplingstrategy, please review the Sampling Note available at www.enterprisesurveys.org).4. In Tanzania included cities were: 5
1- Country-level indicators denoting percentage of firms use as denominators the number of firms for which data for the respective question is available. Country-level indicators denotingquantities (i.e., number of days, percentage of sales, percentage of loan value, etc.) represent the average of responding firms that are not considered to be outliers. Outliers are defined asfirms with values greater than the mean plus 3 times the standard deviation or lower than the mean minus 3 times the standard deviation for that particular indicator. Regional and incomegroup indicators are calculated as the averages of country-level indicators in the respective region and income groups.

© June 2007 International Bank of Reconstruction and DevelopmentThe World Bank1818 H Street, NWWashington, DC 20433 USAEnterprise Analysis Unit (FPDEA)MSN-F4P-400Fax: 001 202-522-2029
http://www.enterprisesurveys.org Enterprise Surveys: TANZANIA 15
The World Bank does not guarantee the accuracy of the data included in this work. The boundaries, colors, denominations, and other information shown on any map in this work do not imply any judgment on the part of the World Bank concerning the legal status of any territory or the endorsement or acceptance of such boundaries.
The findings, interpretations, and conclusions presented herein are those of the authors and do not necessarily reflect the views of the Board of ExecutiveDirectors of the World Bank or the governments they represent.