entertainment report march 2015
DESCRIPTION
Entertainment Reports in detail.TRANSCRIPT


Third largest TV market • With 161 million television households in 2013, India stood as the third largest television
market with USD15.7 Billion revenue in 2013
One of the largest
broadcasting market
• India has one of the largest broadcasting industries in the world with approximately 800
satellite television channels, 245 FM channels and more than 100 operational community
radio networks
• The Information and Broadcasting (I&B) Ministry has already completed the second phase of
digitisation, which involved digitising 16 million cable TV houses in 38 cities by April 1, 2013
• Total of 242 FM channels (21 from the Phase - I and 221 from Phase – II) are operational. The
Union Finance Minister expects private FM services to expand to 294 additional cities and
about 839 new FM channels to be auctioned in 2013-14
Rising no of subscribers
• The number of cable & satellite subscribers reached to 139 million in 2013.The total
subscriber base for Indian television industry is expected to increase to 173 million by 2016
from 95 million in 2009
• DTH subscriber base is estimated to grow from 32.4 million in 2012 to 63.8 million by 2017
and 76.6 million by 2020
Fast growing animation
industry
• The Indian animation industry was worth USD685 thousand in 2013 and is expected to grow
at a CAGR of 15.9* per cent to reach USD1.3 million by 2018
Source: KPMG Report, 2014; NASSCOM, Report Planning Commission, Aranca Research
Note: * in INR terms
exceptional growth in
film industry • The Indian film industry film in expected to grow to USD3.8 billion by 2018

Growing demand
Source: KPMG Report 2014, Aranca Research, Report Planning Commission
Notes: AGV - Animation, Gaming and VFX, VFX - Visual Effects, M&A - Merger and Acquisition, CAGR - Compound Annual Growth Rate, FDI - Foreign Direct
Investment, Deadline for the entire country to be digitised is December 2014, E – Estimate
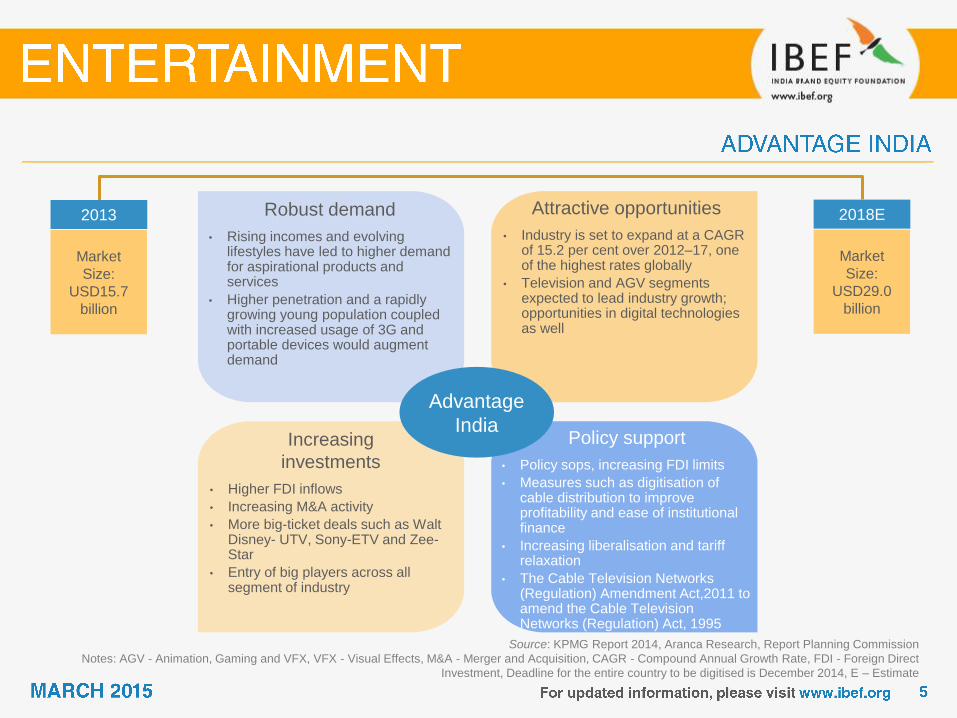
Robust demand
• Rising incomes and evolving lifestyles have led to higher demand for aspirational products and services
• Higher penetration and a rapidly growing young population coupled with increased usage of 3G and portable devices would augment demand
Attractive opportunities
• Industry is set to expand at a CAGR of 15.2 per cent over 2012–17, one of the highest rates globally
• Television and AGV segments expected to lead industry growth; opportunities in digital technologies as well
Policy support
• Policy sops, increasing FDI limits
• Measures such as digitisation of cable distribution to improve profitability and ease of institutional finance
• Increasing liberalisation and tariff relaxation
• The Cable Television Networks (Regulation) Amendment Act,2011 to amend the Cable Television Networks (Regulation) Act, 1995
Increasing
investments
• Higher FDI inflows
• Increasing M&A activity
• More big-ticket deals such as Walt Disney- UTV, Sony-ETV and Zee- Star
• Entry of big players across all segment of industry
2013
Market
Size:
USD15.7
billion
2018E
Market
Size:
USD29.0
billion
Advantage
India


Source: KPMG Report 2013, Aranca Research
Note: VFX - Visual Effects
Entertainment
Television
Gaming
Animation & VFX
Out of Home (OOH)
Music Digital
Advertising
Radio
Films
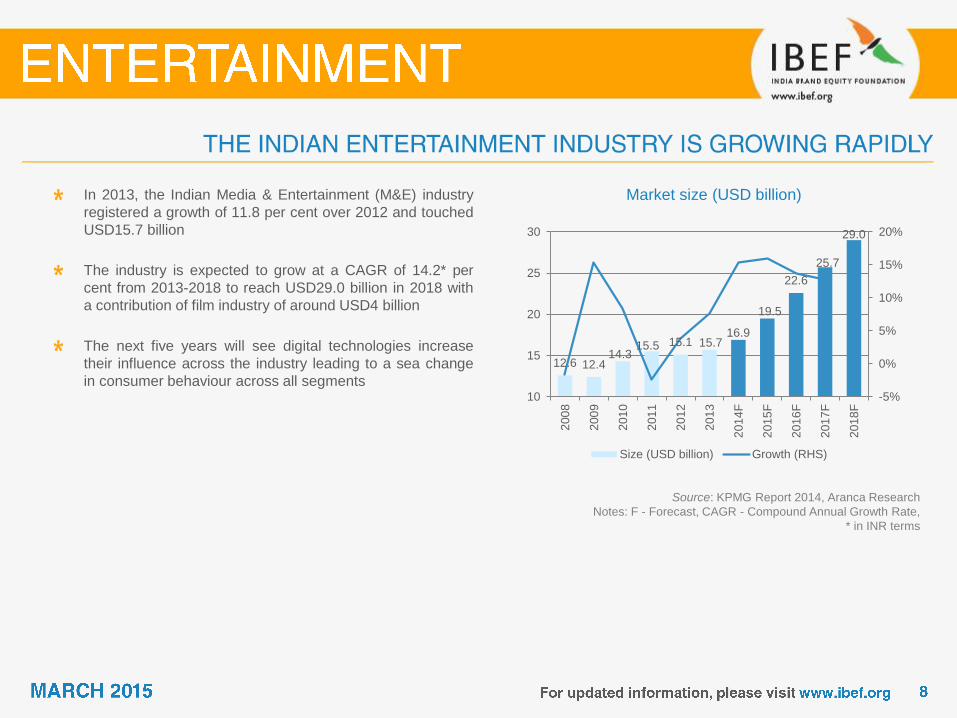
Market size (USD billion)
Source: KPMG Report 2014, Aranca Research
Notes: F - Forecast, CAGR - Compound Annual Growth Rate,
* in INR terms
In 2013, the Indian Media & Entertainment (M&E) industry
registered a growth of 11.8 per cent over 2012 and touched
USD15.7 billion
The industry is expected to grow at a CAGR of 14.2* per
cent from 2013-2018 to reach USD29.0 billion in 2018 with
a contribution of film industry of around USD4 billion
The next five years will see digital technologies increase
their influence across the industry leading to a sea change
in consumer behaviour across all segments
12.6 12.4 14.3
15.5 15.1 15.7 16.9
19.5
22.6
25.7
29.0
-5%
0%
5%
10%
15%
20%
10
15
20
25
30
200
8
200
9
201
0
201
1
201
2
201
3
201
4F
201
5F
201
6F
201
7F
201
8F
Size (USD billion) Growth (RHS)

Size of major industry segments (2013)
Source: KPMG Report 2014, Aranca Research
The entertainment industry continues to be dominated by the television segment, accounting for 45 per cent of market share
in terms of revenues, which is expected to grow further to 50 per cent by 2018
Television, print and films together account for 86 per cent of market share in 2013
Television is going to capture more market share in coming years and expected to contribute half of the total market by 2018
Print media would be the second largest sector and Out of Home (OOH), Music and Gaming is expected to contribute 2.0
per cent each to the entire industry by 2018
Size of major industry segments (2018)
45%
27%
14%
2% 1%
2% 4%
2% 3%
Television
Films
Radio
Music
Out of Home
Animation and VFX
Gaming
Digital Advertising
50%
21%
12%
2% 1%
2% 5%
2% 6% Television
Films
Radio
Music
Out of Home
Animation & VFX
Gaming
Digital Advertising
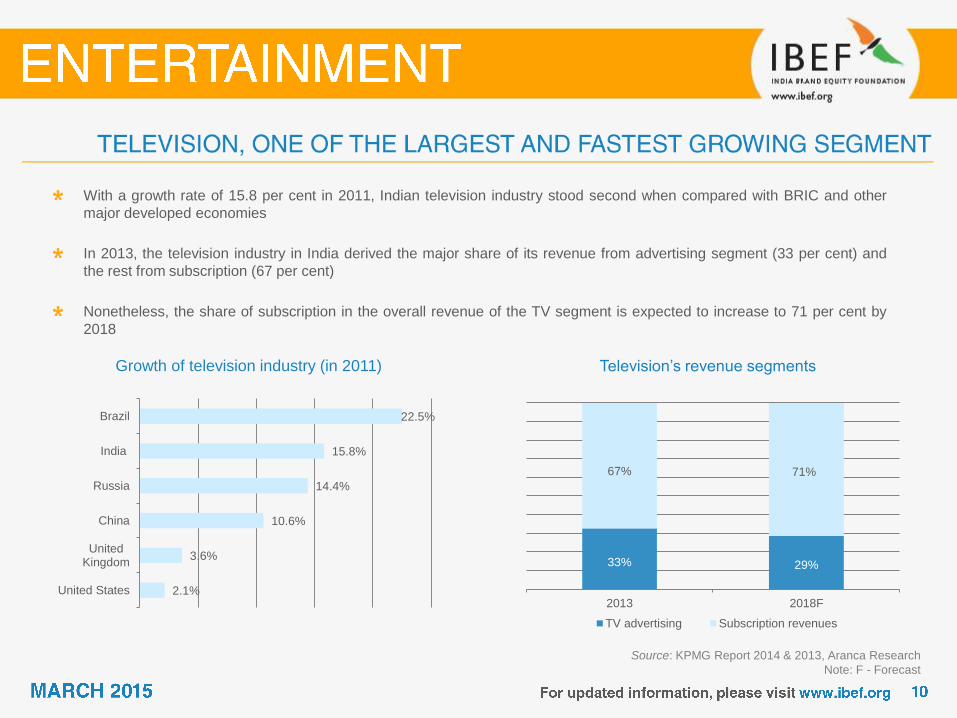
Growth of television industry (in 2011)
Source: KPMG Report 2014 & 2013, Aranca Research
Note: F - Forecast
With a growth rate of 15.8 per cent in 2011, Indian television industry stood second when compared with BRIC and other
major developed economies
In 2013, the television industry in India derived the major share of its revenue from advertising segment (33 per cent) and
the rest from subscription (67 per cent)
Nonetheless, the share of subscription in the overall revenue of the TV segment is expected to increase to 71 per cent by
2018
Television’s revenue segments
2.1%
3.6%
10.6%
14.4%
15.8%
22.5%
United States
UnitedKingdom
China
Russia
India
Brazil
33% 29%
67% 71%
2013 2018F
TV advertising Subscription revenues

Industry size of emerging segments (USD million)
Source: KPMG Report 2014, Aranca Research
Notes: VFX- Visual Effects; F - Forecast,
*In INR terms
Radio, animation & VFX, gaming and digital advertising are
also emerging as fast growing segments
During 2013-2018, these segments are expected to
increase at a CAGR of:
Digital advertising (27.7*per cent)
Gaming (16.2* per cent)
Radio (18.1* per cent)
Animation (15.9* per cent)
With increasing use of internet and other digital resources,
Digital Advertising is expected to grow at the fastest rate
among peers like print media, radio and outdoor advertising
-
200
400
600
800
1,000
1,200
1,400
1,600
1,800
200
7
200
8
200
9
201
0
201
1
201
2
201
3
201
4F
201
5F
201
6F
201
7F
201
8F
Radio Animation and VFX
Gaming Digital Advertising

Advertising revenue forecast
Source: KPMG Report 2014, Aranca Research
Notes: OOH - Out Of Home, F – Forecast, * In INR terms
Total spending on advertising across all media stood at USD6.2 billion in 2013
Print is the largest contributor, accounting for 45 per cent of the advertising share
Advertising revenue is expected to touch USD11.3 billion by 2018 at a CAGR of 13.9* per cent
Print media and television together contributed for more that 80 per cent of total revenue from advertising in 2013
Advertising revenue share (2013)
5.4 6.2 6.7
11.3
0%
2%
4%
6%
8%
10%
12%
14%
16%
0
2
4
6
8
10
12
201
2
201
3
201
4F
201
8F
Total revenue - (USD billion) Growth (%) - RHS
45%
37%
8%
5% 4%
Television
Digital Advertising
Out of Home
Radio

Source: KPMG Report 2014,
Economic Times, Aranca Research
Viewership in regional channels in 2013 Regional Entertainment channels comprising mostly of
regional GECs (General Entertainment Channels), regional
movies and regional music
It accounted for 23 per cent of the total television viewership
share in 2013
In print media, the rise in literacy rates, significant
population growth, the rise in incomes in smaller towns and
the entry of big players in regional markets is likely to drive
future expansion of circulation and readership across India
Viewership in South India is dominant for regional
entertainment as Tamil and Telugu together account for
more than half of the total viewership. It is comparatively
less for Oriya, Gujarati and Bhojpuri, which is equivalent to
only 1 per cent each
27%
24%
14%
12%
11%
6%
3%
1% 1%
1% Tamil
Telugu
Marathi
Kannada
Bengali
Malayalam
Others
Oriya
Gujarati
Bhojpuri

Source: Company websites, Business Week, KPMG Report 2012, Aranca Research
Note: M&E - Media and Entertainment
Television Print Films Music
Star India Pvt Ltd
Bennett, Coleman and Co
Ltd
Yash Raj Films Studios
Saregama India Ltd
Zee Entertainment
Enterprises Ltd
HT Media Ltd
Eros International
Media Ltd
Super Cassettes
Industries Ltd
Multi Screen Media Pvt Ltd
Living Media India Ltd
Red Chillies
Entertainments Pvt Ltd
Tips Industries Ltd

Television
• Television penetration in India was at about 60 per cent in 2013
• The government announced the digitisation of cable television in India in four phases,
which would be completed by the end of 2014
• The Direct-To-Home (DTH) subscription is growing rapidly driven by content innovation
and product offerings
• The print industry grew by 8.5 per cent to USD4.2 billion in 2013 and is expected to grow
at a CAGR of 9.0* per cent between 2013-2018 to reach USD6.1 billion
• Increasing income levels and evolving lifestyles have led to robust growth in niche
magazines segment
• Considering the huge potential in regional print markets, national advertisers are entering
these markets to increase their advertising share
Film
• The Indian film industry is largest producer of films globally with 400 production &
corporate houses involved in film production
• The revenues earned by the Indian film industry for 2013 were USD2.1 billion and is
expected to grow at a CAGR 11.9* per cent for 2013-2018
• Increasing share of Hollywood content in the Indian box office and 3D cinema is driving
the growth of digital screens in the country
• In 2013, the film industry added 150-200 (approx.) screens led by the expansion of
multiplexes in the tier II and tier III cities
Source: KPMG Report 2014, Economic Times, Aranca Research
Notes: DTH - Direct to Home, 3D - Three Dimension,* In INR terms

Animation, Gaming and
VFX (AGV)
• Growing focus on the ‘kids genre’ and rise in dedicated TV channels for them
• As the advertising industry grows, the share of animation driven advertisements are
expected to also grow
• Surge in 3D/HD animated movies in theatres and use of animation and VFX in TV
advertising and gaming
• Growing outsourcing of VFX and gaming to India is due to cost effectiveness of Indian
players
• Content localisation such as T20fever.com and ICC World Cup 2011 games
Radio
• Increasing FM enabled phones and car music systems
• In 2014, 242 channels (Phase – I & Phase – II) are operating across India
• In 2013, the share of audiences tuning into radio from out-of-home mediums as compared
to in-home listing increased to 23.1 per cent
• Government introduced favorable guidelines for expansion of the 3rd phase of FM radio
broadcasting services, which will bring 294 towns and 839 stations under FM coverage
• Liberalisation of policy on community radio took place in 2008 which led to 29 community
radio stations getting operational in the country
Source: KPMG Report 2014, Press Information Bureau,
Economic Times, Aranca Research
Out of Home and digital
• With increasing penetration of internet and digital mediums, digital segment is expected to
outperform other sectors of entertainment
• Although Out-of-Home segment has a low contribution to the total of entertainment
industry, in coming years it is going to witness a significant growth
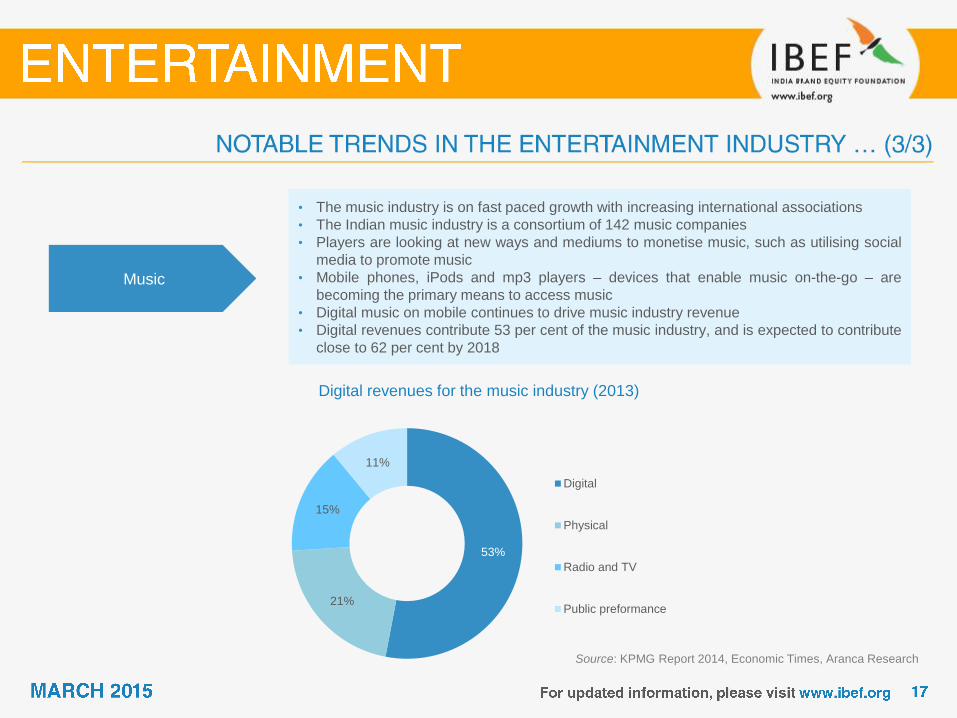
Music
• The music industry is on fast paced growth with increasing international associations
• The Indian music industry is a consortium of 142 music companies
• Players are looking at new ways and mediums to monetise music, such as utilising social
media to promote music
• Mobile phones, iPods and mp3 players – devices that enable music on-the-go – are
becoming the primary means to access music
• Digital music on mobile continues to drive music industry revenue
• Digital revenues contribute 53 per cent of the music industry, and is expected to contribute
close to 62 per cent by 2018
Source: KPMG Report 2014, Economic Times, Aranca Research
Digital revenues for the music industry (2013)
53%
21%
15%
11%
Digital
Physical
Radio and TV
Public preformance


Source: Aranca Research
Competitive Rivalry
• Highly fragmented industry that is no single enterprise has large
enough share to influence the entire sector
• High fixed costs and highly perishable products
Threat of New Entrants Substitute Products
Bargaining Power of Suppliers Bargaining Power of Customers
• High sunk costs are involved
• High capital requirements
• Access to distribution is difficult
• The number of suppliers is very
high which leads to the low
bargaining power with them
• Increasing number of content
providers
• Increased globalisation
• Consumers loyalty towards one
channel is less, as variety of
alternative sources of
entertainment is available
• Film industry, print media and
internet
• Significant sporting events like
World Cup,T20,etc and other
cultural events Competitive
Rivalry
(Medium)
Threat of New
Entrants
(Low)
Substitute
Products
(Low)
Bargaining
Power of
Customers
(Medium)
Bargaining
Power of
Suppliers
(Low)


Source: Aranca Research
• Regional entertainment is growing and therefore the suppliers are able to expand their
forte in the products
• Zee Television, Star TV have their regional channels both for entertainment and news
• The South television industry is one of the oldest operational television sectors across the
nation and is further growing due to the regional content
• The manufacturing companies such as Videocon is offering combo deals such as
LED/LCD sets with Videocon set-up boxes and dish services
• The Dish TV is also offering the set up boxes with many additional channels
• Increasing digitisation in the country is helping such companies to further add up to their
revenues
• As television industry is a dominant segment in the entertainment industry even the film
makers promote their films at this platform so as to reach to the mass audiences for
example the reality shows, TV advertisements, etc
• Many film producers, actors, etc have shifted to the television industry so as to remain in
the race and maintain their fan following
• TV programmes being used as a medium of promoting films or other entertainment events
• Audience is the ultimate consumer in this industry and therefore films, advertisements,
music and all the products of entertainment sector is based on the tastes & preferences of
the audiences of the nation
Viewership in regional
entertainment
Marketing strategies
Television: a common
medium
Audience: the ultimate
consumer

Source: Aranca Research
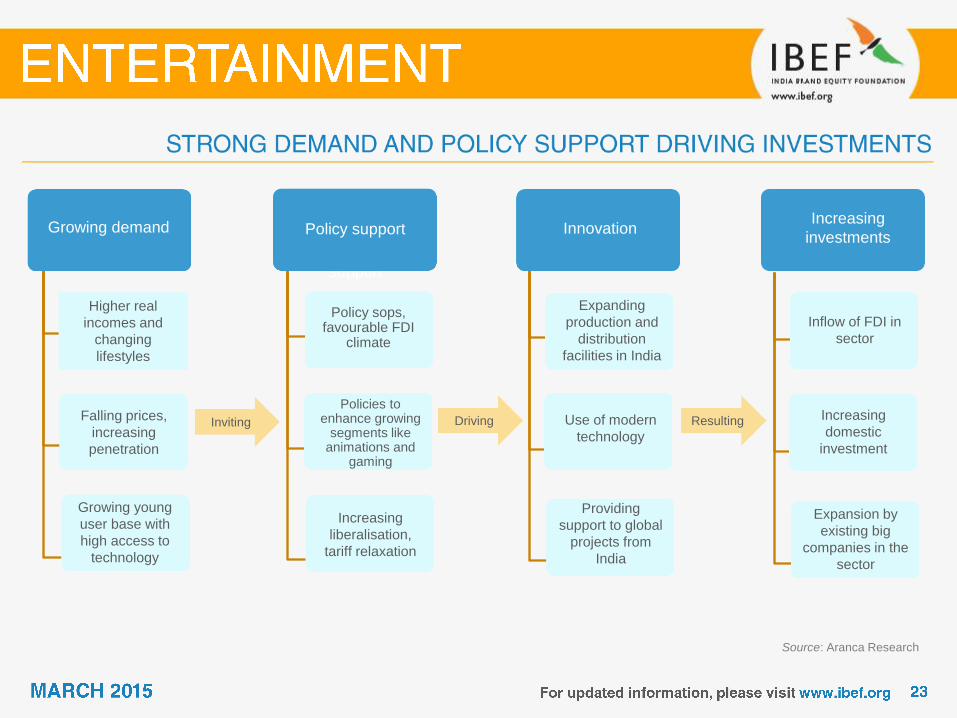
Growing demand
Growing demand
Higher real
incomes and
changing
lifestyles
Falling prices,
increasing
penetration
Growing young
user base with
high access to
technology
Policy support Strong
government
support
Policy support
Policy sops, favourable FDI
climate
Policies to enhance growing
segments like animations and
gaming
Increasing
liberalisation,
tariff relaxation
Innovation
Expanding
production and
distribution
facilities in India
Use of modern
technology
Providing
support to global
projects from
India
Resulting
Increasing
investments
Inflow of FDI in
sector
Increasing
domestic
investment
Expansion by
existing big
companies in the
sector
Driving Inviting

Rising per-capita income in India (USD)
Source: IMF WEO April 2014, Aranca Research
Note: * In INR terms
Incomes have risen at a brisk pace in India and will continue
rising given the country’s strong economic growth
prospects. Nominal per capita income is estimated (IMF) to
have recorded a CAGR of 11.9* per cent over 2000–13
Rising incomes, with its positive impact on the consumer
base, will be the key growth driver for the entertainment
industry (across the country)
As the proportion of ‘working age population’ in total
population increases, GDP is expected to grow higher
Per capita income is expected to expand at a CAGR of
11.4* per cent for the period 2013-19
-5%
0%
5%
10%
15%
20%
25%
30%
35%
0
500
1,000
1,500
2,000
2,500
200
0
200
1
200
2
200
3
200
4
200
5
200
6
200
7
200
8
200
9
201
0
201
1
201
2
201
3
201
4
201
5F
201
6F
201
7F
201
8F
201
9F
GDP Per Capita ( current prices) (USD) - LHS
Annual Growth Rate - RHS

Indian residents shifting from low-income to high-
income groups
Source: McKinsey Quarterly Report, Aranca Research
Apart from the impact of rising incomes, widening of the
consumer base will also be aided by expansion of the
middle class, increasing urbanisation, and changing
lifestyles
The entertainment industry will also benefit from continued
rise in the propensity to spend among individuals; empirical
evidence points to the fact that decreasing dependency ratio
leads to higher discretionary spending on entertainment
1 3 7 2 6
17 12
25
29 35
40
32 50
26 15
2008 2020 2030
Globals (>18412.8) Strivers (9206.4-18412.8)
Seekers (3682.5 - 9206.4) Aspirers (1657-3682.5)
Deprived (<1657)
Million Household, 100%
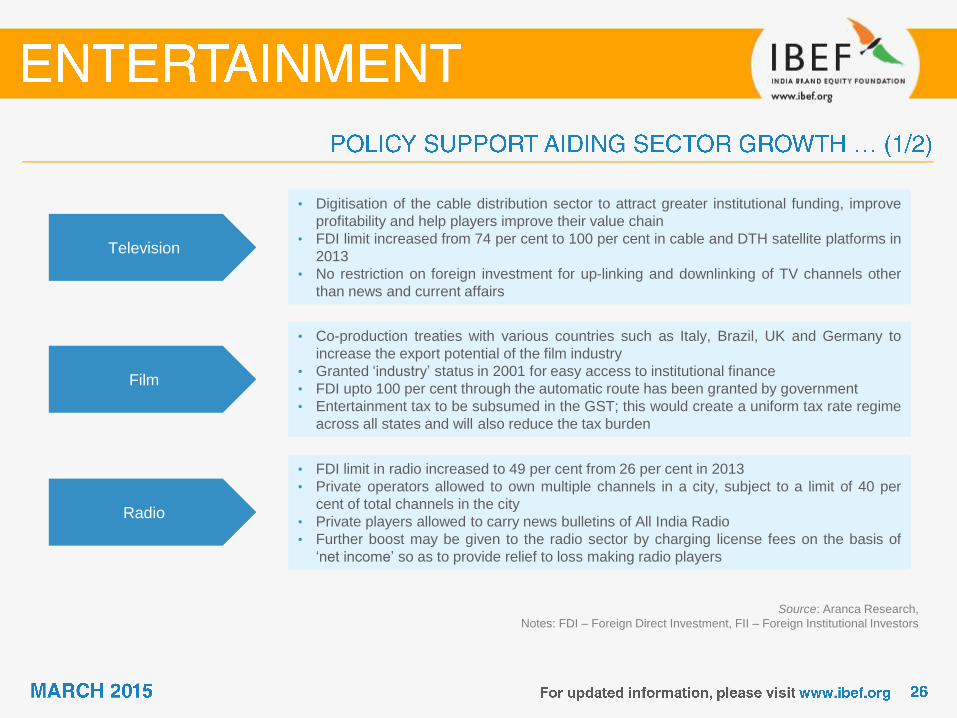
Television
• Digitisation of the cable distribution sector to attract greater institutional funding, improve
profitability and help players improve their value chain
• FDI limit increased from 74 per cent to 100 per cent in cable and DTH satellite platforms in
2013
• No restriction on foreign investment for up-linking and downlinking of TV channels other
than news and current affairs
Film
• Co-production treaties with various countries such as Italy, Brazil, UK and Germany to
increase the export potential of the film industry
• Granted ‘industry’ status in 2001 for easy access to institutional finance
• FDI upto 100 per cent through the automatic route has been granted by government
• Entertainment tax to be subsumed in the GST; this would create a uniform tax rate regime
across all states and will also reduce the tax burden
Radio
• FDI limit in radio increased to 49 per cent from 26 per cent in 2013
• Private operators allowed to own multiple channels in a city, subject to a limit of 40 per
cent of total channels in the city
• Private players allowed to carry news bulletins of All India Radio
• Further boost may be given to the radio sector by charging license fees on the basis of
‘net income’ so as to provide relief to loss making radio players
Source: Aranca Research,
Notes: FDI – Foreign Direct Investment, FII – Foreign Institutional Investors
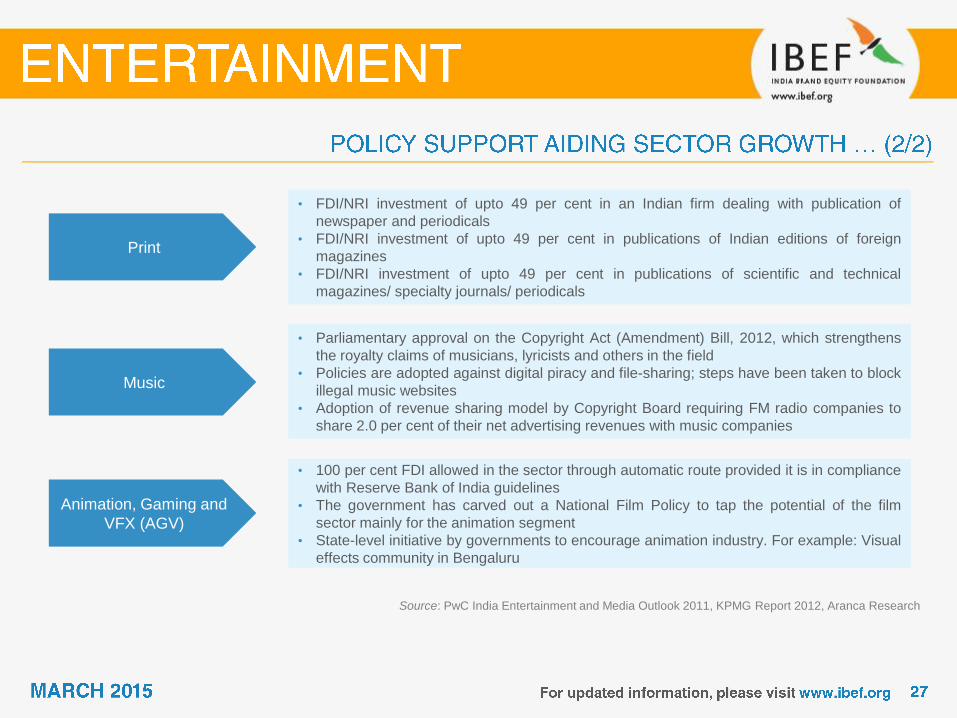
• FDI/NRI investment of upto 49 per cent in an Indian firm dealing with publication of
newspaper and periodicals
• FDI/NRI investment of upto 49 per cent in publications of Indian editions of foreign
magazines
• FDI/NRI investment of upto 49 per cent in publications of scientific and technical
magazines/ specialty journals/ periodicals
Music
• Parliamentary approval on the Copyright Act (Amendment) Bill, 2012, which strengthens
the royalty claims of musicians, lyricists and others in the field
• Policies are adopted against digital piracy and file-sharing; steps have been taken to block
illegal music websites
• Adoption of revenue sharing model by Copyright Board requiring FM radio companies to
share 2.0 per cent of their net advertising revenues with music companies
Animation, Gaming and
VFX (AGV)
• 100 per cent FDI allowed in the sector through automatic route provided it is in compliance
with Reserve Bank of India guidelines
• The government has carved out a National Film Policy to tap the potential of the film
sector mainly for the animation segment
• State-level initiative by governments to encourage animation industry. For example: Visual
effects community in Bengaluru
Source: PwC India Entertainment and Media Outlook 2011, KPMG Report 2012, Aranca Research

Source: Digital Dawn, KPMG Report 2014, Aranca Research
In December 2011, the Indian Government passed ‘The Cable Television Networks (Regulation) Amendment Act’ for
digitisation of cable television networks by 2014. It is expected that India will be fully digitised by December 2014
The Information and Broadcasting (I&B) Ministry completed the second phase of digitisation, which involved digitising 16
million cable TV houses in 38 cities by April 1, 2013 and aims to complete the third phase of digitisation which includes all
other urban areas (municipal corporations/ municipalities) by September 30, 2014. The rest of the country is likely to be
covered by December 2014 under phase four of digitisation. The digital subscribers are expected to outdo the analog
subscribers by 2013-14
The cable operators under the digitisation regime are legally bound to transmit only digital signals, while the customer can
access the subscribed channels through a set-top box
The number of DTH subscribers in India is expected to increase from 44 million 2013 to 200 million by 2018
USD81.2 million has been allocated for launching a pan-India programme named ‘Digital India’ and a national rural internet
and technology mission for services in villages and schools, training in IT skills and e-kranti for government service delivery
and governance scheme
Phase Parliamentary approval for
analogue shutdown
Digitisation
including DTH Gross billing
Phase 1 June -12 98% Started in Delhi in January 2014;
Mumbai & Kolkata expected to start in Feb-March 2014
Phase II March-13 90% Expected to start from April 2014
Phase III December -14 40-50% Not Started Yet
Phase IV December- 14 40-50% Not Started yet
Status of digitisation

Source: Digital Dawn, KPMG Report 2013, Aranca Research
Advantages of Digitisation
Higher consumer preference, which lacked in the former Conditional Access System (CAS)
Consumers will be able to select content of their choice as well as indefinitely store and access digital content
The digital platform in films also includes the ‘video-on-demand’ feature on television
Higher transparency; subscriber declaration level is expected to increase to 100 per cent under post-digitisation regime as
compared to 15–20 per cent as declared by Local Cable Operators (LCOs) to Multiple System Operators (MSOs)
Stake-holder revenues share Pre-digitisation Post-digitisation
Consumer ARPU 100 100
Local Cable Operators (LCOs) 65–70 35–50
Distributor 5 0–5
Multiple System Operators (MSOs) 15–20 25–30
Broadcaster 10–15 30–35

2.9
3.3
3.8
4.1
3.3
3.7
4.0
4.4
2013 2014F 2015F 2016F
Digital Cable DTH
Average revenue per user per month (USD)
Source: KPMG Report 2014, Aranca Research
Note: F - Forecast
Presence of analog cable and higher contribution has led to
lower Average Revenue Per User (ARPU) level, which is
around USD3.0 for a digital pay television
However, with higher scope of introduction of new and
niche channels with digitisation, ARPU levels are expected
to increase
ARPU for DTH subscribers has seen an increase of around
12-15 per cent in 2013
Digital cable on the other hand, has not seen any significant
ARPU increases and is estimated to have increased 5 per
cent. For digital cable, deployment of different channel
packages will be the key driver to raise ARPUs

Source: KPMG Report 2014, Aranca Research
Consolidation will be the major route to grow inorganically for entertainment companies in order to expand their portfolios
and enter into new regions
A few big deals have come about, the most notable ones being Network 18 Media & Investments Limited, Eenadu TV and
Sony-multi screen Media, with a combined investment of 666 million in 2012
In 2013, Publicis made three acquisitions
Dentsu acquired 80 per cent stake in Webchutney, a digital marketing company
News Corp exited its non-core businesses in India by selling its investment in Star News (stake acquired by the ABP Group)
and Hathway Cable & Datacom (stake acquired by Providence Equity Partners)
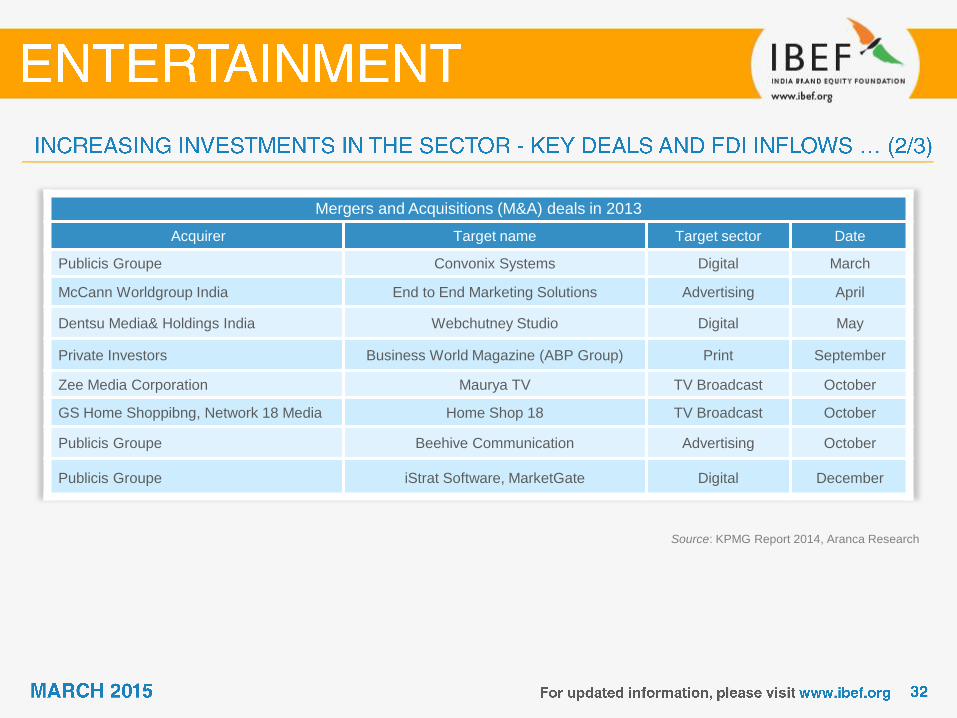
Source: KPMG Report 2014, Aranca Research
Mergers and Acquisitions (M&A) deals in 2013
Acquirer Target name Target sector Date
Publicis Groupe Convonix Systems Digital March
McCann Worldgroup India End to End Marketing Solutions Advertising April
Dentsu Media& Holdings India Webchutney Studio Digital May
Private Investors Business World Magazine (ABP Group) Print September
Zee Media Corporation Maurya TV TV Broadcast October
GS Home Shoppibng, Network 18 Media Home Shop 18 TV Broadcast October
Publicis Groupe Beehive Communication Advertising October
Publicis Groupe iStrat Software, MarketGate Digital December

Cumulative FDI inflows into Information and
Broadcasting from April 2000 (USD billion)
Source: Department of Industrial Policy and Promotion (DIPP),
Aranca Research
FDI inflows into the entertainment sector between April
2000 and April 2014 rose up to USD3.7 billion
By April 2014, the share of FDI in ‘Information and
Broadcasting’ was 1.7 per cent of total FDI inflows into the
country
Demand growth, supply advantages and policy support are
the key drivers in attracting FDI
0.6
1.3
1.8 2.2
2.9
3.6 3.7
FY 08 FY09 FY10 FY11 FY12 FY13 FY 14

Source: ‘’Media and Entertainment in India: Digital Road Ahead’ by Deloitte, Aranca Research; KPMG Report 2014
Notes: **We have portrayed the intensity of opportunities in each segment based on the extent of Indian players’ current presence in that segment, * In INR terms
Gaming can be classified under four segments – ‘Personal Computer Games (PC)’, ‘Mobile Games’, ‘Console Games’ and
‘Online Games’. The growth is driven by rising younger population, higher disposable incomes, introduction of new gaming
genres, and the increasing number of smartphone and tablet users
The mobile gaming industry in India was estimated at about USD140.3 million in 2013 and is projected to witness a CAGR
of 19.0* per cent (2013-2018)
The PC gaming segment is estimated at USD44.5 million in 2013 and is expected to grow at CAGR of 22.0* per cent to
touch USD112.0 million in 2018
Incentives provided by state governments, for units in SEZ as specified in ‘Union Budget, 2014’, to encourage gaming and
animation industry
Opportunities** for Indian gaming firms across the segment’s value chain
Concept
creation Pre-production Development
Post- production
and testing Final testing
Console Very strong Strong Good Good Good
Mobile Good Good Good Good Good
PC Strong Strong Good Good Good
Online Strong Strong Good Good Good

Number of subscribers (million) The share of digital cable as well as DTH service providers
is expected to increase post-digitisation
DTH subscribers have increased by around 12-15 per cent
in 2013, driven largely by increase in HD channels,
premium channels and value added services
Total subscription for DTH is expected to increase to 75
million subscribers by 2018 from 37 million in 2013
Total subscription for Digital is expected to increase to 91
million subscribers by 2018 from 25 million in 2013
DTH industry revenues will reach USD5.3 billion by 2020.
Revenue growth will be largely driven by increasing
subscriber volumes
68 68 58 68 55
31 5 5 5
5 6 19 25 40
60
81 87 91
28 37 44
37 44 56 70 72 75
7 8
9 9
9 9
9 9
10
2010 2011 2012 2013 2014F 2015F 2016F 2017F 2018F
Analog Digital DTH DD Direct
Source: KPMG Report 2014, Aranca Research

Television
• Television industry is worth USD7.1 billion in 2013 and is expected to grow at CAGR of
16.2* per cent for 2013-2018 to reach USD14.4 billion
• The television advertising market reported a moderate growth of an estimated 8.9 per cent
in 2013. The revenues generated are USD2.3 billion for the year 2013
• Television is projected to garner half of the media and entertainment pie by end of 2015
(as addressable digitisation is expected to cover the entire country by then)
Animation & VFX
• The Indian animation industry was worth USD679.3 million in 2013 and is expected to
expand at a CAGR of 15.9* per cent to USD1.3 billion by 2018
• Growth in international animation films, especially 3D productions, and the subsequent
work for Indian production houses will help the growth in this segment
• The print industry was worth USD4.2 billion in 2013 and with a CAGR of 9.0* per cent for
2013-2018 it is expected to reach USD6.1 billion
• Accelerated growth is forecasted in regional print and local news segments
Source: KPMG Report 2014, Aranca Research
Note: * In INR terms
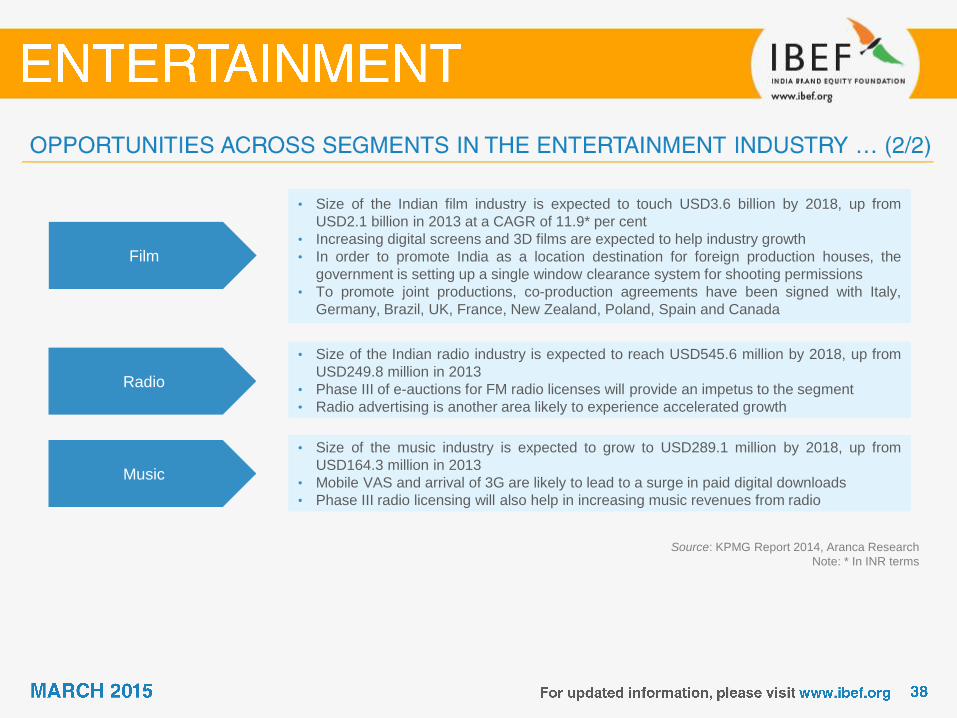
Film
• Size of the Indian film industry is expected to touch USD3.6 billion by 2018, up from
USD2.1 billion in 2013 at a CAGR of 11.9* per cent
• Increasing digital screens and 3D films are expected to help industry growth
• In order to promote India as a location destination for foreign production houses, the
government is setting up a single window clearance system for shooting permissions
• To promote joint productions, co-production agreements have been signed with Italy,
Germany, Brazil, UK, France, New Zealand, Poland, Spain and Canada
Radio
• Size of the Indian radio industry is expected to reach USD545.6 million by 2018, up from
USD249.8 million in 2013
• Phase III of e-auctions for FM radio licenses will provide an impetus to the segment
• Radio advertising is another area likely to experience accelerated growth
Music
• Size of the music industry is expected to grow to USD289.1 million by 2018, up from
USD164.3 million in 2013
• Mobile VAS and arrival of 3G are likely to lead to a surge in paid digital downloads
• Phase III radio licensing will also help in increasing music revenues from radio
Source: KPMG Report 2014, Aranca Research
Note: * In INR terms


Source: Company Annual Reports, Aranca Research
Television content
Motion pictures
Games content
Broadcasting
Started as a
content provider
for Doordarshan
Ventured into
internet content
creation and
aggregation
Launched IPO as
UTV Software
communications
Ltd
Launched
Hungama TV
Disney becomes a
majority share
holder with a stake
of 99.7 per cent
Deal with Disney
to dub its content
into Indian
languages
Acquires
Indiagames Ltd,
enters gaming
software and
content
Became world’s
first company to
record over 100
million downloads
on Nokia store
Interactive Number one
company in
mobile
gaming
1985-90 2000 2003 2005 2007 2008 2012 2013

Source: Company website, Aranca Research
‘SUN TV’ is
launched with
daily three hours
of programming
Launches SUN
Direct to provide
DTH services
Launches three
pay channels and
four ad-free action
movie channels
Collaborated
with iTunes,
YouTube
Starts its first FM
Channel
‘Sumangali FM’ Direct to Home
Motion pictures
Radio
Newspaper
Magazine
Broadcasting
Founded as
Sumangali
Publications
Launches a slew of
other channels in
various South Indian
languages
Acquires
Dinakaran
newspaper, Tamil
Nadu’s leading
daily
Enters Film
Production and
Distribution
through ‘SUN
Pictures’
1985-90 2000 2003 2005 2007 2008 2012 2013

Adlabs Imagica
Source: Company website, Aranca Research
Adlabs Imagica, a flagship project of Adlabs Entertainment
Ltd is a 300-acre entertainment theme park located on the
Mumbai–Pune expressway
ICICI Ventures invested USD26 million in Adlabs Imagica in
2013
It is India's most elaborate theme park for a total value of
USD294 million
The park features 21 attractions including rides, film shows
and live acts drawn from Indian mythology and Bollywood
cinema
The total footfall is expected to be around 2-3 million per
year
Salient features
• Total area - 300 acre
• Total cost - USD294 million
• Visitor capacity - 10,000 to 15,000 visitors per day
• Ticket cost - Weekday (USD23), Weekends (USD28)

228.76
314.92
417.60 398.51 414.57
FY10 FY11 FY12 FY13 FY14
Dish TV revenues (USD million)
Source: Company website, moneycontrol.com, Aranca Research
Note: *CAGR in INR terms
Dish TV is Asia's largest and India's first direct-to-home or
commonly known as DTH company
Dish TV India Limited, a division of Zee Network Enterprise
(Essel Group Venture) provides DTH satellite television
Dish TV ranks 5th on the list of media companies in the
Fortune India 500
The company’s revenue rose at a CAGR of 23.2* per cent
to USD414.57 million in FY14
CAGR: 23.2%

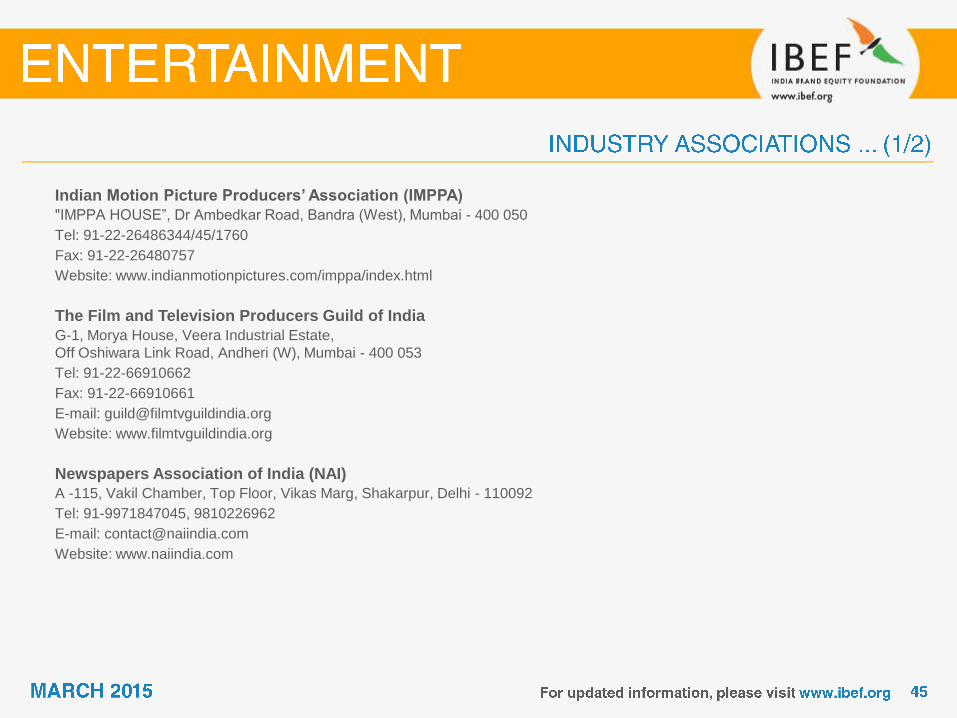
Indian Motion Picture Producers’ Association (IMPPA)
"IMPPA HOUSE”, Dr Ambedkar Road, Bandra (West), Mumbai - 400 050
Tel: 91-22-26486344/45/1760
Fax: 91-22-26480757
Website: www.indianmotionpictures.com/imppa/index.html
The Film and Television Producers Guild of India
G-1, Morya House, Veera Industrial Estate,
Off Oshiwara Link Road, Andheri (W), Mumbai - 400 053
Tel: 91-22-66910662
Fax: 91-22-66910661
E-mail: [email protected]
Website: www.filmtvguildindia.org
Newspapers Association of India (NAI)
A -115, Vakil Chamber, Top Floor, Vikas Marg, Shakarpur, Delhi - 110092
Tel: 91-9971847045, 9810226962
E-mail: [email protected]
Website: www.naiindia.com

Association of Radio Operators for India (AROI)
304, Competent House, F-14, Connaught Place, New Delhi - 110001
Tel: 91- 124-4385887
e-mail: [email protected]
Website: www.aroi.in
The Indian Music Industry (IMI)
Crescent Towers, 7th Floor
B-68, Veera Estate, Off New Link Road, Andheri West, Mumbai - 400 053
Tel: 91-22- 26736301 / 02 / 03
Fax: 91-22-26736304
E-mail: [email protected]
Website: www.indianmi.org
AGV: Animation, Gaming and VFX
CAGR: Compound Annual Growth Rate
DIPP: Department of Industrial Policy and Promotion, Ministry of Commerce and Industry
DTH: Direct to Home
FDI: Foreign Direct Investment
FM: Frequency Modulation
FY: Indian Financial Year (April to March)
So FY10 implies April 2009 to March 2010
GST: Goods and Service Tax
IPO: Initial Public Offering
M&A: Merger and Acquisition
M&E: Media and Entertainment

PPP: Purchasing Power Parity
USD: US Dollar
Conversion rate used: USD1= INR 54.45
VAS: Value Added Services
VFX: Visual Effects
Wherever applicable, numbers have been rounded off to the nearest whole number

Average for the year
Year INR equivalent of one USD
2004–05 44.81
2005–06 44.14
2006–07 45.14
2007–08 40.27
2008–09 46.14
2009–10 47.42
2010–11 45.62
2011–12 46.88
2012–13 54.31
2013–14 60.28
Exchange rates (Fiscal Year)
Year INR equivalent of one USD
2005 43.98
2006 45.18
2007 41.34
2008 43.62
2009 48.42
2010 45.72
2011 46.85
2012 53.46
2013 58.44
Q12014 61.58
Q22014 59.74
Q32014 60.53
Exchange rates (Calendar Year)

India Brand Equity Foundation (IBEF) engaged Aranca to prepare this presentation and the same has been prepared
by Aranca in consultation with IBEF.
All rights reserved. All copyright in this presentation and related works is solely and exclusively owned by IBEF. The
same may not be reproduced, wholly or in part in any material form (including photocopying or storing it in any
medium by electronic means and whether or not transiently or incidentally to some other use of this presentation),
modified or in any manner communicated to any third party except with the written approval of IBEF.
This presentation is for information purposes only. While due care has been taken during the compilation of this
presentation to ensure that the information is accurate to the best of Aranca and IBEF’s knowledge and belief, the
content is not to be construed in any manner whatsoever as a substitute for professional advice.
Aranca and IBEF neither recommend nor endorse any specific products or services that may have been mentioned in
this presentation and nor do they assume any liability or responsibility for the outcome of decisions taken as a result of
any reliance placed on this presentation.
Neither Aranca nor IBEF shall be liable for any direct or indirect damages that may arise due to any act or omission on
the part of the user due to any reliance placed or guidance taken from any portion of this presentation.