entrepreneurial finance and venture capital professor xxxxx course name / number
TRANSCRIPT

Entrepreneurial FinanceAnd Venture Capital
Professor XXXXXCourse Name / Number
2
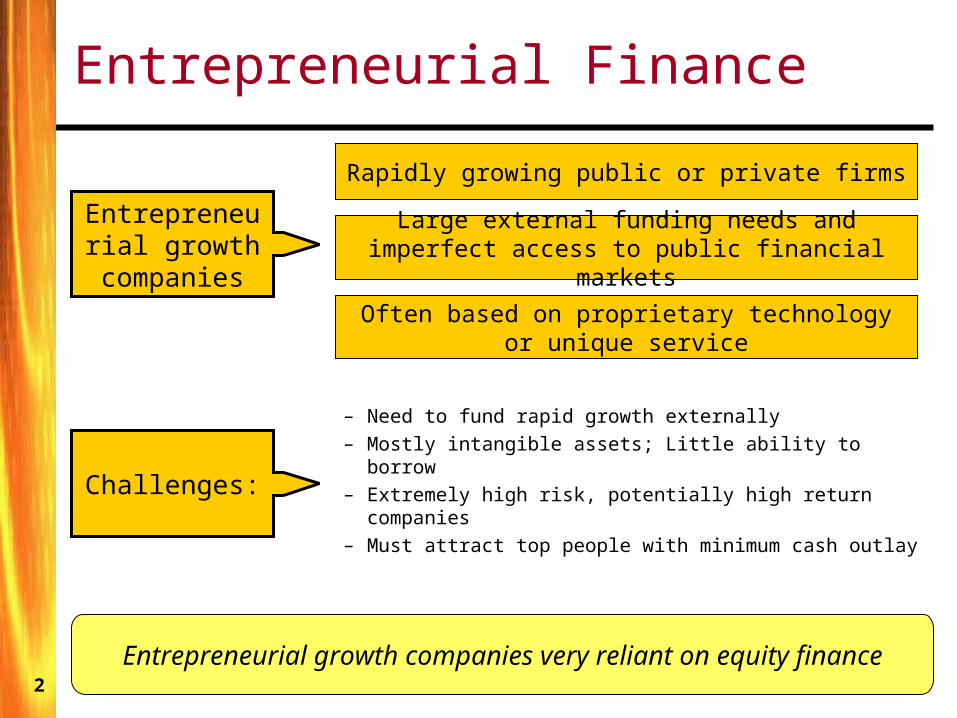
Entrepreneurial Finance
Entrepreneurial growth companies
Rapidly growing public or private firms
Large external funding needs and imperfect access to public financial markets
Often based on proprietary technology or unique service
Challenges:
– Need to fund rapid growth externally– Mostly intangible assets; Little ability to borrow– Extremely high risk, potentially high return
companies– Must attract top people with minimum cash outlay
Entrepreneurial growth companies very reliant on equity finance
3
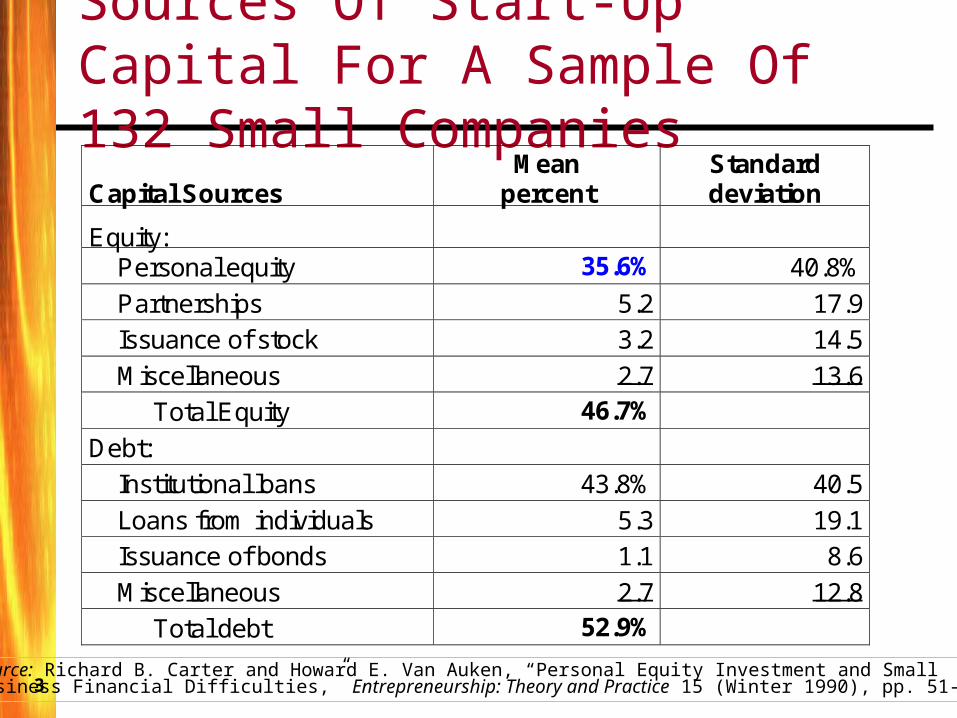
Sources Of Start-Up Capital For A Sample Of 132 Small Companies
Capital Sources
Mean percent
Standard deviation
Equity:
Personal equity 35.6% 40.8%
Partnerships 5.2 17.9
Issuance of stock 3.2 14.5
Miscellaneous 2.7 13.6
Total Equity 46.7%
Debt:
Institutional loans 43.8% 40.5
Loans from individuals 5.3 19.1
Issuance of bonds 1.1 8.6
Miscellaneous 2.7 12.8
Total debt 52.9%
Source: Richard B. Carter and Howard E. Van Auken, “Personal Equity Investment and Small Business Financial Difficulties,” Entrepreneurship: Theory and Practice 15 (Winter 1990), pp. 51-60.
4
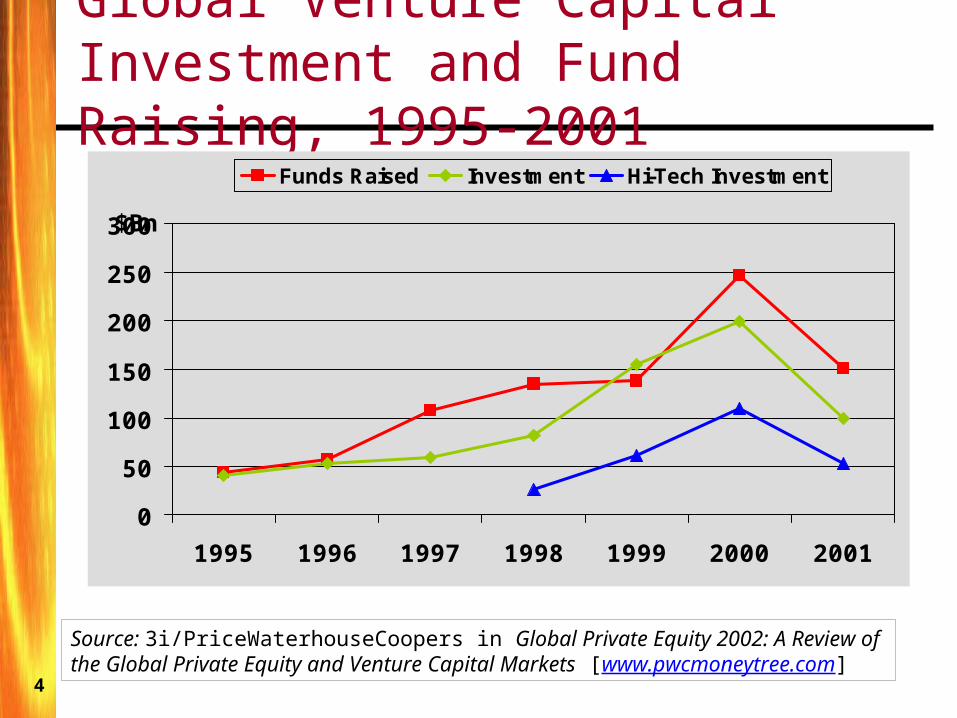
Global Venture Capital Investment and Fund Raising, 1995-2001
0
50
100
150
200
250
300
1995 1996 1997 1998 1999 2000 2001
Funds Raised Investment Hi-Tech Investment
$Bn
Source: 3i/PriceWaterhouseCoopers in Global Private Equity 2002: A Review of the Global Private Equity and Venture Capital Markets [www.pwcmoneytree.com]
5
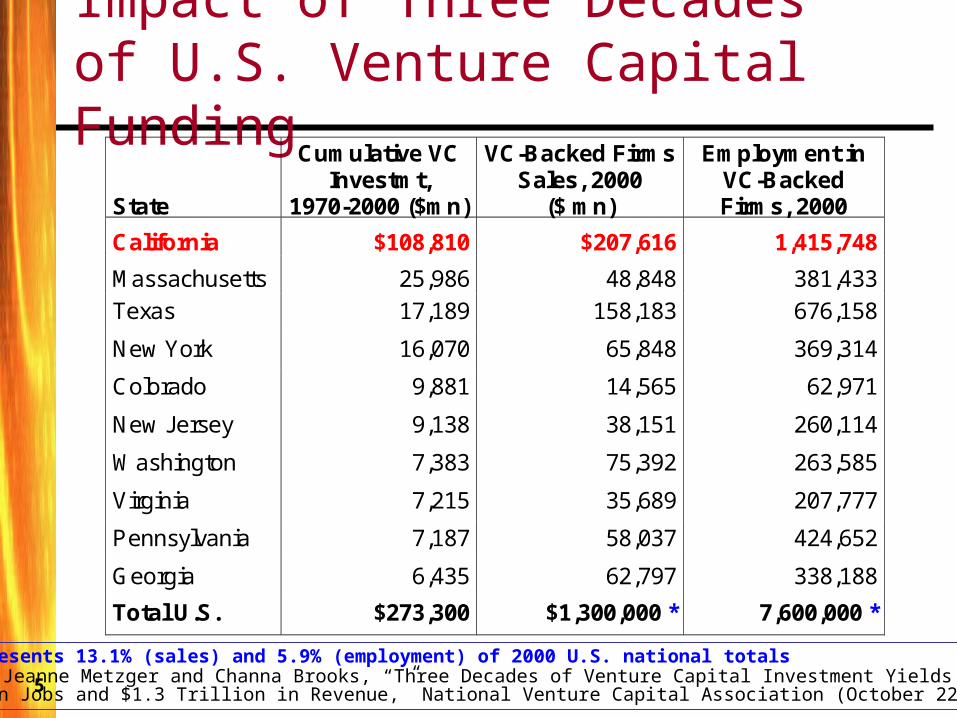
Impact of Three Decades of U.S. Venture Capital Funding
State
Cumulative VC Investmt,
1970-2000 ($mn)
VC-Backed Firms Sales, 2000
($ mn)
Employment in VC-Backed Firms, 2000
California
$108,810
$207,616
1,415,748
Massachusetts
25,986
48,848
381,433
Texas 17,189 158,183 676,158
New York 16,070 65,848 369,314
Colorado 9,881 14,565 62,971
New Jersey 9,138 38,151 260,114
Washington 7,383 75,392 263,585
Virginia 7,215 35,689 207,777
Pennsylvania 7,187 58,037 424,652
Georgia 6,435 62,797 338,188
Total U.S. $273,300 $1,300,000 * 7,600,000 *
* Represents 13.1% (sales) and 5.9% (employment) of 2000 U.S. national totalsSource: Jeanne Metzger and Channa Brooks, “Three Decades of Venture Capital Investment Yields 7.6Million Jobs and $1.3 Trillion in Revenue,” National Venture Capital Association (October 22, 2002).
6
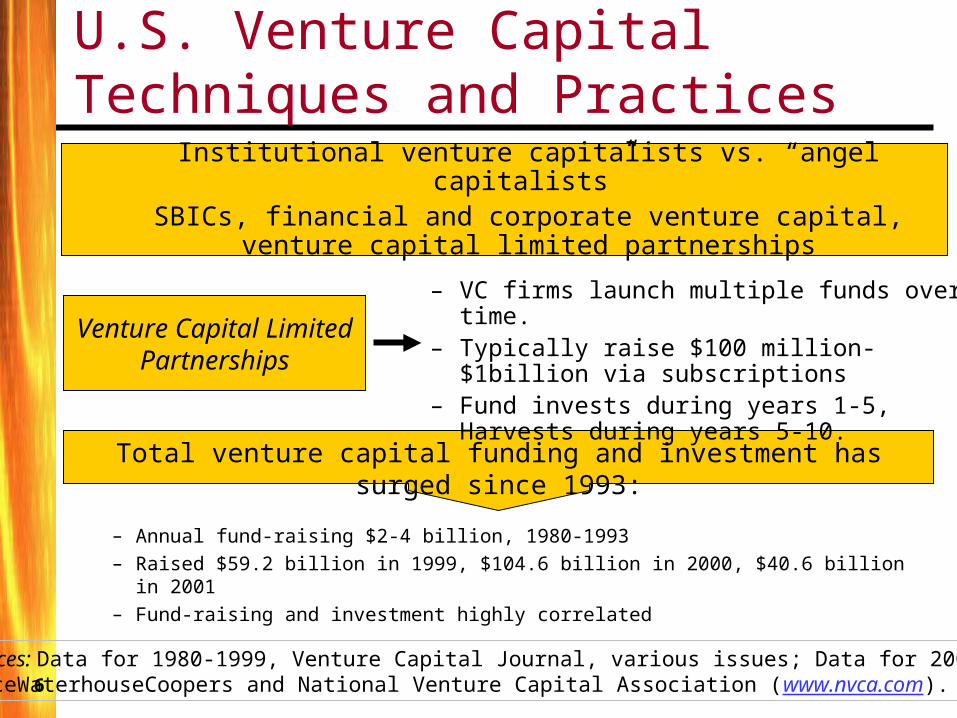
U.S. Venture Capital Techniques and Practices
Total venture capital funding and investment has surged since 1993:
– Annual fund-raising $2-4 billion, 1980-1993– Raised $59.2 billion in 1999, $104.6 billion in 2000, $40.6 billion in 2001– Fund-raising and investment highly correlated
Institutional venture capitalists vs. “angel capitalists”SBICs, financial and corporate venture capital, venture
capital limited partnerships
Venture Capital Limited Partnerships
– VC firms launch multiple funds over time.– Typically raise $100 million-$1billion via
subscriptions– Fund invests during years 1-5, Harvests
during years 5-10.
Sources: Data for 1980-1999, Venture Capital Journal, various issues; Data for 2000-2001,PriceWaterhouseCoopers and National Venture Capital Association (www.nvca.com).
7
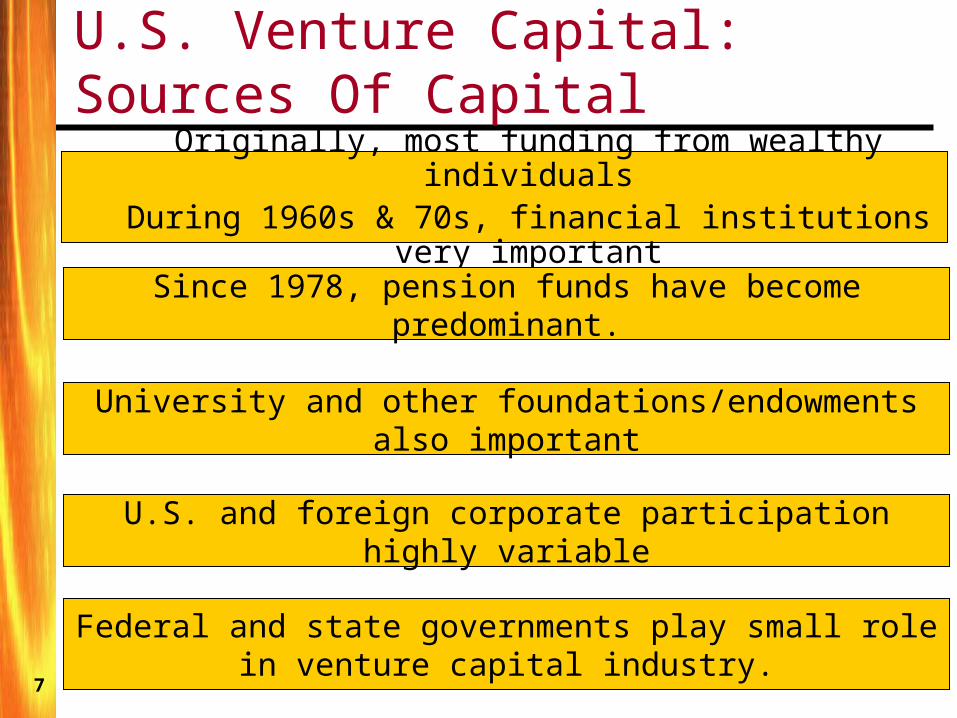
U.S. Venture Capital: Sources Of Capital
Originally, most funding from wealthy individualsDuring 1960s & 70s, financial institutions very
important
Since 1978, pension funds have become predominant.
University and other foundations/endowments also important
U.S. and foreign corporate participation highly variable
Federal and state governments play small role in venture capital industry.
8
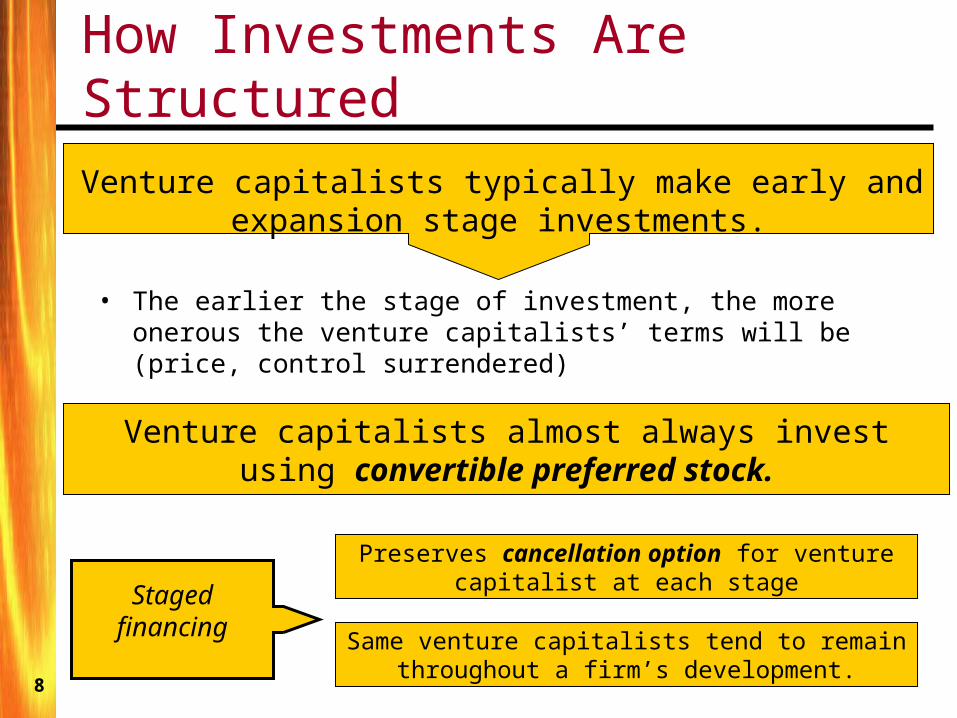
How Investments Are Structured
Venture capitalists almost always invest using convertible preferred stock.
Venture capitalists typically make early and expansion stage investments.
• The earlier the stage of investment, the more onerous the venture capitalists’ terms will be (price, control surrendered)
Staged financing
Preserves cancellation option for venture capitalist at each stage
Same venture capitalists tend to remain throughout a firm’s development.
9
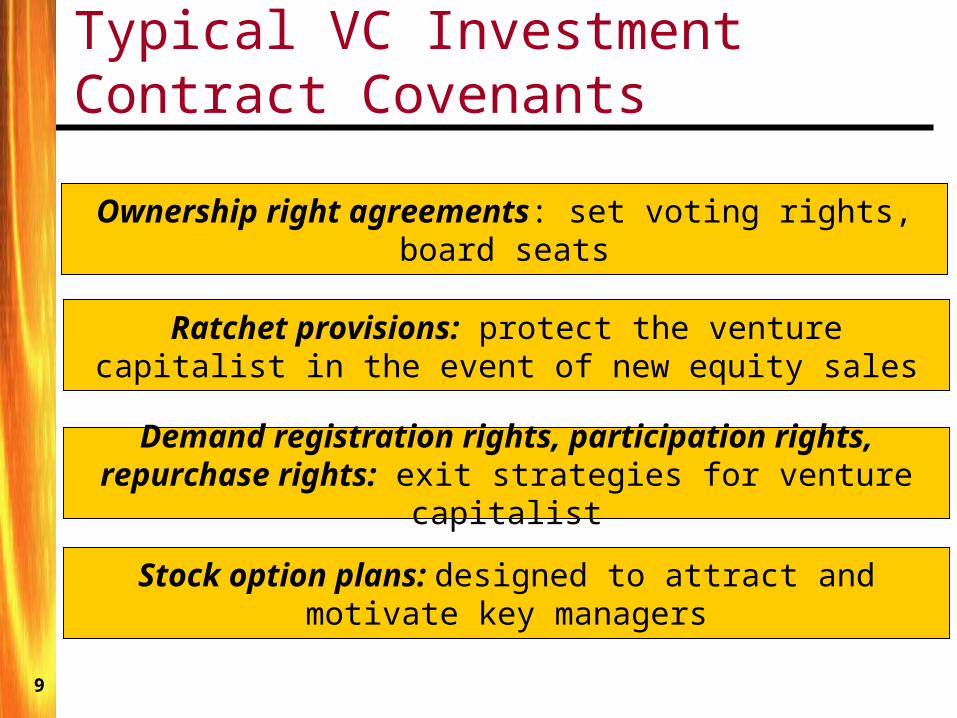
Typical VC Investment Contract Covenants
Ownership right agreements: set voting rights, board seats
Ratchet provisions: protect the venture capitalist in the event of new equity sales
Demand registration rights, participation rights, repurchase rights: exit strategies for
venture capitalist
Stock option plans: designed to attract and motivate key managers
10
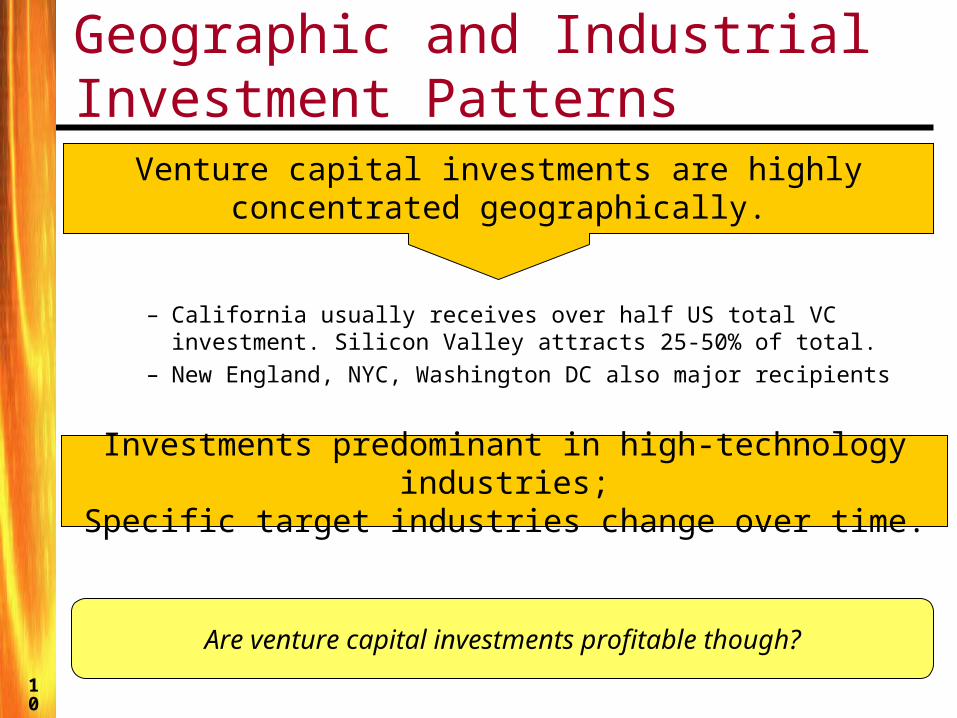
Geographic and Industrial Investment PatternsVenture capital investments are highly concentrated
geographically.
– California usually receives over half US total VC investment. Silicon Valley attracts 25-50% of total.
– New England, NYC, Washington DC also major recipients
Investments predominant in high-technology industries;
Specific target industries change over time.
Are venture capital investments profitable though?
11
-20
0
20
40
60
80
100
120
140
160
1974 1976 1978 1980 1982 1984 1986 1988 1990 1992 1994 1996 1998
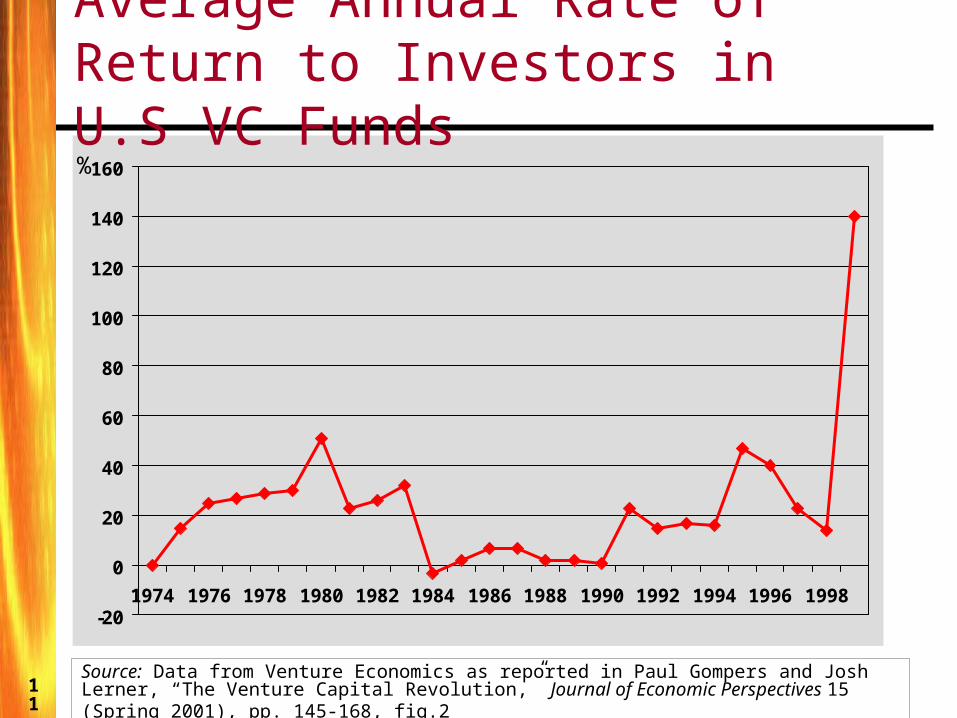
Average Annual Rate of Return to Investors in U.S VC Funds%
Source: Data from Venture Economics as reported in Paul Gompers and Josh Lerner, “The Venture Capital Revolution,” Journal of Economic Perspectives 15 (Spring 2001), pp. 145-168, fig.2
12
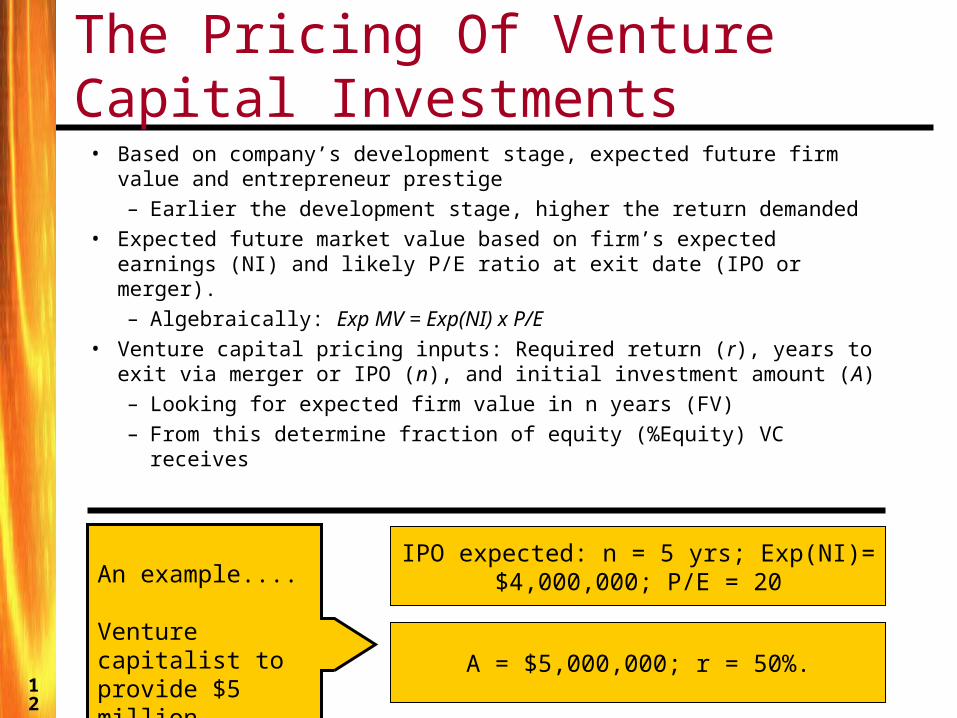
The Pricing Of Venture Capital Investments
• Based on company’s development stage, expected future firm value and entrepreneur prestige– Earlier the development stage, higher the return demanded
• Expected future market value based on firm’s expected earnings (NI) and likely P/E ratio at exit date (IPO or merger).– Algebraically: Exp MV = Exp(NI) x P/E
• Venture capital pricing inputs: Required return (r), years to exit via merger or IPO (n), and initial investment amount (A)– Looking for expected firm value in n years (FV)– From this determine fraction of equity (%Equity) VC receives
An example....
Venture capitalist to provide $5 million
IPO expected: n = 5 yrs; Exp(NI)= $4,000,000; P/E = 20
A = $5,000,000; r = 50%.
13
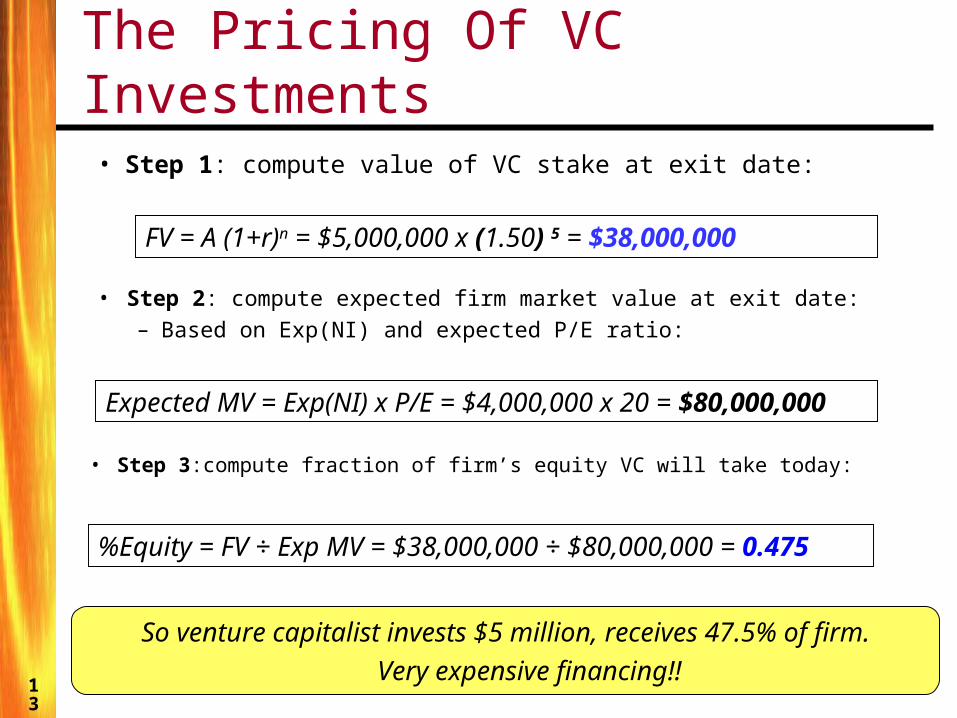
The Pricing Of VC Investments• Step 1: compute value of VC stake at exit date:
FV = A (1+r)n = $5,000,000 x (1.50) 5 = $38,000,000
• Step 2: compute expected firm market value at exit date:– Based on Exp(NI) and expected P/E ratio:
Expected MV = Exp(NI) x P/E = $4,000,000 x 20 = $80,000,000
• Step 3:compute fraction of firm’s equity VC will take today:
%Equity = FV ÷ Exp MV = $38,000,000 ÷ $80,000,000 = 0.475
So venture capitalist invests $5 million, receives 47.5% of firm.
Very expensive financing!!
14
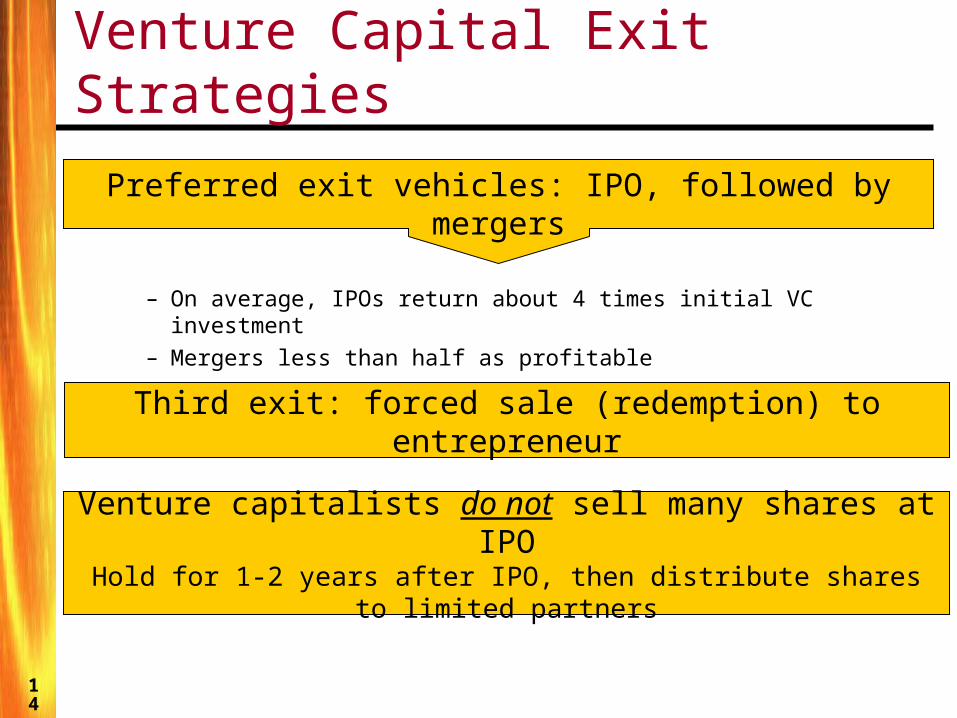
Venture Capital Exit Strategies
Preferred exit vehicles: IPO, followed by mergers
– On average, IPOs return about 4 times initial VC investment– Mergers less than half as profitable
Third exit: forced sale (redemption) to entrepreneur
Venture capitalists do not sell many shares at IPOHold for 1-2 years after IPO, then distribute shares to limited
partners
15
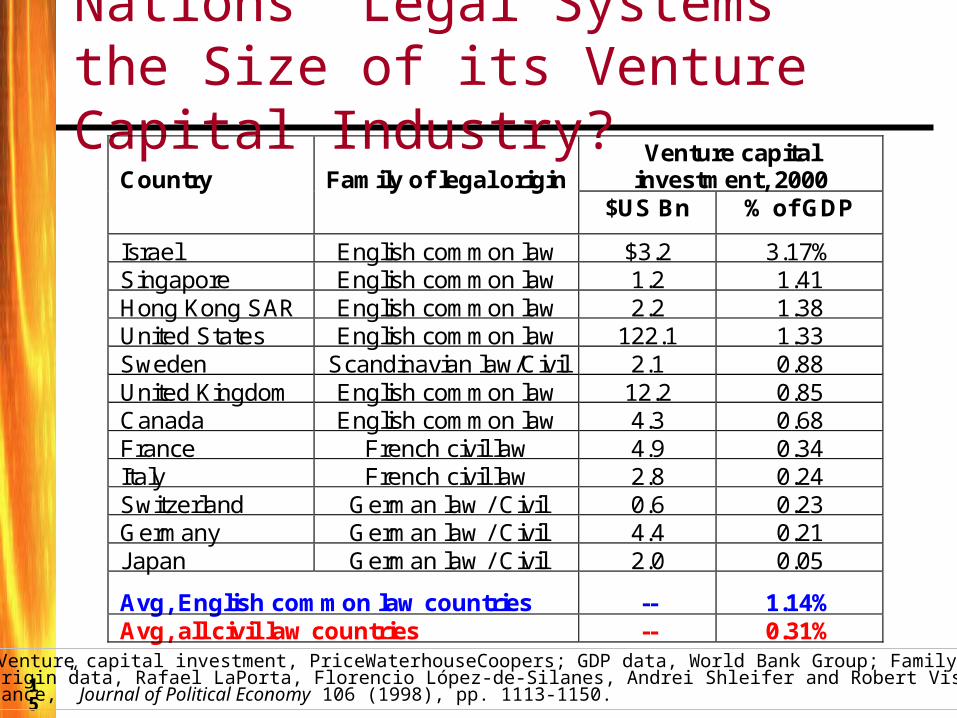
Nations’ Legal Systems the Size of its Venture Capital Industry? Venture capital
investment, 2000 Country
Family of legal origin
$US Bn % of GDP
Israel English common law $3.2 3.17% Singapore English common law 1.2 1.41 Hong Kong SAR English common law 2.2 1.38 United States English common law 122.1 1.33 Sweden Scandinavian law/Civil 2.1 0.88 United Kingdom English common law 12.2 0.85 Canada English common law 4.3 0.68 France French civil law 4.9 0.34 Italy French civil law 2.8 0.24 Switzerland German law / Civil 0.6 0.23 Germany German law / Civil 4.4 0.21 Japan German law / Civil 2.0 0.05
Avg, English common law countries
--
1.14% Avg, all civil law countries -- 0.31%
Sources: Venture capital investment, PriceWaterhouseCoopers; GDP data, World Bank Group; Family oflegal origin data, Rafael LaPorta, Florencio López-de-Silanes, Andrei Shleifer and Robert Vishny, “Law and Finance,” Journal of Political Economy 106 (1998), pp. 1113-1150.
16
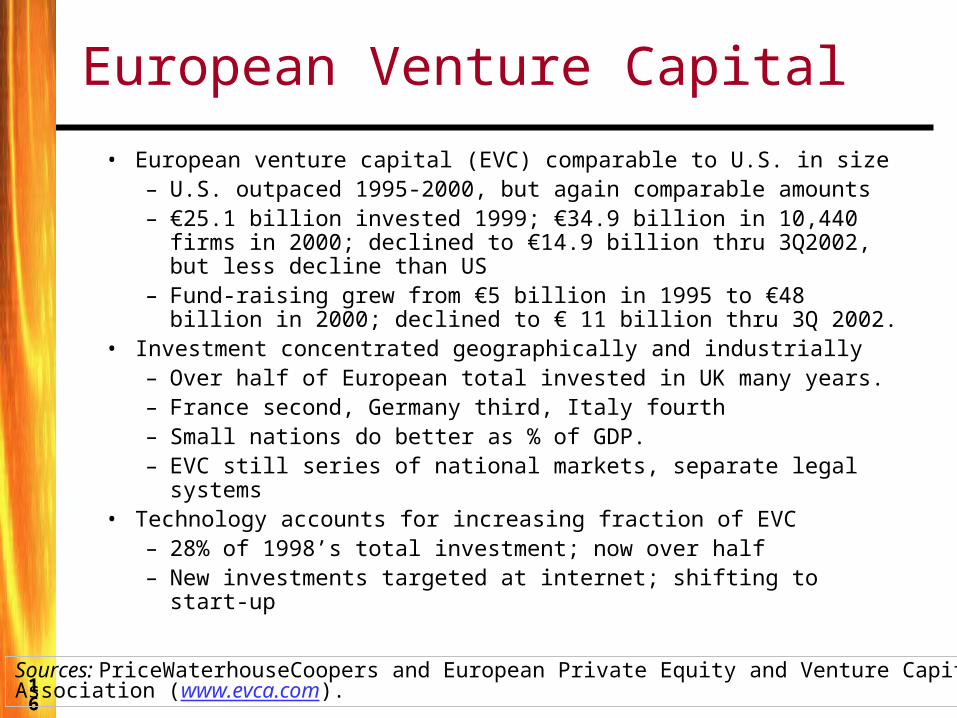
European Venture Capital
• European venture capital (EVC) comparable to U.S. in size – U.S. outpaced 1995-2000, but again comparable amounts– €25.1 billion invested 1999; €34.9 billion in 10,440 firms
in 2000; declined to €14.9 billion thru 3Q2002, but less decline than US
– Fund-raising grew from €5 billion in 1995 to €48 billion in 2000; declined to € 11 billion thru 3Q 2002.
• Investment concentrated geographically and industrially– Over half of European total invested in UK many years.– France second, Germany third, Italy fourth – Small nations do better as % of GDP.– EVC still series of national markets, separate legal
systems• Technology accounts for increasing fraction of EVC
– 28% of 1998’s total investment; now over half– New investments targeted at internet; shifting to start-up
Sources: PriceWaterhouseCoopers and European Private Equity and Venture Capital Association (www.evca.com).
17
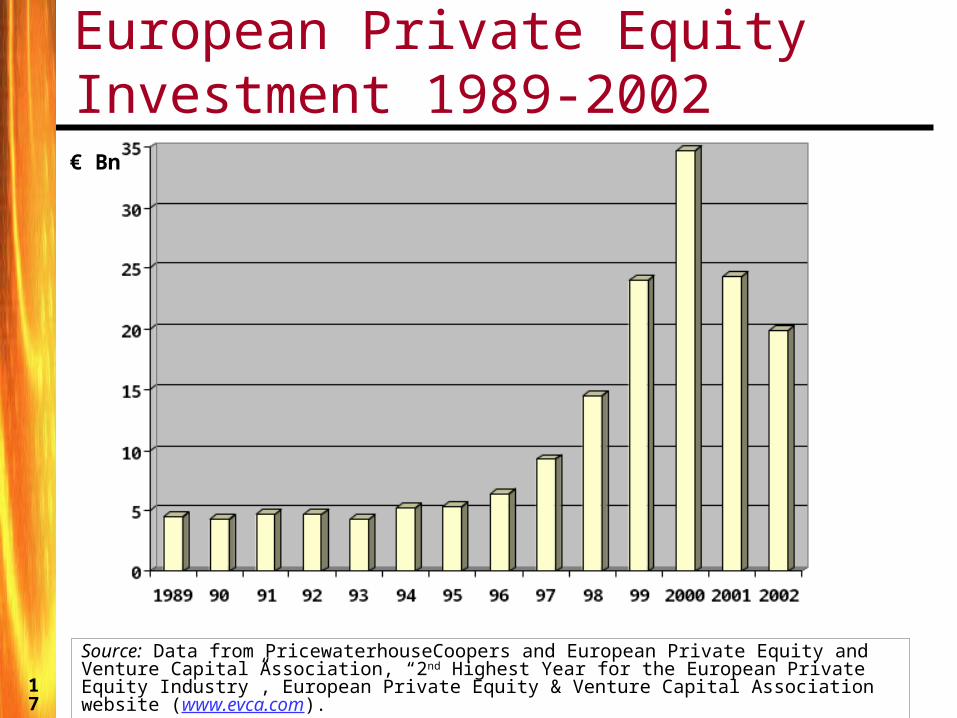
European Private Equity Investment 1989-2002€ Bn
Source: Data from PricewaterhouseCoopers and European Private Equity and Venture Capital Association, “2nd Highest Year for the European Private Equity Industry”, European Private Equity & Venture Capital Association website (www.evca.com).
18
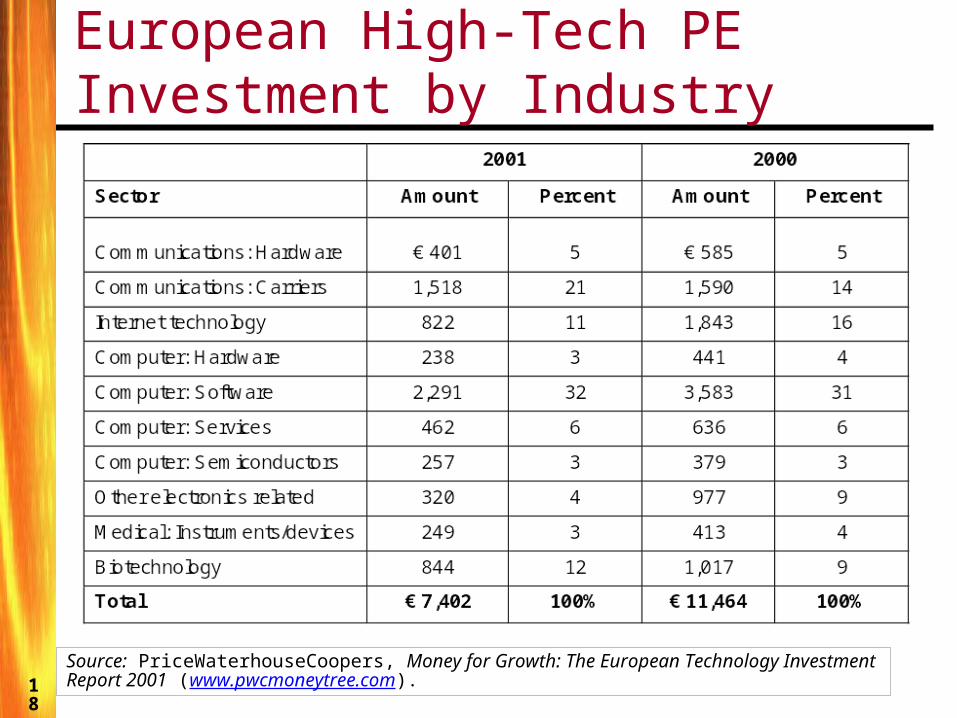
European High-Tech PE Investment by Industry
Source: PriceWaterhouseCoopers, Money for Growth: The European Technology Investment Report 2001 (www.pwcmoneytree.com).
19
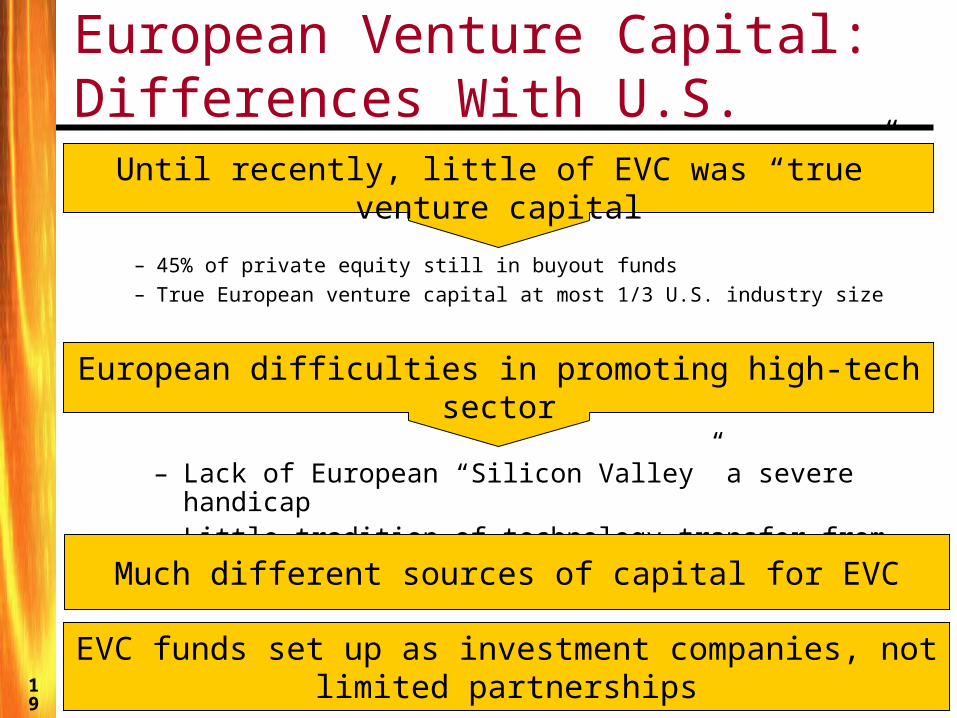
European Venture Capital: Differences With U.S.Until recently, little of EVC was “true” venture capital
– 45% of private equity still in buyout funds– True European venture capital at most 1/3 U.S. industry size
European difficulties in promoting high-tech sector
– Lack of European “Silicon Valley” a severe handicap– Little tradition of technology transfer from
universitiesMuch different sources of capital for EVC
EVC funds set up as investment companies, not limited partnerships
20
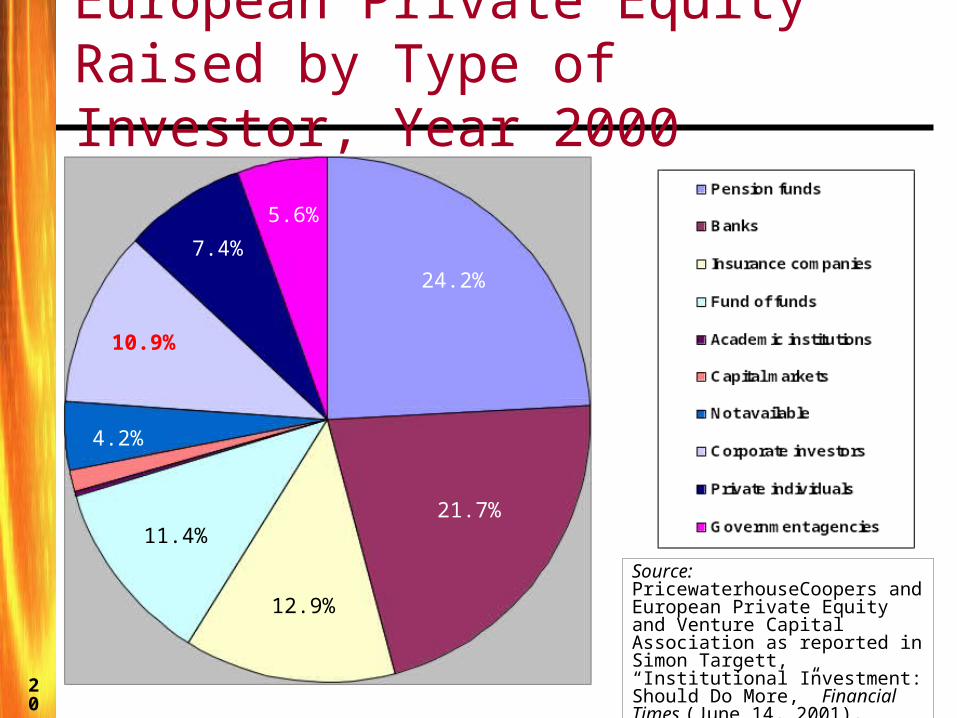
European Private Equity Raised by Type of Investor, Year 2000
24.2%
21.7%
12.9%
11.4%
4.2%
7.4%
10.9%
5.6%
Source: PricewaterhouseCoopers and European Private Equity and Venture Capital Association as reported in Simon Targett, “Institutional Investment: Should Do More,” Financial Times (June 14, 2001), European Private Equity Survey, p. 5
21
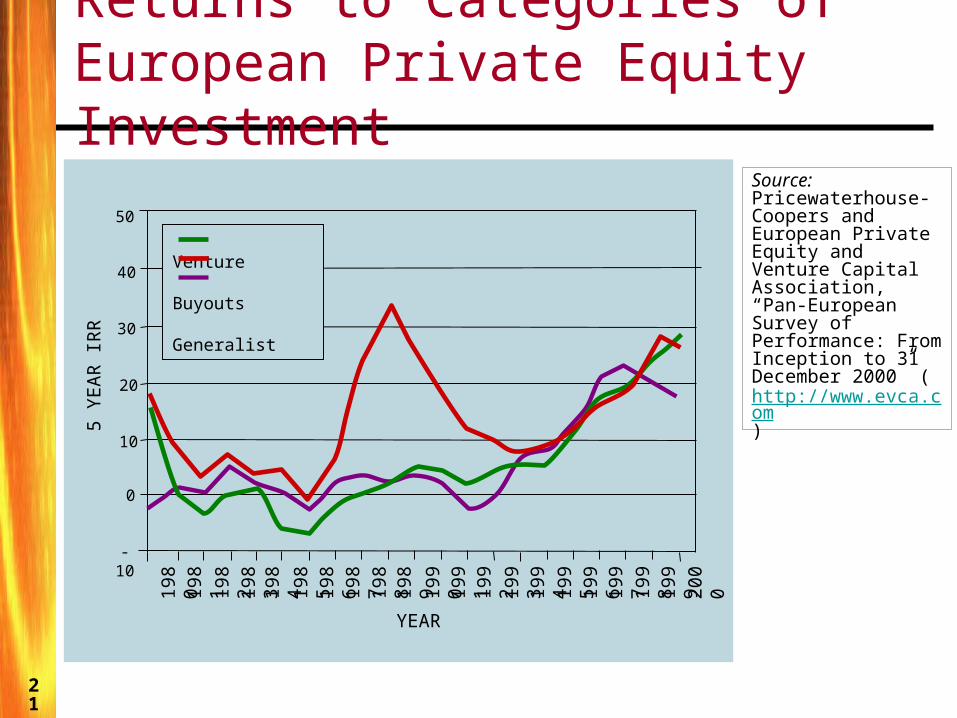
Returns to Categories of European Private Equity Investment
50
40
30
20
10
0
-10
198
0
198
1
198
2
198
319
84
198
519
86
198
7
198
819
89
199
019
91
199
2
199
319
94
199
5
199
619
97
199
819
99
200
0
YEAR
5 Y
EA
R I
RR
Venture Buyouts Generalist
Source: Pricewaterhouse-Coopers and European Private Equity and Venture Capital Association, “Pan-European Survey of Performance: From Inception to 31 December 2000” (http://www.evca.com)
22
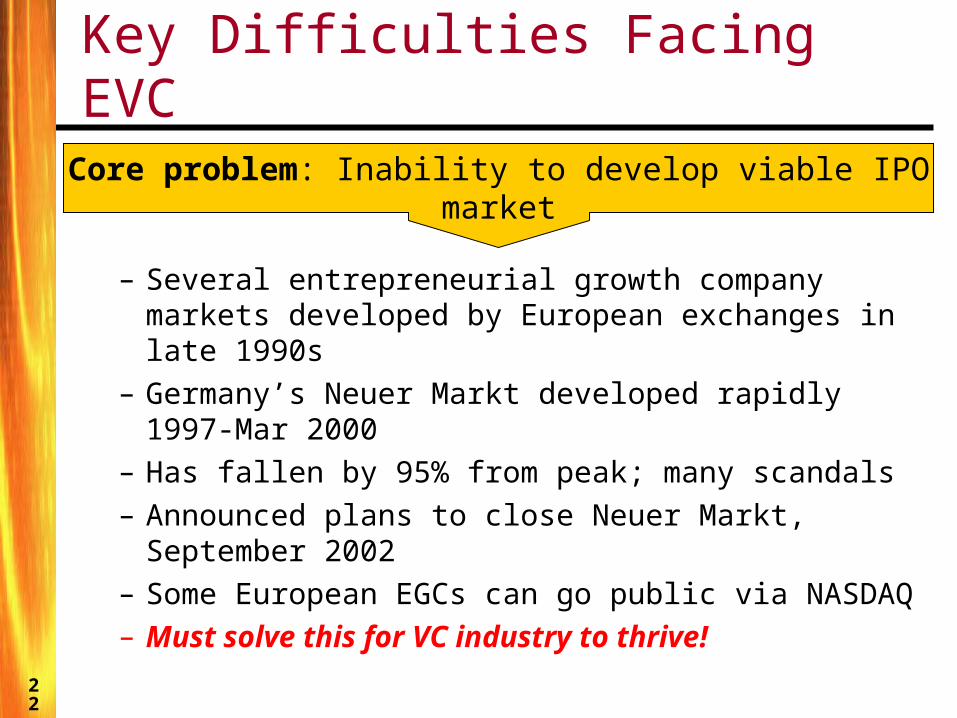
Key Difficulties Facing EVC
Core problem: Inability to develop viable IPO market
– Several entrepreneurial growth company markets developed by European exchanges in late 1990s
– Germany’s Neuer Markt developed rapidly 1997-Mar 2000
– Has fallen by 95% from peak; many scandals– Announced plans to close Neuer Markt,
September 2002 – Some European EGCs can go public via NASDAQ– Must solve this for VC industry to thrive!
23
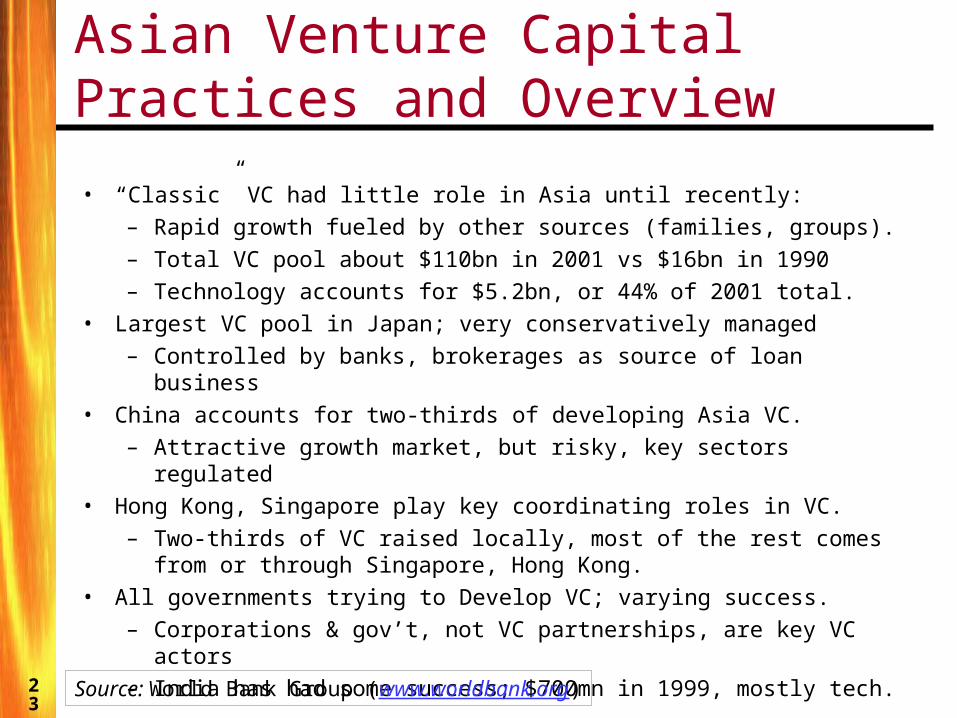
Asian Venture Capital Practices and Overview
• “Classic” VC had little role in Asia until recently:– Rapid growth fueled by other sources (families, groups).– Total VC pool about $110bn in 2001 vs $16bn in 1990– Technology accounts for $5.2bn, or 44% of 2001 total.
• Largest VC pool in Japan; very conservatively managed– Controlled by banks, brokerages as source of loan business
• China accounts for two-thirds of developing Asia VC.– Attractive growth market, but risky, key sectors regulated
• Hong Kong, Singapore play key coordinating roles in VC.– Two-thirds of VC raised locally, most of the rest comes from
or through Singapore, Hong Kong.• All governments trying to Develop VC; varying success.
– Corporations & gov’t, not VC partnerships, are key VC actors– India has had some success; $700mn in 1999, mostly tech.
Source: World Bank Group (www.worldbank.org)
24
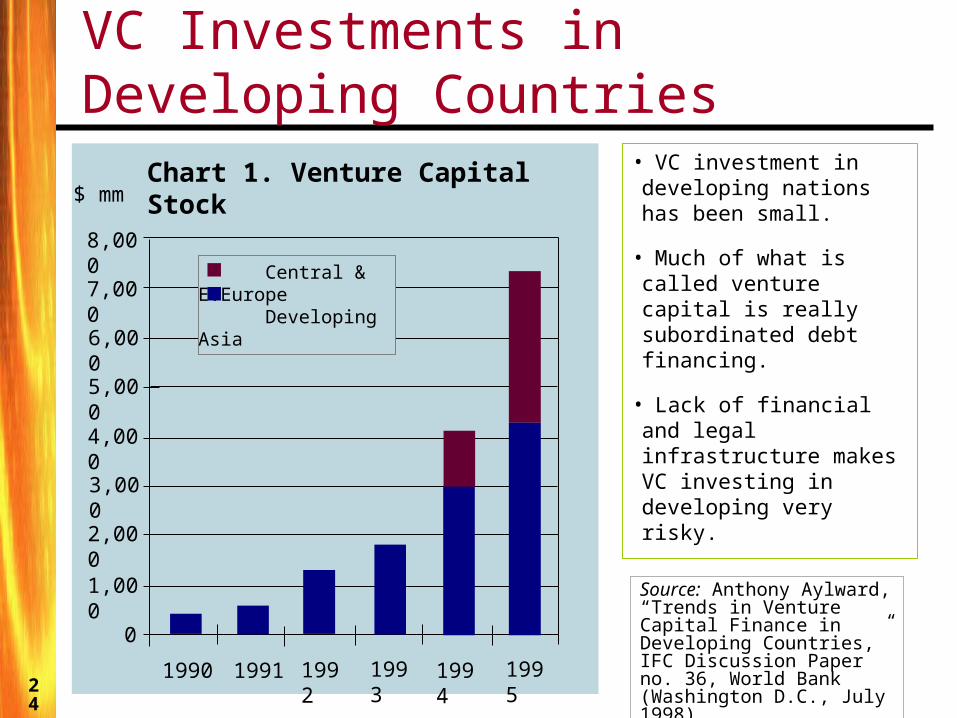
VC Investments in Developing Countries
• VC investment in developing nations has been small.
• Much of what is called venture capital is really subordinated debt financing.
• Lack of financial and legal infrastructure makes VC investing in developing very risky.
Chart 1. Venture Capital Stock
8,000
7,000
6,000
5,000
4,000
3,000
2,000
1,000
0
1990 1991 1992 1993 1994 1995
Central & E.Europe Developing Asia
$ mm
Source: Anthony Aylward, “Trends in Venture Capital Finance in Developing Countries,” IFC Discussion Paper no. 36, World Bank (Washington D.C., July 1998)
25
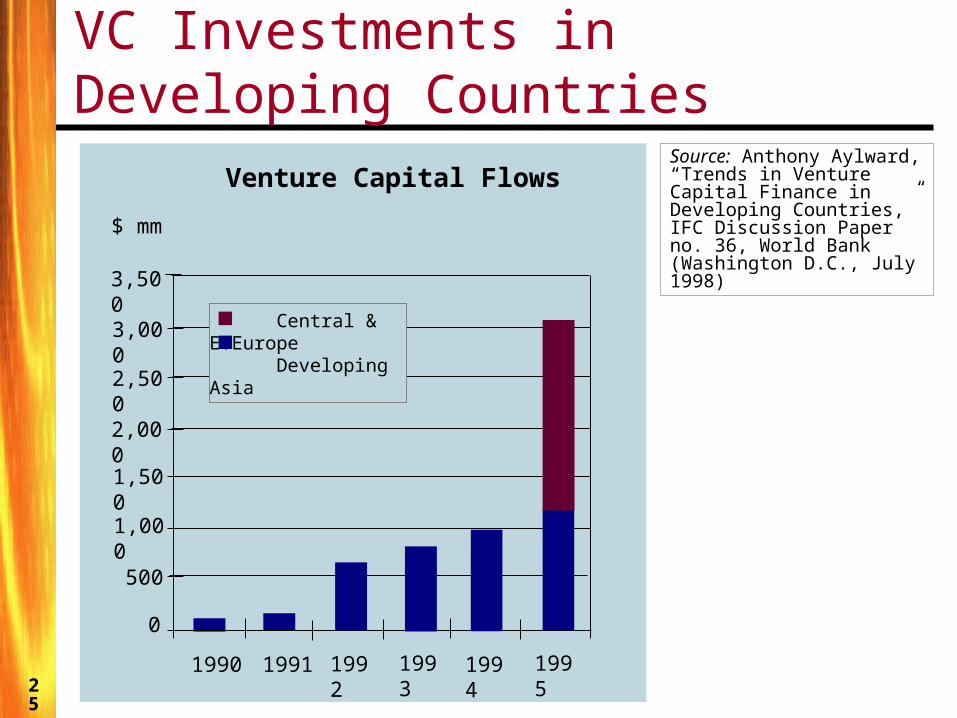
VC Investments in Developing Countries
Venture Capital Flows
3,500
3,000
2,500
1,500
1,000
500
0
2,000
1990 1991 1992 1993 1994 1995
Central & E.Europe Developing Asia
$ mm
Source: Anthony Aylward, “Trends in Venture Capital Finance in Developing Countries,” IFC Discussion Paper no. 36, World Bank (Washington D.C., July 1998)
26
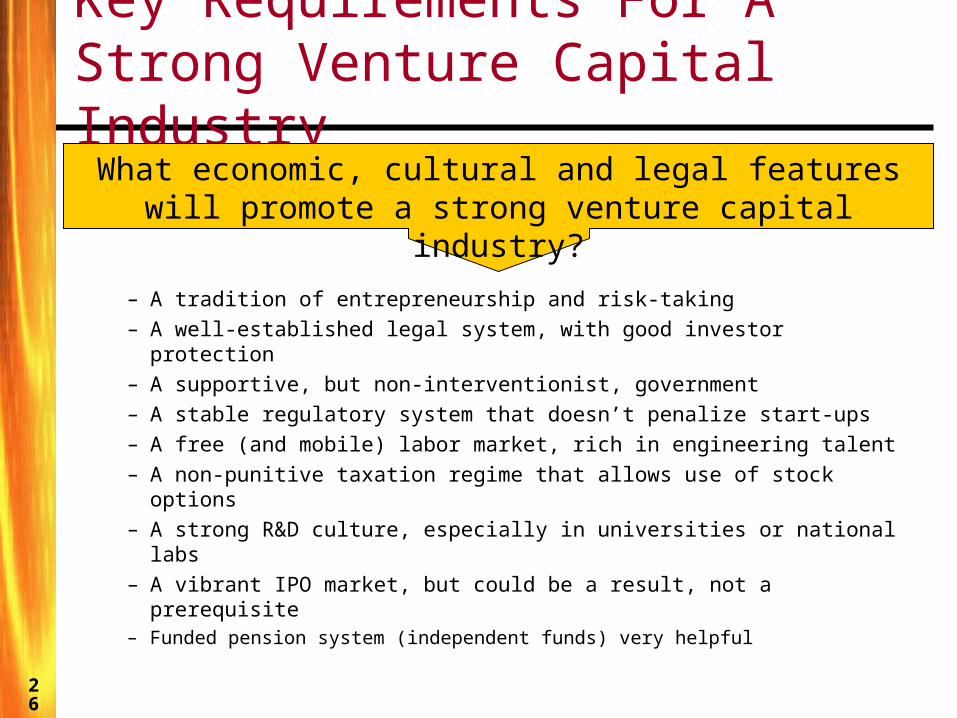
Key Requirements For A Strong Venture Capital Industry
– A tradition of entrepreneurship and risk-taking– A well-established legal system, with good investor protection– A supportive, but non-interventionist, government– A stable regulatory system that doesn’t penalize start-ups– A free (and mobile) labor market, rich in engineering talent– A non-punitive taxation regime that allows use of stock options– A strong R&D culture, especially in universities or national labs– A vibrant IPO market, but could be a result, not a prerequisite– Funded pension system (independent funds) very helpful
What economic, cultural and legal features will promote a strong venture capital industry?
EGCs have large external funding needs.
Venture capitalists provide risk capital as well as managerial oversight.
U.S. venture capital highly concentrated geographically and industrially.
U.S. and European venture capital increased dramatically last decade.
Entrepreneurial FinanceAnd Venture Capital