entrepreneurial perspectives and employee...
TRANSCRIPT

Copyright UCT
ENTREPRENEURIAL PERSPECTIVES AND EMPLOYEE BEHAVIOUR
A Research Report
presented to
The Graduate School of Business
University of Cape Town
In partial fulfilment of the requirements for the
Masters of Business Administration Degree
By
Godfrey Kalumbi
December 2014
Supervisor: Elspeth Donovan

Copyright UCT
2
PLAGIARISM DECLARATION
1. I know that plagiarism is wrong. Plagiarism is to use another’s work and pretend that it is
one’s own.
2. I have used the APA referencing system for this assignment.
3. This assignment is my own work.
4. I have not allowed, and will not allow, anyone to copy my work with the intention of
passing it off as his or her own work.
I acknowledge that copying someone else’s assignment or essay, or part of it, is wrong, and
declare that this is my own work.
Signed: 8 December 2014
Godfrey Kalumbi

Copyright UCT
3
ACKNOWLEDGEMENTS
This research paper was a culmination of two challenging but rewarding years of the MBA
programme. More than anything, this programme was a journey in self-discovery and personal
growth that has set a path for the future both in terms of life and career. It is an experience that
will remain memorable and valuable for years to come.
This research paper is dedicated to my dear late mother, Florence Kalumbi, who remains a great
inspiration to this day in all aspects of life. All of this would not have been possible were it not
for her strong emphasis on hard work and ambition in all of those years spent under her
guidance.
I would like to thank my brothers Mac Davel and Alfred for all their understanding and support
during these busy two years and I hope my experience has encouraged you in one way or
another. I would also like to thank other family members and friends whose words of
encouragement kept me going even when the times were difficult. My thanks also extend to all
those who made this research paper possible by participating or contributing to the study in one
way or another.
Finally, and very importantly, my special thanks go to my research supervisor, Elspeth Donovan,
for her commitment to guiding the entire research process. Your encouragement and timely
feedback made an immense contribution to the research project.

Copyright UCT
4
ABSTRACT
This research took a case study approach to analyse the entrepreneurial perspectives and
behaviour in a Malawian enterprise within the beverage industry. The perspectives of
organisation members were examined on the basis of seniority and human capital with respect to
entrepreneurial behaviour, organisation factors and social capital. The Corporate
Entrepreneurship Assessment Instrument (CEAI) was the primary tool of analysis. The study
found that managers had a more positive perception of organisation factors for entrepreneurship,
namely: management support, work discretion and culture. However, the study also found that
perceptions of entrepreneurial behaviour did not differ according to seniority suggesting that
managers did not capitalise on their more positive perceptions of organisation factors to further
enhance entrepreneurial behaviour. Furthermore, the study found that entrepreneurial behaviour
could be taught in organisations by enhancing human capital development activities including
education, training and knowledge sharing. Social capital was also found to have a positive effect
on entrepreneurial behaviour although it was not identified as a primary predictor of
entrepreneurial behaviour. Finally, the study also identified a need for further construct validity
of the CEAI as a measure of organisation factors for entrepreneurship.
Key Words:
Strategic entrepreneurship, corporate entrepreneurship, human capital, social capital

Copyright UCT
5
TABLE OF CONTENTS
1 INTRODUCTION ................................................................................................................... 9
1.1 RESEARCH AREA AND PROBLEM ........................................................................... 9
1.2 RESEARCH QUESTIONS AND SCOPE ..................................................................... 10
1.3 RESEARCH ASSUMPTIONS AND ETHICS ............................................................. 11
2 LITERATURE REVIEW ...................................................................................................... 12
2.1 INTRODUCTION .......................................................................................................... 12
2.2 FRAMEWORKS OF ORGANISATION ENTREPRENEURSHIP.............................. 13
2.3 ORGANISATION ARCHITECTURE THEORY ......................................................... 18
2.4 ENTREPRENEURIAL BEHAVIOR AND INTENSITY ............................................. 21
2.5 HUMAN AND SOCIAL CAPITAL .............................................................................. 22
2.6 ENTREPRENEURIAL LEADERSHIP ......................................................................... 25
2.7 CONCLUSIONS ............................................................................................................ 26
3 RESEARCH METHODOLOGY .......................................................................................... 29
3.1 RESEARCH APPROACH AND STRATEGY ............................................................. 29
3.2 RESEARCH DESIGN, DATA COLLECTION METHODS AND RESEARCH
INSTRUMENTS ....................................................................................................................... 29
3.2.1 RESEARCH DESIGN ............................................................................................ 29
3.2.2 DATA COLLECTION METHODS ....................................................................... 30
3.2.3 RESEARCH INSTRUMENTS ............................................................................... 30
3.3 SAMPLING ................................................................................................................... 31
3.4 DATA ANALYSIS METHODS .................................................................................... 32
4 RESEARCH FIDNINGS ANALYSIS AND DISCUSSION ................................................ 34
4.1 RESEARCH FINDINGS ............................................................................................... 34
4.1.1 DESCRIPTIVE STATSTICS: ENTREPRENEURIAL BEHAVIOUR ................. 34
4.1.2 FIRST MULTIPLE ANALYSIS OF VARIANCE ................................................ 36
4.1.3 SECOND MULTIPLE ANALYSIS OF VARIANCE ........................................... 41
4.1.4 REGRESSION ANALYSIS ................................................................................... 49
4.1.5 EXPLORATORY FACTOR ANALYSIS .............................................................. 50
4.2 RESEARCH ANALYSIS AND DISCUSSION ............................................................ 56
4.2.1 ENTREPRENEURIAL BEHAVIOUR AND ENVIRONMENT .......................... 56

Copyright UCT
6
4.2.2 ENTREPRENEURSHIP ANTECEDENTS ........................................................... 59
4.2.3 ORGANISATION CULTURE ............................................................................... 64
4.2.4 SOCIAL CAPITAL ................................................................................................ 65
4.2.5 MANAGERIAL ROLES ........................................................................................ 66
4.2.6 A FIFTEEN FACTOR SOLUTION TO THE CEAI ............................................. 67
4.3 RESEARCH LIMITATIONS ........................................................................................ 69
4.4 RESEARCH CONCLUSIONS ...................................................................................... 70
4.5 IMPLICATIONS OF THE STUDY .............................................................................. 72
4.6 FUTURE RESEARCH DIRECTIONS .......................................................................... 73
5 REFERENCES ...................................................................................................................... 74
6 APPENDICES ....................................................................................................................... 78
6.1 APPENDIX 1: SURVEY QUESTIONS / QUESTIONNAIRE .................................... 78
6.2 APPENDIX 2: CORPORATE ENTREPRENEURSHIP ASSESSMENT
INSTRUMENT ......................................................................................................................... 85
6.3 APPENDIX 3: INTRAPRENEURSHIP BEHAVIOUR INSTRUMENT .................... 87
6.4 APPENDIX 4: SCORING SCALES ............................................................................. 88

Copyright UCT
7
LIST OF FIGURES
Figure 1 Middle Managers Perceptions of Corporate Entrepreneurship ...................................... 14
Figure 2 Framework of Strategic Entrepreneurship...................................................................... 15
Figure 3 A Practical Model of Strategic Entrepreneurship ........................................................... 16
Figure 4 An Integrative Model of Corporate Entrepreneurship Strategy ..................................... 17
Figure 5 Normal Q-Q Plots: Entrepreneurial Behavior and Culture ............................................ 37
Figure 6 Normal Q-Q Tests: Entrepreneurship Antecedents ........................................................ 43
Figure 7 Scree Plot Diagram: Entrepreneurial Antecedents ......................................................... 51
Figure 8 Entrepreneurial Intensity Model ..................................................................................... 71
Copyright UCT
8
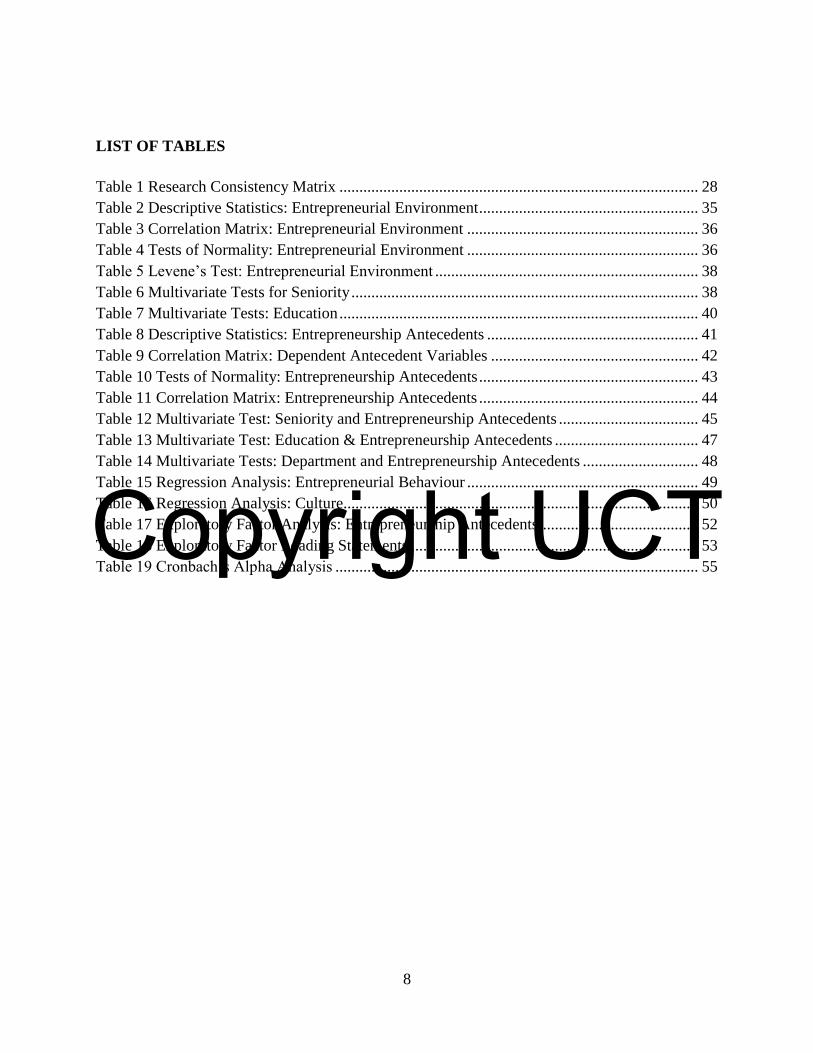
LIST OF TABLES
Table 1 Research Consistency Matrix .......................................................................................... 28
Table 2 Descriptive Statistics: Entrepreneurial Environment ....................................................... 35
Table 3 Correlation Matrix: Entrepreneurial Environment .......................................................... 36
Table 4 Tests of Normality: Entrepreneurial Environment .......................................................... 36
Table 5 Levene’s Test: Entrepreneurial Environment .................................................................. 38
Table 6 Multivariate Tests for Seniority ....................................................................................... 38
Table 7 Multivariate Tests: Education .......................................................................................... 40
Table 8 Descriptive Statistics: Entrepreneurship Antecedents ..................................................... 41
Table 9 Correlation Matrix: Dependent Antecedent Variables .................................................... 42
Table 10 Tests of Normality: Entrepreneurship Antecedents ....................................................... 43
Table 11 Correlation Matrix: Entrepreneurship Antecedents ....................................................... 44
Table 12 Multivariate Test: Seniority and Entrepreneurship Antecedents ................................... 45
Table 13 Multivariate Test: Education & Entrepreneurship Antecedents .................................... 47
Table 14 Multivariate Tests: Department and Entrepreneurship Antecedents ............................. 48
Table 15 Regression Analysis: Entrepreneurial Behaviour .......................................................... 49
Table 16 Regression Analysis: Culture......................................................................................... 50
Table 17 Exploratory Factor Analysis: Entrepreneurship Antecedents ........................................ 52
Table 18 Exploratory Factor Loading Statements ........................................................................ 53
Table 19 Cronbach’s Alpha Analysis ........................................................................................... 55

Copyright UCT
9
1 INTRODUCTION
1.1 RESEARCH AREA AND PROBLEM
With increasingly competitive and dynamic business environments, established organisations
have turned to corporate entrepreneurship strategies to create and exploit new profitable
opportunities (Ireland, Covin, & Kuratko, 2009). One form of organisational entrepreneurship is
strategic entrepreneurship which is concerned with the deliberate organisation-wide reliance on
innovation to rejuvenate the organisation and exploit opportunities while at the same time
creating and sustaining competitive advantage (Kuratko, Hornsby, & Covin, 2014). Strategic
entrepreneurship is directed at revitalising existing organisations and emphasises the balance
between opportunity seeking and advantage seeking behaviours (M. A. Hitt, Ireland, Camp, &
Sexton, 2001). Strategic entrepreneurship can take various forms including strategic renewal,
sustained regeneration, domain redefinition, organisational rejuvenation and business model
reconstruction (Phan, Wright, Ucbasaran, & Tan, 2009). All of these forms of entrepreneurship
require a reconfiguration of internal resources in order to leverage new business opportunities
(Villiers-Scheepers, 2012).
Managers are responsible for creating and implementing entrepreneurial strategies and ideally
seek to drive organisational attitudes by painting a picture of the organisation they desire to see
in the future (Ireland et al., 2009). In order to be effective, entrepreneurial strategies must be
structurally and culturally engrained at all levels of an organisation (Kollmann & Stockmann,
2008). Furthermore, entrepreneurial activities must include all organisation members (M. A. Hitt
et al., 2001) and entrepreneurial behaviour must be embedded to the extent that employees are
motivated to transform entrepreneurial ideas into profitable activities (Ireland & Webb, 2009).
However, implementing such strategies has proved problematic for many firms (Peltola, 2012).
Organisations have found that managers and employees react differently to entrepreneurship and
this leads to a divergence between entrepreneurial vision and outcomes (Monsen & Boss, 2009).
While managers generally display a greater ability to conceptualise and adopt entrepreneurial
concepts, employees may have difficulty with the uncertainty and ambiguity of synthesizing
opportunity seeking and advantage seeking behaviour (Monsen & Boss, 2009). Furthermore, the
lack of congruence between senior manager and middle managers perspectives may also result in

Copyright UCT
10
inconsistent role-sending behaviours which give mixed messages to the rest of the organisation
regarding entrepreneurship strategies (Dess et al., 2003).
In order to address this challenge, Ireland et al. (2009) suggested that four organisational factors
mediate the relationship between entrepreneurial strategy (vision) and outcomes (behaviour) and
these were: structure, culture, rewards and resources. This study undertook an exploratory
analysis of the perspectives of these organisation factors with respect to entrepreneurial
behaviour in a single firm. The study also considered the role of human and social capital and
examined the construct validity of the Corporate Entrepreneurship Assessment Instrument
(CEAI) from an emerging market perspective. This study therefore responded to calls by
Hornsby et al. (2002) for further studies to assess the validity of the instrument. This study also
helped to identify elements of the internal environment that needed to be addressed in order to
promote entrepreneurial behaviour in the case organisation (René van Wyk & Adonisi, 2011)
1.2 RESEARCH QUESTIONS AND SCOPE
Successful implementation of entrepreneurial strategies requires more than a change in mind-set
but also a corresponding shift in the organisations structure, culture and operations (Ireland &
Webb, 2009).
The aim of the research study is to examine entrepreneurial perspectives and employee
behaviours in an emerging market firm.
The research question is – “Does organisation architecture theory account for the relationship
between entrepreneurial perspectives and behaviours in a firm and how critical are human and
social capital resources in this process?”
The research question is addressed through two hypotheses. Firstly, Phan et al. (2009) suggest
that higher level managers have a stronger ability to take advantage of organisation architecture
to increase entrepreneurial orientation. Thus the first hypothesis is:
H1. Various managerial levels provide a differential structural ability to capitalise on a
supportive organisation environment and thereby increase entrepreneurial behaviour.
Secondly, M. A. Hitt et al. (2001) suggest that human and social capital contributes to the
entrepreneurship process through networks and organisational learning. Hayton (2005) concurs

Copyright UCT
11
by stating that higher levels of human capital support the knowledge intensity of the
entrepreneurship process. Thus the second hypothesis is:
H2. Access to human and social capital has a significant positive relationship with
entrepreneurial intensity through knowledge sharing networks and organisational learning
(M. A. Hitt et al., 2001).
1.3 RESEARCH ASSUMPTIONS AND ETHICS
The study assumptions were:
1. The organisation participating in the study had a formal or informal intent to promote
entrepreneurial behaviour. The selected case company was a fast moving consumer goods
entity in the beverage market. The organisation was therefore characterised by a strong
drive for exploring new market opportunities. Thus, the first research assumption was
met.
2. The case organisation was a large entity and had considerable hierarchy to allow a study
of perceptions at various organisation levels. The case organisation had seven grades for
its employees and therefore the assumption was met.
3. The case organisation demonstrated the application of entrepreneurial strategies for a
period not less than six months. The case organisation existed in the beverage market for
many years at the time of the study and this ensured a long history of entrepreneurial
strategies.
Ethical standards were observed through the following measures:
1. Ethics clearance was obtained for the study from the Research in Ethics Committee of the
Graduate School of Business, University of Cape Town.
2. Online surveys were deployed to participants and remained open for a period of three
weeks. Participation was voluntary and the participants were assured of anonymity and
confidentiality of responses. The survey questions are included in Appendix 1.
3. Survey responses were retained for future validation should the need arise.

Copyright UCT
12
2 LITERATURE REVIEW
2.1 INTRODUCTION
Strategic entrepreneurship in its simplest form has been defined as the intersection between
strategic management and entrepreneurship (Kraus, Reschke, & Kauranen, 2011). Strategic
management is concerned with transforming opportunities into sustainable competitive
advantage through designing a firm’s strategy, managing its resources and promoting advantage
seeking behaviour while entrepreneurship promotes organisational renewal through leveraging
uncertainty, risk and opportunity seeking behaviour (Peltola, 2012). Organisations use
entrepreneurship to identify and innovate opportunities not identified or exploited by competitors
and thereby create a unique set of resources to exploit these abilities (Ireland et al., 2009).
Entrepreneurship also creates wealth for the organisation by balancing exploration, exploitation
and innovation activities (Kraus et al., 2011).
Entrepreneurial behaviour in organisations has become important for a number of reasons.
Firstly, entrepreneurship has been identified as essential for all firms to survive in a competitive
environment irrespective of size and age of the organisation (Kraus et al., 2011) . Higher levels
of corporate entrepreneurship are associated with higher levels of competitiveness, performance,
growth and firm survival (R Van Wyk & Adonisi, 2012). Secondly, studies have shown a
positive relationship between entrepreneurial behaviour and financial performance in
organisations (Hornsby et al., 2002; Pearce, Kramer, & Robbins, 1997). Thirdly,
entrepreneurship emphasises exploration activities that provide the basis for future competitive
advantage (Ireland & Webb, 2009).
Establishing and implementing an entrepreneurial vision has therefore become an important
strategic activity for any organisation seeking to sustain competitiveness and performance (Kraus
et al., 2011). The entrepreneurial vision establishes the overall direction of entrepreneurship and
innovation activities in the organisation in order to foster coherent outcomes (Ray,
Ramachandran, & Devarajan, 2006). The entrepreneurial vision also reinforces pro-
entrepreneurship organisation culture which in turn supports entrepreneurial behaviour (Peltola,
2012).

Copyright UCT
13
2.2 FRAMEWORKS OF ORGANISATION ENTREPRENEURSHIP
This section examined the development of four models of entrepreneurial behaviour in
organisations. The earliest model examined was by Hornsby et al. (2002) who depicted various
internal factors of organisation entrepreneurship from a middle management perspective. This
model (Fig.1) was the first to test the CEAI using 84 items in a sample of middle managers. This
model identified five organisation factors for entrepreneurship which were management support,
work discretion, rewards, time availability and organisation boundaries. These factors formed the
basis of subsequent research in organisation antecedents for entrepreneurship. However,
subsequent studies identified problems with the validation of organisation boundaries as a
significant factor for entrepreneurship (R Van Wyk & Adonisi, 2012). Further to this, studies
such as those done by Davis (2006) and René van Wyk & Adonisi (2011) suggested additional
factors such as role clarity, innovative initiatives, financial support, risk acceptance, sufficient
time and inadequate time which were not present in the initial framework. Therefore, while the
CEAI framework provided a foundation for organisation variables for entrepreneurship, it
remained the subject of ongoing refinement with subsequent studies.
Nonetheless, this model was useful in that it reinforced the concept that entrepreneurship could
be driven in organisations as a separate identifiable strategy. Therefore the model identified
entrepreneurial strategy as a key element of the entrepreneurial environment along with resource
availability and ability to overcome barriers. However, the limitation of this model was the focus
on middle managers perspectives of entrepreneurial behaviour which meant that the findings
were not applicable to employees at various job levels in organisations.

Copyright UCT
14
Figure 1 Middle Managers Perceptions of Corporate Entrepreneurship
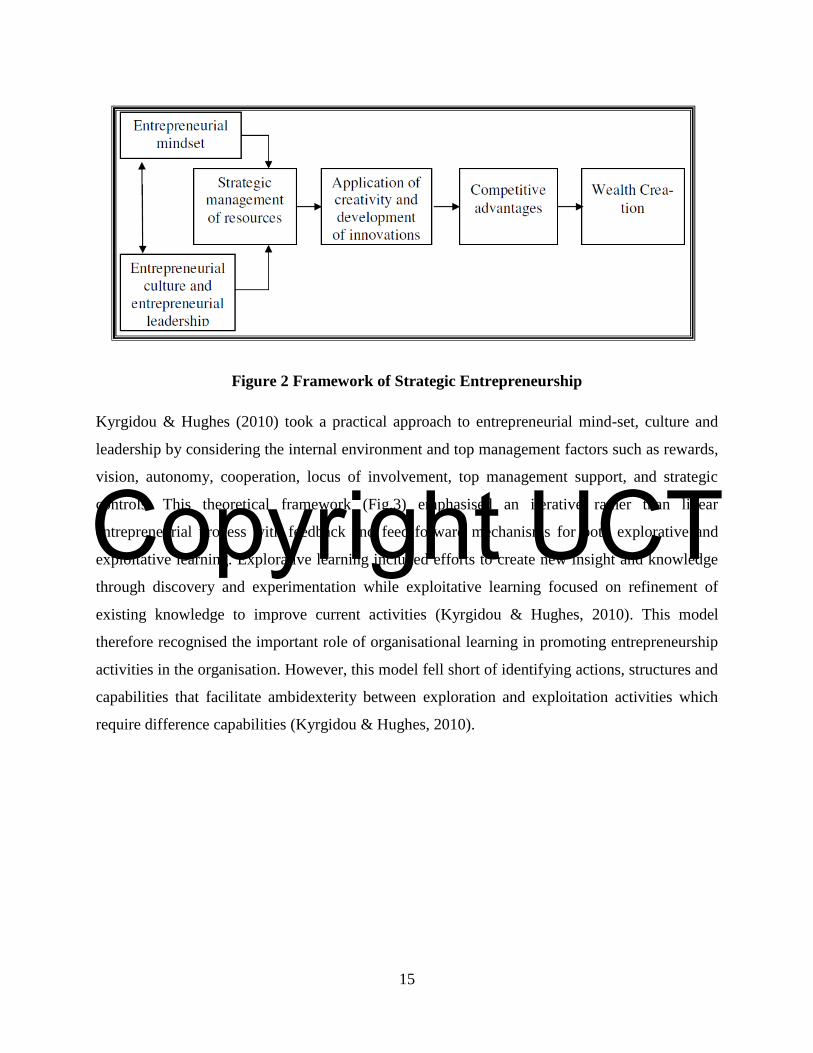
Ireland, Hitt, & Sirmon (2003) proposed their model of entrepreneurship which focused on the
key elements of entrepreneurial mind-set, culture and leadership. The model (Fig.2) emphasised
the interaction of these entrepreneurial elements with strategic management in order to create
innovations and generate wealth. This model, as opposed to the earlier one by Hornsby et al.
(2002), focused on the “soft” elements of entrepreneurial environment and particularly brought
to prominence the role of entrepreneurial culture which featured extensively in subsequent
models. Therefore this framework did not fully address organisation architecture requirements
for entrepreneurship activities. Furthermore, the model did not fully describe the relationships
between the various elements such that there was a need to understand exactly how an
entrepreneurial mind-set and culture could be established in an organisation (Ireland et al., 2003).
Copyright UCT
15
Figure 2 Framework of Strategic Entrepreneurship
Kyrgidou & Hughes (2010) took a practical approach to entrepreneurial mind-set, culture and
leadership by considering the internal environment and top management factors such as rewards,
vision, autonomy, cooperation, locus of involvement, top management support, and strategic
controls. This theoretical framework (Fig.3) emphasised an iterative rather than linear
entrepreneurial process with feedback and feed-forward mechanisms for both explorative and
exploitative learning. Explorative learning included efforts to create new insight and knowledge
through discovery and experimentation while exploitative learning focused on refinement of
existing knowledge to improve current activities (Kyrgidou & Hughes, 2010). This model
therefore recognised the important role of organisational learning in promoting entrepreneurship
activities in the organisation. However, this model fell short of identifying actions, structures and
capabilities that facilitate ambidexterity between exploration and exploitation activities which
require difference capabilities (Kyrgidou & Hughes, 2010).

Copyright UCT
16
Figure 3 A Practical Model of Strategic Entrepreneurship
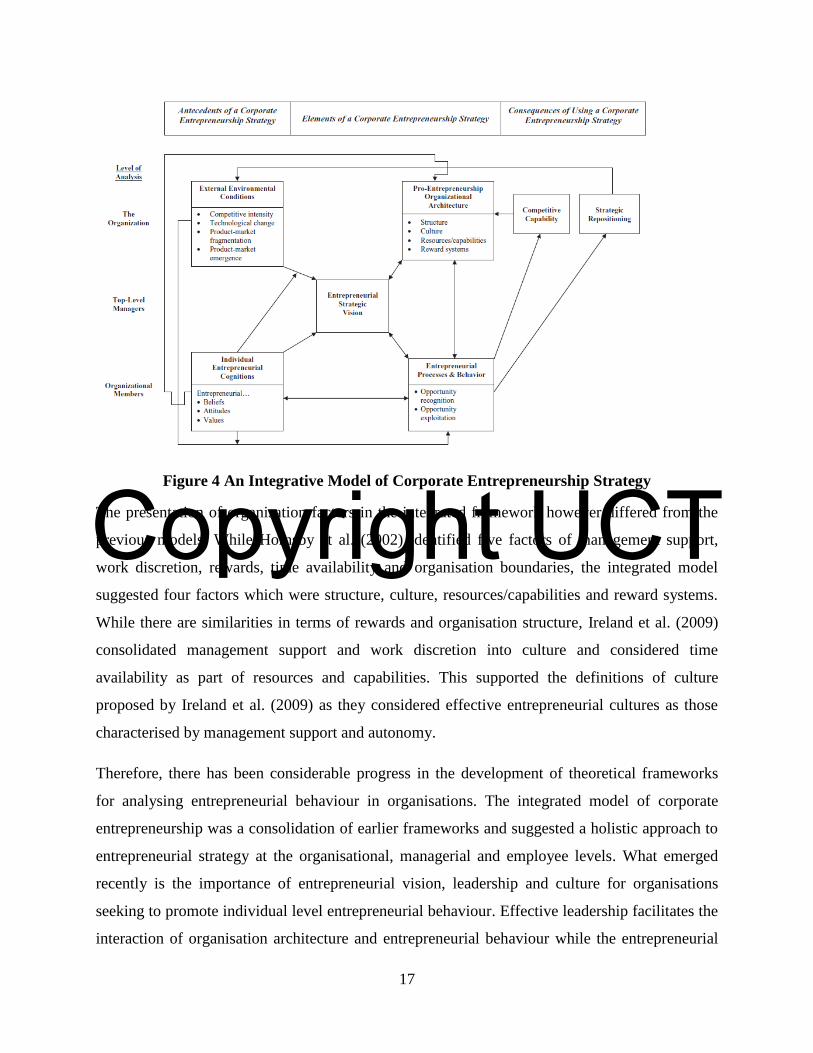
Ireland et al., (2009) integrated the organisation, leadership, cultural, and behavioural factors by
developing an integrated model of corporate entrepreneurship (Fig. 4). This model compared to
prior models contributed four key aspects: behaviour dimension, entrepreneurship locus,
philosophical justification and entrepreneurship as a unique and identifiable strategy. This model
depicted how entrepreneurship is manifested as a specific strategy and how the presence of this
strategy is inferred from patterns and perspectives of entrepreneurial behaviour (Ireland et al.,
2009). The model also provided further clarity by distinguishing organisation, managerial and
individual level factors. This increased the applicability of the framework as there was
recognition of the interplay between organisation and managerial factors that ultimately
influence individual level entrepreneurial behaviour in the organisation. Furthermore, the
framework also identified individual level antecedents to entrepreneurial behaviour such as
entrepreneurial beliefs, values and attitudes, which previous frameworks did not specifically
address.
Copyright UCT
17
Figure 4 An Integrative Model of Corporate Entrepreneurship Strategy
The presentation of organisation factors in the integrated framework however differed from the
previous models. While Hornsby et al. (2002) identified five factors of management support,
work discretion, rewards, time availability and organisation boundaries, the integrated model
suggested four factors which were structure, culture, resources/capabilities and reward systems.
While there are similarities in terms of rewards and organisation structure, Ireland et al. (2009)
consolidated management support and work discretion into culture and considered time
availability as part of resources and capabilities. This supported the definitions of culture
proposed by Ireland et al. (2009) as they considered effective entrepreneurial cultures as those
characterised by management support and autonomy.
Therefore, there has been considerable progress in the development of theoretical frameworks
for analysing entrepreneurial behaviour in organisations. The integrated model of corporate
entrepreneurship was a consolidation of earlier frameworks and suggested a holistic approach to
entrepreneurial strategy at the organisational, managerial and employee levels. What emerged
recently is the importance of entrepreneurial vision, leadership and culture for organisations
seeking to promote individual level entrepreneurial behaviour. Effective leadership facilitates the
interaction of organisation architecture and entrepreneurial behaviour while the entrepreneurial

Copyright UCT
18
vision acts as the philosophical framework which guides organisation leaders in developing an
environment where entrepreneurship is supported at a practical level.
2.3 ORGANISATION ARCHITECTURE THEORY
The premise of organisation architecture theory is that entrepreneurial strategy is manifested
through the presence of three elements: entrepreneurial strategic vision, entrepreneurial
processes and behaviour and pro-entrepreneurship organisation architecture (Ireland et al., 2009).
Organisation architecture is the conduit which ensures congruence between entrepreneurial
vision and behaviours in the firm and is composed of four factors: culture, structure, resources
and rewards systems (Ireland et al., 2009). These factors can be leveraged to create an ideal
internal environment for entrepreneurship.
An entrepreneurial culture is characterised by the presence of management support and
work discretion (Ireland et al., 2009) and can become a strategic asset for promoting
discretionary informal behaviours that lie at the heart of entrepreneurship (Hayton, 2005).
These behaviours include organisational learning, risk taking and tolerance of failure
(Luke, Kearins, & Verreynne, 2011). Organisational learning entails the exchange of tacit
and explicit knowledge both within and outside organisation boundaries and increases the
possibility of identifying new profitable business opportunities (Hayton, 2005). Risk
taking and tolerance for failure requires an environment that encourages tolerance for
calculated risk taking. In addition to this, managers must support risk taking behaviour by
providing resources, encouraging the subordinates and escalating new projects to senior
management for implementation (Hornsby et al., 2002).
Structure or organisation boundaries is an arrangement of a firms authority,
communication and workflow relationships (Ireland et al., 2009). Entrepreneurship is
closely related to organic structures which promote low formality, decentralised decision
making, wide spans of control, free-flowing information networks, expertise based
power, process flexibility and rule flexibility (Ireland et al., 2009). Furthermore,
supportive organisation structures create a mechanism for evaluating, selecting and
implementing new ideas (Villiers-Scheepers, 2012). Finally, pro-entrepreneurship
structure promotes communication, cross functional integration and team based structures
which facilitate organisational learning and the exchange of tacit knowledge (Hayton,

Copyright UCT
19
2005) which also extends to. the external environment (Goodale, Kuratko, Hornsby, &
Covin, 2011).
Reward and compensation methods influence the behaviour of employees in an
organisation (Lerner, Azulay, & Tishler, 2009) and can promote entrepreneurial
behaviour by encouraging risk taking and innovation in the organisation (Ireland et al.,
2009). Furthermore, entrepreneurial individuals in organisations prefer compensation
systems based on both business and individual performance rather than fixed
compensation methods (Lerner et al., 2009). Ray et al. (2006) suggest that recognition
reinforces rewards, as the former is the primary motivation for individuals undertaking
entrepreneurial activities and institutionalising entrepreneurial behaviour. Reward
systems must therefore extend from monetary compensation to include recognition,
increase in job responsibilities and promotion where necessary.
Equity ownership is one of the methods of associated with entrepreneurial orientation and
risk taking behaviour (Lerner et al., 2009). Equity ownership increases long term
orientation which in turn promotes exploration activities in the firm. Organisation
members with equity ownership are therefore encouraged to seek new opportunities that
will drive the future value of the company and are therefore not based on exploitation
activities at the expense of exploration activities.
Resources are a portfolio of tangible and intangible assets that the firm owns including
financial, human and social capital (Ireland et al., 2003). While resources represent what
the organisation has, capabilities represent the combination of resources to accomplish a
specific task (Ireland et al., 2009). Entrepreneurial capability is an organisations systemic
capacity to recognise and exploit opportunities and is at its strongest when embedded in
an idiosyncratic and heterogeneous manner (Ireland et al., 2009). These organisational
capabilities can be altered to stimulate organisation rejuvenation (Audretsch & Kuratko,
2009). Managerial capabilities, knowledge and reputation are critical firm specific
intangible resources for entrepreneurship (M. A. Hitt et al., 2001; Phan et al., 2009).
Intangible resources such as human and social capital are also more likely to be related to
strong entrepreneurial capability but are more difficult to understand and imitate to

Copyright UCT
20
competitors (Ireland et al., 2009). Learning new capabilities is important for a firm to
compete, survive and grow (Phan et al., 2009).
Dynamic capability is also another important resource as it allows a firm to integrate and
re-configure its internal and external resources in order to adapt to fast changing
environments and new opportunities (Liu, Jiang, Zhang, & Zhao, 2012) and this
capability promotes strategic flexibility. Kyrgidou & Hughes (2010) also view staff time
as a critical form of resource capability and availability. Job design and autonomy is
important in this respect as it allows individuals the time to undertake exploration
activities (de Jong, Parker, Wennekers, & Wu, 2011).
In order for entrepreneurial strategy to succeed, organisations must align organisation
architecture with the entrepreneurial vision. Effective change management practices provide a
strategy for organisations to reconfigure their resources in new ways in order to exploit new
opportunities (Villiers-Scheepers, 2012). The disruptive changes that entrepreneurship entails
can be a threat to both managers and employees as they remove the safety net of certainty that
employees obtain from exploitation activities (Ireland & Webb, 2007). Change management is
therefore critical for dealing with the liability of newness that is created by entrepreneurial
activities (Ireland & Webb, 2009).
Further to this, managers entrepreneurial behaviour and effective implementation of
entrepreneurial strategies has a positive impact on subordinates and helps overcome fears of
disruptive innovation (Monsen & Boss, 2009). Managers must also create an environment of
impermanence and progressiveness in which ongoing change to organisation architecture is the
norm (Peltola, 2012). Leaders need to instil confidence in their subordinates to challenge existing
business structures and processes and to experiment and take additional risk on an ongoing basis
(Hayton, 2005). This will prevent stagnation and ensure the sustainability of entrepreneurship
and innovation in the organisation.
While organisation architecture theory holds promise for promoting entrepreneurial behaviour in
organisations, its success is dependent on alignment with entrepreneurial vision and positive
attitudes to change in the organisation. The effectiveness of organisation architecture is therefore
affected by management skills in devising and executing a sound entrepreneurial strategy for the

Copyright UCT
21
firm. The organisation must also be prepared for entrepreneurial strategies in terms of openness
to change and disruptive innovations in the firm.
2.4 ENTREPRENEURIAL BEHAVIOR AND INTENSITY
Entrepreneurial intensity measures the level of entrepreneurial behaviour in the organisation and
is composed of five dimensions which are innovation, pro-activeness, risk taking, autonomy and
competitive aggressiveness (Corbett, Covin, O’Connor, & Tucci, 2013; Villiers-Scheepers,
2012). Innovation is the ability to create ideas that will lead to the production of new products,
services and technology (Villiers-Scheepers, 2012). Innovation transforms opportunities into
marketable and profitable products, processes, services or organisation changes which
subsequently form the basis for exploitation and competitive advantage (Hayton, 2005). There is
a strong relationship between innovation and entrepreneurship not only for establishing new
firms but also rejuvenating the existing organisation (M. A. Hitt et al., 2001). Innovation
increases the ability of entrepreneurship to generate rapid wealth creation through first mover
advantage (M. A. Hitt et al., 2001).
In order to produce successful innovation outcomes, entrepreneurial variables need to interact in
concert with operations control variables (Goodale et al., 2011). Firms displaying entrepreneurial
activity without operations controls are at risk of developing volumes of new and incoherent
projects that may or may not have profit potential or may not be successfully carried out to
fruition (Goodale et al., 2011). Despite having larger resource bases, mid to large size firms face
challenges in maintaining the capacity for innovativeness and risk taking as structures, systems
and procedures designed to achieve efficiency and effectiveness stifle entrepreneurship
(Kyrgidou & Hughes, 2010). Collaborative innovation creates value through sharing knowledge,
expertise and opportunities across organisations (Ketchen, Ireland, & Snow, 2008). Networking,
shared organisational learning, resource based competencies and real options theory suggest that
collaborative innovation can help firms overcome challenges in engaging successfully in
entrepreneurship (Ketchen et al., 2008).
Pro-activeness is concerned with management appetite regarding confidence in pursuing new
opportunities, competitive aggressiveness, and encouragement of initiative while risk taking is
the propensity and courage of allocating resources to projects with uncertain outcomes (Villiers-

Copyright UCT
22
Scheepers, 2012). Organisations can stimulate risk taking by increasing the sense of ownership
of projects and resources (Hayton, 2005).
Entrepreneurial orientation creates wealth by creating a conducive environment for forming new
business models and organisation forms (Kyrgidou & Hughes, 2010). Entrepreneurial cognitions
are made of the knowledge structures that individuals use to make assessments, judgements and
decisions relating to opportunity recognition (Ireland et al., 2009). These cognitions include
individual’s beliefs, values and attitudes towards entrepreneurship.
2.5 HUMAN AND SOCIAL CAPITAL
Human capital is the firms repository of valuable knowledge and skills whereas social capital
comprises the relationships between individuals and the organisation that facilitate action and
create value (M. A. Hitt & Duane, 2002). Human capital is demonstrated by education,
experience and identifiable skills (M. A. Hitt & Duane, 2002) and social capital comprises the
goodwill available to individuals or groups which include feelings of gratitude, reciprocity,
respect and friendship (De Carolis & Saparito, 2006). Social capital can be developed internally
by building relationships between leaders and individuals in the organisation and also across the
various units or departments of the firm (M. A. Hitt & Duane, 2002).
There are two types of social capital which are bonding and bridging (De Carolis & Saparito,
2006). While bonding social capital is concerned with internal ties and network relationships
within a collective, bridging social capital is concerned with an individual’s social ties and how
these are used for one’s private benefit (De Carolis & Saparito, 2006). Social capital can also be
built across the organisations boundaries by developing trusting relationships with external
stakeholders (M. A. Hitt et al., 2001). Overall, social capital is an idiosyncratic resource for
building competitive advantage in an organisation (M. A. Hitt et al., 2001).
Social capital is important as it facilitates a sense of community and teamwork in the
organisation (M. A. Hitt & Duane, 2002). Kansikas et al. (2012) refer to this resource as
“familiness”, which is defined as a bundle of structural (network ties), relational (trust,
obligations, norms, identification) and cognitive (shared vision, shared language) dimensions.
The term owes its existence to the sense of connectedness in family firms in which individuals
are brought together by social bonds, values and trust that go beyond normal business

Copyright UCT
23
relationships. Social capital also creates a competitive advantage as superior social structures
create entrepreneurial opportunities which are not accessible to competition (De Carolis &
Saparito, 2006).
Social capital has two direct benefits which are information and influence and these are realised
through structural, relational and cognitive dimensions (De Carolis & Saparito, 2006). These
dimensions refer to the pattern of network connections between actors, personal relationships
between specific people, shared representations, interpretations and shared meaning among
parties (De Carolis & Saparito, 2006). In order to harness the value of social capital, strategic
leaders must have an intimate knowledge of the people with whom they work and encourage
those people to identify new opportunities for future competitive advantage (M. A. Hitt &
Duane, 2002). Trust between organisation members is especially important in facilitating the
transfer of information which supports the generation of new ideas (M. A. Hitt & Duane, 2002).
In order to build effective relationships, strategic leaders must ensure organisational justice in
process, rewards and relationships (M. A. Hitt & Duane, 2002). Social capital must also be
managed as a strategic resource (Ireland et al., 2003).
Human capital is often enhanced through social capital and represents the knowledge skills and
capabilities of individuals in the organisation (M. A. Hitt & Duane, 2002). Knowledge is the
firms most critical competitive asset and much of it rests in human capital (M. A. Hitt et al.,
2001). Along with structural capital, human capital forms the firms intellectual capital (M. A.
Hitt & Duane, 2002). Knowledge can be transferred internally within the firm but can also occur
externally through collaborative innovation. Collaborative innovation can occur by sharing
knowledge, expertise and opportunities across organisations (Ketchen et al., 2008)
Human capital is a resource that brings a higher rate of return on investments to an organisation
(De Carolis & Saparito, 2006). The transfer of knowledge within the firm builds employees
capabilities and contributes to improved firm performance (M. A. Hitt et al., 2001). However,
diffusing knowledge throughout the firm can be a significant challenge and firms need to invest
in human capital to ensure absorptive capacity for individuals in the organisation to learn new
skills and capabilities (M. A. Hitt & Duane, 2002). This may entail either training existing
employees or recruiting new ones (M. A. Hitt & Duane, 2002).

Copyright UCT
24
Human and social capital are important factors of entrepreneurship as skills and relationships
among the individuals in the organisation are essential for identifying and exploiting new
opportunities (M. Hitt, Ireland, Sirmon, & Trahms, 2011). Social and human capital contribute to
entrepreneurial orientation through networks and organisational learning domains respectively
(M. A. Hitt et al., 2001). Sound relationships with internal and external stakeholders provide the
foundation for discovering new opportunities and partnerships that create wealth (M. A. Hitt &
Duane, 2002). Human capital facilitates organisational learning when internal boundaries within
an organisation are broken to allow knowledge sharing between individuals, managers and other
business units (M. A. Hitt & Duane, 2002). Due to the knowledge intensity of the
entrepreneurial process, higher levels of human capital are positively associated with
entrepreneurship (Hayton, 2005). Greater individual autonomy and discretion also have a
positive effect on trust formation and social capital (Hayton, 2005).
There is some debate as to how social capital is nurtured in organisations. Some authors suggest
that the development of social capital is mostly the result of informal processes which build trust
as workers engage in extra-role responsibilities that benefit co-workers and the organisation
(Hayton, 2005). Others suggest that social capital can be built through effective communication
and the use of rewards (Hornsby et al., 2002). There is merit in both arguments and therefore
social capital strategies must take a multi-pronged approach in organisations.
Human resource practices play an important role in developing human capital through measures
such as performance appraisals, compensation training, career development and job design
(Hayton, 2005). Discretionary practices such as incentive pay, and employee suggestion or
participation programs also encourage employee commitment and entrepreneurial behaviours
(Hayton, 2005). Firms can also undertake activities such as selective rotation of talented
managers, resource allocation, clear communication from leadership about the long term
commitment to entrepreneurship and learning from experiments (Ray et al., 2006).
Previous research has emphasised the need for exploring the role of knowledge based resources
such as social and human capital in the entrepreneurship process (Phan et al., 2009). This has
come to attention with recent models of entrepreneurship that depict the ideological and practical
complexities of driving exploration and exploitation behaviours concurrently (Kyrgidou &
Hughes, 2010). In this regard, human and social capital play and important role through

Copyright UCT
25
networks and organisational learning (M. A. Hitt et al., 2001). Sound relationships, attitudes,
values, participation and trust enhance the ability for the organisation exchange knowledge
across boundaries and stimulate organisational learning.
2.6 ENTREPRENEURIAL LEADERSHIP
Entrepreneurial leadership is the ability to influence others in the organisation to emphasise
opportunity seeking and advantage seeking behaviours through embracing risk taking, tolerating
failure, and promoting continuous learning and innovation (M. Hitt et al., 2011). Kansikas et al.
(2012) identify two types of entrepreneurial leaders: entrepreneurs who are leaders; and leaders
with entrepreneurial skills. Both types can be effective at entrepreneurial leadership provided
they are able to show competence at nurturing entrepreneurial capabilities, identifying
innovations that threaten existing business models, interpreting market opportunities, questioning
mainstream logic, engaging in re-thinking and holding a “what if” mentality (Chang & Wang,
2013). Furthermore, entrepreneurial leaders are also stress resistant, unselfconscious, assertive,
conscientious, conformist and competitive (Kansikas et al., 2012). The six dimensions of
entrepreneurial leadership are: innovativeness, opportunity recognition, pro-activeness, risk
taking and vision making (Kansikas et al., 2012).
Entrepreneurial leaders in the organisation must have a congruent view of entrepreneurial vision
in order to foster positive relationships and improve organisation performance (Corbett et al.,
2013). Middle managers play a critical role in operationalising senior managers entrepreneurial
vision and creating and maintaining the environment for innovation and entrepreneurship
(Hornsby et al., 2002). Managers can generate interest in strategic entrepreneurship and
positively influence the behaviour of subordinates through both formal and informal
mechanisms. Middle managers can also encourage initiative from below by advancing promising
innovations to senior management for incorporation into strategy. Middle managers therefore act
as a vital link between the top-down and bottom-up relationship within strategic
entrepreneurship.
There are two important roles for middle managers with respect to entrepreneurship which are
firstly bridging the gap between strategic and operational-managers, and secondly separating the
operationally, structurally and culturally different processes of exploitation and exploration
(Ireland & Webb, 2007). Managers who display entrepreneurial behaviours such as innovation
Copyright UCT
26
orientation, ability to challenge bureaucracy, creating energetic work environments and
providing visionary leadership have a positive effect on subordinates work satisfaction and
entrepreneurial behaviour (Pearce et al., 1997). Since managers have better opportunities to
identify and implement entrepreneurial ideas due to their organisational role, they are ideally
placed to act as agents of change by championing and realising innovative ideas (de Jong et al.,
2011). Middle managers can achieve this by adapting their approach to include decentralised
authority, participative decision making, creativity, cooperation, risk taking and minimizing
bureaucracy (Hayton, 2005). Middle managers can also create the social capital and trust needed
to foster corporate entrepreneurship through effective communication and use of rewards
(Hornsby et al., 2002)
Entrepreneurial leadership also needs to take place at the strategic level and strategic leaders are
those who are able to anticipate, envision, maintain flexibility, think strategically and work with
others to initiate changes that will create a viable future for the organisation (M. A. Hitt &
Duane, 2002). Strategic leadership can be exercised by top, middle and lower management (M.
A. Hitt & Duane, 2002) and the promotion of entrepreneurship does not only flow from
managers to followers but also vice versa (Heinonen & Toivonen, 2008).
2.7 CONCLUSIONS
Recent frameworks on organisation entrepreneurship have emphasised the interactions between
entrepreneurial leadership, organisation factors and individual level factors in enhancing
entrepreneurial behaviour in an organisation. Organisation architecture theory suggests that
establishing the correct organisational factors has a positive impact on entrepreneurial behaviour.
These organisational factors are culture, structure, rewards and resources. Entrepreneurial
behaviour is best expressed by the intensity of innovation, pro-activeness and risk taking
behaviours in the firm. Entrepreneurial leaders have the responsibility of establishing an
entrepreneurial vision and creating the ideal organisation factors that lead to desired
entrepreneurial behaviour. Managers also have an important role in diffusing entrepreneurial
behaviour throughout the whole organisation by establishing the different processes that
facilitate exploration and exploitation (Ireland & Webb, 2007). Middle managers play a vital role
in this process as they act as a link between strategic and operational managers (Ireland & Webb,
2007).

Copyright UCT
27
However, organisations may face challenges in maintaining congruence in entrepreneurial
perspectives between senior management, middle management and employees. Organisation
architecture which is misaligned with entrepreneurial vision may further exacerbate divergent
perspectives in the organisation. Human and social capital factors also need to support
organisation architecture in order for the entrepreneurial strategy to succeed.
There is therefore considerable evidence in literature supporting the hypothesis for this study
both in terms of perceptions of entrepreneurship according to seniority and the role of human and
social capital in the entrepreneurship process. The literature review for the various hypotheses
was summarised and presented in Table 1.

Copyright UCT
Table 1 Research Consistency Matrix
Does seniority affect the ways in which entrepreneurship is perceived in an organisation and what is the role of human and social
capital in implementation of entrepreneurial strategies?
Sub-problem Literature Review Hypothesis Data Source Data Type Analysis
Individual’s capacity for
entrepreneurial orientation
decreases as we progress
down organisation levels
despite the same
organisation architecture.
Corbett et al.
(2013); Hornsby et
al. (2002; Ireland &
Webb (2007);
Kansikas et al.
(2012); (Hayton,
2005)
Various managerial levels
provide a differential structural
ability to capitalise on a
supportive organisation
environment and thereby
increase entrepreneurial
behaviour (Phan et al., 2009)
A survey of managers at
strategic, middle and
operational management
within the organisation.
Analysis tools used were
the Corporate
Entrepreneurship
Assessment Instrument
and the Intrapreneurship
Behaviour Index which
measure the internal
environment/organisation
architecture for
entrepreneurship and
entrepreneurial intensity
respectively
Ordinal,
Scale
Multiple
Analysis of
Variance
(MANOVA)
To what extent do
knowledge based
resources of human and
social capital and the
associated networks affect
the deployment of SE
strategy in a firm.
M. A. Hitt & Duane
(2002); M. Hitt et
al., (2011); Ray et
al. (2006);
Access to human and social
capital is has a significant
positive relationship
entrepreneurial intensity
through knowledge sharing
networks and organisational
learning (M. a. Hitt et al.,
2001a)
Questionnaire questions
relating to schooling,
qualifications (human
capital), attitude, values,
membership, participation
and trust (social capital)
Ordinal Multiple
Analysis of
Variance
(MANOVA)
Copyright UCT
29
3 RESEARCH METHODOLOGY
3.1 RESEARCH APPROACH AND STRATEGY
The study was conducted using a deductive approach and a quantitative strategy (Lancaster,
2005). This approach was consistent with previous studies such those done by Hornsby et al.
(2002) and René van Wyk & Adonisi (2011) which also applied the CEAI to diagnose the
entrepreneurial antecedents. This research approach also addressed the call by Hornsby et al.
(2002) for further validation of the CEAI. The quantitative strategy was useful to this study as
the entrepreneurial variables of interest needed to be measured using statistical analysis
(Marczyk, DeMatteo, & Festinger, 2005). Further to this, the CEAI was applied to an
organisation in a developing country and this added an emerging market perspective to the
research.
The theoretical frameworks in the study were tested based on principles of falsification
principles meaning that the research study aimed to refute rather than confirm existing theories
(Lancaster, 2005). The study was conducted using a constructivist or interpretive paradigm by
taking the view that reality is a joint product of external conditions and the person observing and
reporting these conditions (Yin, 2011). The ontology was relativism while the epistemology was
subjectivism and the methodology was interpretative and logical within the specific context
(Locke, 2001). The study was exploratory in nature meaning that the researcher had no
expectations as to the outcome of the research. The study activity focused on understanding the
phenomenon of strategic entrepreneurship from the perspective of involved organisation
members.
3.2 RESEARCH DESIGN, DATA COLLECTION METHODS AND RESEARCH
INSTRUMENTS
3.2.1 RESEARCH DESIGN
The research was conducted using a case study approach (Marczyk et al., 2005) and involved an
in-depth examination of an organisation’s entrepreneurial environment and behaviour. The
Integrated Model for Corporate Entrepreneurship (Fig.4) was the conceptual model for the study
(Ireland et al., 2009). The study focused on the internal organisation elements within this model
namely: organisation architecture, entrepreneurial behaviour and entrepreneurial leadership.

Copyright UCT
30
3.2.2 DATA COLLECTION METHODS
The primary data collection method was an online survey. The language of the survey was
English. The survey link was emailed to the participants and remained open for a period of three
weeks. The survey took approximately 10 minutes to complete and contained a consent page
assuring participants of the voluntary participation and the confidentiality of responses.
An online survey was ideal for the study due to the large sample size which would make manual
data collation cumbersome. Additionally, the online survey offered convenience and anonymity
to the participants as it reduced the administrative burden associated with paper surveys. No
identifiable information was collected during the study. However demographic information was
collected for gender, department, management level and education which were not sufficient to
identify individuals in the organisation.
Two email reminders were sent to the participants during the course of the three weeks in which
the study was run. Five participants had challenges accessing the online survey and requested
paper versions which were provided and duly completed.
3.2.3 RESEARCH INSTRUMENTS
The data collection instrument selected for assessing organisation architecture was the CEAI
(Hornsby et al., 2002). This instrument was initially applied by Hornsby et al. (2002) who
studied middle managers perceptions of the environment for corporate entrepreneurship. This
model is composed of Likert type questions measuring the presence of five entrepreneurial
antecedents: management support, work discretion, rewards, time availability and organisation
boundaries. This instrument was useful for several reasons. Firstly, the CEAI measures
entrepreneurship antecedents in a way that is practical for those with interest in improving
entrepreneurship activities in their organisations (Davis, 2006). Secondly, the instrument
measures entrepreneurship at an individual level which is important in terms of the relation with
entrepreneurial behaviours. Lastly, the instrument is relatively brief which encourages
participants and researchers to use it (Davis, 2006). A sample of the instrument items is
contained in Appendix 2. The instrument contained 49 items and 10 of these items were worded
negatively to avoid respondent bias. These 10 items were reverse coded in the analysis (Kuratko
et al., 2014).

Copyright UCT
31
However, the instrument also had its limitations with respect to the study. Firstly, there was a
concern from recent studies surrounding the validity of the organisation boundaries factor
suggested by Hornsby et al. (2002). This factor was not validated as significant in further studies
(René van Wyk & Adonisi, 2011) but was nonetheless used in this study. Secondly, the
instrument was prone to producing different item arrangements in factor analysis in other studies
which led to the development of additional factors (Davis, 2006; René van Wyk & Adonisi,
2011). Thirdly, the instrument had no specific sub-scale to measure culture which was a factor
identified in the conceptual framework developed by Ireland et al. (2009). Therefore, a separate
scale for culture was developed from the definition by Ireland et al. (2009) which included
elements such as emotional commitment; relentless attention to detail, structure and process; a
desire by individuals to earn the respect of peers; being well organised; desire for high standards
and high commitment to work. There were a total of four separate Likert type items with respect
to culture.
Entrepreneurial behaviour was measured using the Intrapreneurship Behaviour Instrument (IBI)
(de Jong et al., 2011) which was based on three major factors: pro-activeness, innovation and
risk taking (Villiers-Scheepers, 2012). This instrument contributed a total of six Likert type items
pertaining to each of these factors. The statements forming this index are contained in Appendix
3. A social capital scale was also included in the study and contained three Likert type items.
Finally, in order to fulfil the requirements of the study, there were also questions included in the
survey to collect data on seniority, education and departments of the respondents.
3.3 SAMPLING
The participants were drawn from a single organisation which was selected using purposive
sampling and comprised the population for the survey (Yin, 2011). The choice of the
organisation was based on its progressive reputation in the market which was suitable for the
entrepreneurial nature of this study.
The participants were selected on the basis of convenience and purposive sampling (Marczyk et
al., 2005). Firstly, the participants selected based on their ability to understand the concepts and
language used in the questionnaire. Some of the CEAI items were re-phrased in order to simplify
the language for the sample. Secondly, participants were required to have computer access in
order to complete the online survey. Therefore, out of the six employee grades in the

Copyright UCT
32
organisation, only the top four grades participated in the survey. These criteria yielded a sample
of 330 organisation members from a population of approximately 800 employees. The sample
targeted multiple data collection levels through a nested arrangement and was composed of
individuals from various managerial levels and functions (Yin, 2011). The organisation levels
represented included senior managers, middle managers, supervisors and staff members whereas
the functions included commercial, human resources, logistics and finance departments. This
allowed analysis of results from a functional and management level perspective (Kuratko et al.,
2014) and minimised bias thus enabling statistical generalisation (Yin, 2011). The response rate
to the survey was 33%.
3.4 DATA ANALYSIS METHODS
The primary data analysis method was Multiple Analysis of Variance (MANOVA) and this
method was useful for examining two or more parametric dependent variables against one or
more between-group independent variables (Mayers, 2013). Thus MANOVA examined the
multivariate relationships between variables while also accounting for the correlation between
dependent variables (Mayers, 2013).
The first MANOVA was carried out using two independent variables (seniority and education)
and four dependent variables (entrepreneurial intensity, entrepreneurship antecedents, culture
and social capital). The mean scores for the dependent variables were obtained after averaging
the means of the items under each variable. The purpose of this MANOVA was to examine the
multivariate effect of seniority and education on overall entrepreneurial behaviour, and
perspectives of organisation antecedents, culture and social capital.
The second MANOVA was carried out using three independent variables (seniority, education
and department) and five dependent variables (management support, work discretion, rewards,
time availability, and organisation boundaries). The purpose of this MANOVA was to examine
the multivariate effect of seniority, education and department on the individual antecedents of
entrepreneurship.
An exploratory factor analysis (Cramer, 2003) was used to determine the most likely factor
structure between the variables contained in the CEAI. Exploratory factor analysis was suitable
for this study as it was considered the method of choice for self-reporting behavioural studies

Copyright UCT
33
(Williams & Brown, 2012). Secondly, exploratory factor analysis was also useful for reducing
the number of variables from the CEAI and examining the structure of relationships between the
variables (Williams & Brown, 2012). Thirdly, exploratory factor analysis was selected as a tool
of choice in previous studies applying the CEAI (Hornsby et al., 2002; René van Wyk &
Adonisi, 2011).
Variance in the exploratory factor analysis was measured through principle component analysis
to obtain Eigen values for the various factors (Cramer, 2003). Eigen values depict the proportion
of variance explained by each of the factors (Cramer, 2003) and items with Eigen values above
1.0 were considered for retention in the study (René van Wyk & Adonisi, 2011). A Scree test
(Cramer, 2003) was also used to further validate the retention of the factors identified using the
Eigen criteria. The factors were grouped using principle factor analysis and rotated using
Varimax method as it was assumed that the factors would be unrelated (Williams & Brown,
2012). The proportion of variance explained by the Varimax rotated factors was determined by
using the eigenvalues of the squared loadings of each factor divided by the number of variables
(Cramer, 2003).

Copyright UCT
34
4 RESEARCH FIDNINGS ANALYSIS AND DISCUSSION
4.1 RESEARCH FINDINGS
The organisation selected for the case study was a multinational beverage company in a
developing country called Malawi. The company’s core business was the production, marketing
and distribution of alcoholic and non-alcoholic beverages. The company employed a total of
approximately 800 employees and was considered to be in the fast moving consumer goods
sector.
The survey of the participants in the organisation yielded 103 responses representing a success
rate of 33%. 20 responses had missing data values which left a final sample of 83. The sample
comprised four hierarchy groups: senior managers (N=17), middle managers (N=29), supervisors
(N=29) and staff (N=8). Both genders were represented: male (N = 72) and female (N = 11). All
four departments of the organisation contributed to the survey: commercial (N=17), human
resources (N=2), supply chain (N=40), and finance (N=24). The education levels represented
included: certificate (N = 22), diploma (N = 28), bachelor’s degree (N = 25) and master’s degree
(N = 8).
The survey contained 62 statements which rated on a four point Liker Scale ranging from 0
(Strongly Disagree) to 3 (Strongly Agree). The survey was mainly based on the CEAI and IBI
which accounted for 49 and 6 statements respectively. Organisation culture and social capital
contributed 4 statements and 3 statements respectively. The questions were sorted randomly to
avoid leading responses. The results were analysed on separate scoring scales for CEAI
antecedents, the IBI, organisation culture and social capital (Appendix 4) (Kuratko et al., 2014).
Ten items on the CEAI were negatively worded in order to avoid respondent bias (Hornsby et al.,
2002). These were questions number 4, 5, 11, 14, 23, 29, 30, 43, 44 and 54. The responses to
these questions were negatively coded in the analysis (Kuratko et al., 2014). Each item in the
various scales and subscales was loaded equally and therefore carried the same weight in
subsequent analysis.
4.1.1 DESCRIPTIVE STATSTICS: ENTREPRENEURIAL BEHAVIOUR
Entrepreneurial behaviour was measured using the IBI whereas entrepreneurial antecedents were
measured using the CEAI. Entrepreneurial behaviour was composed of three subscales of

Copyright UCT
35
innovativeness, pro-activeness and risk-taking, whereas the entrepreneurship antecedents had
five subscales of management support, work discretion, rewards, time availability and
organisation boundaries. The strength of entrepreneurial culture and social capital was also
measured using the respective items in the survey. Culture and social capital were each measured
on a single scale. The means of these scales and sub-scales were tallied in order to derive the
mean statistics shown in Table 2.
Table 2 Descriptive Statistics: Entrepreneurial Environment
N Mean Std. Deviation Skewness Kurtosis
Statistic Statistic Statistic Statistic Std. Error Statistic Std. Error
Culture 83 1.8464 .40166 -.294 .264 .227 .523
Entrepreneurial Behaviour 83 1.7043 .36447 -.770 .264 .939 .523
Social Capital 83 1.4699 .49670 .100 .264 -.295 .523
Entrepreneurial Antecedents 83 1.4589 .23573 -.337 .264 -.723 .523
Valid N (listwise) 83
The mean score for entrepreneurial behaviour was 1.70 (57%) and this was composed of
innovativeness (mean = 1.92), pro-activeness (mean = 1.50) and risk taking (mean = 1.86).
Entrepreneurial antecedents had a mean of 1.46 (49%). The highest mean statistic was for culture
at 1.85 (62%) and social capital obtained a lower mean of 1.47 (49%). Standard deviations were
higher for social capital and culture meaning that the data were dispersed more widely from the
mean for these items. There was some variation in the skewedness of each item with culture,
entrepreneurial behaviour and entrepreneurial antecedents showing a negative skew, while social
capital had a positive skew.
The correlation analysis showed that all four items of entrepreneurial behaviour, antecedents,
culture and social capital were positively correlated with a significant relationship between
entrepreneurial antecedents and entrepreneurial behaviour (.609, p = 0.00), followed by
entrepreneurial antecedents and social capital (.545, p = 0.00), entrepreneurial behaviour and
culture (.435, p = .000), culture and social capital (.443, p = .000), entrepreneurial behaviour and
social capital (.434, p = .000), and entrepreneurial antecedents and culture (.295, 0.007) (Table
3).

Copyright UCT
36
Table 3 Correlation Matrix: Entrepreneurial Environment
4.1.2 FIRST MULTIPLE ANALYSIS OF VARIANCE
A MANOVA was conducted of the dependent variables of entrepreneurial behaviour,
entrepreneurial antecedents, culture and social capital together with the independent variables of
seniority and education. The dependent variables were firstly tested for suitability for MANOVA
in terms of correlation and normal distribution (Mayers, 2013). The Pearson correlation matrix
yielded results ranging from .285 to .609 which were within acceptable ranges of -.4 <r < .9
(Mayers, 2013). The variables therefore passed the correlation criteria. The Shapiro-Wilk test
was conducted to test for normal distribution (Mayers, 2013). The results (Table 4) were
somewhat inconsistent as only social capital and entrepreneurial antecedents showed no
significant difference to normal distribution with p values above .05. However, entrepreneurial
behaviour (p = .001) and culture (p = .004) showed a significant difference suggesting that these
items did not follow a normal distribution.
Table 4 Tests of Normality: Entrepreneurial Environment
Kolmogorov-Smirnova Shapiro-Wilk
Statistic Df Sig. Statistic Df Sig.
Entrepreneurial Behaviour .161 83 .000 .942 83 .001
Culture .176 83 .000 .952 83 .004
Social Capital .136 83 .001 .958 83 .008
Entrepreneurial Antecedents .096 83 .056 .971 83 .061
Entrepreneurial Behaviour Culture Social Capital
Entrepreneurial Antecedents
Pearson Correlation 1 .435** .434** .609**
Sig. (2-tailed) .000 .000 .000N 83 83 83 83Pearson Correlation .435** 1 .443** .295**
Sig. (2-tailed) .000 .000 .007N 83 83 83 83Pearson Correlation .434** .443** 1 .545**
Sig. (2-tailed) .000 .000 .000N 83 83 83 83Pearson Correlation .609** .295** .545** 1Sig. (2-tailed) .000 .007 .000N 83 83 83 83
**. Correlation is significant at the 0.01 level (2-tailed).
Correlations
Entrepreneurial Behaviour
Culture
Social Capital
Entrepreneurial Antecedents

Copyright UCT
37
a. Lilliefors Significance Correction
Entrepreneurial behaviour and social capital variables were therefore subjected to further
normality tests. The results of the Normal Q-Q plots (Fig.5) showed that the distribution of
points on both variables was close to the expected plots thus confirming normal distribution. Due
to the fact that the sample sizes within seniority and education levels were not equal, the
Hotelling’s Trace was selected as the preferred measure for multivariate analysis (Mayers, 2013)
and the post hoc analysis was conducted using the Scheffe test (Hornsby et al., 2002).
Figure 5 Normal Q-Q Plots: Entrepreneurial Behavior and Culture
4.1.2.1 SENIORITY AND PERCEPTIONS OF THE ENTREPRENEURIAL
ENVIRONMENT
The first MANOVA was carried out between the dependent variables of entrepreneurial
behaviour, entrepreneurial antecedents, culture and social capital and the independent variable of
seniority. The seniority sample sizes were not equal: senior managers (N=17), middle managers
(N=29), supervisors (N=29) and staff (N=8). A brief analysis of the means showed a significant
difference in the dependent variables of entrepreneurial behaviour and entrepreneurial
antecedents but there was no apparent difference for culture and social capital.
The Levene’s test of equality (Table 5) suggested the existence of homogeneity of between-
group variance for all the dependent variables except entrepreneurial behaviour which was below

Copyright UCT
38
the significance level of .05. However, Box’s Test of Equality confirmed the overall existence of
homogeneity of between-group variance with p = .348.
Table 5 Levene’s Test: Entrepreneurial Environment
F df1 df2 Sig.
Entrepreneurial Behaviour 5.836 3 79 .001
Entrepreneurial Antecedents .218 3 79 .884
Culture .611 3 79 .610
Social Capital .602 3 79 .615
Tests the null hypothesis that the error variance of the dependent variable is
equal across groups.
a. Design: Intercept + Seniority
An multivariate analysis was then conducted (Table 6) and the results showed that there was a
significant multivariate effect for the combined dependent variables of entrepreneurial
behaviour, entrepreneurial antecedents, culture and social capital in respect of seniority:
Hotelling’s Trace = .347, F (12, 224) = 2.160, p = .014
Table 6 Multivariate Tests for Seniority
The univariate tests showed that only two dependent variables of entrepreneurial behaviour and
entrepreneurial antecedents differed significantly with respect to the independent variable
Value FHypothesis
dfError df Sig.
Partial Eta Squared
Noncent. Parameter
Observed Powerd
Pillai's Trace 0.978 852.930b 4 76 0 0.978 3411.721 1
Wilks' Lambda 0.022 852.930b 4 76 0 0.978 3411.721 1
Hotelling's Trace 44.891 852.930b 4 76 0 0.978 3411.721 1
Roy's Largest Root 44.891 852.930b 4 76 0 0.978 3411.721 1
Pillai's Trace 0.272 1.947 12 234 0.03 0.091 23.364 0.908
Wilks' Lambda 0.736 2.061 12 201.369 0.021 0.097 21.655 0.877
Hotelling's Trace 0.347 2.16 12 224 0.014 0.104 25.924 0.939
Roy's Largest Root 0.312 6.079c 4 78 0 0.238 24.315 0.982
c. The statistic is an upper bound on F that yields a lower bound on the significance level.
d. Computed using alpha = .05
Multivariate Testsa
Effect
Intercept
Seniority
a. Design: Intercept + Seniority
b. Exact statistic
Copyright UCT
39
seniority: entrepreneurial behaviour: F (3, 79) = 2.955, p = .037; and entrepreneurial antecedents:
F (3, 79) = 6.323, p = .001. The rest of the dependent variables to not differ significantly with
respect to seniority: culture: F (3, 79) = .296, p = .828; and social capital: F (3, 79) = .731, p =
.537. The post hoc Scheffe test showed that senior managers had a more positive perception of
entrepreneurial antecedents than supervisors (p = .003). There was no other significant
relationship in the test.
RESULTS SUMMARY
Perceptions of entrepreneurial behaviour, entrepreneurial antecedents, culture and social capital
were measured in four groups of employees: staff, supervisors, middle managers and senior
managers. The MANOVA confirmed that there was a significant multivariate effect: Hotelling’s
Trace = .347, F (12,224) = 2.160, p = .014. The Univariate independent one-way ANOVAs
showed significant main effects for: entrepreneurial behaviour: F (3, 79) = 2.955, p = .037; and
entrepreneurial antecedents: F (3, 79) = 6.323, p = .001. Scheffe’s post hoc tests showed that
senior managers had a more favourable perception of entrepreneurial antecedents than
supervisors (p=.003).
4.1.2.2 EDUCATION AND PERCEPTIONS OF THE ENTREPRENEURIAL
ENVIRONMENT
The sample sizes for the education variable were relatively equal for certificates (N = 22),
diploma (N = 28), and bachelor’s degree (N = 25) but low for master’s degree (N = 8). A brief
analysis of the means generally showed that individuals with master’s degrees had a more
positive perception in terms of entrepreneurial behaviour, entrepreneurial antecedents than other
groups but the same relationship did not exist for social capital and culture.
The Levene’s test of equality demonstrated the existence of homogeneity of between group
variance for entrepreneurial behaviour, entrepreneurial antecedents, culture and social capital as
the significance level for all four variables was greater than .05. This was confirmed by Box’s
test of equality score of .952, which was above the significance level of .001. The multivariate
tests (Table 7) showed a significant multivariate effect for the combined dependent variables
with respect to education: Hotelling’s Trace = .433, F (12, 224) = 2.694, p = .002.

Copyright UCT
40
Table 7 Multivariate Tests: Education
The results of the univariate tests suggested that only 2 dependent variables differed significantly
in respect of the independent variable education: entrepreneurial behaviour: F(3,79) = 5.023, p =
.003; and entrepreneurial antecedents: F(3,79) = 3.984, p = .011. In the post hoc analysis, the
Scheffe results showed that individuals with master’s degrees had a more positive perception of
the entrepreneurial behaviour than those with certificates (p = .013) while individuals with
diplomas had more positive perceptions of entrepreneurial behaviour than those with certificates
(p = .043). As far as entrepreneurial antecedents were concerned, individuals with a bachelor’s
degree had more favourable perceptions than those with certificates (p = .019).
RESULTS SUMMARY
Perceptions of entrepreneurial behaviour, entrepreneurial antecedents, culture and social capital
were measured in four education groups: certificate, diploma, bachelor’s degree and master’s
degree. MANOVA analysis confirmed a significant multivariate effect: Hotelling’s Trace = .433,
F (12,224) = 2.694, p = .002. Univariate independent one-way ANOVAs showed significant
main effects for education in respect of: entrepreneurial behaviour: F (3, 79) = 5.023, p = .003;
and entrepreneurial antecedents: F (3, 79) = 3.984, p = .011. Scheffe’s post hoc analysis showed
that individuals with master’s degrees had more a positive perception of entrepreneurial
Value FHypothesis
dfError df Sig.
Partial Eta Squared
Noncent. Parameter
Observed Powerd
Pillai's Trace 0.978 842.295b 4 76 0 0.978 3369.179 1
Wilks' Lambda 0.022 842.295b 4 76 0 0.978 3369.179 1
Hotelling's Trace 44.331 842.295b 4 76 0 0.978 3369.179 1
Roy's Largest Root 44.331 842.295b 4 76 0 0.978 3369.179 1
Pillai's Trace 0.352 2.589 12 234 0.003 0.117 31.064 0.976
Wilks' Lambda 0.678 2.659 12 201.369 0.002 0.122 27.896 0.955
Hotelling's Trace 0.433 2.694 12 224 0.002 0.126 32.323 0.981
Roy's Largest Root 0.283 5.524c 4 78 0.001 0.221 22.096 0.97
c. The statistic is an upper bound on F that yields a lower bound on the significance level.
d. Computed using alpha = .05
Multivariate Testsa
Effect
Intercept
Education
a. Design: Intercept + Education
b. Exact statistic

Copyright UCT
41
behaviour than those with certificates (p = .013) while individuals with diplomas had more
positive perceptions of entrepreneurial behaviour than those with certificates (p = .043). As far as
entrepreneurial antecedents were concerned, individuals with a bachelor’s degree had more
favourable perceptions than those with certificates (p = .019).
4.1.3 SECOND MULTIPLE ANALYSIS OF VARIANCE
A MANOVA of the dependent variables under entrepreneurship antecedents was conducted with
respect to the independent variables of seniority, education and department. The dependent
variables were management support, work discretion, rewards, time availability and organization
boundaries. The descriptive statistics (Table 8) showed that the dependent variable with the
highest mean score was rewards (1.65) followed by work discretion (1.51), time availability
(1.46), organisation boundaries (1.38) and management support (1.29). The variables with the
highest and lowest standard deviation were rewards and organisation boundaries respectively.
Table 8 Descriptive Statistics: Entrepreneurship Antecedents
The dependent variables were tested for suitability for MANOVA in terms of correlation and
normal distribution (Table 9). The Pearson correlation matrix yielded results ranging from -.175
to .654 which were within the acceptable ranges of -.4 <r < .9 (Mayers, 2013). All the variables
therefore passed the correlation criteria. Significant correlations were found between
management support and work discretion (.654, p = .000), management support and rewards
(.633, p = .000), work discretion and rewards (.549, p = .000) and work discretion and
organisation boundaries (.230, p = .037).
N Minimum Maximum MeanStd.
DeviationStatistic Statistic Statistic Statistic Statistic Statistic Std. Error
Management Support 83 .21 2.05 1.2894 .37474 -.424 .264Work Discretion 83 .70 2.70 1.5084 .37780 .062 .264Rewards 83 .33 3.00 1.6527 .46302 -.584 .264Time Availability 83 .50 2.50 1.4618 .34953 -.047 .264Organisation Boundaries 83 .63 2.13 1.3810 .24531 -.357 .264Valid N (listwise) 83
Descriptive Statistics
Skewness

Copyright UCT
42
Table 9 Correlation Matrix: Dependent Antecedent Variables
The Shapiro-Wilk test (Table 10) was conducted to assess normal distribution for the dependent
variables (Mayers, 2013). The results were somewhat inconsistent in that only management
support and work discretion clearly displayed normal distribution. The results were not certain
for rewards (p = .001) time availability (p = .016) and organisation boundaries (p = .005) as the p
values were less than .05. However, a further analysis of the Normal Q-Q plots (Fig.6) revealed
that the distribution of points on each variable was close to the expected plot thus confirming
normal distribution.
Management Support
Work Discretion
RewardsTime
AvailabilityOrganisation Boundaries
Pearson Correlation 1 .654** .633** 0.081 0.108
Sig. (2-tailed) 0 0 0.465 0.33
N 83 83 83 83 83
Pearson Correlation .654** 1 .549** 0.152 .230*
Sig. (2-tailed) 0 0 0.171 0.037
N 83 83 83 83 83
Pearson Correlation .633** .549** 1 -0.027 0.103
Sig. (2-tailed) 0 0 0.805 0.354
N 83 83 83 83 83
Pearson Correlation 0.081 0.152 -0.027 1 -0.175
Sig. (2-tailed) 0.465 0.171 0.805 0.113
N 83 83 83 83 83
Pearson Correlation 0.108 .230* 0.103 -0.175 1
Sig. (2-tailed) 0.33 0.037 0.354 0.113
N 83 83 83 83 83
Organisation Boundaries
**. Correlation is significant at the 0.01 level (2-tailed).
*. Correlation is significant at the 0.05 level (2-tailed).
Correlations
Management Support
Work Discretion
Rewards
Time Availability

Copyright UCT
43
Table 10 Tests of Normality: Entrepreneurship Antecedents
Kolmogorov-Smirnova Shapiro-Wilk
Statistic Df Sig. Statistic df Sig.
Management Support .064 83 .200* .982 83 .294
Work Discretion .090 83 .095 .976 83 .123
Rewards .153 83 .000 .945 83 .001
Time Availability .146 83 .000 .963 83 .016
Organisation Boundaries .153 83 .000 .954 83 .005
*. This is a lower bound of the true significance.
a. Lilliefors Significance Correction
Figure 6 Normal Q-Q Tests: Entrepreneurship Antecedents
A Pearson correlation test was conducted for the individual entrepreneurial antecedents with the
variables of entrepreneurial behavior, culture and social capital (Table 11). The results showed a
significant correlation between entrepreneurial behavior and management support (.643), work
discretion (.613), and rewards (.437). There was no significant correlation between
entrepreneurial behavior and time availability and organization boundaries. Culture had a
significant correlation with management support (.382) while social capital had a significant
correlation with management support (.574), work discretion (.464), and rewards (.436).

Copyright UCT
44
Table 11 Correlation Matrix: Entrepreneurship Antecedents
4.1.3.1 SENIORITY AND PERCEPTIONS OF ENTREPRENEURSHIP
ANTECEDENTS
A MANOVA was carried out for the dependent variables of management support, work
discretion, rewards, time availability and organisation boundaries with the independent variable
of seniority. The Levene’s test showed that homogeneity existed in between-group variances as
the p values were greater than .05. This was confirmed by Box’s test of equality which showed a
significance level of .098 which was greater than the benchmark of .001 (Mayers, 2013). The
seniority sample sizes were not equal: senior managers (N=17), middle managers (N=29),
supervisors (N=29) and staff (N=8). The descriptive statistics showed that the means of senior
managers were larger than other groups for all variables except time availability and work
discretion where it was difficult to discern a trend.
Management Support Work Discretion Rewards Time Availability
Organisation Boundaries
Entrepreneurial Behaviour Culture Social Capital
Pearson Correlation 1 .654** .633** .081 .108 .643** .382** .574**
Sig. (2-tailed) .000 .000 .465 .330 .000 .000 .000N 83 83 83 83 83 83 83 83Pearson Correlation .654** 1 .549** .152 .230* .613** .234* .464**
Sig. (2-tailed) .000 .000 .171 .037 .000 .034 .000N 83 83 83 83 83 83 83 83Pearson Correlation .633** .549** 1 -.027 .103 .437** .265* .436**
Sig. (2-tailed) .000 .000 .805 .354 .000 .016 .000N 83 83 83 83 83 83 83 83Pearson Correlation .081 .152 -.027 1 -.175 .150 .175 .175Sig. (2-tailed) .465 .171 .805 .113 .177 .114 .114N 83 83 83 83 83 83 83 83Pearson Correlation .108 .230* .103 -.175 1 -.041 -.257* -.036Sig. (2-tailed) .330 .037 .354 .113 .714 .019 .746N 83 83 83 83 83 83 83 83Pearson Correlation .643** .613** .437** .150 -.041 1 .435** .434**
Sig. (2-tailed) .000 .000 .000 .177 .714 .000 .000N 83 83 83 83 83 83 83 83Pearson Correlation .382** .234* .265* .175 -.257* .435** 1 .443**
Sig. (2-tailed) .000 .034 .016 .114 .019 .000 .000N 83 83 83 83 83 83 83 83Pearson Correlation .574** .464** .436** .175 -.036 .434** .443** 1Sig. (2-tailed) .000 .000 .000 .114 .746 .000 .000N 83 83 83 83 83 83 83 83
Organisation Boundaries
Entrepreneurial Behaviour
Culture
Social Capital
**. Correlation is significant at the 0.01 level (2-tailed).
*. Correlation is significant at the 0.05 level (2-tailed).
Correlations
Management Support
Work Discretion
Rewards
Time Availability

Copyright UCT
45
Table 12 Multivariate Test: Seniority and Entrepreneurship Antecedents
The results of the multivariate tests (Table 12) showed a significant multivariate effect for the
combined dependent variables of management support, work discretion, rewards, time
availability and organisation boundaries with respect to seniority: Hotelling’s Trace = .458, F
(15,221) = 2.250, p = .006. The univariate tests suggested that the variables management
support, work discretion, rewards and organisation boundaries differed significantly in respect of
the independent variable seniority: management support: F (3,79) = 4.347, p = .007; work
discretion: F(3,79) = 3.547, p = .018; rewards: F(3,79) = 4.275, p = .008; organisation
boundaries: F (3,79) = 4.613, p = .005. Time availability did not show any significant difference
with respect to seniority with F (3, 79) = .121, p = .948. The post hoc Scheffe test showed that
senior managers had a more positive perception of management support than supervisors (p =
.012); senior managers had a more positive perception of rewards than staff (p = .037) and
supervisors (p = .044); and senior managers had a more favourable perception of organisation
boundaries than supervisors (p = .007).
Value FHypothesi
s df Error df Sig.Partial Eta Squared
Noncent. Parameter
Observed Powerd
Pillai's Trace
.985 993.645b 5.000 75.000 .000 .985 4968.226 1.000
Wilks' Lambda .015 993.645b 5.000 75.000 .000 .985 4968.226 1.000
Hotelling's Trace 66.243 993.645b 5.000 75.000 .000 .985 4968.226 1.000
Roy's Largest Root
66.243 993.645b 5.000 75.000 .000 .985 4968.226 1.000
Pillai's Trace
.356 2.073 15.000 231.000 .012 .119 31.094 .962
Wilks' Lambda
.669 2.167 15.000 207.443 .008 .125 29.739 .952
Hotelling's Trace .458 2.250 15.000 221.000 .006 .132 33.750 .976
Roy's Largest Root
.366 5.637c 5.000 77.000 .000 .268 28.184 .989
c. The statistic is an upper bound on F that yields a lower bound on the significance level.
d. Computed using alpha = .05
Multivariate Testsa
EffectIntercept
Seniority
a. Design: Intercept + Seniority
b. Exact statistic

Copyright UCT
46
RESULTS SUMMARY
Perceptions of management support, work discretion, rewards, time availability and organisation
boundaries were measured in three employee groups: staff, supervisors, middle managers and
senior managers. The MANOVA confirmed a significant multivariate effect: Hotelling’s Trace
= .458, F (15,221) = 2.250, p = .006. Univariate independent one-way ANOVA’s showed
significant main effects for seniority in respect of: management support: F (3, 79) = 4.347, p =
.007; work discretion: F (3, 79) = 3.547, p = .018; rewards: F (3, 79) = 4.275, p = .008;
organisation boundaries: F (3, 79) = 4.613, p = .005. Time availability did not show any
significant difference with respect to seniority with F (3, 79) = .121, p = .948. Scheffe’s post hoc
tests showed that senior managers had a more positive perception of management support than
supervisors (p = .012); senior managers had a more positive perception of rewards than staff (p =
.037) and supervisors (p = .044); and senior managers had a more positive perception of
organisation boundaries than supervisors (p = .007).
4.1.3.2 EDUCATION AND PERCEPTIONS OF ENTREPRENEURSHIP
ANTECEDENTS
The dependent variables of management support, work discretion, rewards, time availability and
organisation boundaries were subjected to MANOVA with respect to education as the
independent variable. Levene’s test showed homogeneity of between-group variance for all the
dependent variables as all the significance levels were above .005. This was also confirmed by
the Box’s Text of Equality as the significance was greater than 0.001 (Mayers, 2013).
The descriptive statistics suggested that individuals with a higher education had a more positive
perception of the antecedents for entrepreneurship for three variables: management support;
work discretion; and rewards. The opposite was true for time availability with those holding
lower qualifications seeming to have better perceptions than those with higher qualifications.
The results for organization boundaries showed no discernible pattern.
The results of the multivariate analysis (Table 13) showed a significant multivariate effect for
management support, work discretion, rewards, time availability and organisation boundaries in
respect of education: Hotelling’s Trace = 0.399, F (15,221) = 1.959, p = .019.
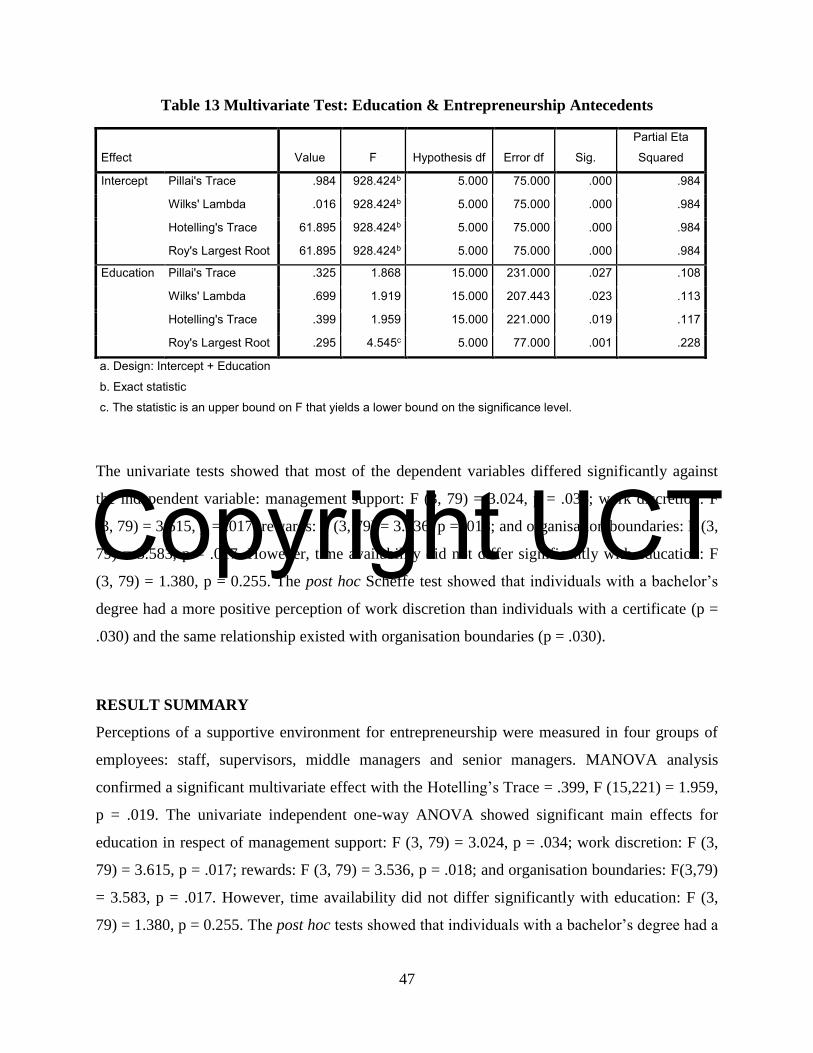
Copyright UCT
47
Table 13 Multivariate Test: Education & Entrepreneurship Antecedents
Effect Value F Hypothesis df Error df Sig.
Partial Eta
Squared
Intercept Pillai's Trace .984 928.424b 5.000 75.000 .000 .984
Wilks' Lambda .016 928.424b 5.000 75.000 .000 .984
Hotelling's Trace 61.895 928.424b 5.000 75.000 .000 .984
Roy's Largest Root 61.895 928.424b 5.000 75.000 .000 .984
Education Pillai's Trace .325 1.868 15.000 231.000 .027 .108
Wilks' Lambda .699 1.919 15.000 207.443 .023 .113
Hotelling's Trace .399 1.959 15.000 221.000 .019 .117
Roy's Largest Root .295 4.545c 5.000 77.000 .001 .228
a. Design: Intercept + Education
b. Exact statistic
c. The statistic is an upper bound on F that yields a lower bound on the significance level.
The univariate tests showed that most of the dependent variables differed significantly against
the independent variable: management support: F (3, 79) = 3.024, p = .034; work discretion: F
(3, 79) = 3.615, p = .017; rewards: F (3, 79) = 3.536, p = .018; and organisation boundaries: F (3,
79) = 3.583, p = .017. However, time availability did not differ significantly with education: F
(3, 79) = 1.380, p = 0.255. The post hoc Scheffe test showed that individuals with a bachelor’s
degree had a more positive perception of work discretion than individuals with a certificate (p =
.030) and the same relationship existed with organisation boundaries (p = .030).
RESULT SUMMARY
Perceptions of a supportive environment for entrepreneurship were measured in four groups of
employees: staff, supervisors, middle managers and senior managers. MANOVA analysis
confirmed a significant multivariate effect with the Hotelling’s Trace = .399, F (15,221) = 1.959,
p = .019. The univariate independent one-way ANOVA showed significant main effects for
education in respect of management support: F (3, 79) = 3.024, p = .034; work discretion: F (3,
79) = 3.615, p = .017; rewards: F (3, 79) = 3.536, p = .018; and organisation boundaries: F(3,79)
= 3.583, p = .017. However, time availability did not differ significantly with education: F (3,
79) = 1.380, p = 0.255. The post hoc tests showed that individuals with a bachelor’s degree had a

Copyright UCT
48
more favourable perception of work discretion than individuals with a certificate (p = .030) and
the same relationship existed for organisation boundaries (p = .030).
4.1.3.3 DEPARTMENT AND PERCEPTIONS OF ENTREPERNEURSHIP
ANTECEDENTS
A MANOVA was carried out for the dependent variables of management support, work
discretion, rewards, time availability and organisation boundaries with department as the
independent variable. The descriptive statistics did not display any discernible trends and the
means were generally close to each other for all dependent variables. The sample sizes were not
equal: commercial (N=17), human resources (N=2), supply chain (N=40), and finance (N=24).
The Levene’s test showed homogeneity of between-group variance for all dependent variables as
all p values were above .05. This was confirmed by Box’s Test of equality with p = .083.
The MANOVA ( Table 14) showed that there was no significant multivariate effect for the
combined dependent variables of management support, work discretion, rewards, time
availability and organization boundaries in respect of the type of department: Hotelling’s Trace =
.222, F(15,221) = 1.092, p = .365.
Table 14 Multivariate Tests: Department and Entrepreneurship Antecedents
Value FHypothesi
s df Error df Sig.Partial Eta Squared
Noncent. Parameter
Observed Powerd
Pillai's Trace .955 319.704b 5.000 75.000 .000 .955 1598.520 1.000Wilks' Lambda .045 319.704b 5.000 75.000 .000 .955 1598.520 1.000Hotelling's Trace 21.314 319.704b 5.000 75.000 .000 .955 1598.520 1.000Roy's Largest Root 21.314 319.704b 5.000 75.000 .000 .955 1598.520 1.000Pillai's Trace .203 1.120 15.000 231.000 .339 .068 16.795 .711Wilks' Lambda .809 1.107 15.000 207.443 .352 .068 15.229 .652Hotelling's Trace .222 1.092 15.000 221.000 .365 .069 16.379 .695Roy's Largest Root .113 1.740c 5.000 77.000 .135 .102 8.701 .571
c. The statistic is an upper bound on F that yields a lower bound on the significance level.
d. Computed using alpha = .05
Multivariate Testsa
EffectIntercept
Department
a. Design: Intercept + Department
b. Exact statistic
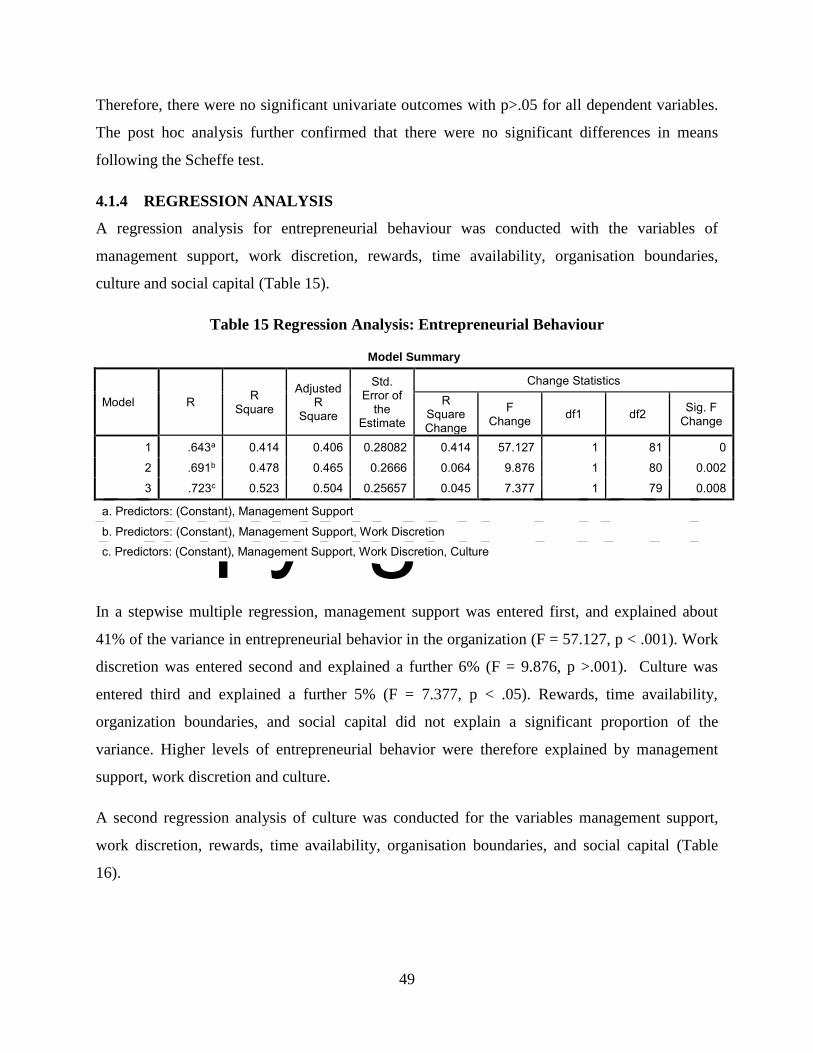
Copyright UCT
49
Therefore, there were no significant univariate outcomes with p>.05 for all dependent variables.
The post hoc analysis further confirmed that there were no significant differences in means
following the Scheffe test.
4.1.4 REGRESSION ANALYSIS
A regression analysis for entrepreneurial behaviour was conducted with the variables of
management support, work discretion, rewards, time availability, organisation boundaries,
culture and social capital (Table 15).
Table 15 Regression Analysis: Entrepreneurial Behaviour
Model Summary
Model R R Square
Adjusted R
Square
Std. Error of
the Estimate
Change Statistics R
Square Change
F Change df1 df2 Sig. F
Change
1 .643a 0.414 0.406 0.28082 0.414 57.127 1 81 0
2 .691b 0.478 0.465 0.2666 0.064 9.876 1 80 0.002
3 .723c 0.523 0.504 0.25657 0.045 7.377 1 79 0.008
a. Predictors: (Constant), Management Support
b. Predictors: (Constant), Management Support, Work Discretion
c. Predictors: (Constant), Management Support, Work Discretion, Culture
In a stepwise multiple regression, management support was entered first, and explained about
41% of the variance in entrepreneurial behavior in the organization (F = 57.127, p < .001). Work
discretion was entered second and explained a further 6% (F = 9.876, p >.001). Culture was
entered third and explained a further 5% (F = 7.377, p < .05). Rewards, time availability,
organization boundaries, and social capital did not explain a significant proportion of the
variance. Higher levels of entrepreneurial behavior were therefore explained by management
support, work discretion and culture.
A second regression analysis of culture was conducted for the variables management support,
work discretion, rewards, time availability, organisation boundaries, and social capital (Table
16).
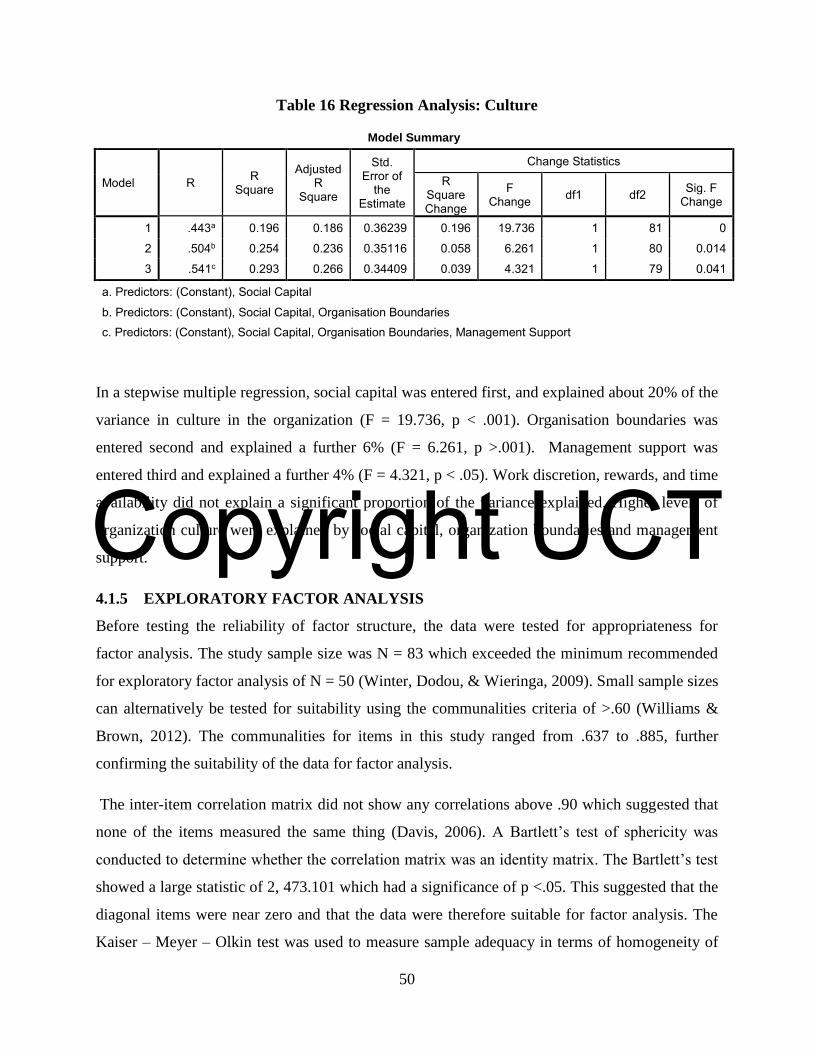
Copyright UCT
50
Table 16 Regression Analysis: Culture
Model Summary
Model R R Square
Adjusted R
Square
Std. Error of
the Estimate
Change Statistics R
Square Change
F Change df1 df2 Sig. F
Change
1 .443a 0.196 0.186 0.36239 0.196 19.736 1 81 0
2 .504b 0.254 0.236 0.35116 0.058 6.261 1 80 0.014
3 .541c 0.293 0.266 0.34409 0.039 4.321 1 79 0.041
a. Predictors: (Constant), Social Capital
b. Predictors: (Constant), Social Capital, Organisation Boundaries
c. Predictors: (Constant), Social Capital, Organisation Boundaries, Management Support
In a stepwise multiple regression, social capital was entered first, and explained about 20% of the
variance in culture in the organization (F = 19.736, p < .001). Organisation boundaries was
entered second and explained a further 6% (F = 6.261, p >.001). Management support was
entered third and explained a further 4% (F = 4.321, p < .05). Work discretion, rewards, and time
availability did not explain a significant proportion of the variance explained. Higher levels of
organization culture were explained by social capital, organization boundaries and management
support.
4.1.5 EXPLORATORY FACTOR ANALYSIS
Before testing the reliability of factor structure, the data were tested for appropriateness for
factor analysis. The study sample size was N = 83 which exceeded the minimum recommended
for exploratory factor analysis of N = 50 (Winter, Dodou, & Wieringa, 2009). Small sample sizes
can alternatively be tested for suitability using the communalities criteria of >.60 (Williams &
Brown, 2012). The communalities for items in this study ranged from .637 to .885, further
confirming the suitability of the data for factor analysis.
The inter-item correlation matrix did not show any correlations above .90 which suggested that
none of the items measured the same thing (Davis, 2006). A Bartlett’s test of sphericity was
conducted to determine whether the correlation matrix was an identity matrix. The Bartlett’s test
showed a large statistic of 2, 473.101 which had a significance of p <.05. This suggested that the
diagonal items were near zero and that the data were therefore suitable for factor analysis. The
Kaiser – Meyer – Olkin test was used to measure sample adequacy in terms of homogeneity of
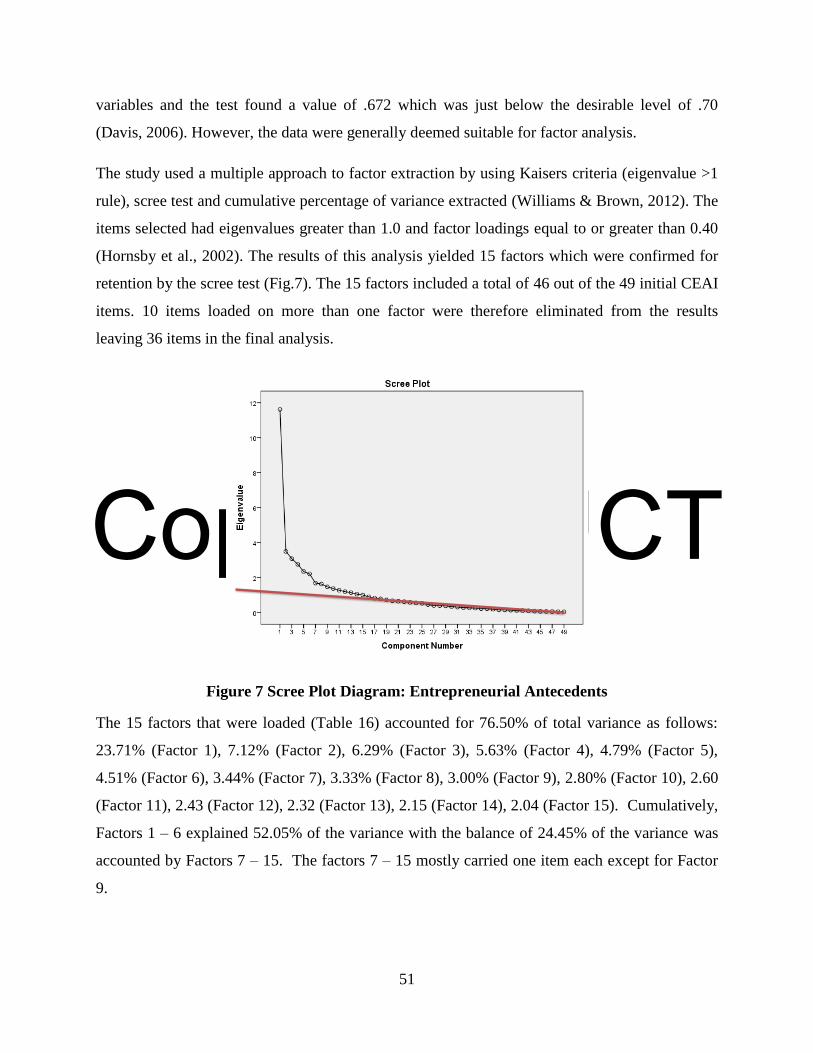
Copyright UCT
51
variables and the test found a value of .672 which was just below the desirable level of .70
(Davis, 2006). However, the data were generally deemed suitable for factor analysis.
The study used a multiple approach to factor extraction by using Kaisers criteria (eigenvalue >1
rule), scree test and cumulative percentage of variance extracted (Williams & Brown, 2012). The
items selected had eigenvalues greater than 1.0 and factor loadings equal to or greater than 0.40
(Hornsby et al., 2002). The results of this analysis yielded 15 factors which were confirmed for
retention by the scree test (Fig.7). The 15 factors included a total of 46 out of the 49 initial CEAI
items. 10 items loaded on more than one factor were therefore eliminated from the results
leaving 36 items in the final analysis.
Figure 7 Scree Plot Diagram: Entrepreneurial Antecedents
The 15 factors that were loaded (Table 16) accounted for 76.50% of total variance as follows:
23.71% (Factor 1), 7.12% (Factor 2), 6.29% (Factor 3), 5.63% (Factor 4), 4.79% (Factor 5),
4.51% (Factor 6), 3.44% (Factor 7), 3.33% (Factor 8), 3.00% (Factor 9), 2.80% (Factor 10), 2.60
(Factor 11), 2.43 (Factor 12), 2.32 (Factor 13), 2.15 (Factor 14), 2.04 (Factor 15). Cumulatively,
Factors 1 – 6 explained 52.05% of the variance with the balance of 24.45% of the variance was
accounted by Factors 7 – 15. The factors 7 – 15 mostly carried one item each except for Factor
9.

Copyright UCT
52
Table 17 Exploratory Factor Analysis: Entrepreneurship Antecedents
The factors were labelled according to the common characteristics of the items loaded into each factor (Table 17). The labels were
management and organisation support (Factor 1), work discretion (Factor 2), rewards/recognition (Factor 3), risk acceptance (Factor
4), performance management (Factor 5), management experience/leadership (Factor 6), job design (Factor 7) work practices (Factor
8), bureaucracy (Factor 9), inadequate time (Factor 10), workload (Factor 11), organisation boundaries (Factor 12) , decentralised
authority (Factor 13), change acceptance (Factor 14) and strategic thinking (Factor 15).
Item Load Item Load Item Load Item Load Item Load Item Load Item Load Item Load Item Load Item Load Item Load Item Load Item Load Item Load Item Load
Q20 .853 Q50 .815 Q33 .755 Q39 .775 Q44 .824 Q60 .806 Q30 .712 Q14 .805 Q26 .795 Q43 .901 Q4 .889 Q49 .882 Q2 .742 Q1 .744 Q29 .849
Q9 .743 Q36 .731 Q52 .504 Q40 .659 Q54 .469 Q27 .548 Q25 .577
Q10 .734 Q41 .716 Q62 -.483 Q11 .534
Q28 .721 Q13 .567 Q5 .423
Q35 .709
Q19 .704
Q48 .665
Q21 .629
Q59 .583
Inadequate Time Workload Organisation
Boundaries
Decentralised
Authority
Factor 15Factor 10 Factor 11 Factor 12 Factor 13 Factor 14Factor 6 Factor 7 Factor 8
Work Practices Bureaucracy
Factor 9
Management &
Organisation Support
Work Discretion Rewards &
Recognition
Risk Acceptance Performance
Management
Management
Experience &
Leadership
Job Design
Factor 1
Change Acceptance Strategic Thinking
Factor 2 Factor 3 Factor 4 Factor 5

Copyright UCT
53
Table 18 Exploratory Factor Loading Statements
Item # Management & Organisation Support Loading
20 This organization provides the chance to be creative and try my own
methods of doing the job.
0.853
9 In my organization, developing one’s own ideas is encouraged for the
improvement of the corporation.
0.743
10 Upper management is aware and very receptive to my ideas and
suggestions.
0.734
28 This organization provides freedom to use my own judgment 0.721
35 This organization provides the chance to do something that makes use of
my abilities.
0.709
19 Those employees who come up with innovative ideas on their own often
receive management encouragement for their activities.
0.704
48 A worker with a good idea is often given free time to develop that idea. 0.665
21 My supervisor will increase my job responsibilities if I am performing
well in my job.
0.629
59 People are encouraged to talk to workers in other departments of this
organization about ideas for new projects.
0.583
Work Discretion
50 I almost always get to decide what I do on my job. 0.815
36 I have the freedom to decide what I do on my job. 0.731
41 It is basically my own responsibility to decide how my job gets done. 0.716
Rewards & Recognition
33 Individuals with successful innovative projects receive additional reward
and compensation for their ideas and efforts beyond the standard reward
system.
0.755
52 My manager would tell his boss if my work was outstanding. 0.504
62 There is a lot of challenge in my job - 0.483
Risk Acceptance
39 People are often encouraged to take calculated risks with new ideas
around here.
0.775
40 The term ‘‘risk taker’’ is considered a positive attribute for people in my
work area.
0.659
Performance Management
44 My job description clearly specifies the standards of performance on
which my job is evaluated.
0.824
37 During the past year, my immediate supervisor discussed my work
performance with me frequently.
0.696
Management Experience & Leadership

Copyright UCT
54
60 I seldom have to follow the same work methods or steps for doing my
major tasks from day to day.
0.806
27 Many top managers have been known for their experience with the
innovation process.
0.548
11 Harsh criticism and punishment result from mistakes made on the job. 0.534
5 In the past three months, I have always followed standard operating
procedures or practices to do my major tasks.
0.423
Job Design
30 There is little uncertainty in my job. 0.712
Work Practices
14 There are many written rules and procedures that exist for doing my
major tasks.
0.805
Bureaucracy
26 Senior managers encourage innovators to bend rules and rigid procedures
in order to keep promising ideas on track.
0.795
25 The ‘‘doers’’ are allowed to make decisions on projects without going
through elaborate justification and approval procedures.
0.577
Inadequate Time
43 I feel that I am always working with time constraints on my job. 0.901
Workload
4 During the past three months, my work load was too heavy to spend time
on developing new ideas.
0.889
Organisation Boundaries
49 There is considerable desire among people in the organization for
generating new ideas without regard to crossing departmental or
functional boundaries.
0.882
Decentralised Authority
2 I feel that I am my own boss and do not have to double check all of my
decisions.
0.742
Change Acceptance
1 My organization is quick to use improved work methods 0.744
Strategic Thinking
29 My job is structured so that I have very little time to think about wider
organizational problems.
0.849

Copyright UCT
55
Once the factor structure was determined, inter-item correlations and coefficient alphas were
used to evaluate the internal consistency of the items under each factor. Appropriate alpha
coefficients were considered as those with values equal to or greater than .70 (Davis, 2006). The
results (Table 6) showed that factor 3, 5, 6 and 9 had Cronbach’s alphas less than .70 which
indicated that the items in the factors were not internally consistent. Factors with only one item
could not be considered for internal consistency.
Table 19 Cronbach’s Alpha Analysis
Reliability Statistics
Factor
Cronbach's
Alpha
N of
Items
Factor 1 .905 9
Factor 2 .748 4
Factor 3 .124 3
Factor 4 .721 2
Factor 5 .446 2
Factor 6 .524 4
Factor 9 .502 2
Copyright UCT
4.2 RESEARCH ANALYSIS AND DISCUSSION
4.2.1 ENTREPRENEURIAL BEHAVIOUR AND ENVIRONMENT
An analysis of the results showed that entrepreneurial orientation was significantly present in the
organisation at a mean score equivalent to 57 percent. This suggested that organisation members
had a reasonable propensity to participate in innovative, pro-active and risk taking behaviours.
The regression analysis revealed that management support, work discretion and culture explained
a total of 52 percent of the variance entrepreneurial behaviour. The Pearson correlation supported
these results with respect to management support, work discretion and culture but further showed
a positive correlation with rewards and social capital. Both the regression and correlation
analysis confirmed that entrepreneurship antecedents (management support, work discretion,
rewards) had the greatest influence on entrepreneurial behaviour followed by culture and social
capital.
However, the analysis of the mean scores demonstrated that entrepreneurship antecedents and
social capital were the weakest elements of the entrepreneurship environment. The weakest mean
score for the entrepreneurship antecedents was for management support followed by organisation
boundaries whereas the strongest mean score was for rewards followed by work discretion. The
strongest element was culture which attracted a mean score equivalent to 62%. The regression
analysis showed that the significant predictors of culture were social capital, organisation
boundaries and management support. This somewhat differed to the findings by Ireland et al.,
(2009) who suggested that an entrepreneurial culture is characterised by the presence of
management support and work discretion. Therefore significant improvements in management
support will not only improve entrepreneurial antecedents but also improve culture. Management
support therefore proved to be a critical tool for leveraging the entrepreneurial environment. A
detailed analysis of the other entrepreneurship antecedents is carried out in later sections.
The results therefore confirmed that culture was the principal driver behind entrepreneurial
behaviour as organisation boundaries and management support had a weaker presence in the
organisation. These findings also showed the high potential for further improving entrepreneurial
behaviour through addressing weaknesses in the entrepreneurship antecedents (mainly
management support) and social capital.

Copyright UCT
57
Seniority showed significant effects on perceptions of the internal environment for
entrepreneurship. Senior managers had a more favourable perception of entrepreneurial
antecedents compared to other groups in the organisation. Specifically, senior managers had
more positive perceptions of management support, rewards and organisation boundaries. These
results supported previous findings which suggested that employees holding managerial
positions were more likely to be more entrepreneurial (de Jong et al., 2011) and that the
relationship between entrepreneurial actions and management support was stronger for senior
and middle managers (Phan et al., 2009). The results also supported findings by Monsen & Boss
(2009) who found that managers had higher mean scores of entrepreneurial orientation compared
to employees and therefore demonstrated a differential reaction to entrepreneurship activities.
This study therefore confirmed hypothesis H1 as the findings indicated that managers had a more
positive perception of entrepreneurial antecedents and therefore possessed a differential ability to
capitalise on entrepreneurship activities.
However, of concern is the fact that two of the antecedents attracting more positive perceptions
from managers (management support and organisation boundaries) showed the weakest presence
in the organisation. The multivariate analysis showed that the variance in perceptions was more
critical for management support (p = .012) and organisation boundaries (p = .007) than rewards
(p = .037 and p = .044). Also notable, is the fact that the variance in perceptions of management
support and organisation boundaries was significant only between senior managers and
supervisors whereas the variance in rewards was noted with both supervisors and staff members.
This suggests that the most significant variation in perceptions of entrepreneurship antecedents in
the organisation lies between senior managers and supervisors. This could be evidence of a
weakness in the middle manager’s role in communicating and operationalising entrepreneurial
strategies among supervisors. Since senior managers are seldom involved in day to day activities,
middle managers are left with the responsibility to use formal and informal mechanisms to
encourage innovation and calculated risk taking and also communicate promising innovative
ideas to senior management (Hornsby et al., 2002). Therefore, it can be suggested that there was
weak middle management support for entrepreneurship activities in the organisation. In terms of
organisation boundaries, middle managers role in establishing and utilising processes that
evaluate, select and implement entrepreneurial ideas may also have been weak.

Copyright UCT
58
The results of the study showed that seniority had no significant effect on the perceptions of
entrepreneurial behaviour in the organisation. This suggests that there was no difference in the
views of entrepreneurial behaviour across all levels of the hierarchy. The same finding was
applicable for culture and social capital. This finding was in a sense a contradiction with respect
to the variation in perceptions of entrepreneurship antecedents. Since entrepreneurial behaviour
is correlated to antecedents, it would normally be expected that a variation in the perceptions of
entrepreneurial antecedents would be associated with a similar variation in the perceptions of
behaviour. This could mean that there was a higher capability in the organisation for recognising
entrepreneurial behaviour rather than entrepreneurial antecedents. The ability to analyse the
antecedents perhaps requires more human capital (education) which normally increases with
seniority.
The lack of significant differences in perceptions of entrepreneurial behaviour could also be
viewed positively as it could demonstrate that all organisation members are capable of accurately
perceiving innovative, pro-active and risk taking behaviours. This also suggested that there are
clear expectations among all in the organisation as far as innovativeness, pro-activeness and risk-
taking were concerned. Ireland et al. (2009) concur by observing that in order for entrepreneurial
strategies to be succeed, entrepreneurial processes and behaviour must be exhibited across the
entire organisation. Nonetheless, the lower perception of entrepreneurial antecedents among
employees is a cause of concern as it could suggest that organisation architecture is not correctly
deployed to reinforce entrepreneurial behaviour. Pro-entrepreneurship architecture is the
mechanism that facilitates the congruence between managers entrepreneurial vision and the
specific entrepreneurial actions that employees take (Ireland et al., 2009). The organisation
architecture may therefore not have been conducive for entrepreneurial behaviour in the
organisation.
With regards to the education, individuals with master’s degree had a more positive perception
of entrepreneurial behaviour whereas individuals with bachelor’s degrees had a more positive
perception of entrepreneurship antecedents. Specifically, individuals with bachelor’s degrees
had a more favourable perception of work discretion and organisation boundaries. Work
discretion can be related to educational attainment in that individuals with higher education
would have greater ability to practice autonomy than those with lower education. Similarly, with

Copyright UCT
59
regards to organisation boundaries, individuals with high education are able to better understand
the process of identifying, evaluating, selecting and implementing innovative ideas. These
findings supported hypothesis H2 as it demonstrated that human capital had a significant positive
relationship with both entrepreneurial behaviour (intensity) and entrepreneurship antecedents.
Studies have found that educational attainment is a strong correlate of entrepreneurial behaviour
and had been previously connected to the decision to become self-employed (de Jong et al.,
2011). The study showed that even seemingly small improvements in education had a significant
impact on perspectives of entrepreneurial behaviour as there was a notable difference in
perceptions of entrepreneurial behaviour even between individuals with diplomas and those with
certificates. This suggested that lower level qualifications and training can make a significant
contribution to perceptions of entrepreneurial behaviour in the firm. Finally, the findings
demonstrated that entrepreneurial behaviour can be taught in organisations and there is rationale
for increasing human capital development both in terms of formal qualifications, knowledge
sharing, experience and skills upgrades (M. A. Hitt & Duane, 2002).
4.2.2 ENTREPRENEURSHIP ANTECEDENTS
4.2.2.1 ANTECEDENTS AND ENTREPRENUERIAL BEHAVIOIR
In order to clearly understand the most effective environment for entrepreneurial activity, the
individual antecedents to entrepreneurial behaviour required close examination (Kuratko et al.,
2014). The study suggested that the strongest entrepreneurial antecedents were rewards and work
discretion. The correlation results showed that management support, work discretion and rewards
had the strongest relationship to entrepreneurial behaviour whereas the regression analysis
identified management support and work discretion as the predictors of entrepreneurial
behaviour. These results revealed a critical weakness in management support in that while the
antecedent was identified as the key predictor of entrepreneurial behaviour, it was also the
variable with the weakest mean score in the organisation. Research has demonstrated that
management support has an important positive relationship with entrepreneurial outcomes and
the extent to which subordinates view management support promotes entrepreneurial behaviour
(Goodale et al., 2011). Management support takes various forms such as resource availability,
appropriate use of rewards and perceived organisational support (Hayton, 2005). Considering the

Copyright UCT
60
higher mean score for rewards, it can be concluded that management support is weak in terms of
resource availability and organisation support.
With regards to resource availability, managers can render support for entrepreneurial behaviour
by championing initiatives and providing resources to the people who require them, including
finances and time (Goodale et al., 2011). Time availability in the study attracted a reasonable
mean score but was not highly correlated with entrepreneurial behaviour. This was inconsistent
with other research findings which suggested time availability as a critical resource in terms of
influencing the perceptions surrounding the feasibility of entrepreneurial behaviour and allowing
employees the space to incubate and develop new and innovative ideas (Villiers-Scheepers,
2012). Despite having two management support items related to financial support in the CEAI, it
was not possible to specifically identify any relationship in terms of financial support. Further to
this, the two financial support items on the CEAI did not load significantly in any of the factors
identified in the exploratory factor analysis. This was unlike recent studies such as those by René
van Wyk & Adonisi (2011) who identified financial support as a factor in the exploratory
analysis of the CEAI. Nonetheless, financial support was an area that also required further
management attention in the organisation.
Organisation support is important as it assists the development of a social exchange relationship
between an individual and the organisation (Hayton, 2005). Organisation support includes
openness to innovative ideas and investments in organisation members, which increase the
engagement of employees in extra-role behaviours that encourage entrepreneurship (Hayton,
2005). These investments, which are related to human capital development, not only act to
improve perceptions of entrepreneurial behaviour, but also motivate organisation members to
take discretionary efforts in order to promote entrepreneurship. Supportive organisation
structures also provide administrative mechanisms through which ideas are evaluated, chosen
and implemented (Villiers-Scheepers, 2012). Entrepreneurial behaviour is enhanced where these
administrative mechanisms are simple and easily accessible to all employees. Flexible
organisation boundaries also promote entrepreneurial activity by facilitating the flow of
information between the organisation and external parties and also between departments or
divisions within the organisation (Goodale et al., 2011).

Copyright UCT
61
However, the results of the study showed that organisation boundaries (and therefore support)
had a low mean score in the descriptive analysis and was not highly correlated to entrepreneurial
behaviour. Previous research has also identified organisation boundaries as a problematic
antecedent and questioned its relevance with respect to entrepreneurship (Davis, 2006; René van
Wyk & Adonisi, 2011). This study too confirmed that organisation boundaries were not a critical
antecedent to entrepreneurial behaviour. Nonetheless, this antecedent still contributed to the
environment for entrepreneurship and the low presence in the organisation is a subject that needs
to be addressed.
As mentioned earlier, work discretion was also identified as a significant predictor of
entrepreneurial behaviour. Work discretion affects entrepreneurial behaviour in that the extent to
which an employee perceives the tolerance of risk, decision-making latitude, freedom from
excessive oversight and delegation of authority determines the risk orientation of the individual
(Goodale et al., 2011). The fact that work discretion showed a high mean score demonstrated that
organisation members were given the autonomy necessary to encourage entrepreneurial
behaviour. This autonomy may have made up for the weakness in management support in order
to maintain the relatively high level of entrepreneurial intensity. Rewards also played a similar
role in that they were identified as a strong correlate of entrepreneurial behaviour and had the
highest mean score among the antecedents. Rewards are indeed a tool that can encourage
employees to engage in innovative, proactive and moderate risk-taking behaviour (Villiers-
Scheepers, 2012). The appropriate use of rewards, such incentive pay, encourage employee
commitment, cooperation, knowledge sharing, and voluntary extra-role behaviour (Hayton,
2005). The exploratory factor analysis showed that rewards extended beyond monetary
incentives to include recognition, promotion and increase in job responsibilities.
The discussion above showed that there was considerable scope to redesign some antecedents,
especially management support, in order to promote entrepreneurial behaviour. However, the
deliberate design of corporate entrepreneurial antecedents does not always yield the desired
outcomes (R Van Wyk & Adonisi, 2012) and the pursuit of entrepreneurship produces a complex
set of challenges as it entails behaviour change and the acceptance of disruptive innovation
(Monsen & Boss, 2009). These factors may make entrepreneurship strategies intimidating to
both managers and employees and in some cases can lead to counterproductive and rogue

Copyright UCT
62
behaviours among organisation members (R Van Wyk & Adonisi, 2012). Organisation leaders
therefore must exercise caution in implementing entrepreneurial changes in the organisation.
Both managers and employees are more likely to engage in entrepreneurial behaviour when the
antecedents to that behaviour are well designed, known and accepted (Kuratko et al., 2014).
Senior managers must therefore use a variety of complementary mechanisms including open
communication networking and resource management practices (R Van Wyk & Adonisi, 2012).
4.2.2.2 ENTREPRENEURSHIP ANTECEDENTS AND SENIORITY
Goodale et al., (2011) suggested that the most important antecedents of manager’s
entrepreneurial behaviour were management support, organisation structure and rewards. The
results of the study showed that senior managers had a more positive perception of rewards and
organisational structures than staff members and supervisors respectively. This meant that senior
managers had a stronger belief that rewards and organisation support factors are well aligned to
support entrepreneurial behaviour. This also means that there may have been a misunderstanding
of the role of rewards and organisation support between senior managers and lower level groups.
In terms of organisation structure, the variance in perceptions can be explained by the fact that
senior managers have better access to key decision makers than supervisors especially
considering the heavy organisation structure in the firm. Non-hierarchical based organisations
are expected to be more receptive to corporate entrepreneurship as the individuals have more
autonomy which in turn stimulates entrepreneurial behaviour (Hornsby et al., 2002). This
weakness in organisation structure is supported by the poor mean score for organisation
boundaries in the study. With regards to rewards, senior managers may have a view of reward
systems that does not address the expectations of staff members. However, this contradicts the
high scoring that rewards attracted in the study. This could therefore mean that senior managers
and staff members may have emphasised different rewards, either being monetary compensation
or recognition. Both forms of reward are important for entrepreneurship and must be emphasised
equally at all employee levels.
However, it is interesting to note that no significant difference in perceptions of rewards was
recorded between senior and middle managers. Further to this, there was also no difference in
perceptions of management support according to seniority. This confirms that fact that there is
no significant difference in the perceptions of poor management support across the hierarchy.

Copyright UCT
63
This underscores the critical deficiency of management support in the organisation as it extends
beyond perception differences in the organisation.
The study also showed no significant difference in perceptions of work discretion and time
availability across the hierarchy. This meant that there were no inconsistent views in the
organisation for work discretion and time availability at various job levels. With regards to time
availability, this finding contradicted previous research which suggested time availability as an
more important resource for generating entrepreneurial outcomes among managers than
employees (Goodale et al., 2011).
4.2.2.3 ENTREPRENEURSHIP ANTECEDENTS AND EDUCATION
Education levels had a significant positive impact on entrepreneurial perceptions in the
organisation as individuals with bachelor’s degrees showed a more positive perception of work
discretion and organisation boundaries than those with lower qualifications. Due to the
knowledge intensity of the strategic entrepreneurship process, it was expected that higher
education would be positively associated with entrepreneurship antecedents. Greater work
discretion and autonomy allow for discretionary behaviours which have a positive effect on
social capital and trust formation in the organisation (Hayton, 2005). Autonomy is also linked to
explorative, opportunity seeking behaviours which characterise strategic entrepreneurship
(Villiers-Scheepers, 2012). Low education levels prevent employees from exercising autonomy
even where time resources are made available. Organisation boundaries include processes which
are used to identify, evaluate and select innovative ideas which in themselves require a high
degree of intellectual understanding.
René van Wyk & Adonisi (2011) propose that teaching entrepreneurship at tertiary level will
lead to advancements in entrepreneurial activities and culture in African countries. There is also
evidence that entrepreneurial behaviour can be taught in organisations through training and
upskilling (M. A. Hitt & Duane, 2002). In this study, such propositions may be valid as 60% of
the participants either had a diploma or a certificate suggesting that the level of education in the
organisation was relatively low. Investing in employees to improve their knowledge capabilities
levels will lead to more positive perceptions and abilities with respect to work discretion and
organisation boundaries.

Copyright UCT
64
4.2.2.4 ENTREPRENEURSHIP ANTECEDENTS AND DEPARTMENT
The results of the study showed that there were no significant differences in perceptions to
entrepreneurial antecedents with respect to departmental groups. This suggested that organisation
function had no significant impact on entrepreneurial perceptions and abilities. This encourages
the notion of entrepreneurship as an organisation-wide strategy. Furthermore, previous research
suggested that entrepreneurship can only be effective in an organisation when it extends to all
functions rather than being made the domain of limited departments (Phan et al., 2009). On the
other hand, this finding is inconsistent with a previous study by de Jong et al. (2011) which
suggested that sales workers exhibited more entrepreneurial behaviour than workers from other
departments.
4.2.3 ORGANISATION CULTURE
Organisation culture had the highest mean score in the organisation and this suggested that
culture was the strongest component of the entrepreneurial environment. In addition to this, the
correlation analysis showed a significant relationship between culture and entrepreneurial
behaviour whereas the regression analysis identified culture as a significant predictor of
entrepreneurial behaviour. This evidence suggested that culture played a critical role in
entrepreneurial behaviour in the organisation. This supports previous findings which identified
that culture as a facilitating mechanism for exploration and exploitation behaviours in the firm
(Ireland & Webb, 2007). Organisations that create a culture where continual experimentation and
change is the norm are more successful at generating entrepreneurial behaviour (Ireland &
Webb, 2007). Other authors have also suggested that trust between organisation members and
leaders is also an important aspect of culture (M. A. Hitt & Duane, 2002).
Ireland et al. (2009) viewed organisation culture as an antecedent to entrepreneurship along with
structure, resources and reward systems. This study found that culture had a significant positive
correlation with management support, work discretion and rewards and a significant negative
correlation with organisation boundaries. This supports previous findings which suggested that
entrepreneurial cultures are characterised by management support and work discretion (Ireland et
al., 2009). Further to this, entrepreneurial cultures are also characterised by human resource
management practices which promote entrepreneurial behaviour such as providing intrinsic
rewards, delegation of responsibility and avoiding overly rigid controls (Hayton, 2005). There

Copyright UCT
65
was no significant correlation between culture and time availability in the study suggesting that
time availability had a limited influence on entrepreneurial culture.
It is interesting to note that while previous studies have suggested that culture supports
organisation structure (Ireland & Webb, 2007) and determines the readiness for
entrepreneurship activities (René van Wyk & Adonisi, 2011), this study found a negative
correlation between culture and organisation boundaries. This suggested that organisation
structures were actually a deterrent to entrepreneurial culture possibly in terms of both heavy
organisation hierarchy and cumbersome approval processes for entrepreneurial ideas. This was
further supported by the poor mean score for organisation structure and there demonstrated a
need to redesign those structures to closely support the entrepreneurial culture. In other words,
the hardware elements (organisation structure) needed to support the software elements (culture
and climate) (Ireland et al., 2009) so that the structure of the firm would represent the
organisations culture (Kraus et al., 2011). This is beneficial to organisations in terms of
sustainability of entrepreneurship activities as entrepreneurship will be viewed as a core element
of the organisation as opposed to isolated event (Villiers-Scheepers, 2012).
An entrepreneurial culture is also characterised by tolerance of risk taking and championing of
product, process and administrative innovations (M. Hitt et al., 2011). In terms of entrepreneurial
behaviour, innovativeness had the highest mean score (1.92) followed by risk taking (1.87).
These scores compare closely with the mean score for culture and this further re-affirms the
existence of an entrepreneurial culture in the organisation. Ireland et al. (2009) concurs that
organisational members pro-entrepreneurship cognitions are positively related to cultural norms
conducive for entrepreneurial behaviour. Furthermore, a culture of change will support
entrepreneurial behaviour by reducing fear stress and ambiguity that arise from risk taking,
innovative and proactive behaviours (Monsen & Boss, 2009).
4.2.4 SOCIAL CAPITAL
Social capital, although relatively weak in the organisation, was also found to be highly
correlated with management support, work discretion, rewards. Social capital was also found to
be highly correlated to culture and entrepreneurial behaviour. This meant that there was
considerable potential in the firm for enhancing both antecedents and outcomes of
entrepreneurship by improving social capital. M. a. Hitt et al. (2001) concur as they find that the

Copyright UCT
66
outcomes of entrepreneurial activity in the firm include tangible ones, such a wealth creation,
and intangible ones such as enhancements in social capital. Therefore there is a two-way
relationship between entrepreneurial behaviour and social capital in a firm.
Social capital and individual cognition are important in understanding entrepreneurial behaviour
(De Carolis & Saparito, 2006). Social capital supports entrepreneurial behaviour in the
organisation by encouraging risk taking attitudes and promoting the exchange of information
both internally and externally (Hayton, 2005). Diverse connections both inside and outside the
firm increase the chances of corporate entrepreneurs discovering new ideas and capitalising on
them (De Carolis & Saparito, 2006). Further to this, being acquainted to individuals from
different parts of the firm creates an environment conducive to entrepreneurial thinking,
organisational learning and idea generation (De Carolis & Saparito, 2006).
4.2.5 MANAGERIAL ROLES
The study showed that senior managers had a more positive perception of entrepreneurship
antecedents (management support, rewards and organisation boundaries) and therefore possessed
a greater ability to capitalise on entrepreneurship than members in lower levels of the
organisation’s hierarchy. Managers cannot promote entrepreneurial behaviour among lower
levels in their organisation unless they themselves have strong entrepreneurial cognitions to
influence attitudes and outlook in others (Ireland et al., 2009). The management of
entrepreneurship is different from traditional management due to conditions of uncertainty and
knowledge intensity and therefore requires additional competencies from managers (Hayton,
2005). The entrepreneurial message must flow from top-management and organisation members
must understand the entrepreneurial vision from the perspective of senior management (Ireland
et al., 2009). Further to this, managers must have the skills to create organisation architectures
where entrepreneurial initiatives will thrive without their direct or intensive involvement (Ireland
et al., 2009). Thus managers must strike a balance between behaving entrepreneurially in their
individual capacity and enabling others to become entrepreneurial in their autonomous state.
Managers must also realise that entrepreneurial strategies, just like other strategies, require
effective change management practices and systematic and disciplined execution. The
implementation of entrepreneurial strategies should therefore be done firstly by communicating
the entrepreneurial vision; secondly providing adequate resources for entrepreneurial activities;

Copyright UCT
67
and thirdly, creating a culture of continuous idea generation (René van Wyk & Adonisi, 2011).
The entrepreneurial strategic vision must be the modus operandi for entrepreneurship activities
and must guide the commitment to innovation and entrepreneurial processes in the organisation
(Ireland et al., 2009).
4.2.6 A FIFTEEN FACTOR SOLUTION TO THE CEAI
The exploratory factor analysis in the study identified 15 factors affecting the environment for
entrepreneurial behaviour: management/organisation support, work discretion,
rewards/recognition, risk acceptance, performance management, management experience, job
design, work practices, bureaucracy, inadequate time, workload, organisation boundaries,
decentralised authority, organisation openness and strategic thinking. Previous studies by
Hornsby et al. (2002) and (René van Wyk & Adonisi, 2011) only found 5 factors (management
support, work discretion, rewards, time availability and organisation boundaries) and 8 factors
(work discretion, management support and risk acceptance, rewards/reinforcements, innovative
initiatives, financial support, sufficient time, organisation boundaries and inadequate time)
respectively. The study by René van Wyk & Adonisi (2011) was conducted using a South
African sample and found that cultural difference played a part in the 8 factor configuration
compared to the previous 5 factor configuration. Similarly, this study found a 15 factor solution
to be the best fit for the data and this suggested that geographic location and culture may have
also played a role in the increase of factors. Many of the items in the CEAI were not related to
other items leading to a high number of factors with single item loadings (job design, work
practices, inadequate time, workload, organisation boundaries, decentralised authority, change
acceptance and strategic thinking). Further to this, for those groups that had more than one item,
there was low internal consistency for the factors: rewards/recognition, performance
management, management experience/leadership, and bureaucracy. Therefore only three factors
were left with high internal consistency which were management/organisation support, work
discretion and risk acceptance. This demonstrated that the validity of the CEAI in this study was
different to previous studies.
Nonetheless, previous research does support the relevance of the additional factors with respect
to entrepreneurship. Performance management is important for entrepreneurship as it assists
employees to understand the connection between the entrepreneurial strategy and their day to
Copyright UCT
68
day activities. Employees who do not understand the importance of entrepreneurship in their
firms objectives will participate in daily actions that will not reinforce entrepreneurship
(Audretsch & Kuratko, 2009). Furthermore, entrepreneurial orientation is positively associated
with intrinsic and extrinsic job satisfaction, employee competence and improved financial
performance (René van Wyk & Adonisi, 2011). Managers need clearly outline entrepreneurial
expectations particularly in as far as they affect an individual’s job performance (Ireland et al.,
2009). Therefore, for entrepreneurship to thrive in the organisation, standards of performance
regarding entrepreneurial behaviour must be made clear to employees.
Fostering entrepreneurship takes an improved approach to management including
decentralisation of authority, participative decision making, avoidance of bureaucracy, and
encouragement of risk taking and creativity (Hayton, 2005). Bureaucracy can also affect
entrepreneurship as it prevent employees from seeing beyond their own areas of responsibility
and discourages the championing of innovative ideas (Villiers-Scheepers, 2012). Job design is
also important for encouraging bottom-up opportunity pursuit and providing top managers with
an object for intervention (de Jong et al., 2011). Designing job roles to optimize stress is
important for strategic entrepreneurship and failure to optimize leads to excessive stress, poor job
performance and wealth erosion (Monsen & Boss, 2009). Related to job design are work
practices under which firms must avoid having standard procedures for all major parts of jobs
and should reduce dependence on rigid performance standards and narrow job descriptions
(Villiers-Scheepers, 2012).
Management experience with entrepreneurships is also a strong driver of entrepreneurial
behaviour among subordinates (Pearce et al., 1997). Managers who are entrepreneurial in their
behaviour have a positive impact on the behaviour of the subordinates (Pearce et al., 1997).
Managers who do not behave entrepreneurially will send conflicting messages to the rest of the
organisation as far as promoting entrepreneurship is concerned. Managers need to lead by
example and demonstrate risk tolerance to encourage their reports to behave entrepreneurially.
The analysis above shows that the additional factors identified are relevant for entrepreneurial
behaviour.

Copyright UCT
69
4.3 RESEARCH LIMITATIONS
This study was a case study of a Malawian firm in the beverage industry. The results of the study
were therefore limited in application both in terms of market conditions of the country and also
the industry in which the firm belonged. Generalisation could have been enhanced with the
participation or other firms in the country. However, with the limited time period, it was difficult
to engage other firms in the country to participate in the study. Therefore there is a need to take
a cautious approach in generalising the results of this study. However, there were some broad
lessons that other large organisations seeking to promote entrepreneurship in Malawi could
derive from this study.
The study was also limited in terms of low survey response rate. Although the final sample size
met the minimum criteria for exploratory factor analysis, the results of study could have been
enhanced and validated by a larger sample size. The low response could be partially attributable
to the limited three week period during which the survey was open. A longer period and further
reminders could have significantly improved the response rate. Further to this, there was a
proportionately very low response rate from the staff category meaning that the results were
dominated by senior employee groups. This was partially due to the fact that most of the lower
level employees had no computer access to participate in the online survey. Due to time
constraints, a paper survey could not be deployed to the lowest employee groups as the
administrative burden of analysis papers surveys could not be managed within the research time
frames.
Another limitation with regards to the survey responses was self-report. Some of the items on the
survey were directed at individual’s assessment of their own entrepreneurial perceptions and
behaviour. Therefore the individuals participating in the survey may not have always given a fair
assessment of survey items that alluded to their own perspectives or performance. For example,
senior managers may have been biased towards viewing management support more positively in
the organisation. However, the fact that the study collected views from various employee groups
mitigated this limited to some extent.
The study also did not consider the effects of other variables such as age and years of service on
entrepreneurial perspectives and behaviour in the organisation. These variables could have added

Copyright UCT
70
an additional dimension to this study in terms of work experience and entrepreneurship in the
organisation.
4.4 RESEARCH CONCLUSIONS
One of the primary interests of this study was to assess the applicability of organisation
architecture theory to an emerging market firm. This theory suggested that entrepreneurial
behaviour can be promoted in firms through the effective design and implementation of
entrepreneurship antecedents: structure, culture, rewards and resources. This theory was tested
using the CEAI and the results showed that organisation architecture theory was applicable to an
emerging market firm in Malawi’s beverage industry. The study demonstrated that
entrepreneurship antecedents, particularly management support, work discretion and culture, had
a significant impact on entrepreneurial behaviour in the organisation. Thus, there was capability
in the firm to utilise organisation architecture theory in order to promote entrepreneurial
behaviour with respect to management support, work discretion and culture (Fig.8).
The study also concluded that entrepreneurial intensity could be high in an organisation despite
weak organisation architecture. This suggested that organisation architecture was not the only
important component of the entrepreneurial environment and other factors such as human capital
and social capital could be also be leveraged to promote entrepreneurial behaviour. Thus,
organisation architecture theory was not the only determinant of entrepreneurial behaviour.
The purpose of the study was to also examine entrepreneurial perspectives across various
parameters and determine whether these perceptions provided differential structural ability to
capitalise on a supportive organisation environment and thereby increase entrepreneurial
behaviour. This purpose was represented by Hypothesis H1. The study concluded that
perceptions of entrepreneurship differed significantly between managers and other organisation
members in terms of the antecedents: management support, rewards and organisation structures.

Copyright UCT
71
Figure 8 Entrepreneurial Intensity Model
However, the study also revealed that there were no differences in perceptions of actual
entrepreneurial behaviour between managers and other organisation members. This suggested
that despite having a higher perception of entrepreneurial antecedents, managers did not perceive
entrepreneurial outcomes any different than other organisation members. Therefore the study
concluded that managers did not possess an increased structural ability to capitalise on higher
perceptions of the entrepreneurship environment in order to increase entrepreneurial behaviour.
Therefore the findings did not full support hypothesis H1.
The second purpose of the research was to determine whether human and social capital had a
significant positive effect on entrepreneurial behaviour. This was represented by Hypothesis H2.
The study found that human capital had a significant positive effect on entrepreneurial behaviour
and perceptions of entrepreneurial antecedents (work discretion and organisation boundaries).
This meant that individuals with higher education, knowledge, training or skills had a greater
ability to exhibit entrepreneurial behaviours, work autonomously, and utilise organisation
channels for championing innovative ideas. The study also concluded that entrepreneurial
Management Support
CultureWork
Discretion
Entrepreneurial
Intensity

Copyright UCT
72
behaviour could be taught in organisation through human capital development. Thus Hypothesis
H2 was supported from a human capital perspective.
While social capital had a significant positive correlation with entrepreneurial behaviour,
regression analysis showed that the variable did not explain a significant variation in
entrepreneurial behaviour. This means that while social capital has a positive effect on
entrepreneurial behaviour, the strength of this relationship not critical. Therefore, the findings
from social capital perspective did not support Hypothesis H2. Overall, the findings of the study
did not fully support hypothesis H2.
The study also concluded that department or functional area did not affect entrepreneurial
perspectives in the organisation. The study went further to analyse the construct validity of the
CEAI which was used to measure organisation architecture. The study found that an exploratory
factor analysis of the CEAI demonstrated more factors than identified in the original CEAI
construct. The additional factors discovered were: performance management, management
experience/leadership, job design, work practices, bureaucracy, workload, decentralised
authority, change acceptance, and strategic thinking. The study therefore supported suggestions
from previous studies that geography and culture have an effect on the construct validity of the
CEAI.
4.5 IMPLICATIONS OF THE STUDY
Firstly, the study showed that more positive perceptions of the entrepreneurial environment by
managers may not necessarily lead to higher entrepreneurial behaviour among this group. The
implication of this finding is that organisations must go further than simply establishing an
entrepreneurial environment but also identify mechanisms through which the improved
environment will lead to increased entrepreneurial behaviour. Secondly, this study demonstrated
that entrepreneurial behaviour can be taught in organisations and this calls on enhancing human
capital management practices on the part of practitioners. Thirdly, the difference in the construct
validity of the CEAI in this study supports calls for the refinement of the instrument for
increased applicability to various organisation contexts. Finally, the managers at the case
organisation need to focus on rectifying management support, and human capital factors in order
to further increase entrepreneurial behaviour.

Copyright UCT
73
4.6 FUTURE RESEARCH DIRECTIONS
Further research in organisation entrepreneurship in the context of Malawi could be carried out
in terms of validating the CEAI. There is a need to for further construct validity of the factors
affecting entrepreneurial behaviour in Malawian firms. In addition to this, further studies could
explore the contextual differences in entrepreneurial perspectives between firms in different
industries. This would help determine the relevance, importance and intensity of entrepreneurial
strategies across industries in this emerging market. Work experience is also another variable
that could be explored in terms of entrepreneurial perspectives. Experience could be considered
both in terms of age and years of service in an organisation. This would assist in ascertaining
whether human resource practices in terms of recruitment and retention of staff could have an
impact on entrepreneurial perspectives and behaviour in the organisation.

Copyright UCT
74
5 REFERENCES
Audretsch, D. B., & Kuratko, D. F. (2009). Strategic Entrepreneurship : Exploring Different
Perspectives of an Emerging Concept. Entrepreneurship Theory and Practice, (812), 1–18.
Chang, H.-J., & Wang, H.-B. (2013). A Case Study on the Model of Strategic Entrepreneurship.
The International Journal of Organisational Innovation, 5(4), 30–44.
Corbett, A., Covin, J. G., O’Connor, G. C., & Tucci, C. L. (2013). Corporate Entrepreneurship:
State-of-the-Art Research and a Future Research Agenda. Journal of Product Innovation
Management, 30(5), 812–820. doi:10.1111/jpim.12031
Cramer, D. (2003). Advanced Quantitative Data Analysis. (A. Bryman, Ed.) (pp. 13–28).
Maidenhead: Open University Press.
Davis, T. M. (2006). Corporate Entrepreneurship Assessment Instrument (CEAI): Systematic
Validation of a Measure.
De Carolis, D. M., & Saparito, P. (2006). Social Capital, Cognition, and Entrepreneurial
Opportunities : A Theoretical Framework. Entrepreneurship Theory and Practice, 41–56.
De Jong, J. P. J., Parker, S. K., Wennekers, S., & Wu, C. (2011). Corporate Entrepreneurship at
the Individual Level : Measurement and De terminants. EIM Research Reports (pp. 1–27).
Dess, G. G., Ireland, R. D., Zahra, S. A., Floyd, S. W., Janney, J. J., Lane, P. J., & Road, F.
(2003). Emerging issues in corporate entrepreneurship. Journal of Management, 29(351).
doi:10.1016/S0149-2063
Goodale, J. C., Kuratko, D. F., Hornsby, J. S., & Covin, J. G. (2011). Operations management
and corporate entrepreneurship : The moderating effect of operations control on the
antecedents of corporate entrepreneurial activity in relation to innovation performance.
Journal of Operations Management, 29(1-2), 116–127. doi:10.1016/j.jom.2010.07.005
Hayton, J. C. (2005). Promoting corporate entrepreneurship through human resource
management practices : A review of empirical research. Human Resource Management
Review, 15, 21–41. doi:10.1016/j.hrmr.2005.01.003
Heinonen, J., & Toivonen, J. (2008). Corporate entrepreneurs or silent followers? Leadership &
Organization Development Journal, 29(7), 583–599. doi:10.1108/01437730810906335
Hitt, M. A., & Duane, R. (2002). The Essence of Strategic Leadership: Managing Human and
Social Capital. Journal of Leadership & Organizational Studies, 9(1), 3–14.
doi:10.1177/107179190200900101
Copyright UCT
75
Hitt, M. A., Ireland, D. R., Camp, M. S., & Sexton, D. L. (2001). Strategic entrepreneurship:
entrepreneurial strategies for wealth creation. Strategic Management Journal, 22(6-7), 479–
491. doi:10.1002/smj.196
Hitt, M., Ireland, D., Sirmon, D., & Trahms, C. (2011). Strategic Entrepreneurship : Creating
Value for Individuals, Organisations and Society. Academy of Management Perspectives,
57–76.
Hornsby, J. S., Kuratko, D. F., & Zahra, S. A. (2002). Middle managers ’ perception of the
internal environment for corporate entrepreneurship : assessing a measurement scale.
Journal of Business Venturing, 17, 253–273.
Ireland, R. D., Covin, J. G., & Kuratko, D. F. (2009). Conceptualising Corporate
Entrepreneurship Strategy. Entrepreneurship Theory and Practice, (979), 19–47.
Ireland, R. D., Hitt, M. A., & Sirmon, D. G. (2003). A Model of Strategic Entrepreneurship : The
Construct and its Dimensions. Journal of Management, 29(963). doi:10.1016/S0149-2063
Ireland, R. D., & Webb, J. W. (2007). Strategic entrepreneurship : Creating competitive
advantage through streams of innovation. Business Horizons, 50, 49–50.
doi:10.1016/j.bushor.2006.06.002
Ireland, R. D., & Webb, J. W. (2009). Crossing the great divide of strategic entrepreneurship:
Transitioning between exploration and exploitation. Business Horizons, 52(5), 469–479.
doi:10.1016/j.bushor.2009.05.002
Kansikas, J., Laakkonen, A., & Sarpo, V. (2012). Entrepreneurial leadership and familiness as
resources for strategic entrepreneurship. International Journal of Entrepreneurial
Behaviour & Research, 18(2), 141–158. doi:10.1108/13552551211204193
Ketchen, D. J., Ireland, R. D., & Snow, C. C. (2008). Strategic Entrepreneurship, Collaborative
Innovation, and Wealth Creation. Strategic Entrepreneurship Journal, 385(1), 371–385.
doi:10.1002/sej
Kollmann, T., & Stockmann, C. (2008). Corporate Entrepreneurship - .pdf. In Corporate
entrepreneurship. 21st century management: A reference handbook (pp. 11–21). Retrieved
from http://www.ebusiness-lehrstuhl.de/download_free/20080604-21stCentury.pdf
Kraus, S., Reschke, C. H., & Kauranen, I. (2011). Identification of domains for a new conceptual
model of strategic entrepreneurship using the configuration approach. Management
Research Review, 34(1), 58–74. doi:10.1108/01409171111096478
Kuratko, D. F., Hornsby, J. S., & Covin, J. G. (2014). Diagnosing a firm’s internal environment
for corporate entrepreneurship. Business Horizons, 57(1), 37–47.
doi:10.1016/j.bushor.2013.08.009

Copyright UCT
76
Kyrgidou, L. P., & Hughes, M. (2010). Strategic entrepreneurship: origins, core elements and
research directions. European Business Review, 22(1), 43–63.
doi:10.1108/09555341011009007
Lancaster, G. (2005). esearch Methods in Management: A concise introduction to research in
management and business consultancy. Oxford: Elsevier Butterworth-Heinemann.
Lerner, M., Azulay, I., & Tishler, A. (2009). The Role of Compensation Methods in Corporate
Entrepreneurship. International Studies of Management and Organization, 39(3), 53–81.
doi:10.2753/IMO0020-8825390303
Liu, H., Jiang, X., Zhang, J., & Zhao, X. (2012). Strategie Flexibility and International Venturing
by Emerging Market Firms : The Moderating Effects of. Journal of International
Marketing, 79–99.
Locke, K. (2001). Grounded Theory i n Management Research. London: Sage Publications.
Luke, B., Kearins, K., & Verreynne, M.-L. (2011). Developing a conceptual framework of
strategic entrepreneurship. International Journal of Entrepreneurial Behavior & Research,
17(3), 314–337. doi:10.1108/13552551111130736
Marczyk, G., DeMatteo, D., & Festinger, D. (2005). Essentials of Research Design and
Methodology. New Jersey: John Wiley & Sons Inc.
Mayers, A. (2013). Multivariate Analysis. In Introduction to Statistics and SPSS in Psychology
(pp. 318 – 361).
Monsen, E., & Boss, R. W. (2009). The Impact of Strategy Entrepreneurship Inside the
Organization : Examining Job Stress and Employee Retention. Entrepreneurship Theory
and Practice, 71–105.
Pearce, J. A., Kramer, T. R., & Robbins, K. D. (1997). Effects of Managers’ Entrepreneurial
Behavior on Subordinates. Journal of Business Venturing, (12), 147–160.
Peltola, S. (2012). Can an old firm learn new tricks ? A corporate entrepreneurship approach to
organizational renewal. Business Horizons, 55(1), 43–51. doi:10.1016/j.bushor.2011.09.002
Phan, P. H., Wright, M., Ucbasaran, D., & Tan, W.-L. (2009). Corporate entrepreneurship:
Current research and future directions. Journal of Business Venturing, 24(3), 197–205.
doi:10.1016/j.jbusvent.2009.01.007
Ray, S., Ramachandran, K., & Devarajan, T. (2006). Corporate Entrepreneurship: How? Vikalpa,
31(1), 85–98.
Van Wyk, R., & Adonisi, M. (2011). An eight-factor solution for the Corporate Entrepreneurship
Assessment Instrument. African Journal of Business Management, 5(8), 3047–3055.

Copyright UCT
77
Villiers-Scheepers, M. J. De. (2012). Antecedents of strategic corporate entrepreneurship.
European Business Review, 24(5), 400–424. doi:10.1108/09555341211254508
Williams, B., & Brown, T. (2012). Exploratory factor analysis : A five-step guide for novices.
Australasian Journal of Paramedicine, 8(3), 1–13.
Winter, J. C. F. De, Dodou, D., & Wieringa, P. A. (2009). Exploratory Factor Analysis With
Small Sample Sizes. Multivariate Behavioral Research, 44(2), 147 – 181.
doi:10.1080/00273170902794206
Wyk, R. Van, & Adonisi, M. (2012). Antecedents of corporate entrepreneurship, 43(3), 65–79.
Yin, R. K. (2011). Qualitative Research From Start to Finish. New York: The Guilford Press.

Copyright UCT
78
6 APPENDICES
6.1 APPENDIX 1: SURVEY QUESTIONS / QUESTIONNAIRE
THE UNIVERSTIY OF CAPETOWN GRADUATE SCHOOL OF BUSINESS
QUESTIONNAIRE
RESEARCH TOPIC: ENTREPRENEURIAL PERSPECTIVES AND BEHAVIOUR
Research Aim: Analyse the strategic entrepreneirship’s organisation architecture theory in
case study in an emerging market with specific focus on entprenerpeurial
perspectives, behaviors, social capital and human capital.
CONSENT PAGE
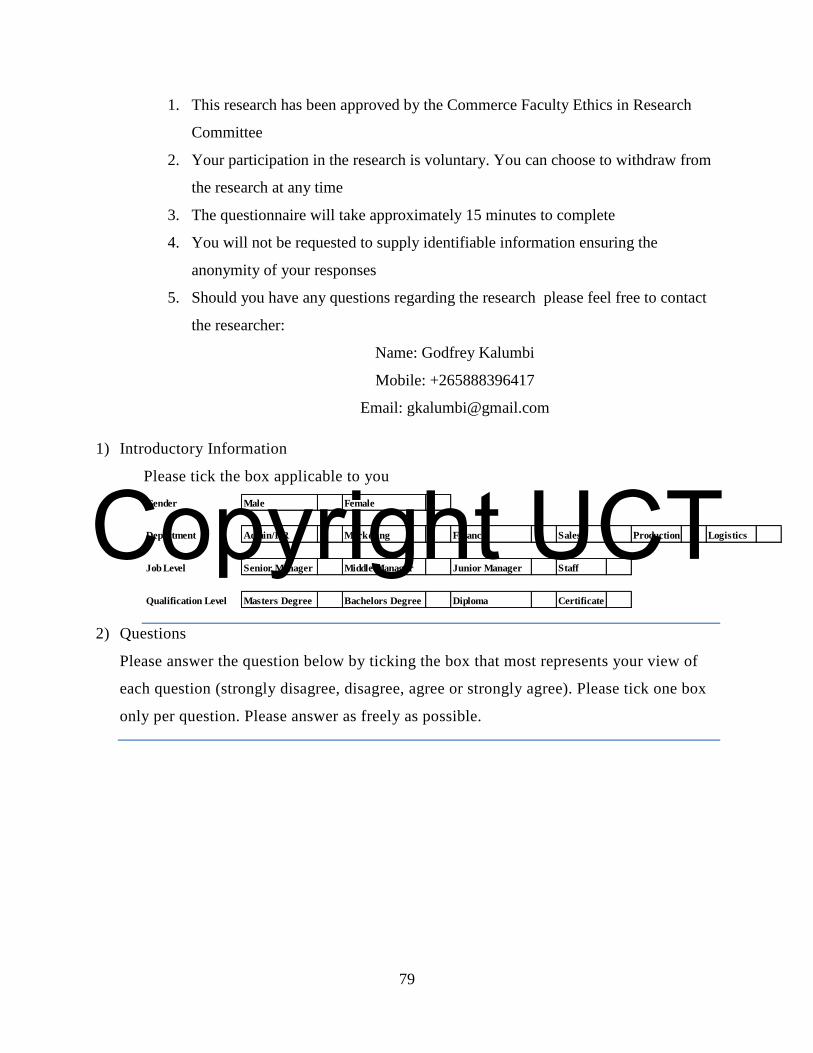
Copyright UCT
79
1. This research has been approved by the Commerce Faculty Ethics in Research
Committee
2. Your participation in the research is voluntary. You can choose to withdraw from
the research at any time
3. The questionnaire will take approximately 15 minutes to complete
4. You will not be requested to supply identifiable information ensuring the
anonymity of your responses
5. Should you have any questions regarding the research please feel free to contact
the researcher:
Name: Godfrey Kalumbi
Mobile: +265888396417
Email: [email protected]
1) Introductory Information
Please tick the box applicable to you
2) Questions
Please answer the question below by ticking the box that most represents your view of
each question (strongly disagree, disagree, agree or strongly agree). Please tick one box
only per question. Please answer as freely as possible.
Gender Male Female
Department Admin/HR Marketing Finance Sales Production Logistics
Job Level Senior Manager Middle Manager Junior Manager Staff
Qualification Level Masters Degree Bachelors Degree Diploma Certificate

Copyright UCT
Question
Strongly
Disagree
Disagree Agree Strongly
Agree
My organization is quick to use improved work methods
My organization is quick to use improved work methods that are developed by workers.
In my organization, developing one’s own ideas is encouraged for the improvement of the
corporation.
Upper management is aware and very receptive to my ideas and suggestions.
Promotion usually follows the development of new and innovative ideas.
Those employees who come up with innovative ideas on their own often receive management
encouragement for their activities.
The ‘‘doers’’ are allowed to make decisions on projects without going through elaborate
justification and approval procedures.
Senior managers encourage innovators to bend rules and rigid procedures in order to keep
promising ideas on track.
Many top managers have been known for their experience with the innovation process.
Money is often available to get new project ideas off the ground.
Individuals with successful innovative projects receive additional reward and compensation
for their ideas and efforts beyond the standard reward system.
There are several options within the organization for individuals to get financial support for
their innovative projects and ideas.
Individual risk takers are often recognized for their willingness to champion new projects,
whether eventually successful or not.
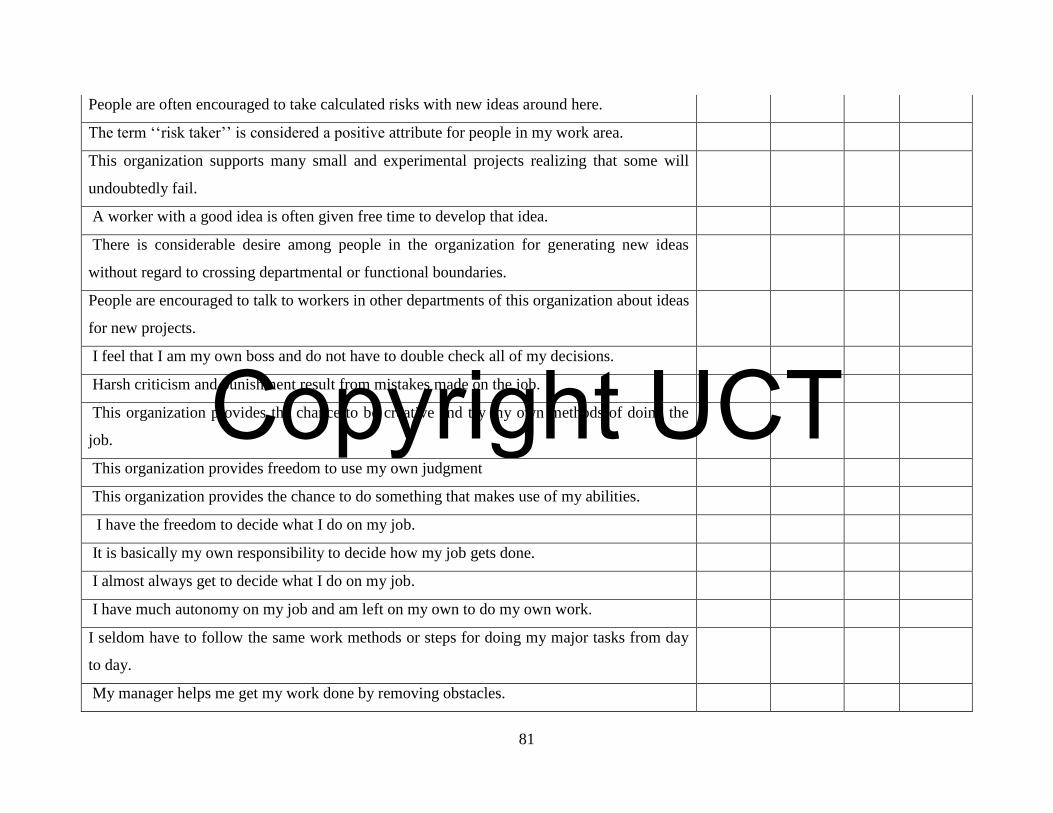
Copyright UCT
81
People are often encouraged to take calculated risks with new ideas around here.
The term ‘‘risk taker’’ is considered a positive attribute for people in my work area.
This organization supports many small and experimental projects realizing that some will
undoubtedly fail.
A worker with a good idea is often given free time to develop that idea.
There is considerable desire among people in the organization for generating new ideas
without regard to crossing departmental or functional boundaries.
People are encouraged to talk to workers in other departments of this organization about ideas
for new projects.
I feel that I am my own boss and do not have to double check all of my decisions.
Harsh criticism and punishment result from mistakes made on the job.
This organization provides the chance to be creative and try my own methods of doing the
job.
This organization provides freedom to use my own judgment
This organization provides the chance to do something that makes use of my abilities.
I have the freedom to decide what I do on my job.
It is basically my own responsibility to decide how my job gets done.
I almost always get to decide what I do on my job.
I have much autonomy on my job and am left on my own to do my own work.
I seldom have to follow the same work methods or steps for doing my major tasks from day
to day.
My manager helps me get my work done by removing obstacles.

Copyright UCT
82
The rewards I receive are dependent upon my work on the job.
My supervisor will increase my job responsibilities if I am performing well in my job.
My supervisor will give me special recognition if my work performance is especially good.
My manager would tell his boss if my work was outstanding. 6. There is a lot of challenge in
my job.
During the past three months, my work load was too heavy to spend time on developing new
ideas.
I always seem to have plenty of time to get everything done
I have just the right amount of time and work load to do everything well.
My job is structured so that I have very little time to think about wider organizational
problems.
I feel that I am always working with time constraints on my job.
My co-workers and I always find time for long-term problem solving.
In the past three months, I have always followed standard operating procedures or practices
to do my major tasks.
There are many written rules and procedures that exist for doing my major tasks.
On my job I have no doubt of what is expected of me.
There is little uncertainty in my job.
During the past year, my immediate supervisor discussed my work performance with me
frequently.
My job description clearly specifies the standards of performance on which my job is
evaluated.

Copyright UCT
83
I clearly know what level of work performance is expected from me in terms of amount,
quality, and timeliness of output
Individuals have the flexibility to generate creative ideas
There are opportunities to search out new techniques, technologies and or product ideas
We have the opportunity to promote and champion ideas to others
Individuals have the ability to identify long term opportunities and threats for the company
People in this organisation are known as a successful issue sellers
Most individuals put effort in pursuing new business opportunities
We all takes risks in our jobs from time to time
There is a feeling of emotional commitment to the organisation amongst employees
Everyone is encouraged to pay relentless attention to detail, structure and process
We are committed to winning each other’s respect
There is an emphasis on excellence and high standards in the organization
We have a strong set of values that bring everyone together in the organization
Individuals actively interact with others across the whole firm
There is a strong level of trust with the organisation and between individuals
3) Opinion
Do you know of anything in your organisation that would help you and your colleagues to become better corporate
entrepreneurs?

Copyright UCT
84
____________________________________________________________________________________________________
____________________________________________________________________________________________________
____________________________________________________________________________________________________
____________________________________________________________________________________________________
____________________________________________________________________________________________________
____________________________________________________________________________________________________
END OF QUESTIONNAIRE
Thank you for completing the survey

Copyright UCT
6.2 APPENDIX 2: CORPORATE ENTREPRENEURSHIP ASSESSMENT
INSTRUMENT
Factor 1: Management support for corporate entrepreneurship
1. My organization is quick to use improved work methods
2. My organization is quick to use improved work methods that are developed by workers.
3. In my organization, developing one’s own ideas is encouraged for the improvement of
the corporation.
4. Upper management is aware and very receptive to my ideas and suggestions.
5. Promotion usually follows the development of new and innovative ideas.
6. Those employees who come up with innovative ideas on their own often receive
management encouragement for their activities.
7. The ‘‘doers’’ are allowed to make decisions on projects without going through elaborate
justification and approval procedures.
8. Senior managers encourage innovators to bend rules and rigid procedures in order to keep
promising ideas on track.
9. Many top managers have been known for their experience with the innovation process.
10. Money is often available to get new project ideas off the ground.
11. Individuals with successful innovative projects receive additional reward and
compensation for their ideas and efforts beyond the standard reward system.
12. There are several options within the organization for individuals to get financial support
for their innovative projects and ideas.
13. Individual risk takers are often recognized for their willingness to champion new
projects, whether eventually successful or not.
14. People are often encouraged to take calculated risks with new ideas around here.
15. The term ‘‘risk taker’’ is considered a positive attribute for people in my work area.
16. This organization supports many small and experimental projects realizing that some will
undoubtedly fail.
17. A worker with a good idea is often given free time to develop that idea.

Copyright UCT
86
18. There is considerable desire among people in the organization for generating new ideas
without regard to crossing departmental or functional boundaries.
19. People are encouraged to talk to workers in other departments of this organization about
ideas for new projects.
Factor 2: Work discretion
1. I feel that I am my own boss and do not have to double check all of my decisions.
2. Harsh criticism and punishment result from mistakes made on the job.
3. This organization provides the chance to be creative and try my own methods of doing
the job.
4. This organization provides freedom to use my own judgment
5. This organization provides the chance to do something that makes use of my abilities.
6. I have the freedom to decide what I do on my job.
7. It is basically my own responsibility to decide how my job gets done.
8. I almost always get to decide what I do on my job.
9. I have much autonomy on my job and am left on my own to do my own work.
10. I seldom have to follow the same work methods or steps for doing my major tasks from
day to day.
Factor 3: Rewards/reinforcement
1. My manager helps me get my work done by removing obstacles.
2. The rewards I receive are dependent upon my work on the job.
3. My supervisor will increase my job responsibilities if I am performing well in my job.
4. My supervisor will give me special recognition if my work performance is especially
good.
5. My manager would tell his boss if my work was outstanding. 6. There is a lot of
challenge in my job.
Factor 4: Time availability
1. During the past three months, my work load was too heavy to spend time on developing
new ideas.

Copyright UCT
87
2. I always seem to have plenty of time to get everything done
3. I have just the right amount of time and work load to do everything well.
4. My job is structured so that I have very little time to think about wider organizational
problems.
5. I feel that I am always working with time constraints on my job. 6. My co-workers and I
always find time for long-term problem solving.
Factor 5: Organizational boundaries
1. In the past three months, I have always followed standard operating procedures or
practices to do my major tasks.
2. There are many written rules and procedures that exist for doing my major tasks.
3. On my job I have no doubt of what is expected of me.
4. There is little uncertainty in my job.
5. During the past year, my immediate supervisor discussed my work performance with me
frequently.
6. My job description clearly specifies the standards of performance on which my job is
evaluated.
7. I clearly know what level of work performance is expected from me in terms of amount,
quality, and timeliness of output
6.3 APPENDIX 3: INTRAPRENEURSHIP BEHAVIOUR INSTRUMENT
1. Generate creative ideas1
2. Search out new techniques, technologies and or product ideas1
3. Promotes and champions ideas to others1
4. Identifies long term opportunities and threats for the company2
5. Is known as a successful issue seller2
6. Puts effort in pursuing new business opportunities2
7. Takes risks in his/her from time to time job3
Items reflecting: 1 - Innovativeness, 2 - Pro-activeness and 3- Risk-taking.

Copyright UCT
88
6.4 APPENDIX 4: SCORING SCALES
Adapted from Kuratko et al., (2014)
Scale 1: Management Support for Entrepreneurship
Statement
Strongly Disagree
Disagree Agree Strongly Disagree
1
0
1
2
3 9
0
1
2
3
10
0
1
2
3 18
0
1
2
3
19
0
1
2
3 25
0
1
2
3
26
0
1
2
3 27
0
1
2
3
32
0
1
2
3 33
0
1
2
3
34
0
1
2
3 38
0
1
2
3
39
0
1
2
3 40
0
1
2
3
47
0
1
2
3 48
0
1
2
3
Total Score
Scale 1
49
0
1
2
3 58
0
1
2
3
59
0
1
2
3
Sub-totals
+ + + =
Scale Score = Total Score divided by (19)
Scale 2: Work Discretion
Statement
Strongly Disagree
Disagree Agree Strongly Disagree
2
0
1
2
3 *11
0 = 3
1 = 2
2 = 1
3 = 0
20
0
1
2
3 28
0
1
2
3
35
0
1
2
3 36
0
1
2
3

Copyright UCT
89
41
0
1
2
3 50
0
1
2
3
Total Score
Scale 2
51
0
1
2
3 60
0
1
2
3
Sub-totals
+ + + =
Scale Score = Total Score divided by (10)
* Item 11 revised score
Scale 3: Rewards
Statement
Strongly Disagree
Disagree Agree Strongly Disagree
3
0
1
2
3 12
0
1
2
3
21
0
1
2
3 42
0
1
2
3
Total Score
Scale 3
52
0
1
2
3 62
0
1
2
3
Sub-totals
+ + + =
Scale Score = Total Score divided by (6)
Scale 4: Time Availability
Statement
Strongly Disagree
Disagree Agree Strongly Disagree
*4
0 = 3
1 = 2
2 = 1
3 = 0 13
0
1
2
3
22
0
1
2
3 *29
0 = 3
1 = 2
2 = 1
3 = 0
Total Score
Scale 4
*43
0 = 3
1 = 2
2 = 1
3 = 0 53
0
1
2
3
Sub-totals
+ + + =

Copyright UCT
90
Scale Score = Total Score divided by (6)
* Item 4, 29 & 43 revised score
Scale 5: Organisation Boundaries
Statement
Strongly Disagree
Disagree Agree Strongly Disagree
*5
0 = 3
1 = 2
2 = 1
3 = 0 *14
0 = 3
1 = 2
2 = 1
3 = 0
*23
0 = 3
1 = 2
2 = 1
3 = 0 *30
0 = 3
1 = 2
2 = 1
3 = 0
Total Score
Scale 4
37
0
1
2
3 *44
0 = 3
1 = 2
2 = 1
3 = 0
*54
0 = 3
1 = 2
2 = 1
3 = 0 61
0
1
2
3
Sub-totals
+ + + =
Scale Score = Total Score divided by (8)
* Item 5,14,23,30,44 & 54 revised score
Scale 6: Entrepreneurial Behaviour
Statement
Strongly Disagree
Disagree Agree Strongly Disagree
6
0
1
2
3 15
0
1
2
3
24
0
1
2
3 31
0
1
2
3
Total Score
Scale 6
45
0
1
2
3 55
0
1
2
3
Sub-totals
+ + + =
Scale Score = Total Score divided by (6)

Copyright UCT
91
Scale 7: Entrepreneurial Behaviour
Statement
Strongly Disagree
Disagree Agree Strongly Disagree
7
0
1
2
3 16
0
1
2
3
Total Score
Scale 7
46
0
1
2
3 56
0
1
2
3
Sub-totals
+ + + =
Scale Score = Total Score divided by (4)
Scale 8: Social Capital
Statement
Strongly Disagree
Disagree Agree Strongly Disagree
8
0
1
2
3
Total Score
Scale 8
17
0
1
2
3 57
0
1
2
3
Sub-totals
+ + + =
Scale Score = Total Score divided by (3)