entrepreneurs and smes in driving the recovery the role of entrepreneurs and smes in driving the...
TRANSCRIPT

The role of entrepreneurs
and SMEs in driving the recovery
CAMPAIGN SPONSOR

2 The role of entrepreneurs and SMEs in driving the recovery
Contents
Contents
Introduction 3
How attractive is the UK as a place to do business? 5
The impact of the recent recession 8
How do entrepreneurs and SMEs affect long-term growth? 11
Summary 17
References and sources 18

3 The role of entrepreneurs and SMEs in driving the recovery
Introduction
Introduction
The UK economy has not performed strongly since exiting recession at the end of 2009. In the past, recessions have often been followed by periods of relatively strong growth, as the economy to some degree ‘makes up for lost time’. But, at the end of March 2011, UK GDP was still around 4% below its pre-recession peak at the start of 2008 (Figure 1). In contrast, US GDP has already regained all the ground it lost, and national income in the euro area as a whole was around 2% below its pre-recession peak (although that headline figure masks significant divergences within the euro area).
Unfortunately, the relatively weak recovery coincides with a prolonged period of fiscal tightening. While the UK came into recession with a modest structural deficit in the public finances, most of the 12% deficit that opened up during the downturn reflected the public sector supporting the overall level of activity as the private sector retreated, rather than the public spending actively crowding out private growth. As the deficit is necessarily cut in the years ahead, and at an increasing pace from this financial year, that support to the level of economic activity will be withdrawn (Figure 2). A key question is therefore whether the private sector will be able and willing to pick up the baton of growth and help achieve the required rebalancing of the economy that policymakers desperately want. A particular concern here relates to the labour market, where private sector job creation in the past decade has not been particularly pronounced (Figure 3).
102
101
100
99
98
97
96
95
94
93
92
Indi
ces,
200
8 Q
1 =
100
2006 Q1 2007 Q1 2008 Q1
US
Euro area
UK
2009 Q1 2010 Q1 2011 Q1
Figure 1: GDP indices
Source: Bloomberg and BVCA
Figure 2: UK deficit forecast
Source: OBR
12
10
8
6
4
2
0
% o
f G
DP
2011 2012 2013
Government deficit
Fiscal tightening
2014 2015 2016

4 The role of entrepreneurs and SMEs in driving the recovery
Introduction
A central plank of the Government’s strategy has been to encourage new businesses and start-ups to fill the void left by the public spending cuts, and for small and medium-sized enterprises (SMEs) more generally to boost activity and jobs. Venture capital (VC) has an important role to play here, which was reflected in the changes to Venture Capital Trusts (VCTs) and the Enterprise Investment Scheme (EIS) that were announced in the 2011 Budget. Against this backdrop, this article examines the role that entrepreneurs and SMEs can play in the recovery. First, we examine how attractive the UK is as a place to do business, on the basis of global comparisons, before looking at how the recent recession has affected entrepreneurial attitudes. Following this, we then examine the role of SMEs and entrepreneurs in generating increases in national income over the long term, and the particular role that they can play.
130
125
120
115
110
105
100
95
90
Indi
ces,
200
0 Q
1 =
100
2000 2001 2002 2003 2004 2005 2006 2007 2008 2009 2010 2011
Public sector
Private sector
Figure 3: Estimates of workforce jobs
Source: ONS and BVCA

5 The role of entrepreneurs and SMEs in driving the recovery
How attractive is the UK as a place to do business?
How attractive is the UK as a place to do business?
As the sixth largest economy in the world, the UK clearly has an important role to play. Yet at the same time, its small size overall – the UK accounts for less than 4% of world GDP – means that it is rarely the driver of global trends in trade or investor sentiment, but instead is subject to them: the UK is often characterised as a small, open economy. As such, the most appropriate way to assess the attractiveness of the UK as a destination to do business is to compare it against other advanced or developing economies.
There are a number of institutes and organisations that are active in this area, compiling statistics and rankings across a broad range of economies. For brevity, we will report only a sub-sample of these indicators here, which are broadly representative of our wider research in this area.
A first point to note is that the UK’s underlying economic framework is very strong. Figure 4 shows framework conditions and entrepreneurship from a pre-crisis study by the National Agency for Enterprise and Construction (NAEC) in Denmark. Framework conditions are measured here in terms of market demand, the supply of capital and skills, and working culture and incentives. On this basis, the UK is second only to the US. At the same time, entrepreneurial activity – measured here on the basis of revenue and employment growth for new businesses – is perhaps not as robust as the UK’s strong framework would imply. However, across all the countries in the sample the relationship is not especially strong, with an R2 of 0.22.1
1 An R2 measures the closeness of fit in a relationship between two series, with 1 representing perfect fit, and 0 indicating no statistical relationship.
Figure 4: Framework conditions and entrepreneurial activity
Source: NAEC (2006)
100
90
80
70
60
50
40
30
20
10
0
0
10 20 30 40 50 60 70 80 90
100
Framework Conditions
Entr
epre
neu
rial
Act
ivit
y
Greece
ItalyBelgium
NorwayFrance
Germany
Switzerland
Denmark
NetherlandsAustria
Spain
Finland
UK
USA
Korea
Ireland
SwedenPortugal

6 The role of entrepreneurs and SMEs in driving the recovery
How attractive is the UK as a place to do business?
If we examine alternative measures, a similar picture emerges. Figure 5 reports measures of economic freedom from The Heritage Foundation, which looks at business freedom alongside trade, fiscal and monetary conditions. Figure 6, meanwhile, reports a measure of global competitiveness from the World Economic Forum (WEF). This index is broader, looking at health and education, infrastructure, and technological readiness, among other factors. In both instances the UK performs strongly.
Figure 5: Economic freedom in selected countries
Source: The Heritage Foundation
85
80
75
70
65
60
55
50
Indi
ces,
100
= c
ompl
etel
y fr
ee
200019991998199719961995 2001 2002 2003 2004 2005 2006 2007 2008 2009 2010 2011
USUKJapanGermanyFranceChina
Figure 6: Global competitiveness indices (GCIs)
Source: WEF
Country GCI 2010 GCI 2009
Rank Score Rank
US 4 5.43 2
Germany 5 5.39 7
Japan 6 5.37 8
Canada 10 5.30 9
UK 12 5.25 13
France 15 5.13 16
China 27 4.84 29
Italy 48 4.37 48
India 51 4.33 49
Brazil 58 4.28 56
Russia 63 4.24 63
7 The role of entrepreneurs and SMEs in driving the recovery
How attractive is the UK as a place to do business?
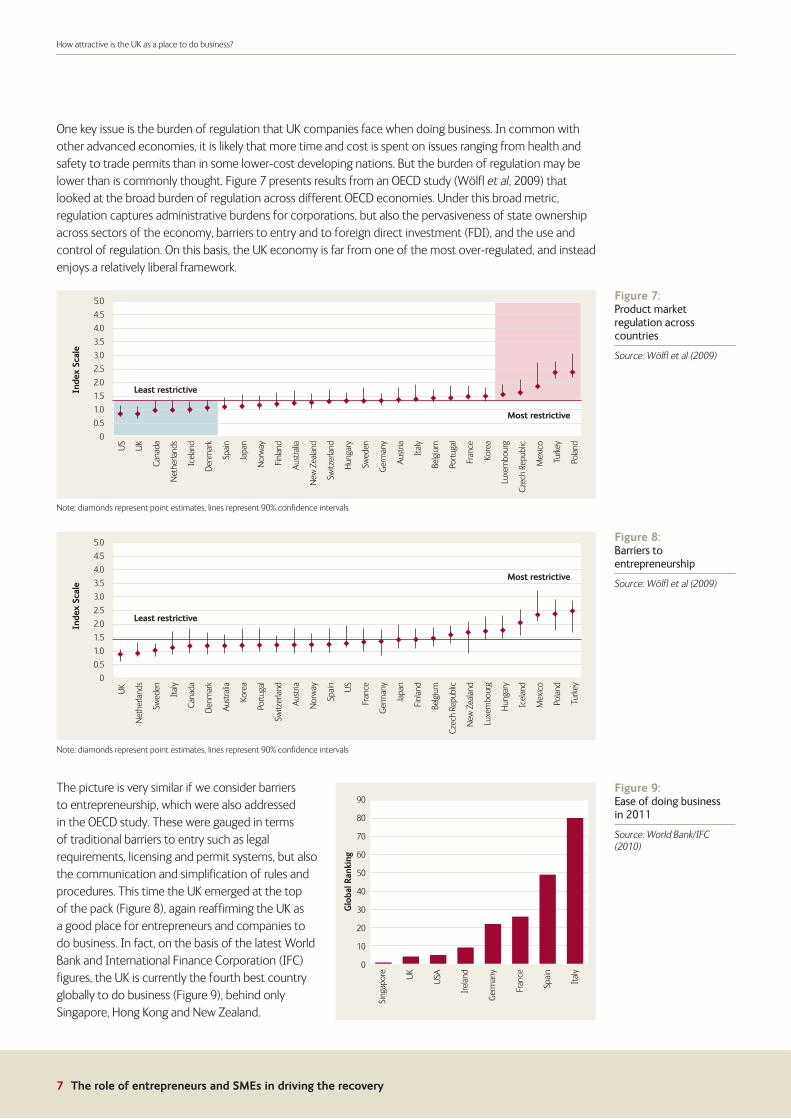
One key issue is the burden of regulation that UK companies face when doing business. In common with other advanced economies, it is likely that more time and cost is spent on issues ranging from health and safety to trade permits than in some lower-cost developing nations. But the burden of regulation may be lower than is commonly thought. Figure 7 presents results from an OECD study (Wölfl et al, 2009) that looked at the broad burden of regulation across different OECD economies. Under this broad metric, regulation captures administrative burdens for corporations, but also the pervasiveness of state ownership across sectors of the economy, barriers to entry and to foreign direct investment (FDI), and the use and control of regulation. On this basis, the UK economy is far from one of the most over-regulated, and instead enjoys a relatively liberal framework.
Note: diamonds represent point estimates, lines represent 90% confidence intervals
Note: diamonds represent point estimates, lines represent 90% confidence intervals
The picture is very similar if we consider barriers to entrepreneurship, which were also addressed in the OECD study. These were gauged in terms of traditional barriers to entry such as legal requirements, licensing and permit systems, but also the communication and simplification of rules and procedures. This time the UK emerged at the top of the pack (Figure 8), again reaffirming the UK as a good place for entrepreneurs and companies to do business. In fact, on the basis of the latest World Bank and International Finance Corporation (IFC) figures, the UK is currently the fourth best country globally to do business (Figure 9), behind only Singapore, Hong Kong and New Zealand.
Figure 7: Product market regulation across countries
Source: Wölfl et al (2009)
5.0
4.5
4.0
3.5
3.0
2.5
2.0
1.5
1.0
0.5
0
Inde
x Sc
ale
US
UK
Cana
da
Net
herla
nds
Icel
and
Den
mar
k
Spai
n
Japa
n
Nor
way
Finl
and
Aus
tral
ia
New
Zea
land
Switz
erla
nd
Hun
gary
Swed
en
Ger
man
y
Aus
tria
Ital
y
Belg
ium
Port
ugal
Fran
ce
Kore
a
Luxe
mbo
urg
Czec
h Re
publ
ic
Mex
ico
Turk
ey
Pola
nd
Least restrictive
Most restrictive
Figure 8: Barriers to entrepreneurship
Source: Wölfl et al (2009)
5.0
4.5
4.0
3.5
3.0
2.5
2.0
1.5
1.0
0.5
0
Inde
x Sc
ale
UK
Net
herla
nds
Swed
en
Ital
y
Cana
da
Den
mar
k
Aus
tral
ia
Kore
a
Port
ugal
Switz
erla
nd
Aus
tria
Nor
way
Spai
n
US
Fran
ce
Ger
man
y
Japa
n
Finl
and
Belg
ium
Czec
h Re
publ
ic
New
Zea
land
Luxe
mbo
urg
Hun
gary
Icel
and
Mex
ico
Pola
nd
Turk
ey
Least restrictive
Most restrictive
Figure 9: Ease of doing business in 2011
Source: World Bank/IFC (2010)
90
80
70
60
50
40
30
20
10
0
Glo
bal R
anki
ng
Sing
apor
e
UK
USA
Irel
and
Ger
man
y
Fran
ce
Spai
n
Ital
y

8 The role of entrepreneurs and SMEs in driving the recovery
The impact of the recent recession
The impact of the recent recession
The data highlighted above clearly confirm the UK’s attractiveness as a business destination. However, entrepreneurial attitudes are perhaps not as pronounced as the economic framework would merit (consistent with the earlier evidence from NAEC).
Figure 10 shows survey results on attitudes to entrepreneurship from the Global Entrepreneurship Monitor (GEM). While UK respondents are relatively bullish about their ability to set up a business, and not overly worried about the possibility of failure (though still more cautious than US respondents), it is striking that only around a quarter of people think that there are good opportunities for start-ups where they live. Figure 11 plots UK responses over time: the impact of the recession is clearly visible, with fewer people believing there are good opportunities in their area than in 2007.
Figure 11: UK attitudes to entrepreneurship
Source: Hart & Levie (2010)
50
45
40
35
30
25
20
15
% A
gree
ing
wit
h st
atem
ent
2002 2003 2004 2005 2006 2007 2008 2009 2010
I have the skills,knowledge andexperience tostart a business
Fear of failure wouldprevent me startinga business (if therewere opportunities)
I know someonewho has started abusiness in thelast 2 years
There are goodstart-up opportunitieswhere I live inthe next 6 months
Figure 10: Global attitudes to entrepreneurship
Source: Hart & Levie (2010)
% Agreeing with statement
I know someone who has started a business in the last 2 years
There are good start-up opportunities where I live in the next 6 months
I have the skills, knowledge, and experience to start a business
Fear of failure would prevent me starting a business (for those who agree there are good start-up opportunities)
UK 31.1 26.8 47.2 36.0
France 45.6 31.9 33.8 43.2
Germany 27.9 27.0 36.6 38.6
Italy 29.9 24.6 39.4 39.1
Japan 14.0 5.0 9.4 37.7
USA 24.9 32.3 54.0 31.7
G7 Average 28.9 24.6 36.7 37.7
9 The role of entrepreneurs and SMEs in driving the recovery
The impact of the recent recession
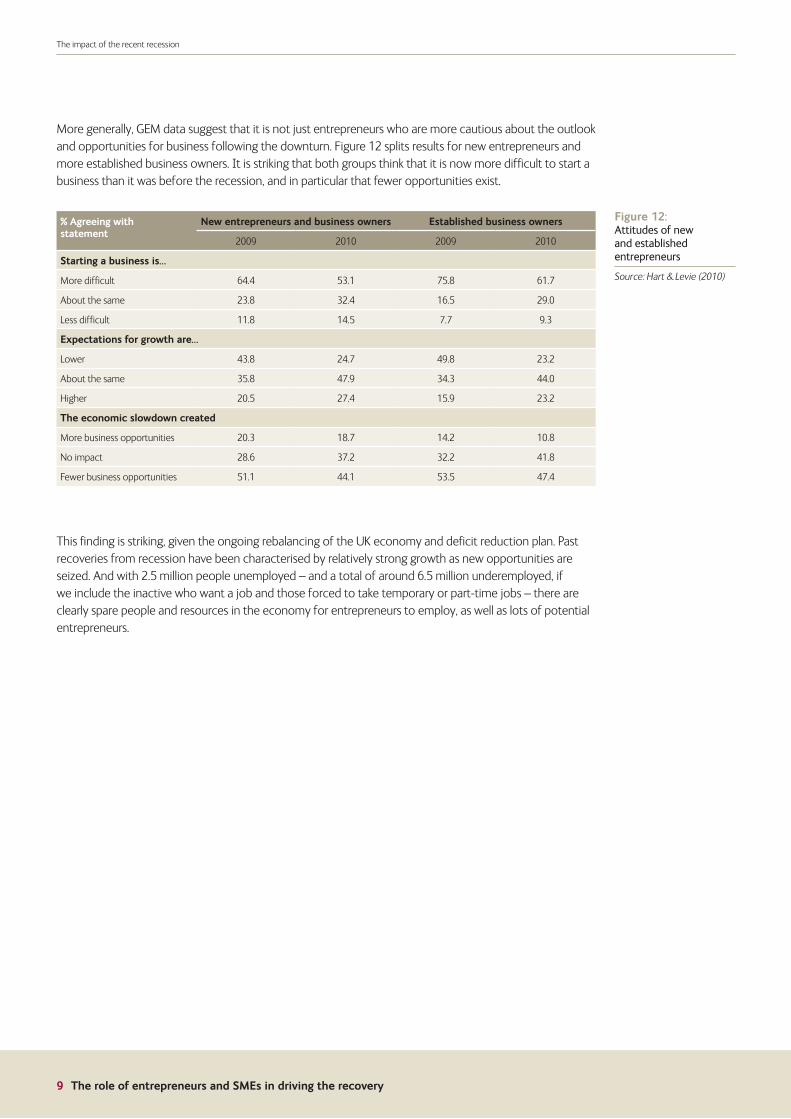
More generally, GEM data suggest that it is not just entrepreneurs who are more cautious about the outlook and opportunities for business following the downturn. Figure 12 splits results for new entrepreneurs and more established business owners. It is striking that both groups think that it is now more difficult to start a business than it was before the recession, and in particular that fewer opportunities exist.
This finding is striking, given the ongoing rebalancing of the UK economy and deficit reduction plan. Past recoveries from recession have been characterised by relatively strong growth as new opportunities are seized. And with 2.5 million people unemployed – and a total of around 6.5 million underemployed, if we include the inactive who want a job and those forced to take temporary or part-time jobs – there are clearly spare people and resources in the economy for entrepreneurs to employ, as well as lots of potential entrepreneurs.
Figure 12: Attitudes of new and established entrepreneurs
Source: Hart & Levie (2010)
% Agreeing with statement
New entrepreneurs and business owners Established business owners
2009 2010 2009 2010
Starting a business is…
More difficult 64.4 53.1 75.8 61.7
About the same 23.8 32.4 16.5 29.0
Less difficult 11.8 14.5 7.7 9.3
Expectations for growth are…
Lower 43.8 24.7 49.8 23.2
About the same 35.8 47.9 34.3 44.0
Higher 20.5 27.4 15.9 23.2
The economic slowdown created
More business opportunities 20.3 18.7 14.2 10.8
No impact 28.6 37.2 32.2 41.8
Fewer business opportunities 51.1 44.1 53.5 47.4

10 The role of entrepreneurs and SMEs in driving the recovery
The impact of the recent recession
One factor that is likely to have influenced entrepreneurs’ views is the marked tightening in credit conditions during the recession. The global banking crisis hit the UK especially hard, given the relatively large scale of its banks, with Lloyds and RBS having to fall back on taxpayer support and other institutions having to raise significant funds from external sources. One consequence is that banks have tightened their lending criteria, which is particularly a concern for UK SMEs as they do not have the same access to capital markets as larger companies. This tightening in credit standards has not just been a feature of the UK, however, with European SMEs more generally also facing a higher hurdle than they did before the downturn (Figure 13). And although credit conditions may now have stopped tightening, there is little sign that they are set to ease any time soon, let alone return to pre-crisis levels. At the same time, BVCA members have been committing more capital to established firms that want to expand and develop (so-called ‘growth capital’) rather than earlier stage investments including seed and start-up funding (Figure 14). And despite business angels increasing their provision of funding to new businesses in the most recent data (BBAA, 2011), this has not fully offset the funding shortfalls elsewhere. Entrepreneurs are likely to find it more difficult to find financial backing than they did four or five years ago. This remains a critical issue for policymakers.
Figure 13: Credit standards for SMEs
Source: ECB and BVCA
130
125
120
115
110
105
100
95
90
85
Inde
x, 2
004
= 10
0
2003 2004 2005
SMEs facing tightercredit conditions
2006 2007 2008 2009 2010 2011
Figure 14: Expansion and early stage VC funding
Source: BVCA
3000
2500
2000
1500
1000
500
0
£ m
illio
ns
1985 1990 1993
Expansion
Early stage
2000 2005 2010
11 The role of entrepreneurs and SMEs in driving the recovery
How do entrepreneurs and SMEs affect long-term growth?
How do entrepreneurs and SMEs affect long-term growth?
This analysis suggests that there is a clear risk that a lack of access to finance could stunt the formation and expansion of UK SMEs. In turn, that suggests that the economic recovery would be (even) weaker than it would otherwise have been. Implicitly, this asserts a link between new businesses, SMEs and growth, but that link is rarely discussed in any depth. As such, in this section we will examine the impact of entrepreneurs and SMEs on UK GDP over the long term.
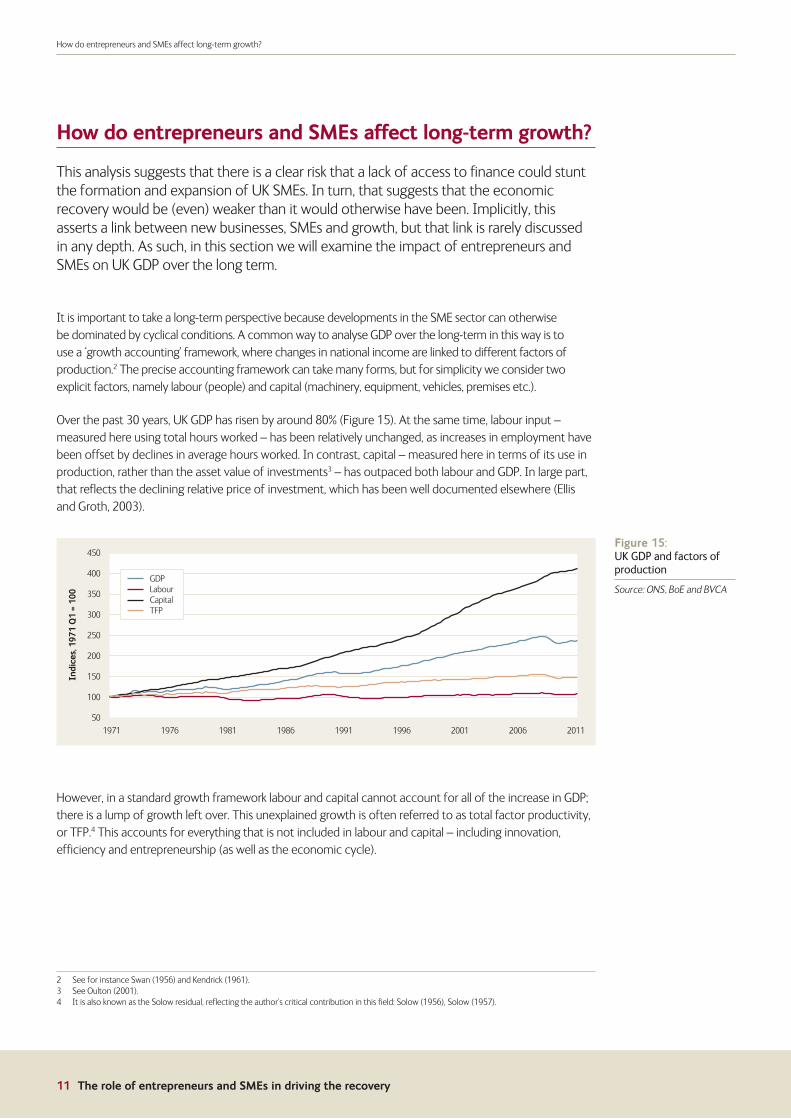
It is important to take a long-term perspective because developments in the SME sector can otherwise be dominated by cyclical conditions. A common way to analyse GDP over the long-term in this way is to use a ‘growth accounting’ framework, where changes in national income are linked to different factors of production.2 The precise accounting framework can take many forms, but for simplicity we consider two explicit factors, namely labour (people) and capital (machinery, equipment, vehicles, premises etc.).
Over the past 30 years, UK GDP has risen by around 80% (Figure 15). At the same time, labour input – measured here using total hours worked – has been relatively unchanged, as increases in employment have been offset by declines in average hours worked. In contrast, capital – measured here in terms of its use in production, rather than the asset value of investments3 – has outpaced both labour and GDP. In large part, that reflects the declining relative price of investment, which has been well documented elsewhere (Ellis and Groth, 2003).
However, in a standard growth framework labour and capital cannot account for all of the increase in GDP; there is a lump of growth left over. This unexplained growth is often referred to as total factor productivity, or TFP.4 This accounts for everything that is not included in labour and capital – including innovation, efficiency and entrepreneurship (as well as the economic cycle).
2 See for instance Swan (1956) and Kendrick (1961).3 See Oulton (2001).4 It is also known as the Solow residual, reflecting the author’s critical contribution in this field: Solow (1956), Solow (1957).
Figure 15: UK GDP and factors of production
Source: ONS, BoE and BVCA
450
400
350
300
250
200
150
100
50
Indi
ces,
197
1 Q
1 =
100
201120062001199619911986198119761971
GDPLabourCapitalTFP

12 The role of entrepreneurs and SMEs in driving the recovery
How do entrepreneurs and SMEs affect long-term growth?
We can examine the likely impact of entrepreneurs and SMEs on each of these factors of production in turn. In terms of capital, small businesses’ investment plans were hit every bit as hard as larger firms’ spending during the recession (Figure 16), suggesting that any recovery in SME investment may also keep pace with larger players. However, in terms of the level of UK business investment, SMEs account for a relatively small share: only 10% of business investment is from firms with less than 50 employees, despite these same firms accounting for around 45% of total employment. Small businesses are simply not very capital intensive in an economic sense,5 and as such it would take a large number of new businesses to have a significant impact on the overall level of business investment and hence capital. We are unlikely to see a significant boost to growth via this channel.
Note: figures in brackets are shares of capital expenditure in 2010
In contrast, various studies have found that SMEs can have a significant impact on employment. One note of caution here is that some reports tend to focus only on one part of the employment distribution, so there is an element of cherry picking. A recent example was a study from NESTA,6 which looked at the relatively small number of companies that had seen strong employment growth during the sample period in question. Essentially, the study focused on the 6% of firms at the top of the employment distribution (Figure 17) that had seen exceptional growth in employment, accounting for over half of all jobs created at that time.
5 Although it is important to note that they may be capital dependent – a new IT firm may struggle to do business without any computers. At the same time, however, the cost of those computers will typically be small.
6 Anyadike-Danes et al (2009).
Figure 16: Investment by firm size
Source: BoE
130
120
110
100
90
80
70
60
Indi
ces,
200
8 =
100
2006 2007 2008 2009 2010
20–49 employees (10%)50–299 employees (25%)300+ employees (66%)
Figure 17: Distributions of changes in employment
Source: Anyadike-Danes et al (2009)
70
60
50
40
30
20
10
0
Perc
enta
ge o
f fi
rms
Growth intervals–∞ : –20 –20 : –15 –15 : –10 –10 : –5 –5 : –1 –1 : 1 1 : 5 5 : 10 10 : 15 15 : 20 20 : ∞
2002–2005
2005–2008

13 The role of entrepreneurs and SMEs in driving the recovery
How do entrepreneurs and SMEs affect long-term growth?
In the NESTA study, small firms accounted for the greatest share of those high-growth firms by number; yet, in proportional terms the role of small firms was not significantly different from their larger cousins. Roughly 6% of small firms were high-growth firms; but so too were 6% of large businesses (Figure 18). The potential for strong job creation is not limited to SMEs.
At the same time, focusing on just one part of the employment distribution in this way is not representative, from a macroeconomic perspective. While there are SMEs that have generated many jobs in the past, SMEs are also inherently riskier, not least because they do not benefit from the same economies of scale or access to capital markets as larger firms, and therefore are more likely to go bust. ONS data show that of all new businesses that started in 2004, fewer than half were still trading in 2009. Clearly the recession has had an impact here, but even by 2007 a third of those 2004-vintage businesses had already shut down. As most high-growth firms are at least five years old, this indicates that many new businesses fail to have a lasting impact on job creation.
It is important to acknowledge that, as much as SMEs can and do generate jobs, jobs are also lost when SMEs shut down. A recent study for the Small Business Administration (SBA) in the US found that, over a 15 year period, net job creation across all small businesses was broadly comparable with that of larger firms (Figure 19). The key difference that was evident in the data was not the net change in employment, but instead the relatively high numbers of job gains and losses from small businesses opening and closing.
Figure 18: Number and proportion of high-growth firms
Source: Anyadike-Danes et al (2009)
7000
6000
5000
4000
3000
2000
1000
0
10
8
6
4
2
0
Num
ber
Perc
enta
ge
Firm size (No. of employees)10 – 19 20 – 49 50 – 99 100 – 249 250+
Number (LHS)
Proportion (RHS)
Figure 19: US job creation by firm size, 1993-2008
Source: Headd (2010)
Millions of jobs Job gains from: Job losses from:
Size of firm Net change Openings Expansion Closings Contractions
less than 20 4.6 54.8 104.5 51.8 102.9
20 - 499 8.7 11.5 150.6 12.6 140.8
500 + 7.5 1.0 93.9 1.3 86.0

14 The role of entrepreneurs and SMEs in driving the recovery
How do entrepreneurs and SMEs affect long-term growth?
These job losses, and indeed SME failures more broadly, should not be viewed as overly negative. Part of a normal, thriving market economy is the chance that businesses will fail – indeed, it is an essential feature of well-functioning private markets, as the recent banking crisis has demonstrated. But, at the same time, it may be optimistic to expect UK SMEs to disproportionately generate lasting increases in employment during the recovery. Indeed, despite a general increase in the total number of businesses in the UK over the past 15 years, and a reversal of the downward trend in self-employment since 2000, the overall proportion of people employed in the SME sector has remained broadly steady (Figure 20).
In our view, entrepreneurs and SMEs are unlikely to disproportionately contribute to growth via capital or labour. But they can influence total factor productivity (TFP). The Government’s current focus on innovation is very welcome here, as the UK is not particularly innovative at present (Figure 21), and there is evidence that innovative firms generate more jobs than their counterparts (Figure 22). But entrepreneurship can also play an important role with and alongside innovation.
Figure 20: Self-employment and SME employment
Source: BIS, ONS and BVCA
14.5
14.0
13.5
13.0
12.5
12.0
11.5
11.0
10.5
60
50
40
30
20
10
0
Perc
enta
ge
Perc
enta
ge
1994 1995 1996 1997 1998 1999 2000 2001 2002 2003 2004 2005 2006 2007 2008 2009 2010
Workforce jobs accounted for by self-employment (LHS)
Employment accounted for by small businesses (RHS)
Figure 21: Innovative firms by country
Source: BIS (2011)
100
80
60
40
20
0
Perc
enta
ge
Germany Italy Finland France UK Netherlands
2006
2008
Figure 22: Innovation and employment
Source: NESTA (2011)
6
5
4
3
2
1
0
Ave
rage
ann
ual g
row
th r
ate
2004
–200
7: %
Product innovation Process innovation Wider innovationYes No Yes No Yes No
15 The role of entrepreneurs and SMEs in driving the recovery
How do entrepreneurs and SMEs affect long-term growth?
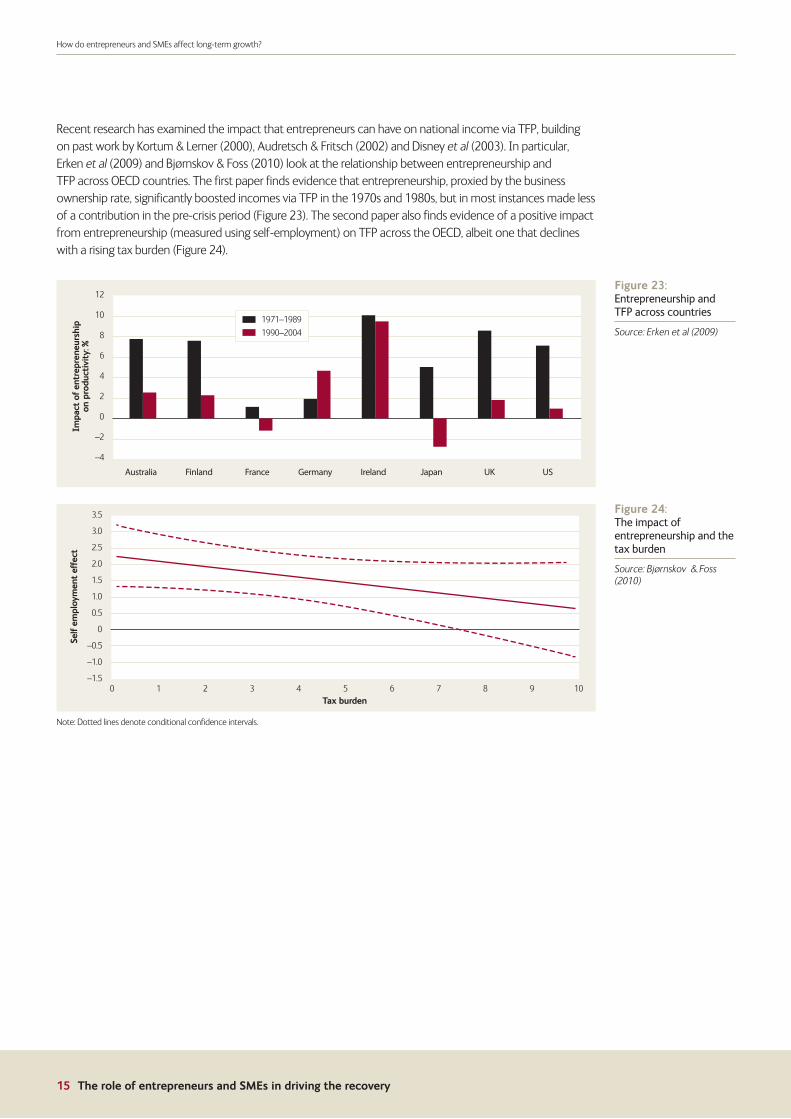
Recent research has examined the impact that entrepreneurs can have on national income via TFP, building on past work by Kortum & Lerner (2000), Audretsch & Fritsch (2002) and Disney et al (2003). In particular, Erken et al (2009) and Bjørnskov & Foss (2010) look at the relationship between entrepreneurship and TFP across OECD countries. The first paper finds evidence that entrepreneurship, proxied by the business ownership rate, significantly boosted incomes via TFP in the 1970s and 1980s, but in most instances made less of a contribution in the pre-crisis period (Figure 23). The second paper also finds evidence of a positive impact from entrepreneurship (measured using self-employment) on TFP across the OECD, albeit one that declines with a rising tax burden (Figure 24).
Note: Dotted lines denote conditional confidence intervals.
Figure 23: Entrepreneurship and TFP across countries
Source: Erken et al (2009)
12
10
8
6
4
2
0
–2
–4
Impa
ct o
f en
trep
rene
ursh
ipon
pro
duct
ivit
y: %
Australia Finland France Germany Ireland Japan UK US
1971–1989
1990–2004
Figure 24: The impact of entrepreneurship and the tax burden
Source: Bjørnskov & Foss (2010)
3.5
3.0
2.5
2.0
1.5
1.0
0.5
0
–0.5
–1.0
–1.5
Self
em
ploy
men
t ef
fect
Tax burden10 2 3 4 5 6 7 8 9 10

16 The role of entrepreneurs and SMEs in driving the recovery
How do entrepreneurs and SMEs affect long-term growth?
Two other studies are also very relevant here. Audretsch and Keilbach (2007) examine the impact of entrepreneurship alongside knowledge across local regions in Germany, measuring entrepreneurship via business start-up rates, and knowledge by employment in research & development (R&D) industries. While capital still has the biggest impact on labour productivity (Figure 25), the contribution from entrepreneurship is more than three times the size of the boost from R&D, illustrating the critical role that it can play.
Finally, Chemmaneur et al (2011) look at the relationship between VC investment and TFP across a panel of US manufacturing firms. Two results in particular are very interesting. First, the typical VC-backed firm has higher TFP than a non VC-backed firm, even prior to investment, which suggests that VCs correctly identify companies that are performing strongly. Second, following investment from VCs the TFP gap between VC-backed firms and other companies increases, consistent with VCs genuinely adding value to businesses (Figure 26).7
This evidence suggests that, if entrepreneurs are going to make a disproportionate and lasting difference to the UK economy, we may be more likely to see the impact in productivity gains rather than in job creation or investment. However, those productivity gains are no less important, representing as they do a genuine and lasting increase in national income.
7 This is consistent with qualitative evidence reported in Ellis (2010).
Figure 25: Drivers of labour productivity across German regions
Source: Audretsch & Keilbach (2007)
30
25
20
15
10
5
0
Impa
ct o
f la
bour
pro
duct
ivit
y: %
Capital Knowledge Entrepreneurship
Figure 26: TFP differences in VC-backed US firms
Source: Chemmanur et al (2011)
20
18
16
14
12
10
8
6
4
2
0
Dif
fere
nce
in T
FP le
vel v
sno
n V
C-b
acke
d fi
rms:
%
–4 –3 –2 –1 0Years prior to (–) or post (+) VC investment
1 2 3 4 5

17 The role of entrepreneurs and SMEs in driving the recovery
Summary
Summary
After the deepest recession that most people can remember, the UK has seen a relatively lacklustre pace of recovery in the past 18 months. Unfortunately, the recent loss of momentum in growth also coincides with an acceleration in the prolonged period of fiscal tightening that is necessary to get the public finances in order.
A key part of the Government’s economic strategy is to promote the UK as a place to do business, and encourage entrepreneurs and SMEs to locate and grow here. Our analysis suggests that the UK does enjoy strong advantages as a destination and location for business, although access to funding remains a key concern for many entrepreneurs and SMEs. In terms of the likely impact these new and growing businesses will have on growth, it may not be directly evident in lasting job creation or higher levels of business investment. Instead, much of the benefit will come through productivity gains; recent research suggests that this is an important channel via which entrepreneurs and SMEs can raise national income, thereby boosting activity, earnings and employment across the country as a whole.
Colin Ellis & Devash Tailor
June 2011

18 The role of entrepreneurs and SMEs in driving the recovery
References and sources
References and sources
Anyadike-Danes, M, Bonner, K, Hart, M and Mason, C (2009), ‘Measuring Business Growth: High-growth firms and their contribution to employment in the UK’, NESTA, London. Available at: http://www.nesta.org.uk/publications/reports/assets/features/measuring_business_growth
Audretsch, D and Fritsch, M (2002), ‘Growth regimes over time and space’, Regional Studies, Vol. 36, p113-24.
Audretsch, D and Keilbach, M (2007), ‘Entrepreneurship Capital and Economic Growth’, Working paper. Available at: http://www.dur.ac.uk/resources/dbs/businessschool/research%20paper%20005.pdf
BBAA (2011), ‘Annual Report on the Business Angel Market in the United Kingdom: 2009/10’, British Business Angels Association, London. Available at: http://www.bvca.co.uk/assets/features/show/BusinessAngelReport200910
BIS (2011), ‘Annual Innovation Report 2010’, Department for Business, Innovation and Skills, London.
Bjørnskov, C and Foss, N (2010), ‘Do Economic Freedom and Entrepreneurship Impact Total Factor Productivity?’, SMG Working Paper No. 8/2010. Available at: http://ssrn.com/abstract=1683965
Chemmanur, T, Krishnan, K, and Nandy, D (2011), ‘How Does Venture Capital Financing Improve Efficiency in Private Firms? A Look Beneath the Surface’, Review of Financial Studies, 2011 Forthcoming. Available at: http://www.chicagofed.org/digital_assets/others/research/research_calendar_attachments/seminars_2011/sem_nandy030311.pdf
Disney, R, Haskal, J and Heden, Y (2003), ‘Restructuring and Productivity Growth in UK Manufacturing’, The Economic Journal, Vol. 113, p666-694.
Ellis, C (2010), ‘What do business managers think about private equity and venture capital?’, BVCA Research Report, November.
Ellis, C and Groth, C (2003), ‘Long-run equilibrium ratios of business investment to output in the United Kingdom’, Bank of England Quarterly Bulletin, Summer, p177-87.
Erken, H, Donselaar, P and Thurik, R (2009), ‘Total Factor Productivity and the Role of Entrepreneurship’, Tinbergen Institute Discussion Paper 09-034/4. Available at: http://ssrn.com/abstract=1398767
Hart, M and Levie, J (2010), ‘Global Entrepreneurship Monitor: United Kingdom 2010 Monitoring Report’. Available at: http://www.gemconsortium.org/document.aspx?id=1133
Headd, B (2010), ‘An Analysis of Small Business and Jobs’, Small Business Administration, Washington DC, USA. Available at: http://archive.sba.gov/advo/research/rs359tot.pdf
Kendrick, J. W. (1961), ‘Productivity Trends in the United States’, Princeton University Press, Princeton. Available at: http://www.nber.org/books/kend61-1
Kortum, S and Lerner, J (2000), ‘Assessing the Contribution of Venture Capital to Innovation’, The RAND Journal of Economics, Vol. 31 (4), p674-92.
National Agency for Enterprise and Construction (2006), ‘Entrepreneurship Index 2006 – Entrepreneurship Conditions in Denmark’, NAEC, Copenhagen, Denmark. Available at: http://ice.foranet.dk/upload/denmark_%E2%80%9Centrepreneurship_index_2006%E2%80%9D.pdf
NESTA (2011), ‘Vital growth: The importance of high-growth businesses to the recovery’, NESTA, London. Available at: http://www.nesta.org.uk/press/assets/features/vital_growth
Oulton, N (2001), ‘Measuring capital services in the United Kingdom’, Bank of England Quarterly Bulletin, Autumn, p295-309.
Solow, R (1956), ‘A contribution to the theory of economic growth’, Quarterly Journal of Economics, Vol. 70 (1), p65-94.
Solow, R (1957), ‘Technical Change and the Aggregate Production Function’, The Review of Economics and Statistics, Vol. 39, p312-20.
Swan, T (1956), ‘Economic growth and capital accumulation’, Economic Record, Vol. 32, p334-61.
The Heritage Foundation (2011), ‘2011 Index of Economic Freedom’.
World Bank and the International Finance Corporation (2010), ‘Doing Business in the United Kingdom 2011: Making a Difference for Entrepreneurs’, Washington DC, USA. Available at: http://www.doingbusiness.org/
Wölfl, A, Wanner, I, Kozluk, T and Nicoletti, G (2009), ‘Ten Years of Product Market Reform in OECD Countries: Insights from a Revised PMR Indicator’, OECD Economics Department Working Paper No. 695, OECD, Paris. Available at: http://www.oecd-ilibrary.org/economics/ten-years-of-product-market-reform-in-oecd-countries_224255001640
World Economic Forum (2010), ‘The Global Competitiveness Report 2010–2011’, Geneva, Switzerland. Available at: http://www.weforum.org/issues/global-competitiveness

19 The role of entrepreneurs and SMEs in driving the recovery
XXXXXXXX
For further information contact the BVCA
1st Floor North Brettenham House Lancaster Place London WC2E 7EN
T: +44 (0)20 7420 1800 F: +44 (0)20 7420 1801 E: [email protected]
bvca.co.uk
Disclaimer
The data provided has been collected from different sources. BVCA has taken steps to ensure the reliability of the information presented. However, BVCA cannot guarantee the ultimate accuracy of the data and therefore BVCA does not accept responsibility for any decision made or action taken based on the information provided.
The British Private Equity and Venture Capital Association (BVCA)
The BVCA is the industry body and public policy advocate for the private equity and venture capital industry in the UK. Our members come from venture capital, through mid-market, to private equity/large buyout houses from all over Britain.
Our voice is one of authority when speaking for, or negotiating on behalf of, the UK industry. Our aim is to aid understanding, clarity and transparency around the activities of our members, promoting our industry to entrepreneurs and investors—as well as Government, trade unions, the media and the general public.
We provide a growing list of services and best practice standards for our members across a spectrum of activities covering a network of interconnected committees, which focus on segment-led, legal, technical, regulatory, investor-led and service-led needs. We also provide networking opportunities, training courses, research, publications, public affairs and communications on behalf of the industry.
With a membership of over 450 firms, we represent the vast majority of all UK-based private equity and venture capital firms and their advisors. The benefits of becoming a member—whether full or associate—are wide-ranging and only briefly described above.