entry system design of the mars gravity biosatellite · entry system design of the mars gravity...
TRANSCRIPT
Mars Gravity Biosatellite
Entry System Design of the Mars Gravity Biosatellite
AE8900 MS Special Problems Report Space Systems Design Lab (SSDL) School of Aerospace Engineering Georgia Institute of Technology
Atlanta, GA
Author Scott Francis
Advisor
Dr. Robert Braun Space Systems Design Lab (SSDL)
April 19, 2006
1

Entry System Design of the Mars Gravity Biosatellite
S. R. Francis* and R. D. Braun†
Georgia Institute of Technology, Atlanta, GA, 30332
The Mars Gravity Biosatellite will be launched to low Earth orbit and will study the effects of partial gravity on mammalian physiology. The entry vehicle will return 15 live mice to the Earth’s surface from low Earth orbit, landing in the Woomera Prohibited Area in central South Australia. This study establishes a baseline for the entry, descent, and landing system through the comparison of various concepts. The Discoverer capsule from the military’s Corona program of the 1950’s and 60’s is chosen over other concepts as the baseline aeroshell after an analysis of static stability and payload requirements for this mission. A nominal trajectory is developed based on science requirements, the safety of the mice, and payload recovery requirements. A sensitivity study is performed on the entry trajectory to determine the effects various parameters have on the nominal entry and a Monte Carlo dispersion analysis is used to establish a 3-σ landing ellipse, which fits within the boundaries of the Woomera Prohibited Area. A discussion of potential de-orbit propulsive devices is given in relation to the required de-orbit ∆V. A 16 m parachute is chosen as the baseline due to the resulting 4.8 m/s ground impact velocity and a crushable aluminum foam is chosen as a means to attenuate the shock of ground impact.
Nomenclature α = angle of attack CD = drag coefficient CL = lift coefficient Cm = moment coefficient
αdmdC
= derivative of moment coefficient with respect to angle of attack
I. Introduction HE Mars Gravity Biosatellite mission is designed to study the effects of partial gravity on the skeletal, muscular, and vestibular systems of mammals. It intends to begin to fill the gap of knowledge that exists
between the nominal physiological effects of being exposed to 1 g and the negative effects of 0 g such as rapid bone and muscle loss. This knowledge is crucial as we begin to plan to have a permanent human presence on the surface of the moon, and eventually Mars. The biosatellite will carry 15 mice into Low Earth Orbit (LEO) and will then be spun up to create artificial gravity equal to 0.38 g, simulating the gravity on the surface of Mars. After five weeks in orbit, the system will perform a de-orbit burn and the Entry Vehicle (EV) will detach from the spacecraft bus and perform an atmospheric entry, ultimately landing by parachute and crushable system in the Woomera Prohibited Area (WPA) in South Australia. The EV will perform a completely passive entry and therefore must rely on its spin and aerodynamics to maintain its stability throughout the entire re-entry process. Upon landing, the mice will be recovered within two hours and studied.
T
The objective of this study is to identify a baseline Entry, Descent, and Landing (EDL) sequence that will maximize robustness and minimize complexity while staying within the bounds of the science requirements and the physical limitations of the mice. Conceptual trade studies are performed to determine the best options for aeroshell, Thermal Protection System (TPS), and landing system and a nominal trajectory is modeled. A parachute is sized based on the desired ground impact velocity and various de-orbit propulsion options are considered based on the required ∆V. A Monte Carlo dispersion analysis is conducted to determine the effects of off-nominal conditions
* Graduate Research Assistant, School of Aerospace Engineering, 270 Ferst Dr., AIAA Student Member † Associate Professor, School of Aerospace Engineering, 270 Ferst Dr., AIAA Associate Fellow.
American Institute of Aeronautics and Astronautics
1
during entry and to determine a 3- σ landing ellipse which must fit within the boundaries of the WPA and be small enough to guarantee the recovery of the payload within two hours of landing. The sensed acceleration within the EV during the EDL sequence is of particular interest due to the fragility of the mice and the mission science requirements.
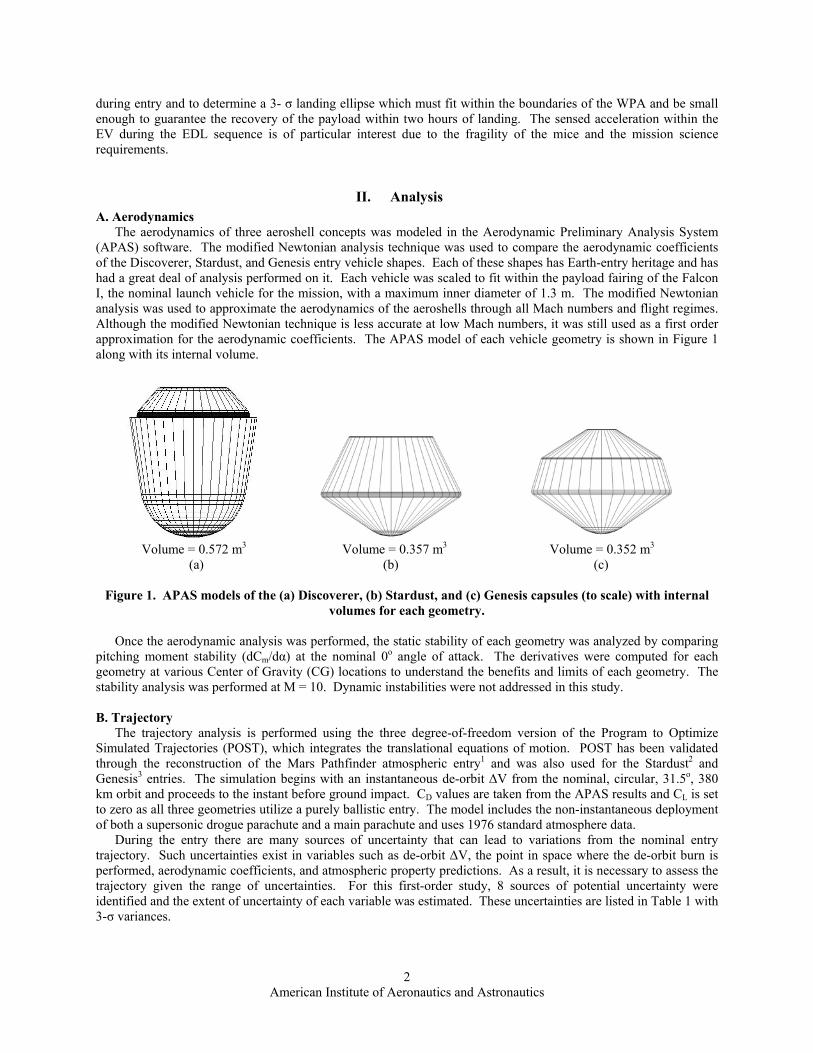
II. Analysis A. Aerodynamics The aerodynamics of three aeroshell concepts was modeled in the Aerodynamic Preliminary Analysis System (APAS) software. The modified Newtonian analysis technique was used to compare the aerodynamic coefficients of the Discoverer, Stardust, and Genesis entry vehicle shapes. Each of these shapes has Earth-entry heritage and has had a great deal of analysis performed on it. Each vehicle was scaled to fit within the payload fairing of the Falcon I, the nominal launch vehicle for the mission, with a maximum inner diameter of 1.3 m. The modified Newtonian analysis was used to approximate the aerodynamics of the aeroshells through all Mach numbers and flight regimes. Although the modified Newtonian technique is less accurate at low Mach numbers, it was still used as a first order approximation for the aerodynamic coefficients. The APAS model of each vehicle geometry is shown in Figure 1 along with its internal volume.
Volume = 0.572 m3 Volume = 0.357 m3 Volume = 0.352 m3
(a) (b) (c)
Figure 1. APAS models of the (a) Discoverer, (b) Stardust, and (c) Genesis capsules (to scale) with internal volumes for each geometry.
Once the aerodynamic analysis was performed, the static stability of each geometry was analyzed by comparing pitching moment stability (dCm/dα) at the nominal 0o angle of attack. The derivatives were computed for each geometry at various Center of Gravity (CG) locations to understand the benefits and limits of each geometry. The stability analysis was performed at M = 10. Dynamic instabilities were not addressed in this study. B. Trajectory The trajectory analysis is performed using the three degree-of-freedom version of the Program to Optimize Simulated Trajectories (POST), which integrates the translational equations of motion. POST has been validated through the reconstruction of the Mars Pathfinder atmospheric entry1 and was also used for the Stardust2 and Genesis3 entries. The simulation begins with an instantaneous de-orbit ∆V from the nominal, circular, 31.5o, 380 km orbit and proceeds to the instant before ground impact. CD values are taken from the APAS results and CL is set to zero as all three geometries utilize a purely ballistic entry. The model includes the non-instantaneous deployment of both a supersonic drogue parachute and a main parachute and uses 1976 standard atmosphere data. During the entry there are many sources of uncertainty that can lead to variations from the nominal entry trajectory. Such uncertainties exist in variables such as de-orbit ∆V, the point in space where the de-orbit burn is performed, aerodynamic coefficients, and atmospheric property predictions. As a result, it is necessary to assess the trajectory given the range of uncertainties. For this first-order study, 8 sources of potential uncertainty were identified and the extent of uncertainty of each variable was estimated. These uncertainties are listed in Table 1 with 3-σ variances.
American Institute of Aeronautics and Astronautics
2

Table 1. Mission uncertainties.
Uncertainty 3-σ VarianceMass ± 0.5 kgTrue Anomaly Angle ± 0.0651 degDe-orbit ∆V ± CD ± 10%Drogue CD ± 10%Drogue Deploy Mach Number ± 10%Atmospheric Density ± 30 %Inclination Angle ± 0.1 deg
1 m/s
The true anomaly angle dispersion represents an uncertainty of ± 1 second in where in its orbit the spacecraft performs the ∆V. The dispersion in inclination is used to model an uncertainty in the exact direction of the ∆V burn. Inclination was dispersed due to the way in which the trajectory model implements an instantaneous ∆V parallel to the spacecraft’s velocity vector. This term is the only dispersion that introduces an uncertainty out of the plane of the spacecraft orbit. Mass and drag coefficient variances were taken from those used by Desai, et al for the entry dispersion analysis for the Stardust mission. The 10% uncertainty is conservative in the hypersonic regime but was used due to the decreased accuracy of the modified Newtonian analysis technique in lower-velocity regimes. A Gaussian distribution was used for each input. C. TPS Sizing A preliminary estimation is made for the required TPS size and mass. The convective heating environment is approximated within POST using Chapman’s relation4 and the radiative heating environment is approximated using the Tauber-Sutton formulation5. The TPS sizing is an approximate solution using the heat of ablation to predict recession. A transient, one-dimensional finite difference heat transfer calculation is used, accounting for the material decomposition by allowing the density, thermal conductivity, and specific heat to vary with temperature and material char state6. The finite-difference solution does not include pyrolysis gas energy absorption through the material. The TPS sizing assumes a constant TPS thickness and is done based on stagnation point heating, and thus in general, will predict a higher-than-necessary mass for TPS since in practice the TPS can be manufactured as a variable thickness solution. Two different TPS materials including Phenolic-Impregnated Ceramic Ablator (PICA) and Super Light-weight Ablator 561 (SLA 561) are sized and compared to determine the best option for this mission. D. Landing System A simple model was used to approximate the required size of a crushable system in which an energy balance equates the kinetic energy of the EV at impact with the energy dissipated in the crushable. A maximum g-loading is specified and along with the vehicle mass and crush strength of the material it is used to determine the required area of the crushable column. An airbag system is also considered and is sized based on a historical comparison to the Mars Exploration Rovers’ airbag system.
III. Results and Discussion
A. Choice of Aeroshell The relative static stability of the aeroshells considered was a major factor in the decision of which geometry to
use as the mission baseline. If one geometry offered superior stability characteristics it would be strongly considered as it could increase the robustness of the entry sequence and the probability of mission success. Another major consideration is the packing of the payload in each geometry. The nature of the mission places strict requirements on the placement of the mice within the aeroshell and their position with respect to the spin axis of the spacecraft. To ensure a controlled experiment, each mouse must have an identical situation to the other mice, with its feet the precise distance from the spin axis to replicate 0.38 g.
American Institute of Aeronautics and Astronautics
3
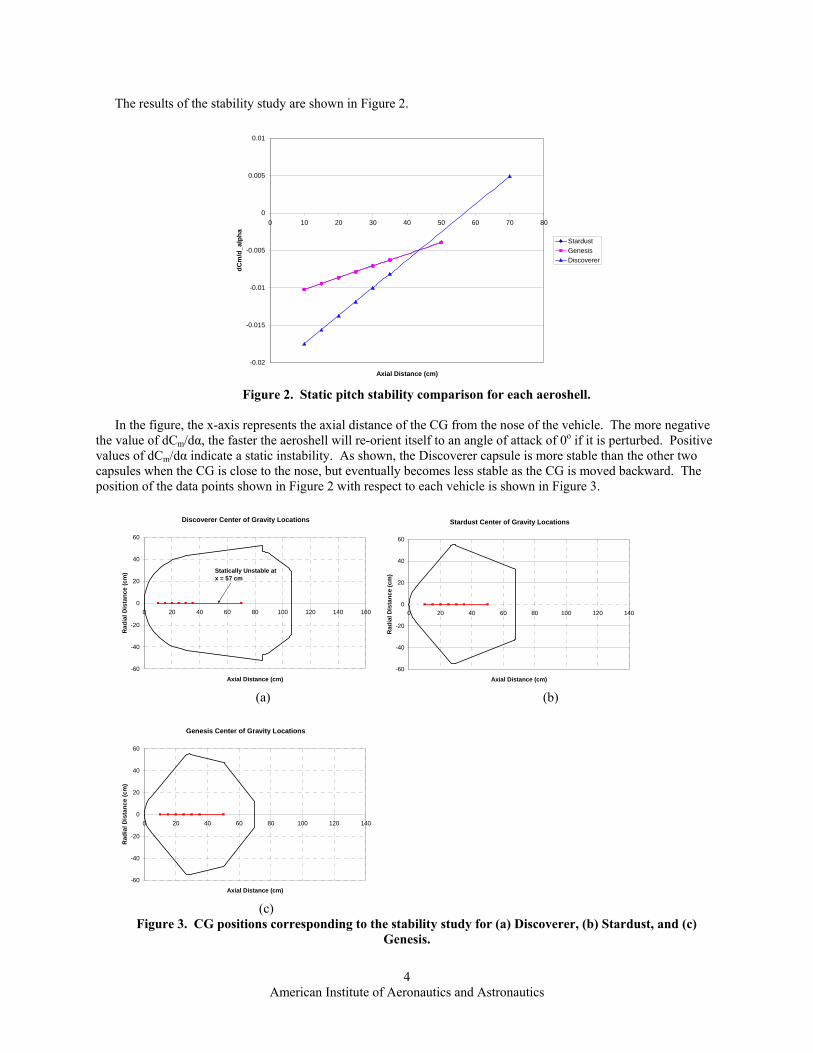
The results of the stability study are shown in Figure 2.
-0.02
-0.015
-0.01
-0.005
0
0.005
0.01
0 10 20 30 40 50 60 70 80
Axial Distance (cm)
dCm
/d_a
lpha
StardustGenesisDiscoverer
Figure 2. Static pitch stability comparison for each aeroshell.
In the figure, the x-axis represents the axial distance of the CG from the nose of the vehicle. The more negative
the value of dCm/dα, the faster the aeroshell will re-orient itself to an angle of attack of 0o if it is perturbed. Positive values of dCm/dα indicate a static instability. As shown, the Discoverer capsule is more stable than the other two capsules when the CG is close to the nose, but eventually becomes less stable as the CG is moved backward. The position of the data points shown in Figure 2 with respect to each vehicle is shown in Figure 3.
Discoverer Center of Gravity Locations
-60
-40
-20
0
20
40
60
0 20 40 60 80 100 120 140 160
Axial Distance (cm)
Rad
ial D
ista
nce
(cm
) Statically Unstable at x = 57 cm
Stardust Center of Gravity Locations
-60
-40
-20
0
20
40
60
0 20 40 60 80 100 120 14
Axial Distance (cm)
Rad
ial D
ista
nce
(cm
)
0
(a) (b)
Genesis Center of Gravity Locations
-60
-40
-20
0
20
40
60
0 20 40 60 80 100 120 14
Axial Distance (cm)
Rad
ial D
ista
nce
(cm
)
0
(c)
Figure 3. CG positions corresponding to the stability study for (a) Discoverer, (b) Stardust, and (c) Genesis.
American Institute of Aeronautics and Astronautics
4
As shown in Figure 3 (a), the Discoverer capsule will become statically unstable if the CG is located more than 57 cm behind the nose of the vehicle.
It should be noted that the modified Newtonian approximation of the aerodynamics has an effect on the stability analysis which involves some inaccuracies. For example, the current study implies that the Stardust capsule would be statically stable regardless of the location of the CG within the geometry, but Mitcheltree, et al have documented that the capsule experiences a static instability in the free-molecular flow regime when the CG is located 0.283 body diameters back from the nose7. With the current scale of the Stardust geometry this would correspond to a CG location located approximately 31 cm behind the nose. Free-molecular and non-equilibrium aerodynamic effects are neglected in this analysis. It is assumed that the relative stability of each geometry given by modified Newtonian techniques is accurate.
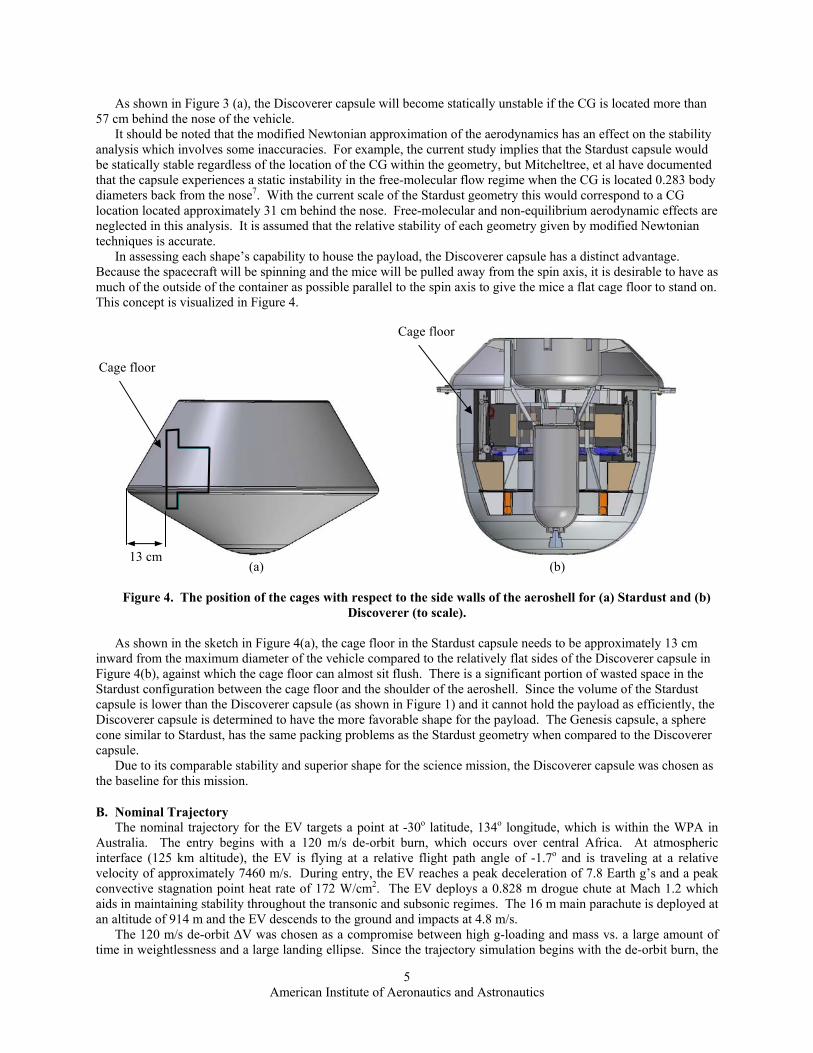
In assessing each shape’s capability to house the payload, the Discoverer capsule has a distinct advantage. Because the spacecraft will be spinning and the mice will be pulled away from the spin axis, it is desirable to have as much of the outside of the container as possible parallel to the spin axis to give the mice a flat cage floor to stand on. This concept is visualized in Figure 4.
AinwaFiguStardcapsuDiscconecapsu
Dthe b
Cage floor
Cage floor
B. NT
Austintervelocconvaids an al
Ttime
13 cm
(a) (b)Figure 4. The position of the cages with respect to the side walls of the aeroshell for (a) Stardust and (b) Discoverer (to scale).
s shown in the sketch in Figure 4(a), the cage floor in the Stardust capsule needs to be approximately 13 cm rd from the maximum diameter of the vehicle compared to the relatively flat sides of the Discoverer capsule in re 4(b), against which the cage floor can almost sit flush. There is a significant portion of wasted space in the ust configuration between the cage floor and the shoulder of the aeroshell. Since the volume of the Stardust le is lower than the Discoverer capsule (as shown in Figure 1) and it cannot hold the payload as efficiently, the
overer capsule is determined to have the more favorable shape for the payload. The Genesis capsule, a sphere similar to Stardust, has the same packing problems as the Stardust geometry when compared to the Discoverer le. ue to its comparable stability and superior shape for the science mission, the Discoverer capsule was chosen as aseline for this mission.
ominal Trajectory he nominal trajectory for the EV targets a point at -30o latitude, 134o longitude, which is within the WPA in ralia. The entry begins with a 120 m/s de-orbit burn, which occurs over central Africa. At atmospheric face (125 km altitude), the EV is flying at a relative flight path angle of -1.7o and is traveling at a relative ity of approximately 7460 m/s. During entry, the EV reaches a peak deceleration of 7.8 Earth g’s and a peak ective stagnation point heat rate of 172 W/cm2. The EV deploys a 0.828 m drogue chute at Mach 1.2 which in maintaining stability throughout the transonic and subsonic regimes. The 16 m main parachute is deployed at titude of 914 m and the EV descends to the ground and impacts at 4.8 m/s. he 120 m/s de-orbit ∆V was chosen as a compromise between high g-loading and mass vs. a large amount of in weightlessness and a large landing ellipse. Since the trajectory simulation begins with the de-orbit burn, the
American Institute of Aeronautics and Astronautics
5
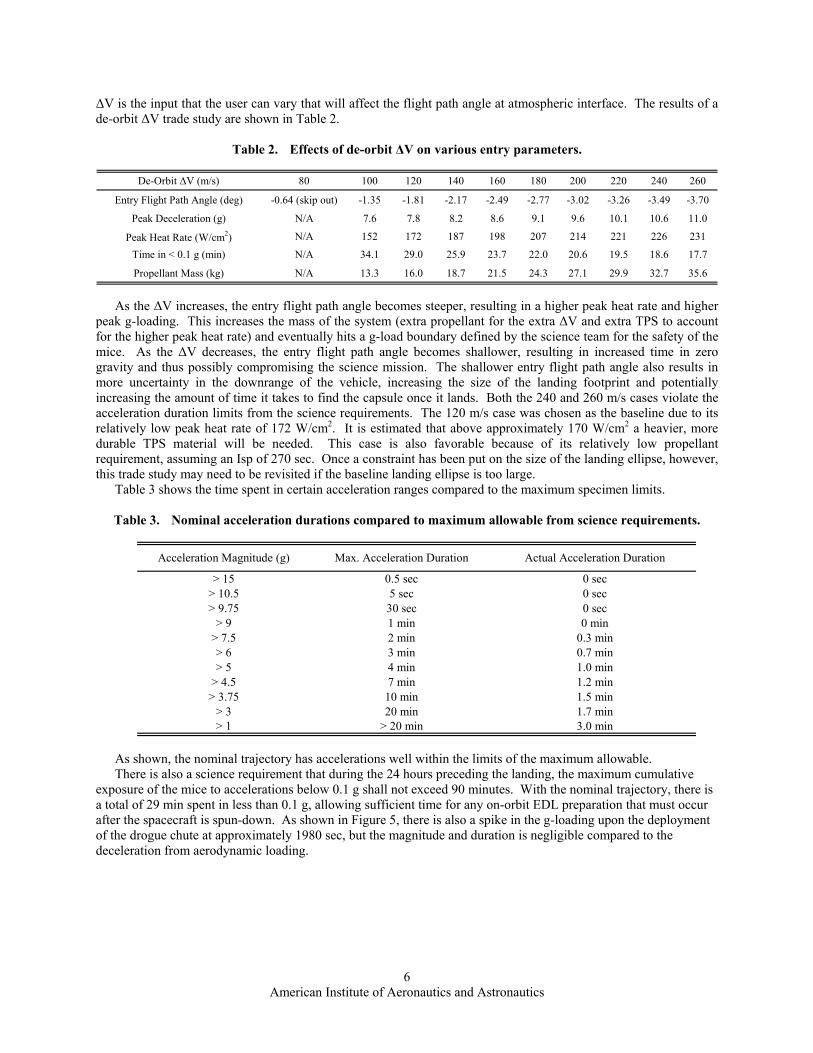
∆V is the input that the user can vary that will affect the flight path angle at atmospheric interface. The results of a de-orbit ∆V trade study are shown in Table 2.
Table 2. Effects of de-orbit ∆V on various entry parameters.
De-Orbit ∆V (m/s) 80 100 120 140 160 180 200 220 240 260
Entry Flight Path Angle (deg) -0.64 (skip out) -1.35 -1.81 -2.17 -2.49 -2.77 -3.02 -3.26 -3.49 -3.70
Peak Deceleration (g) N/A 7.6 7.8 8.2 8.6 9.1 9.6 10.1 10.6 11.0
Peak Heat Rate (W/cm2) N/A 152 172 187 198 207 214 221 226 231
Time in < 0.1 g (min) N/A 34.1 29.0 25.9 23.7 22.0 20.6 19.5 18.6 17.7
Propellant Mass (kg) N/A 13.3 16.0 18.7 21.5 24.3 27.1 29.9 32.7 35.6
As the ∆V increases, the entry flight path angle becomes steeper, resulting in a higher peak heat rate and higher
peak g-loading. This increases the mass of the system (extra propellant for the extra ∆V and extra TPS to account for the higher peak heat rate) and eventually hits a g-load boundary defined by the science team for the safety of the mice. As the ∆V decreases, the entry flight path angle becomes shallower, resulting in increased time in zero gravity and thus possibly compromising the science mission. The shallower entry flight path angle also results in more uncertainty in the downrange of the vehicle, increasing the size of the landing footprint and potentially increasing the amount of time it takes to find the capsule once it lands. Both the 240 and 260 m/s cases violate the acceleration duration limits from the science requirements. The 120 m/s case was chosen as the baseline due to its relatively low peak heat rate of 172 W/cm2. It is estimated that above approximately 170 W/cm2 a heavier, more durable TPS material will be needed. This case is also favorable because of its relatively low propellant requirement, assuming an Isp of 270 sec. Once a constraint has been put on the size of the landing ellipse, however, this trade study may need to be revisited if the baseline landing ellipse is too large.
Table 3 shows the time spent in certain acceleration ranges compared to the maximum specimen limits. Table 3. Nominal acceleration durations compared to maximum allowable from science requirements.
Acceleration Magnitude (g) Max. Acceleration Duration Actual Acceleration Duration
> 15 0.5 sec 0 sec> 10.5 5 sec 0 sec> 9.75 30 sec 0 sec
> 9 1 min 0 min> 7.5 2 min 0.3 min> 6 3 min 0.7 min> 5 4 min 1.0 min
> 4.5 7 min 1.2 min> 3.75 10 min 1.5 min
> 3 20 min 1.7 min> 1 > 20 min 3.0 min
As shown, the nominal trajectory has accelerations well within the limits of the maximum allowable. There is also a science requirement that during the 24 hours preceding the landing, the maximum cumulative
exposure of the mice to accelerations below 0.1 g shall not exceed 90 minutes. With the nominal trajectory, there is a total of 29 min spent in less than 0.1 g, allowing sufficient time for any on-orbit EDL preparation that must occur after the spacecraft is spun-down. As shown in Figure 5, there is also a spike in the g-loading upon the deployment of the drogue chute at approximately 1980 sec, but the magnitude and duration is negligible compared to the deceleration from aerodynamic loading.
American Institute of Aeronautics and Astronautics
6

0
1
2
3
4
5
6
7
8
9
0 500 1000 1500 2000 2500 3000
Time (s)
Dec
eler
atio
n (g
)
Figure 5. Deceleration over time for the nominal trajectory.
Figure 6 shows the nominal altitudes for the drogue and main parachute deployments.
0
5
10
15
20
25
30
0 100 200
Alti
tude
(km
)
Figure 6. Nominal miss
The drogue deployment trigger was set at M = 1.2m. In practice, both of these triggers will most likelyafter a certain g load is reached. Deployment uncertabut should be implemented in future, higher fidelity smentioned, the drogue is released supersonically to hregimes. The altitude trigger on the main chute was sallowing for quick retrieval by the recovery team upo
C. Sensitivity Study A sensitivity study was performed to determine
nominal entry trajectory. The results are summarized
American Institute o
Drogue
Main
300 400 500 600
Relative Velocity (m/s)
ion parachute deployment sequence.
and the main deployment trigger was set at an altitude of 914 be timers which deploy the chute a certain amount of time inty was not included in this study to simplify the simulation, imulations as it is another source of uncertainty. As elp maintain stability through the transonic and subsonic et relatively low to decrease the size of the landing ellipse, n landing.
the magnitude of the effect of changing certain inputs on the in Table 4, Table 5, and Table 6.
f Aeronautics and Astronautics
7
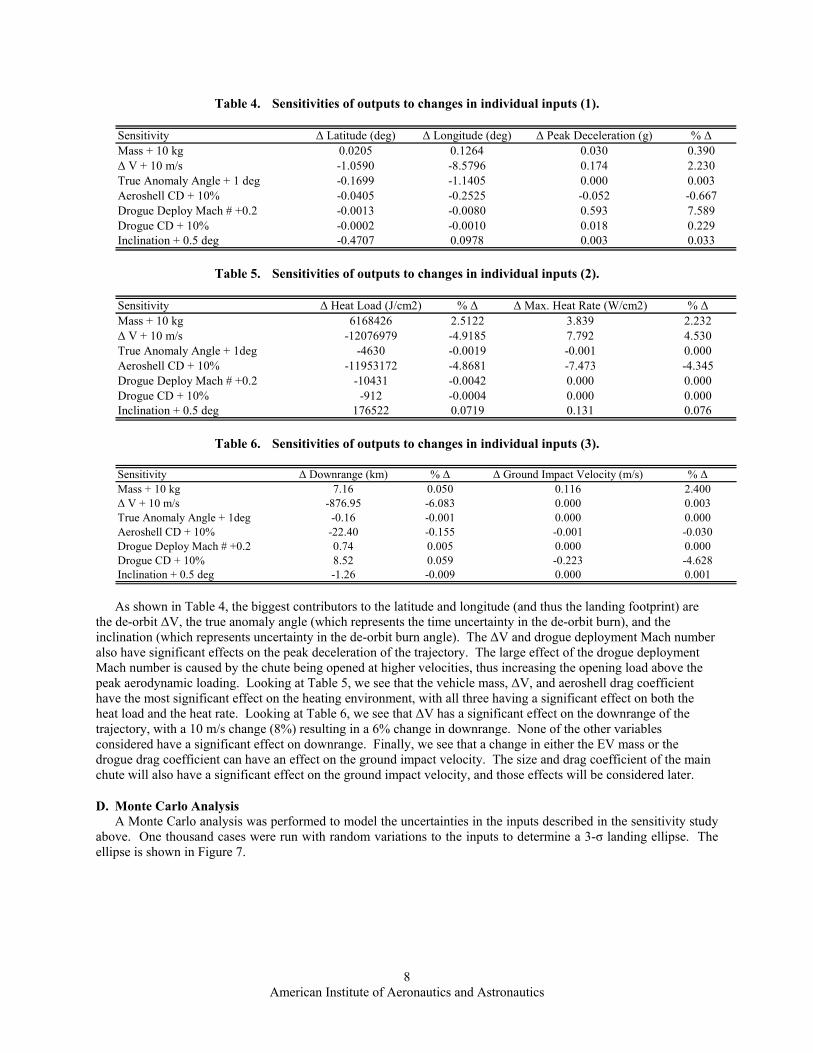
Table 4. Sensitivities of outputs to changes in individual inputs (1).
Sensitivity ∆ Latitude (deg) ∆ Longitude (deg) ∆ Peak Deceleration (g) % ∆Mass + 10 kg 0.0205 0.1264 0.030 0.390∆ V + 10 m/s -1.0590 -8.5796 0.174 2.230True Anomaly Angle + 1 deg -0.1699 -1.1405 0.000 0.003Aeroshell CD + 10% -0.0405 -0.2525 -0.052 -0.667Drogue Deploy Mach # +0.2 -0.0013 -0.0080 0.593 7.589Drogue CD + 10% -0.0002 -0.0010 0.018 0.229Inclination + 0.5 deg -0.4707 0.0978 0.003 0.033
Table 5. Sensitivities of outputs to changes in individual inputs (2).
Sensitivity ∆ Heat Load (J/cm2) % ∆ ∆ Max. Heat Rate (W/cm2) % ∆Mass + 10 kg 6168426 2.5122 3.839 2.232∆ V + 10 m/s -12076979 -4.9185 7.792 4.530True Anomaly Angle + 1deg -4630 -0.0019 -0.001 0.000Aeroshell CD + 10% -11953172 -4.8681 -7.473 -4.345Drogue Deploy Mach # +0.2 -10431 -0.0042 0.000 0.000Drogue CD + 10% -912 -0.0004 0.000 0.000Inclination + 0.5 deg 176522 0.0719 0.131 0.076
Table 6. Sensitivities of outputs to changes in individual inputs (3).
Sensitivity ∆ Downrange (km) % ∆ ∆ Ground Impact Velocity (m/s) % ∆Mass + 10 kg 7.16 0.050 0.116 2.400∆ V + 10 m/s -876.95 -6.083 0.000 0.003True Anomaly Angle + 1deg -0.16 -0.001 0.000 0.000Aeroshell CD + 10% -22.40 -0.155 -0.001 -0.030Drogue Deploy Mach # +0.2 0.74 0.005 0.000 0.000Drogue CD + 10% 8.52 0.059 -0.223 -4.628Inclination + 0.5 deg -1.26 -0.009 0.000 0.001
As shown in Table 4, the biggest contributors to the latitude and longitude (and thus the landing footprint) are
the de-orbit ∆V, the true anomaly angle (which represents the time uncertainty in the de-orbit burn), and the inclination (which represents uncertainty in the de-orbit burn angle). The ∆V and drogue deployment Mach number also have significant effects on the peak deceleration of the trajectory. The large effect of the drogue deployment Mach number is caused by the chute being opened at higher velocities, thus increasing the opening load above the peak aerodynamic loading. Looking at Table 5, we see that the vehicle mass, ∆V, and aeroshell drag coefficient have the most significant effect on the heating environment, with all three having a significant effect on both the heat load and the heat rate. Looking at Table 6, we see that ∆V has a significant effect on the downrange of the trajectory, with a 10 m/s change (8%) resulting in a 6% change in downrange. None of the other variables considered have a significant effect on downrange. Finally, we see that a change in either the EV mass or the drogue drag coefficient can have an effect on the ground impact velocity. The size and drag coefficient of the main chute will also have a significant effect on the ground impact velocity, and those effects will be considered later.
D. Monte Carlo Analysis A Monte Carlo analysis was performed to model the uncertainties in the inputs described in the sensitivity study
above. One thousand cases were run with random variations to the inputs to determine a 3-σ landing ellipse. The ellipse is shown in Figure 7.
American Institute of Aeronautics and Astronautics
8

-33.5
-32.5
-31.5
-30.5
-29.5
-28.5
-27.5
-26.5
128.5 130.5 132.5 134.5 136.5 138.5 140.5Longitude (deg)
Latit
ude
(deg
)
Figure 7. Landing ellipse based on Monte Carlo analysis inside the WPA. The ellipse easily fits within the boundaries of the WPA. As the fidelity of the model is increased and more
inputs are dispersed (such as separating the aerodynamics into multiple flow regimes and dispersing the aerodynamic coefficients in each regime), the ellipse will grow slightly.
E. Parachute Study A trade study was performed on the main parachute to determine the optimal size to yield a desirable ground
impact velocity. A cross type parachute was baselined due to its relatively low opening load factor (to minimize the shock to the mice upon inflation), it’s reasonable CD (assumed to be 0.7), and its stability, with an average angle of oscillation between 0o and 3o. The resultant ground impact velocity for various nominal diameters are shown in Figure 8.
0
2
4
6
8
10
12
14
16
18
20
0 5 10 15 20 25 30 35
Parachute Nominal Diameter (m)
Gro
und
Impa
ct V
eloc
ity (m
/s)
Figure 8. Ground impact velocity for various main parachute sizes.
It was desired to keep the impact velocity limited to roughly 5 m/s since the shock to the mice must be mitigated.
Additionally, as the parachute size grows, problems arise involving the packing and inflation of the chute. As a result, a nominal parachute diameter of 16 m was chosen as the baseline, resulting in a ground impact velocity of
American Institute of Aeronautics and Astronautics
9
roughly 4.8 m/s. For comparison, the main parachute for the Stardust mission was 7.3 m and had a ground impact velocity of roughly 4.4 m/s8. The main chute could be much smaller for Stardust compared to Mars Gravity because of the lower mass of the entry vehicle (45 kg for Stardust compared to 206 kg for Mars Gravity) and the higher parachute drag coefficient for Stardust’s triconical design (1.05) compared to Mars Gravity’s cross design (0.7). Despite the higher drag coefficient, the triconical design was ruled out for the Mars Gravity program because of its high opening load factor (~1.8 compared to ~1.2 for the cross) and its lower stability (average angle of oscillation between 10o and 20o).
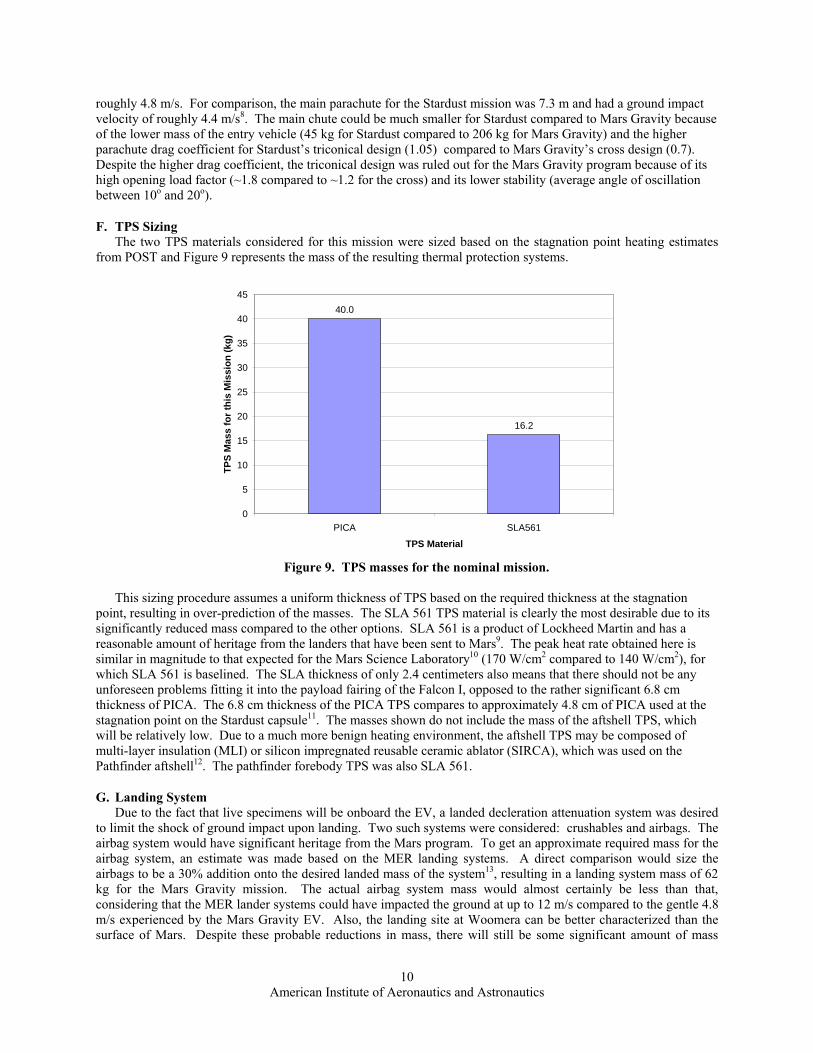
F. TPS Sizing The two TPS materials considered for this mission were sized based on the stagnation point heating estimates
from POST and Figure 9 represents the mass of the resulting thermal protection systems.
40.0
16.2
0
5
10
15
20
25
30
35
40
45
PICA SLA561
TPS Material
TPS
Mas
s fo
r thi
s M
issi
on (k
g)
Figure 9. TPS masses for the nominal mission.
This sizing procedure assumes a uniform thickness of TPS based on the required thickness at the stagnation
point, resulting in over-prediction of the masses. The SLA 561 TPS material is clearly the most desirable due to its significantly reduced mass compared to the other options. SLA 561 is a product of Lockheed Martin and has a reasonable amount of heritage from the landers that have been sent to Mars9. The peak heat rate obtained here is similar in magnitude to that expected for the Mars Science Laboratory10 (170 W/cm2 compared to 140 W/cm2), for which SLA 561 is baselined. The SLA thickness of only 2.4 centimeters also means that there should not be any unforeseen problems fitting it into the payload fairing of the Falcon I, opposed to the rather significant 6.8 cm thickness of PICA. The 6.8 cm thickness of the PICA TPS compares to approximately 4.8 cm of PICA used at the stagnation point on the Stardust capsule11. The masses shown do not include the mass of the aftshell TPS, which will be relatively low. Due to a much more benign heating environment, the aftshell TPS may be composed of multi-layer insulation (MLI) or silicon impregnated reusable ceramic ablator (SIRCA), which was used on the Pathfinder aftshell12. The pathfinder forebody TPS was also SLA 561.
G. Landing System Due to the fact that live specimens will be onboard the EV, a landed decleration attenuation system was desired
to limit the shock of ground impact upon landing. Two such systems were considered: crushables and airbags. The airbag system would have significant heritage from the Mars program. To get an approximate required mass for the airbag system, an estimate was made based on the MER landing systems. A direct comparison would size the airbags to be a 30% addition onto the desired landed mass of the system13, resulting in a landing system mass of 62 kg for the Mars Gravity mission. The actual airbag system mass would almost certainly be less than that, considering that the MER lander systems could have impacted the ground at up to 12 m/s compared to the gentle 4.8 m/s experienced by the Mars Gravity EV. Also, the landing site at Woomera can be better characterized than the surface of Mars. Despite these probable reductions in mass, there will still be some significant amount of mass
American Institute of Aeronautics and Astronautics
10

regardless of the mission in the form of fill gas, fill gas tanks, and gas generator units. In addition to the relatively large mass of the system, an airbag system introduces multiple failure modes compared to crushables. There could potentially be problems jettisoning the heatshield, problems with the gas generators inflating the airbags, or airbag tears upon impact.
A crushable system was sized to determine whether it would be a lighter, simpler option. Duocel Aluminum Foam was chosen for its relatively low density (48 kg/m3) and relatively high crush strength (0.52 MPa). Upon sizing the system, it was determined that a column of height 13 cm and area 298 cm2 would sufficiently attenuate the impact, limiting the mice to 18 g’s for a period of 0.03 seconds, which is within the science requirement 20 g’s for no more than 0.04 seconds. Since the exact attitude of the capsule will not be known due to winds or other factors, it was decided that redundancy in the crushable system would be required to ensure the target g-loading. One potential solution is shown in Figure 10.
Figure 10. Possible placement of crushable foam to ensure a benign landing.
In the figure, the TPS is shown as a dotted line and the blue cylinders represent the crushable aluminum foam
adhered to the outside of the payload bucket. In the figure, the larger cylinder in the center of the configuration is sized to handle the landing by itself, while the outer smaller cylinders require two units to be crushed to attenuate the impact. In this fashion, an impact away from the axis of symmetry of the lander would still be acceptable. Testing would have to be performed to determine the ideal configuration for the crushable pillars. With the redundancy shown in the figure, the crushable landing system would add roughly 2.7 kg to the system.
It should be noted that one possible problem with the crushable system is its effect on vehicle CG. Since the space between where the TPS would nominally be and it’s new position is filled with either air or a low density foam, the CG of this system would be moved back considerably with respect to the nose of the spacecraft. Again, a higher fidelity aerodynamics and stability assessment must be done to understand the limits on the location of the CG through all flight regimes to know that the crushables will not cause the EV to become unstable.
H. De-Orbit Discussion A preliminary analysis was performed on the de-orbit system to determine the best type of rocket to be used.
Three types of rockets were considered: cold gas thrusters, hypergolic, and solid. Considering the nominal 120 m/s ∆V required for de-orbit, the rocket equation was used to determine the approximate mass ratio (MR) required for each system. The assumed Isp’s and resultant mass ratios and propellant masses are shown in Table 7.
American Institute of Aeronautics and Astronautics
11

Table 7. De-orbit options.
Isp (s) MR Propellant Mass (kg)Cold Gas 70 1.191 65.877Solid 270 1.046 15.990Hypergolic 260 1.048 16.619
As shown in the table, the cold gas option is clearly undesirable as it requires a mass ratio of 1.19. The solid and hypergolic options are fairly comparable, and both systems are very reliable. The solid rocket option is chosen as the mission baseline, however, because of the extreme toxicity of hypergols.
Due to uncertainties in the de-orbit burn, precautions must be taken to ensure the entire burn occurs in the desired direction. The Mars Gravity EV is similar to the recovery module used in the METEOR14 mission and therefore a similar de-orbit sequence is utilized. Prior to de-orbiting, the attitude control system on the spacecraft bus brings the spacecraft to the desired attitude for the de-orbit maneuver. The spacecraft is then spun up to a sufficient spin rate to maintain accuracy during the burn. The burn occurs via the propulsion system on the spacecraft bus and then is de-spun to the desired spin rate for atmospheric entry to maintain stability. The EV must be de-spun to reduce its angular momentum, thus allowing aerodynamics to reduce its angle of attack before peak heating. The EV is then separated from the spacecraft bus and continues the EDL sequence.
IV. Conclusion
A conceptual level analysis was performed to develop a baseline entry, descent, and landing system for the Mars Gravity Biosatellite. A static stability analysis using modified Newtonian aerodynamic coefficients was performed to compare three aeroshell concepts. The three concepts were also considered for their ability to carry out the given mission. The Discoverer capsule from the military’s Corona spy satellite program of the 1950’s and 60’s was chosen as the baseline entry vehicle.
A three degree of freedom trajectory analysis was performed using POST, and a nominal trajectory was determined, which was a compromise between mission requirements, payload safety, and system mass. A sensitivity study was performed to determine the effect of individual inputs on the trajectory. Dispersions were placed around several inputs and a one thousand case Monte Carlo analysis was performed to obtain a 3-σ landing ellipse within the Woomera Prohibited Area in South Australia.
A cross type parachute was chosen as a baseline for its favorable opening load factor, drag, and stability, and it was sized based on a desired ground impact velocity. Several TPS materials were also considered and sized, with a baseline of SLA 561 being chosen for its favorable mass. A landing system study was performed in which the concept of airbags was compared to the concept of crushables, with crushables being chosen as the desired landing system. Finally, a preliminary analysis of the desired de-orbit system was conducted, with a solid de-orbit motor being chosen as the mission baseline.
V. Future Work With a general baseline established for the mission, future work should include a higher fidelity aerodynamic
analysis for different flight regimes in which static and dynamic instabilities are addressed thoroughly through the use of a six degree of freedom trajectory model. A more in-depth Monte Carlo analysis should be performed in which dispersions are placed around more variables, making a more robust simulation. Refinements should be made to the TPS model, accounting for the fact that the TPS material can be thinner away from the stagnation point, and the TPS mass should be updated including the aftshell TPS. Once the high fidelity aerodynamic analysis has been completed, the concept of a crushable landing system should be re-addressed to ensure that it does not push the center of gravity of the vehicle far enough aft to cause an instability. A bottoms-up mass estimate should be made for the EDL system. An analysis should be performed on the mortar required to deploy the drogue parachute to ensure it does not cause the payload to exceed acceleration limits. A model should be created for ground impact to determine whether or not a landing system is necessary at all to keep accelerations within science requirements. Finally, a better modeling of the de-orbit ∆V should be performed since this is shown to be a major mission driver.
American Institute of Aeronautics and Astronautics
12
Acknowledgments S. R. Francis thanks Reuben Rohrschneider, Grant Wells, Zachary Putnam, and John Dec of the Space Systems
Design Lab at the Georgia Institute of Technology for support and guidance through this study.
References
1Spencer, D. A., Thurman, S. W., Peng, C., and Kallemeyn, P. H., “Mars Pathfinder Entry, Descent, and Landing Reconstruction,” AAS/AIAA Space Flight Mechanics Meeting, American Astronautical Society, AAS Paper 98-146, Monterey, CA, Feb. 1998.
2Desai, P. N., Mitcheltree, R. A., Cheatwood, F. M., “Entry Dispersion Analysis for the Stardust Comet Sample Return Capsule,” Journal of Spacecraft and Rockets, Vol. 36, No. 3, May-June 1999.
3Desai, P. N., Cheatwood, F. M., “Entry Dispersion Analysis for the Genesis Sample Return Capsule,” Journal of Spacecraft and Rockets, Vol. 38, No. 3, May-June 2001.
4 Chapman, G. T., “Theoretical Laminar Convective Heat Transfer and Boundary Layer Characteristics on Cones at Speeds to 24 kilometers per second,” NASA TN D-2463, 1964.
5 Tauber, M. E., Sutton, K., “Stagnation-Point Radiative Heating Relations for Earth and Mars Entries”, Journal of Spacecraft, Vol. 28, No 1, 1991, pp.40-42.
6 Dec, J. A., Braun, R. D., “An Approximate Ablative Thermal Protection System Sizing Tool for Entry System Design,” 44th AIAA Aerospace Sciences Meeting and Exhibit, 9-12 January 2006, Reno, NV, AIAA Paper 06-0780.
7 Mitcheltree, R. A., Wilmoth, R. G., Cheatwood, F. M., Brauckmann, G. J., And Greene, F. A., “Aerodynamics of Stardust Sample Return Capsule,” AIAA Paper 97-2304, June 1997.
8 Witkowski, A., “The Stardust Sample Return Capsule Parachute Recovery System”, AIAA Paper 99-1741, 1999. 9 Willcockson, W. H., “Stardust Sample Return Capsule Design Experience”, Journal of Spacecraft and Rockets, Vol. 36, No
3, May-June 1999. 10 Laub, B., White, S., “Arcjet Screening of Candidate Ablative Thermal Protection Materials for Mars Science Laboratory,”
Journal of Spacecraft and Rockets, Vol. 43, No. 2, March-April 2006. 11 Olynick, D., Chen, Y. K., Tauber, M. E., “Forebody TPS Sizing with Radiation and Ablation for the Stardust Sample
Return Capsule,” AIAA Paper 97-2474, June 1997. 12 Tran, H., Johnson, C., Rasky, D., Hui, F., Hsu, M., “Silicon Impregnated Reusable Ceramic Ablators for Mars Follow-on
Missions,” AIAA Paper 96-1819, June 1996. 13 Adams, D. S., “Mars Exploration Rover Airbag Landing Loads Testing and Analysis”, 45th AIAA/ASME/ASCE/AHS/ASC
Structures, Structural Dynamics & Materials Conference, 19-22 April 2004, Palm Springs, CA. 14 Desai, P. N., Braun, R. D., Powell, R. W., Engelund, W. C., Tartabini, P. V., “Six-Degree-of Freedom Entry Dispersion
Analysis for the METEOR Recovery Module”, Journal of Spacecraft and Rockets, Vol. 34, No. 3, May-June 1997.
American Institute of Aeronautics and Astronautics
13