entsog union-wide security of supply simulation report · entsog union-wide security of supply...
TRANSCRIPT

ENTSOG – A FAIR PARTNER TO ALL !
SoS SIMULATION REPORT 2017
ENTSOG Union-Wide Security of Supply Simulation Report

ENTSOG Union-wide SoS simulation report
Page 2 of 68

ENTSOG Union-wide SoS simulation report
Page 3 of 68
Union-wide simulation of gas supply and infrastructure
disruption scenarios (SoS simulation)

ENTSOG Union-wide SoS simulation report
Page 4 of 68
Contents 1. Introduction ........................................................................................................................ 5
2. Supply and infrastructure disruption scenarios .................................................................. 7
3. Methodology and assumptions .......................................................................................... 8
3.1. Simulation cases and demand assumptions .............................................................................8
3.2. Exports ................................................................................................................................... 10
3.3. Demand and disruptions timelines ....................................................................................... 10
3.4. Supply .................................................................................................................................... 12
3.5. Infrastructure......................................................................................................................... 18
3.6. Modelling results interpretation ........................................................................................... 19
4. Results analysis ................................................................................................................. 21
Reference Scenario ............................................................................................................................ 22
Scenario #1 - Disruption of all imports to EU via Ukraine ................................................................. 25
Scenario #2 - Disruption of all imports to EU via Belarus .................................................................. 29
Scenario #3 - Disruption of one offshore pipeline of Nord Stream ................................................... 31
Scenario #4 - Disruption of the onshore receiving facility of Nord Stream ...................................... 33
Scenario #5 - Disruption of all imports to the Baltic states and Finland ........................................... 35
Scenario #6 - Disruption of the largest infrastructure to the Balkan region ..................................... 37
Scenario #7 - Disruption of the largest offshore infrastructure to the UK ........................................ 39
Scenario #8 - Disruption of the largest offshore infrastructure to continental EU (EUROPIPE II) .... 41
Scenario #9 - Disruption of the largest onshore infrastructure from Norway .................................. 43
Scenario #10 - Disruption of the largest L-gas storage (UGS Norg – The Netherlands) .................... 45
Scenario #11 – Disruption of the L-gas supply .................................................................................. 46
Scenario #12 - Disruption of the largest infrastructure to Denmark ................................................ 47
Scenario #13 - Disruption of the largest offshore production infrastructure from the UK .............. 49
Scenario #14 - Disruption of the largest offshore infrastructure to Italy .......................................... 51
Scenario #15 - Disruption of the largest offshore infrastructure to Spain ........................................ 53
Scenario #16 - Disruption of all imports from Algeria including LNG ................................................ 55
Scenario #17 - Disruption of the largest offshore infrastructure to Italy .......................................... 58
Annexes: data tables ................................................................................................................ 60
Annex I: Demand ............................................................................................................................... 61
Annex II: National production ........................................................................................................... 62
Annex III: Storages ............................................................................................................................. 63
Annex IV: LNG .................................................................................................................................... 66
Annex V: Capacities ........................................................................................................................... 67

ENTSOG Union-wide SoS simulation report
Page 5 of 68
1. Introduction
Regulation (EU) 2017/1938 of the European Parliament and of the Council concerning measures to
safeguard the security of gas supply and repealing Regulation (EU) No 994/2010 ("the Regulation")
entered into force on 1 November 2017.
In its Article 7 “Risk assessment”, the Regulation stipulates:
By 1 November 2017, ENTSOG shall carry out a Union-wide simulation of gas supply and infrastructure
disruption scenarios. The simulation shall include the identification and assessment of emergency gas
supply corridors and shall also identify which Member States can address identified risks, including in
relation to LNG. The gas supply and infrastructure disruption scenarios and the methodology for the
simulation shall be defined by ENTSOG in cooperation with the GCG. ENTSOG shall ensure an appropriate
level of transparency and access to the modelling assumptions used in its scenarios. The Union-wide
simulation of gas supply and infrastructure disruption scenarios shall be repeated every four years unless
circumstances warrant more frequent updates.
This ENTSOG publication is the first exercise of the above mentioned Union wide simulation. The work for
this edition started already before the entry into force of the Regulation in order to comply with the
ambitious timeline established therein, also for the subsequent procedures, mainly the common and
national Risk Assessments. Thanks to a close cooperation with the European Commission and the Gas
Coordination Group the rules and procedures as set up in the Regulation were already followed.
The methodology and assumptions used for the simulation have been defined by ENTSOG in cooperation
with the Gas Coordination Group during the meetings and web conference held on 22 March 2017, 23
May 2017 and 28 June 2017.
On 22 March 2017, the Gas Coordination Group was proposed a set of 19 supply and infrastructure
disruption scenarios and discussed during that meeting which climatic conditions and which scenarios
would be relevant together with their appropriate duration. Members of the Gas Coordination Group
were given an additional period of time until April 2017 to further comment on the scenarios and the
climatic conditions. Feedback from 21 Member States and 4 organisations was received and led to
adapted disruption scenarios that were again discussed with the Gas Coordination Group in a
webconference on 23 May 2017. As a result, scenarios including their durations were defined and in some
instances, specific demand or production assumptions were agreed, to ensure an increased accuracy in
the simulation. Those assumptions are detailed later in this report. It was also decided to delegate the
treatment of the scenarios concerning L-gas to the Gas Platform1.
On 28 June 2017, the methodology and assumptions for the simulations were agreed at the meeting of
the Gas Coordination Group.
1 The Gas Platform is the regional cooperation for gas for Belgium, France, Germany, Luxembourg and the
Netherlands. It is an intergovernmental initiative where ministries responsible for energy policy discuss issues
related to security of supply and market integration, in close cooperation with the National Regulatory Authorities
and Transmission System Operators. Ad hoc, the European Commission or other European authorities participate as
observer. The Benelux Secretariat provides support.

ENTSOG Union-wide SoS simulation report
Page 6 of 68
The input data for the simulations concerning the gas demand for the different climatic conditions,
infrastructure capacities and the estimates for the gas production were submitted by TSOs and Associated
Partners and Observers from ENTSOG as part of a specific data collection process in May.
The supply and infrastructure disruption scenarios as well as the methodology and assumptions are
further detailed in the next chapters.
Figure 1: Timeline of Union wide simulation of supply and infrastructure disruption scenarios

ENTSOG Union-wide SoS simulation report
Page 7 of 68
2. Supply and infrastructure disruption scenarios
The 19 supply and infrastructure disruption scenarios cover all the Emergency Supply Corridors as well as
the 13 different Risk Groups of Member States as defined in the Annex 1 of the Regulation. They are meant
to identify which Member States can address identified risks, including in relation to LNG, against the
failures of the main gas supply routes or infrastructures.
Among these scenarios, two scenarios are not simulated because no infrastructure exists yet (scenarios
18 and 19). The scenarios regarding Low Calorific gas are defined and treated within the Gas Platform.
Risk Group # Disruption scenario
Eastern gas
supply
Ukraine 1 Disruption of all imports via Ukraine
Belarus 2 Disruption of all imports via Belarus
Baltic Sea 3 Disruption of one Nord Stream offshore pipeline
4 Disruption of the onshore receiving facility of Nord Stream (Greifswald
station)
North-Eastern 5 Disruption of all imports to the Baltic states and Finland
Trans-Balkan 6 Disruption of the largest infrastructure to the Balkan region
North Sea
gas supply
Norway 7 Disruption of the largest offshore infrastructure to the UK (Langeled)
8 Disruption of the largest offshore infrastructure to continental EU
(Europipe 2)
9 Disruption of the largest onshore infrastructure from Norway (Emden
station)
Low calorific gas 10 Disruption of the largest L-gas storage (Gas Platform)
11 Disruption of the L-gas supply (Gas Platform)2
Denmark 12 Disruption of the largest infrastructure to Denmark (Ellund)
United Kingdom 13 Disruption of Forties pipeline system
North-African
gas supply
Algeria 14 Disruption of the largest offshore infrastructure to Italy (Transmed)
15 Disruption of the largest offshore infrastructure to Spain (MEG)
16 Disruption of imports from Algeria, including LNG
Libya 17 Disruption of all imports from Libya
South-East
gas supply
Southern Gas
Corridor
18 No existing infrastructure
Eastern-
Mediterranean
19 No existing infrastructure
Table 1: Disruption scenarios
2 Further scenarios with regard to the L-gas supply will be developed within the framework of the Gas Platform and
communicated later.

ENTSOG Union-wide SoS simulation report
Page 8 of 68
3. Methodology and assumptions
The methodology and assumptions cover
• Simulation cases along with the corresponding demand assumptions,
• Disruption duration,
• Supply,
• Infrastructure,
• Modelling and results interpretation, and
• Treatment of storages including the initial inventory levels.
The corresponding data is available in the Annexes.
3.1. Simulation cases and demand assumptions
Figure 2: comparison winter demand history and SoS assumptions
For every scenario, 3 different cases are simulated to assess the impact of 3 high demand events:
1. A historical high demand winter3 – country level maximum since winter 2009/10
2. A period of 2 weeks of exceptionally high demand, occurring with a statistical probability of once
in 20 years.
3. One day (Peak Day) of exceptionally high demand, occurring with a statistical probability of once
in 20 years – also called Design Case (DC).
The high demand cases are meant to capture the capability of the gas system to cope with the most
challenging demand situation (Peak Day / Design Case) and a long high-demand period (2-week high
demand). 2-Week and Peak Day simulations consider the beginning of the winter follows a historical high
demand reflected in the storage levels and LNG import flows (see also chapter 3.6).
3 Winter: period from 1 October to 31 March, covering the six months in between with 182 days in total.

ENTSOG Union-wide SoS simulation report
Page 9 of 68
Figure 3: comparison 2-week and Peak Day demand history and SoS assumptions
In specific countries, due to the structural decrease of the gas demand over the last years the application
of historical demand figures for the whole winter simulation would not be appropriate.
This applies to Denmark, Finland, Lithuania and Sweden. Instead of the highest winter demand since
2009/10, a best estimate of the current winter demand has been considered for Denmark and Sweden.
For Finland, the highest demand of the last five winters is considered, and for Lithuania the highest
demand of the last two winters is used in the simulations.
The sum of the winter demand of the EU countries in this assessment is 2.5% above the demand that has
materialised simultaneously across the EU since 2009/10. This deviation is derived from the fact that the
historical highest winter demand did not occur simultaneously in every European country. For the 2-week
and peak day demand cases, the 1-in-20 years approach leads to the sum of the 2-week demand being
7% and the one for the Peak day 15% above the simultaneous demand that could be observed since
2009/10.

ENTSOG Union-wide SoS simulation report
Page 10 of 68
3.2. Exports
In addition to the demand within the EU member states as shown in figures 2 and 3, the demand of non-
EU countries that are only supplied via the European gas infrastructure (BA, CH, MK, RS), the exports to
Ukraine (based on the last two winters), and the transits towards Kaliningrad and Turkey (based on the
last 5 winters) have been considered in the simulations. The transits to Turkey are not maintained in the
scenarios 1 and 6, the transits to Kaliningrad are not maintained in the scenarios 2 and 5.
Figure 4: Monthly, 2-Week and Peak Day EU demand and exports from EU
In general, exports to non-EU countries represent around 5% of the EU winter demand and, in particular,
Ukrainian exports in the simulations represent around 2% of the EU winter demand.
3.3. Demand and disruptions timelines
The disruption periods are defined to assess the impact of the various scenarios along with a low initial
storage level during these exceptionally high demand events. They are not defined based on their
probability of occurrence. Therefore, the 2-month disruptions are simulated during January and February
and the 2-Week disruptions from 15 February to 28 February.
Regarding the 2-Week and Peak Day simulations, storage levels and LNG import flows considered on 15
February are resulting from the whole winter simulation (see also chapter 3.6 for further information).
Simulation case Historical high demand winter 2-week in 20 years Peak day in 20 years
Simulation period From 1 October to 31 March From 15 February to 28
February
On 15 February
Gas demand Highest winter demand since
2009/10 (at country level and
then aggregated for EU)
Exceptionally high
demand, occurring with
a statistical probability of
once in 20 years.
Exceptionally high
demand, occurring with a
statistical probability of
once in 20 years.
Table 2: Simulation cases timeframes

ENTSOG Union-wide SoS simulation report
Page 11 of 68
Figure 5: Demand assumption and disruption timeframes
Specificity of scenario 16 - Algerian disruption:
Disruption scenario #16 considers the disruptions of the imports from Algeria via both pipelines and LNG
cargos. However, different supply assumptions are made regarding pipelines, that cannot physically be
rerouted, and LNG, to consider that additional cargos can come from different suppliers. Therefore, it is
assumed that a period of 3 weeks starting from 1 January is necessary to attract more LNG cargos to
substitute the Algerian LNG (see figure 6).
Figure 6: Demand assumption and disruption timeframes for scenario 16

ENTSOG Union-wide SoS simulation report
Page 12 of 68
3.4. Supply
Figure 7 shows historical supply since winter 2009/10 for pipeline and LNG imports.
The maximum supply potentials of the different sources providing gas to EU via pipeline (Algeria, Libya,
Norway, Russia) are based on a 5 years history.
Figure 7: Winter supply limitation
Supply limitations are set for different time scales (winter season, monthly and daily) so that the maximum
flow of each source cannot exceed reasonable levels based on historical observations.
Figure 8: 30-day and daily supply limitation

ENTSOG Union-wide SoS simulation report
Page 13 of 68
Example with Norwegian imports:
Over the whole simulated winter, gas imports from Norway do not exceed 669 TWh and for each month,
the average import flows do not exceed 3,854 GWh/d.
However, during some days, import flows go up to the daily limit – 4,100 GWh/d –the monthly average
flow remaining below the 3,854 GWh/d, and the winter average flows remain below 3,675 GWh/d.
Figure 9: Winter supply history and modelling assumptions
LNG specificity:
Import flows and storage use are driven by the demand: the higher the demand the higher the import
flows and the storage withdrawal. However, supply flexibilities are based on historical flows that were
observed over the last 5 years (from winter 2012/2013) and highest demand was observed prior to this
period. For this reason, the LNG supply records over the last 5 years do not reflect this supply/demand
interaction appropriately.
Therefore, to ensure a sufficient level of supply for meeting the high winter demand, the LNG supply
limitation for the simulations is set at 2,500 GWh/d to match the historical European flows driven by the
highest demand of winter 2009/10 and 2010/11 for those countries with high LNG imports. It should be
noted that the monthly limitation of 2,500 GWh/d matches the winter limitation of 455 TWh.
During the Peak Day, the LNG supply is allowed to go up to the total send-out capacities of the terminals
(6,082 GWh/d).
LNG flows during the first week of the 2-Week simulations (15 to 21 February):
For the first week of the 2-Week simulation, the model considers the LNG flows resulting from the whole
winter simulation.

ENTSOG Union-wide SoS simulation report
Page 14 of 68
Algerian LNG specificity in scenario 16: For scenario #16 (disruption of all Algerian imports), the model considers that the flows to the different LNG terminals are reduced by the share of Algerian LNG in their LNG mix in 2016.
Share of Algeria in LNG supply mix
Belgium 0% Netherlands 0%
Finland 0% Poland 0%
France 67% Portugal 12%
Greece 100% Spain 21%
Italy 3% Sweden 0%
Lithuania 0% UK 2%
Table 3: Share of Algerian LNG in the LNG mix per country in 2016 – Source GIIGNL EU Production:
The EU production levels are based on best forecast for the winter 2017-18.
Figure 10: EU production history and SoS assumption
The EU Production level considered in the simulations is 40% below the EU Production that was observed
during the high demand winter of 2009/10.
Danish production:
According to the Danish Energy Agency the production at the Tyra gas field is expected to be shut
completely down from December 2019 and to come on stream again from March 2022. It is a complicated
project so there might be some uncertainty about the final timetable including the resumption of the full
production at the Tyra gas field. More information about the project and when the production will shut
down is expected at the end of 2017.

ENTSOG Union-wide SoS simulation report
Page 15 of 68
The Danish gas fields are scattered around to main areas where two pipelines are evacuating the gas
production from the North Sea to Denmark (Tyra-Nybro and Syd Arne-Nybro). Gas can also be transported
between the two areas in the North Sea. Furthermore, there is a pipeline connection to the NOGAT
pipeline on the continental shelf of the Netherlands which brings gas on shore to the Netherlands.
The Tyra gas field is the largest producing Danish gas field and the main supplies to Denmark come from
Tyra. At the same time gas from the surrounding gas fields cannot be evacuated to Denmark during the
renovation period. This gas will be exported to the Netherlands. During the renovation of Tyra no gas will
be evacuated through the Tyra-Nybro pipeline. During the renovation of Tyra there will be very limited
supplies to Denmark from the North Sea from the Syd Arne-Nybro pipeline.
Therefore, the following supplies from the Danish North Sea are expected:
Expected Sale gas BCM Nm3 from the Danish North Sea
DK or NL[1] DK NL
2017 3.80
2018 3.53
2019 (January-November) 2.71
2019 (December) 0.02 0.08
2020 0.24 0.80
2021 0.20 0.70
2022 (January-February) 0.08 0.03
2022 (March-December) 2.28
Table 4: Danish production (source ENS)
In the simulations, this production was represented by 6.6 GWh/d for Denmark plus 23 GWh/d for the
Netherlands. Consequently, the amount of production for Denmark in these simulations is only around
5% of the one used for ENTSOG’s Winter Supply Outlook 2016/17.
Dutch production:
The maximum allowed production level of the Groningen field (starting gas year 2018) will be 21.6 bcm
(with allowance for 5.4 bcm of additional production in a cold year if necessary).
Underground Gas Storages:
In winter, the supply flexibility in the European gas system is largely ensured by the gas storages, they are
essential assets to cope with the high demand variation during the winter season.
The capability of the gas system to cope with the winter demand variation depends on storage filling levels
at the beginning of the winter, and is reported every year by ENTSOG in its Winter Supply Outlook.
For this Security of Supply simulation, storage filling levels are considered at the lowest level in the last 5
years history: 82.0% on 1 October. For further information, see Annex IV.

ENTSOG Union-wide SoS simulation report
Page 16 of 68
Figure 11: EU production history and SoS assumption (Source: AGSI+)
ENTSOG models the variation of the withdrawal capacities with the filling level the storages based on
figures provided by the Storage Systems Operators via GSE (available in Annex IV).
Storage levels at the beginning of the 2-Week and Peak Day simulations (15 February):
The model considers the storage levels resulting from the whole winter simulations on 15 February as an
input for 2-Week and Peak Day simulations.
UK specificity
Centrica’s Rough storage in the UK has announced its closure. There is the plan to withdraw the remaining
gas in the storage over the next 3-5 years. When the input data for the simulations for this report were
fixed details regarding the related timeline and the structure were not available. Due to these
uncertainties, this potentially temporarily additional gas source was left out of the simulations.
In September 2017, the UK's Oil & Gas Authority approved Centrica Storages' application to produce 869
mcm of gas from the reservoir4. These volumes would not change significantly the outcomes of the
simulation.
LV specificity
The simulation considers the latest development regarding the low filling level of Latvian storage in 2017.
NL specificity
The simulation considers the reduction of the Working Gas Volume of the Norg storage that has been
decided during summer 2017.
4 Link to Platts article : https://www.platts.com/latest-news/natural-gas/london/withdrawal-works-at-uks-rough-
gas-storage-extended-21115344

ENTSOG Union-wide SoS simulation report
Page 17 of 68
LNG terminals tank flexibility: LNG stocked in the tanks fluctuates within a normal operating range of LNG in the tanks following normal
operation. Besides, there is a minimum amount of LNG that must be kept in the tanks for a safe operation.
However, in case of high demand events such as cold spells or peak demand days, this minimum amount
can be lowered and part of the tanks are therefore used as a buffer volume, waiting for more LNG carriers
to unload.
ENTSOG models this tank flexibility based on figures provided by the LSOs via GLE (available in Annex V).
Illustration 1: LNG tank flexibility

ENTSOG Union-wide SoS simulation report
Page 18 of 68
3.5. Infrastructure
The simulations consider the existing European gas infrastructure as of 1 October 20175.
ENTSOG modelling tool (NeMo) builds on TSO expertise and hydraulic
modelling of national infrastructure to model the European
infrastructure with the most relevant accuracy. This enables the national
assessment of relevant risks affecting the security of gas supply to benefit
from the Union wide simulation of supply and infrastructure disruption
scenarios and further extend the local assessment with a higher
granularity. Capacities used in the simulation can be found in annex I.
Illustration 2: NeMo tool simplistic overview
5On 27 September 2017, Fluxys announced capacity restrictions on TENP pipeline until 31 March 2019. This recent
information, at the time of writing this report, is not considered in the Union-wide SoS simulation.

ENTSOG Union-wide SoS simulation report
Page 19 of 68
3.6. Modelling results interpretation
The simulations identify situations where a country can receive help from its neighbouring countries in
order to avoid demand curtailment, and the infrastructure limitations. An infrastructure limitation can be
observed when the technical capacities on the direct and indirect routes between countries are
completely used so that no further flows to the country with the higher risk for demand curtailment are
possible.
Demand-side response and demand-side measures are not simulated so that the results can be
interpreted and compared to the reference scenario without pre-empting any reaction or possible
solution to the identified situations.
Storage use:
Simulations of the whole winter assesses the capability and the flexibility of the gas system to cope with
a high demand winter. Therefore, the model prepares for this high demand level by injecting in the UGS
as long as the import flows allow for it.
High demand cases (2-Week and Peak Day) consider the storage levels at the start of the events resulting
from the whole winter simulation.
Demand curtailment allocation
Whenever a simulation result indicates possible demand curtailment, the actual allocation of this curtailed
demand between the countries depends on several factors amongst which the cooperation of member
states and contractual arrangements are most relevant. In some instances, infrastructure limitations can
limit the cooperation possibility. Consequently, in order not to pre-empt on any possibility, the
assessment presents two different allocations for non-infrastructure related curtailment that are not
meant to reflect demand segmentation or protected demand:
• Unified allocation: All member States within the risk group cooperate by avoiding a demand
curtailment to the extent possible by transporting other supply – including LNG from tanks and
ships, pipeline supply, indigenous production and storage withdrawal – and furthermore by
sharing the curtailment equally in such a way that they try to reach the same curtailment rate.
• Distance-based allocation: All member States within the risk group cooperate by avoiding a
demand curtailment to the extent possible by transporting other supply – including LNG from
tanks and ships, pipeline supply, indigenous production and storage withdrawal – and leave the
demand curtailment occurring in the countries that are close to where the supply and
infrastructure disruption occurs.
The allocation of the demand curtailment within the member states can be further investigated as part of
the national and regional risk assessments.
Comparison with reference case
For the purpose of giving more insight to the flows during the disruptions scenarios, a reference case
without disruption has been defined (scenario 0).
The comparison of the scenarios results with the reference case is described in the results analysis and
gives more information on the reaction to the disruption scenarios. Such reaction can either be a market
reaction or an active steering of the market participants that could derive from applying appropriate
measures within the regulatory framework. Changes in the flows are one possible reaction and other
reactions could be further investigated in the preventive action plans.

ENTSOG Union-wide SoS simulation report
Page 20 of 68
Units
All the data used in the simulation are expressed in energy (TWh or GWh). For better readability of the
results analysis, ENTSOG present the results in both energy and volumes.
ENTSOG derives volumes from energy by applying a single conversion factor of 11 kWh/m3.

ENTSOG Union-wide SoS simulation report
Page 21 of 68
4. Results analysis

ENTSOG Union-wide SoS simulation report
Page 22 of 68
Reference Scenario
Reference case
Risk group: Not applicable
Scenario duration: No disruption
Simulation results
Whole winter
Supply
Storages: filling level ends around 13% on 31 March at EU level. In general, gas is still injected in the storages in October and withdrawal is observed in all countries from November to March. The behaviour between the countries varies following the different demand evolution with the UK and Sweden showing a high withdrawal rate already in January and other countries like Austria, Bulgaria, Czech Republic, Denmark, NCG/Germany, Italy, the Netherlands and Romania that show still fill levels above 35% for the beginning of February.
Pipeline and LNG supplies: Supplies can be imported up to the maximum defined supply potentials. This implies that there is no import flexibility left is case of a disruption event.
DZ LNG LY NO RU EU production
1,214 GWh/d 2,500 GWh/d 208 GWh/d 3,677 GWh/d 5,473 GWh/d 3,388 GWh/d
110 mcm/d 227 mcm/d 19 mcm/d 334 mcm/d 498 mcm/d 308 mcm/d
Demand
No country is exposed to demand curtailment.
Exports to Ukraine (UA) and transits to Turkey and Kaliningrad can be maintained.

ENTSOG Union-wide SoS simulation report
Page 23 of 68
Reference Scenario
Reference case
2-week / 20 years – simulated from 15 to 28 February
Supply
Storages: used at their maximum withdrawal capacities in AT, BG, ES, HR, DK, RO, SK. In other countries, still additional usage possible.
Pipeline and LNG supplies: used at their maximum potential.
DZ LNG LY NO RU EU production
1,391 GWh/d 2,500 GWh/d 303 GWh/d 4,100 GWh/d 6,238 GWh/d 5, 062 GWh/d
126 mcm/d 227 mcm/d 28 mcm/d 373 mcm/d 567 mcm/d 460 mcm/d
LNG tanks: In total LNG tanks can provide up to 28.3 TWh of flexibility that can be used within the limits of the capacities from the individual LNG terminals (around 6 TWh/d).
Demand
Infrastructure limitations: DK and SE are exposed to less than 2% demand curtailment.
Reduced production for DK, storage withdrawal low due to low fill level (33%) and capacity from DE fully used (100 GWh/d from DEg).
Context: The simulation results in the reference case show that Denmark and Sweden will experience demand
curtailment even in the 2-week case and design case. This result is based on the supply situation with no supply from
off-shore production Tyra and the current firm entry capacity from Germany (Ellund). The supply capacity is compared
with the 2017/2018 prognoses for the consumption in Denmark.
It must be noticed on the supply side that OGE offers additional extra firm exit capacity at Ellund towards Denmark
from January 2019 and that the Danish biogas production on the gas-grid is not taken into account. Furthermore, the
consumption in Denmark is expected to be lower in the tight period during Tyra-renovation in December 2019 to
March 2022. Please note that these remarks would mitigate the tight supply situation for DK and SE, especially during
the Tyra renovation.
Further sensitivity analysis is ongoing to assess the situation from December 2019 on.
Exports to UA and transits to Turkey and Kaliningrad can be maintained.

ENTSOG Union-wide SoS simulation report
Page 24 of 68
Reference Scenario
Reference case
Peak day / 20 years – simulated on 15 February
Supply
Storages: used at their maximum withdrawal capacities in AT, BE, BG, CZ, DK, FR, HR, HU, LV, NL, RO, SE.
Pipeline and LNG supplies:
The pipeline and LNG supplies are completely used up to the defined volumes:
DZ LNG LY NO RU EU production
1,391 GWh/d 6,082 GWh/d 303 GWh/d 4,100 GWh/d 6,238 GWh/d 5,062 GWh/d 126 mcm/d 553 mcm/d 28 mcm/d 373 mcm/d 567 mcm/d 460 mcm/d
Demand
Infrastructure limitations: DK and SE are exposed to 7% demand curtailment.
Reduced production for DK, storage withdrawal low due to low fill level (33%) and capacity from DE fully used (100 GWh/d from DEg)
Context: The simulation results in the reference case show that Denmark and Sweden will experience demand
curtailment even in the 2-week case and design case. This result is based on the supply situation with no supply from
off-shore production Tyra and the current firm entry capacity from Germany (Ellund). The supply capacity is compared
with the 2017/2018 prognoses for the consumption in Denmark.
It must be noticed on the supply side that OGE offers additional extra firm exit capacity at Ellund towards Denmark
from January 2019 and that the Danish biogas production on the gas-grid is not taken into account. Furthermore, the
consumption in Denmark is expected to be lower in the tight period during Tyra-renovation in December 2019 to
March 2022. Please note that these remarks would mitigate the tight supply situation for DK and SE, especially during
the Tyra renovation.
Further sensitivity analysis is ongoing to assess the situation from December 2019 on.
Exports to UA and transits to Turkey and Kaliningrad can be maintained.

ENTSOG Union-wide SoS simulation report
Page 25 of 68
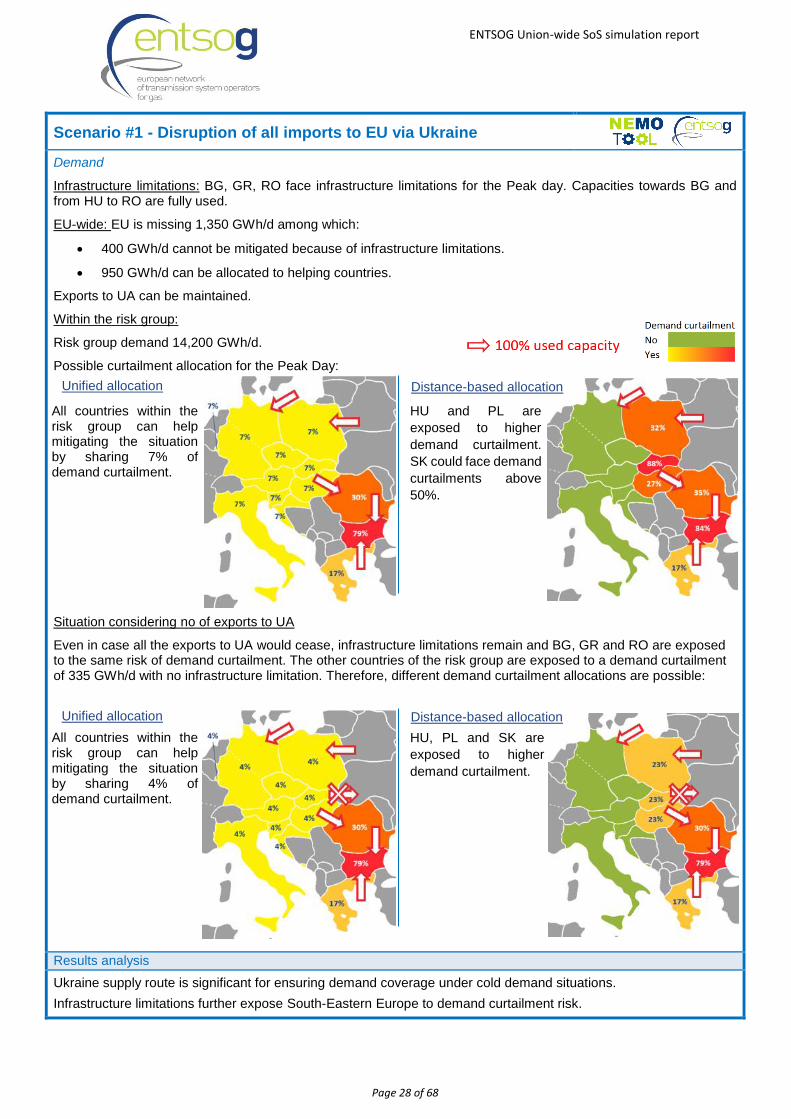
Scenario #1 - Disruption of all imports to EU via Ukraine
Risk group: Eastern gas supply – Ukraine
Austria, Bulgaria, Croatia, Czech Republic, Germany, Greece, Hungary, Italy, Luxembourg, Poland, Romania, Slovenia, Slovakia
Scenario duration: 2 months (1 January – 28 February)
Simulation results
January - March
Supply
Storages: Higher use of storages in January and February (around +100 TWh).
Pipeline and LNG supplies: The flows of Russian gas are increased via Belarus and Nord Stream. These two transit routes are used up to the technical maximum. The overall flows of Russian gas are reduced to around 3,400 GWh/d (~60% of Reference case) which is limited by the capacities of the transit via Belarus and the Nord Stream (both routes are used to the technical maximum) and the imports to the Baltic States and Finland (flows are following the requirement from the gas demand). The imports from other sources cannot be increased as already used to their maximum due to the demand situation.
Demand
EU: demand curtailment for BG and RO due to infrastructure limitations.
Infrastructure limitations:
Exposition to demand curtailment in BG (71%), RO (9% in February only) and GR (2% in February only) due to infrastructure limitations: capacities towards BG are fully used in January and February, and capacities from HU to RO fully used in February.
No neighbouring country can help mitigating the situation as the curtailment is infrastructure related.
-140 GWh/d
(-13 mcm/d)

ENTSOG Union-wide SoS simulation report
Page 26 of 68
Scenario #1 - Disruption of all imports to EU via Ukraine
2-week / 20 years – simulated from 15 to 28 February
Supply
Storages: used at their maximum withdrawal capacities.
Pipeline and LNG supplies: The overall flows of Russian gas are reduced to around 3,600 GWh/d (~60% of Reference case) which is limited by the capacities of the transit via Belarus and the Nord Stream (both routes are used to the technical maximum) and the imports to the Baltic States and Finland (flows are following the requirement from the gas demand).
LNG tanks: necessary to provide extra LNG capacity during both weeks.
Demand
Infrastructure limitations:
Capacities towards BG, from HU to RO, from SI to HR (2nd week) and AT to HU (2nd week) are fully used.
EU-wide:
For each day of the 2 weeks EU is missing 450 GWh/d, among which:
• 350 GWh/d cannot be mitigated because of infrastructure limitations.
• 100 GWh/d can be allocated to helping countries representing less than 1% of their demand.
Within the risk group:
Risk group demand Demand curtailment week 1 Demand curtailment week 2
13,300 GWh/d 350 GWh/d 450 GWh/d
Possible curtailment allocation for the 2nd week:
-350 GWh/d
(-32 mcm/d)
-100 GWh/d
(-9 mcm/d)
AT, CZ, DE, PL, LU, IT, SK can help mitigating the situation with less than 1% of demand curtailment.
PL, SK and HU
could face demand
curtailment around
5%.
Unified allocation Distance-based allocation

ENTSOG Union-wide SoS simulation report
Page 27 of 68
Scenario #1 - Disruption of all imports to EU via Ukraine
Situation considering restriction in exports to UA
In case of exports to UA restricted from their reference value of 416 GWh/d (38 mcm/d) down to 300 GWh/d (27 mcm/d) and below, countries of the risk group are not exposed to demand curtailment except BG and RO that cannot be helped further because of infrastructure limitations.
Peak day / 20 years – simulated on 15 February
Supply
Storages: used at their maximum withdrawal capacities in AT, BE (H), BG, CZ, DE, DK, ES, FR, HR, HU, IT, LV, NL, PL, RO, SE, SK, UK.
Pipeline and LNG supplies: The overall flows of Russian gas are reduced to around 3,600 GWh/d (~60% of Reference case) which is limited by the capacities of the transit via Belarus and the Nord Stream (both routes are used to the technical maximum) and the imports to the Baltic States and Finland (flows are following the requirement from the gas demand).
-950 GWh/d
(-86 mcm/d)
-400 GWh/d
(-36 mcm/d)
ENTSOG Union-wide SoS simulation report
Page 28 of 68
Scenario #1 - Disruption of all imports to EU via Ukraine
Demand
Infrastructure limitations: BG, GR, RO face infrastructure limitations for the Peak day. Capacities towards BG and from HU to RO are fully used.
EU-wide: EU is missing 1,350 GWh/d among which:
• 400 GWh/d cannot be mitigated because of infrastructure limitations.
• 950 GWh/d can be allocated to helping countries.
Exports to UA can be maintained.
Within the risk group:
Risk group demand 14,200 GWh/d.
Possible curtailment allocation for the Peak Day:
Situation considering no of exports to UA
Even in case all the exports to UA would cease, infrastructure limitations remain and BG, GR and RO are exposed to the same risk of demand curtailment. The other countries of the risk group are exposed to a demand curtailment of 335 GWh/d with no infrastructure limitation. Therefore, different demand curtailment allocations are possible:
Results analysis
Ukraine supply route is significant for ensuring demand coverage under cold demand situations.
Infrastructure limitations further expose South-Eastern Europe to demand curtailment risk.
All countries within the risk group can help mitigating the situation by sharing 7% of demand curtailment.
HU and PL are
exposed to higher
demand curtailment.
SK could face demand
curtailments above
50%.
Unified allocation Distance-based allocation
All countries within the risk group can help mitigating the situation by sharing 4% of demand curtailment.
HU, PL and SK are
exposed to higher
demand curtailment.
Unified allocation Distance-based allocation

ENTSOG Union-wide SoS simulation report
Page 29 of 68
Scenario #2 - Disruption of all imports to EU via Belarus
Risk group: Eastern gas supply – Belarus
Czech Republic, Belgium, Estonia, Germany, Latvia, Lithuania, Luxembourg, Netherlands, Poland, Slovakia
Scenario duration: 2 months (1 January – 28 February)
Simulation results
January - March
Supply
Storages: similar usage.
Pipeline and LNG supplies: LNG flows to Poland and Lithuania. Gas is flowing from Germany to Poland via all
connections, transport direction changes. A further increase of these flows would still be possible.
The overall flows of Russian gas stays on a similar level, transit via Ukraine and Nord Stream are increased. Nord Stream and Ukrainian transits to both Poland and Slovakia are used completely while there is still more capacity available towards Hungary and Romania.
Demand
No demand curtailment.

ENTSOG Union-wide SoS simulation report
Page 30 of 68
Scenario #2 - Disruption of all imports to EU via Belarus
2-week / 20 years – simulated from 15 to 28 February
Supply Storages: Higher storage withdrawal rate in Poland.
Pipeline and LNG supplies: Increased flows from CZ to PL up to maximum capacity. Flow from Germany to Poland
completely used reverting the flow direction from the reference case.
The overall flows of Russian gas are slightly reduced to around 6,000 GWh/d (~96% of Reference case), the transit via Ukraine and the Nord Stream are increased. The Nord Stream and the Ukrainian transits to Hungary, Poland, Romania and Slovakia are used completely.
LNG tanks: Additional LNG flows from the tanks and cargos to LT and PL up to the maximum capacity.
Demand No demand curtailment.
Peak day / 20 years – simulated on 15 February
Supply
Storages: The lower storage levels in LV allow only for a reduced withdrawal rate.
Pipeline and LNG supplies: No change for LNG. Flow from Germany to Poland completely used reverting the flow
direction from the reference case.
The overall flows of Russian gas are slightly reduced to around 6,000 GWh/d (~97% of Reference case), the transit via Ukraine and the Nord Stream are increased. The Nord Stream and the Ukrainian transits to Hungary, Poland, Romania and Slovakia are used completely.
Demand
EU: 2% in the Baltic states (EE, LT, LV) demand curtailment due to infrastructure limitations (no connection to other countries).
No neighbouring country can help further mitigating the situation as the curtailment is infrastructure related.
-8 GWh/d
(-0.7 mcm/d)

ENTSOG Union-wide SoS simulation report
Page 31 of 68
Scenario #3 - Disruption of one offshore pipeline of Nord Stream
50% of Nord Stream capacity
Risk group: Eastern gas supply - Baltic sea
Austria, Belgium, Czech Republic, Denmark, France, Germany, Luxembourg, Netherlands, Slovakia, Sweden
Scenario duration: 2 months (1 January – 28 February)
Simulation results
January - March
Supply
Storages: additional withdrawal (including DK).
Pipeline and LNG supplies: Increase of Russian supply via BY and UA. The overall supply from Russia stays on a
similar level.
Additional capacities to GASPOOL market area in DE are still available from BE, CZ, NL and PL.
Demand
No demand curtailment.

ENTSOG Union-wide SoS simulation report
Page 32 of 68
Scenario #3 - Disruption of one offshore pipeline of Nord Stream
50% of Nord Stream capacity
2-week / 20 years – simulated from 15 to 28 February
Supply Storages: similar usage as the reference scenario.
Pipeline and LNG supplies: Increase of Russian supply via BY and UA. Still more flow from CZ and PL to DE possible.
Demand
No additional demand curtailment (DK and SE are exposed to less than 2% demand curtailment in the reference case).
Peak day / 20 years – simulated on 15 February
Supply
Storages: similar usage as the reference scenario.
Pipeline and LNG supplies: Increase of Russian gas via BY and UA. Yamal route to Germany used to maximum. Additional capacities to GASPOOL market area in DE still available from BE, CZ and NL.
Demand
No additional demand curtailment (DK and SE are exposed to 7% demand curtailment in the reference case).

ENTSOG Union-wide SoS simulation report
Page 33 of 68
Scenario #4 - Disruption of the onshore receiving facility of Nord Stream
(Greifswald station)
Risk group: Eastern gas supply – Baltic Sea
Austria, Belgium, Czech Republic, Denmark, France, Germany, Luxembourg, Netherlands, Slovakia, Sweden
Scenario duration: 2 weeks (15 February – 28 February)
Simulation results
January - March
Supply Pipeline and LNG supplies: During the disruption, flows from Russia are reduced compared to the reference case by
around 5% but this can be compensated by higher imports later on. Increase of Russian gas via BY (maximum level
towards Poland) and UA (maximum towards HU, PL, and SK).
More flows to GASPOOL from Poland, no flows from CZ. Additional capacities to GASPOOL area in DE still available
from BE, CZ, NL and PL.
Demand
No demand curtailment.

ENTSOG Union-wide SoS simulation report
Page 34 of 68
Scenario #4 - Disruption of the onshore receiving facility of Nord Stream
(Greifswald station)
2-week / 20 years – simulated from 15 to 28 February
Supply Storages: increased storage withdrawal.
Pipeline and LNG supplies: Increase of Russian supply via BY and UA. Since capacity limits are reached, the overall
imports of Russian gas are reduced by 7% to around 5,800 GWh/d. This is compensated mostly by increased storage
withdrawal. No more gas flows from CZ to GASPOOL but from GASPOOL to CZ partially replacing the flows through
OPAL. Additional capacities to GASPOOL area in DE still available from BE, CZ, and NL.
Demand No additional demand curtailment. (DK and SE are exposed to less than 2% demand curtailment in the reference case)
Peak day / 20 years – simulated on 15 February
Supply Storages: Increased storage withdrawal.
Pipeline and LNG supplies: Increase of Russian gas via BY and UA. Since capacity limits are reached the overall
import of Russian gas are reduced by 6% to around 5,900 GWh/d. No more gas flows from CZ to GASPOOL but from
GASPOOL to CZ partially replacing the flows through OPAL. Additional capacities to GASPOOL area in DE still
available from BE, CZ, and NL.
Demand No additional demand curtailment. (DK and SE are exposed to 7% demand curtailment in the reference case)

ENTSOG Union-wide SoS simulation report
Page 35 of 68
Scenario #5 - Disruption of all imports to the Baltic states and Finland
Risk group: Eastern gas supply – North-Eastern
Estonia, Finland, Latvia, Lithuania
Scenario duration: 2 months (1 January – 28 February)
Simulation results
January - March
Supply
Storages: Higher storage withdrawal in LV.
Pipeline and LNG supplies: LNG flows to Lithuania, still capacity available.
Demand 100% disruption in FI due to infrastructure limitation (no connection to any other country).
-140 GWh/d
(-13 mcm/d)

ENTSOG Union-wide SoS simulation report
Page 36 of 68
Scenario #5 - Disruption of all imports to the Baltic states and Finland
2-week / 20 years – simulated from 15 to 28 February
Supply Storages: increased storage withdrawal.
Demand 100% disruption in FI due to infrasructure limitations (no connection to any other country).
EE, LT, LV less than 2% in week 2 due to infrastructure limitations (no connection to other countries).
Peak day / 20 years – simulated on 15 February
Supply Storages: Storage withdrawal in LV is limited by withdrawal curve due to low fill level, leads to a lower storage
withdrawal than in the reference case.
Pipeline and LNG supplies: No change for LNG to LT, use of maximum capacity.
Demand 14% demand curtailment in EE, LT, LV due to infrasructure limitations (no connection to other countries).
100% demand curtailment in FI due to infrasructure limitations (no connection to any other country).
Information
Demand curtailment in Finland is presented excluding the country-specific possibility in terms of use of back-up fuels for gas.
-220 GWh/d
(-20 mcm/d)
-320 GWh/d
(-29 mcm/d)

ENTSOG Union-wide SoS simulation report
Page 37 of 68
Scenario #6 - Disruption of the largest infrastructure to the Balkan region (RO –BG –GR)
Risk group: Eastern gas supply – Trans-Balkan
Bulgaria, Greece, Romania
Scenario duration: 2 weeks (15 February – 28 February)
Simulation results
January - March
Supply Pipeline and LNG supplies: More transits to Romania from Ukraine in Tekovo.
No more flows from Bulgaria to Greece. As in Reference no flows from Hungary to Romania.
Higher use of LNG terminals in Greece up to maximum capacity.
Higher imports of gas in Kipi up to maximum capacity.
Demand Demand curtailment in BG (72%) and GR (less than 2%) due to Infrastructure limitations: capacities towards BG are
fully used.
-100 GWh/d
(-9 mcm/d)

ENTSOG Union-wide SoS simulation report
Page 38 of 68
Scenario #6 - Disruption of the largest infrastructure to the Balkan region (RO –BG –GR)
2-week / 20 years – simulated from 15 to 28 February
Supply Storages: increased storage withdrawal. Pipeline and LNG supplies: No more flows from Bulgaria to Greece. Less flows from Hungary to Romania.
Higher use of LNG terminals in Greece up to maximum capacity. Higher imports of gas in Kipi up to maximum capacity.
Demand Demand curtailment in BG (77%) and GR (less than 2%) due to Infrastructure limitations: capacities towards BG are
fully used.
Peak day / 20 years – simulated on 15 February
Supply Storages: More transits to Romania from Ukraine in Tekovo.
Pipeline and LNG supplies: No more flows from Bulgaria to Greece. As in Reference flows from Hungary to Romania. Higher imports of gas in Kipi up to maximum capacity.
Demand Demand curtailment in BG (79%) and GR (less than 17%) due to infrastructure limitations: capacities towards BG are
fully used.
-140 GWh/d
(-13 mcm/d)
-216 GWh/d
(-20 mcm/d)

ENTSOG Union-wide SoS simulation report
Page 39 of 68
Scenario #7 - Disruption of the largest offshore infrastructure to the UK Technical disruption of Langeled pipeline
Risk group: North Sea gas supply – Norway
Belgium, Denmark, France, Germany, Ireland, Italy, Luxembourg, Netherlands, Portugal, Spain, Sweden, United Kingdom
Scenario duration: 2 months (1 January – 28 February)
Simulation results
January - March
Supply
Pipeline and LNG supplies: Less imports from NO to UK. Other import points for Norwegian gas show an increased
flow up to the maximum capacity.
More LNG imports to UK. Higher use of BBL and Interconnector UK with still capacity available.
Demand No demand curtailment.

ENTSOG Union-wide SoS simulation report
Page 40 of 68
Scenario #7 - Disruption of the largest offshore infrastructure to the UK Technical disruption of Langeled pipeline
2-week / 20 years – simulated from 15 to 28 February
Supply Pipeline and LNG supplies: Less imports from NO to UK. Other import points for Norwegian gas (Dornum,
Zeebrugge) show an increased flow up to the maximum capacity.
More LNG regasification in UK. Higher use of BBL and Interconnector UK with still capacity available.
Demand No additional demand curtailment compared to the reference scenario.
Peak day / 20 years – simulated on 15 February
Supply Storages: Higher storage withdrawal in the UK.
Pipeline and LNG supplies: More transits to Romania from Ukraine in Tekovo. Less imports from NO to UK. Other
import points for Norwegian gas (Dornum, Zeebrugge) show an increased flow up to the maximum capacity.
LNG terminals are used completely as in reference case. More flows via the BBL and the Interconnector UK. Still
capacity available via the BBL.
Demand No additional demand curtailment compared to the reference scenario.

ENTSOG Union-wide SoS simulation report
Page 41 of 68
Scenario #8 - Disruption of the largest offshore infrastructure to continental EU (EUROPIPE II)
Risk group: North Sea gas supply – Norway
Belgium, Denmark, France, Germany, Ireland, Italy, Luxembourg, Netherlands, Portugal, Spain, Sweden, United Kingdom
Scenario duration: 2 months (1 January – 28 February)
Simulation results
January - March
Technical disruption of Europipe II pipeline (72.1 MSCM/d), Europipe I with 45.7 MSCM/d remains operational.
Supply Storages: Higher withdrawal from storages.
Pipeline and LNG supplies: Imports from Norway reduced due to the reduced import capacity.
More LNG flows to the Netherlands.
Demand No demand curtailment.

ENTSOG Union-wide SoS simulation report
Page 42 of 68
Scenario #8 - Disruption of the largest offshore infrastructure to continental EU (EUROPIPE II)
2-week / 20 years – simulated from 15 to 28 February
Supply Storages: Higher withdrawal from storages.
Pipeline and LNG supplies: Imports from Norway reduced due to the reduced import capacity.
Demand No additional demand curtailment compared to the reference scenario.
Peak day / 20 years – simulated on 15 February
Supply Storages: Higher withdrawal from storages.
Pipeline and LNG supplies: Imports from Norway reduced due to the reduced import capacity.
Demand No additional demand curtailment compared to the reference scenario.

ENTSOG Union-wide SoS simulation report
Page 43 of 68
Scenario #9 - Disruption of the largest onshore infrastructure from Norway
Technical disruption of Emden station
Risk group: North Sea gas supply – Norway
Belgium, Denmark, France, Germany, Ireland, Italy, Luxembourg, Netherlands, Portugal, Spain, Sweden, United Kingdom
Scenario duration: 2 weeks (15 February – 28 February)
Simulation results
January - March
Supply Pipeline and LNG supplies: Higher imports of Norwegian gas in Dornum, France, Belgium and UK. Overall less
imports from Norway due to the reduced capacity.
Higher LNG imports to the Netherlands.
Demand No demand curtailment.
Note: no additional curtailment is observed when considering the capacity restriction of the TENP pipeline
announced on 27 September 2017.

ENTSOG Union-wide SoS simulation report
Page 44 of 68
Scenario #9 - Disruption of the largest onshore infrastructure from Norway
Technical disruption of Emden station
2-week / 20 years – simulated from 15 to 28 February
Supply Storages: Higher withdrawal from storages.
Pipeline and LNG supplies: Overall less imports from Norway due to the reduced capacity.
Higher LNG imports to the Netherlands.
Demand No additional demand curtailment compared to the reference scenario.
Note: no additional curtailment is observed when considering the capacity restriction of the TENP pipeline
announced on 27 September 2017.
Peak day / 20 years – simulated on 15 February
Supply Storages: Higher withdrawal from storages.
Pipeline and LNG supplies: Overall less imports from Norway due to the reduced capacity.
Higher flows from the Netherlands to GASPOOL market area in Germany, still below capacity.
Demand No additional demand curtailment compared to the reference scenario.
Note: no additional curtailment is observed when considering the capacity restriction of the TENP pipeline
announced on 27 September 2017.

ENTSOG Union-wide SoS simulation report
Page 45 of 68
Scenario #10 - Disruption of the largest L-gas storage (UGS Norg – The Netherlands)
North Sea gas supply – Low calorific gas: UGS Norg
Following the discussion in the Gas Coordination Group of 21 June 2017, helped by a timeline prepared by ENTSOG,
the involved TSOs of the Gas Platform have prepared the L-gas scenario. The coordinators of the involved members
states (Belgium, France, Germany and the Netherlands) of the Gas Platform have agreed upon the L-gas scenario.
Scenario #10 Disruption of the largest L-gas storage (UGS Norg – The Netherlands)
Gas Platform
Risk group: Low Calorific Gas
Germany, Belgium, France, The Netherlands
Scenario duration: 2-week and peak
Simulation results
2-week
2-week period during a cold spell (coldest period of two weeks of the last 20 years, reference period used in simulations: December 27 1996 – January 9, 1997).
Supply
Increased production of (mainly) Groningen field within the boundaries set by the Dutch government and pseudo L-gas
production (enrichment and quality conversion).
Demand
No demand curtailment.
Dutch domestic demand can be supplied and exports to Germany, Belgium and France can be maintained.
The Gas Platform is the regional cooperation for gas for Belgium, France, Germany, Luxembourg and the Netherlands. It is an intergovernmental initiative where ministries responsible for energy policy discuss issues related to security of supply and market integration, in close cooperation with the National Regulatory Authorities and Transmission System Operators. Ad hoc, the European Commission or other European authorities participate as observer. The Benelux Secretariat provides support.

ENTSOG Union-wide SoS simulation report
Page 46 of 68
Scenario #10 Disruption of the largest L-gas storage (UGS Norg – The Netherlands)
Gas Platform
Risk group: Low Calorific Gas
Germany, Belgium, France, The Netherlands
Scenario duration: 2-week and peak
Simulation results
Peak day
The peak is considered at minus 17°C (effective temperature at weather station De Bilt, The Netherlands), because this temperature is used as the design temperature of the transmission system in The Netherlands (reference day used in simulation: January 14, 1987)
Supply
Increased production of (mainly) Groningen field within the boundaries set by the Dutch government and pseudo L-gas
production (enrichment and quality conversion).
Demand
No demand curtailment.
Dutch domestic demand can be supplied and exports to Germany, Belgium and France can be maintained.
Results analysis
Sufficient compensation available within The Netherlands
Scenario #11 – Disruption of the L-gas supply
Further scenarios with regard to the L-gas supply will be developed within the framework of the Gas Platform and communicated later.

ENTSOG Union-wide SoS simulation report
Page 47 of 68
Scenario #12 - Disruption of the largest infrastructure to Denmark
Technical disruption of Ellund
Risk group: North Sea gas supply – Denmark
Denmark, Luxembourg, Netherlands, Germany, Sweden
Scenario duration: 2 weeks (15 February – 28 February)
Simulation results
January - March
Supply Storages: Increased storage withdrawal in DK and SE.
Pipeline and LNG supplies: No more flows from Germany leads to limited NP production and storage being the only
supply sources for DK and SE.
Demand No demand curtailment.

ENTSOG Union-wide SoS simulation report
Page 48 of 68
Scenario #12 - Disruption of the largest infrastructure to Denmark
Technical disruption of Ellund
2-week / 20 years – simulated from 15 to 28 February
Supply Storages: Storages in DK and SE can increase the storage withdrawal until they reach the capacity limit due to the
withdrawal curve.
Pipeline and LNG supplies: No more flows from Germany leads to limited NP production and storage being the only
supply sources for DK and SE.
Demand Demand curtailment in DK and SE around 35%.
Peak day / 20 years – simulated on 15 February
Supply Storages: Storage in DK could not be used more as it is already reaching the maximum from the withdrawal curve.
Pipeline and LNG supplies: No more flows from Germany leads to limited NP production and storage the only supply
sources for DK.
Demand Demand curtailment in DK and SE (40%).
-100 GWh/d
(-9 mcm/d)
-125 GWh/d
(-11 mcm/d)

ENTSOG Union-wide SoS simulation report
Page 49 of 68
Scenario #13 - Disruption of the largest offshore production infrastructure from the UK
Technical disruption of Forties Pipeline system
Risk group: North Sea gas supply – United-Kingdom
Belgium, Germany, Ireland, Luxembourg, Netherlands, United Kingdom
Scenario duration: 2 months (1 January – 28 February)
Simulation results
January - March
Supply Storages: higher withdrawal from storages.
Pipeline and LNG supplies: Less NP to UK, higher flows from Norway, LNG imports increased. Increased flows
through BBL and IUK. Still capacities available for all of these import options to the UK.
Demand No demand curtailment.

ENTSOG Union-wide SoS simulation report
Page 50 of 68
Scenario #13 - Disruption of the largest offshore production infrastructure from the UK
Technical disruption of Forties Pipeline system
2-week / 20 years – simulated from 15 to 28 February
Supply Storages: Storage withdrawal in the UK is increased.
Pipeline and LNG supplies: Less NP to UK, higher flows from Norway up to maximum capacity, LNG increased with
capacity still available. Increased flows through BBL and IUK with capacity still available.
Demand No demand curtailment.
Peak day / 20 years – simulated on 15 February
Supply Storages: Storage withdrawal in the UK is increased.
Pipeline and LNG supplies: Less NP to UK, as in reference case the imports from NO and LNG are used to the max
as well the IUK. Increased flows via BBL with still capacity available.
Demand No demand curtailment.
ENTSOG Union-wide SoS simulation report
Page 51 of 68
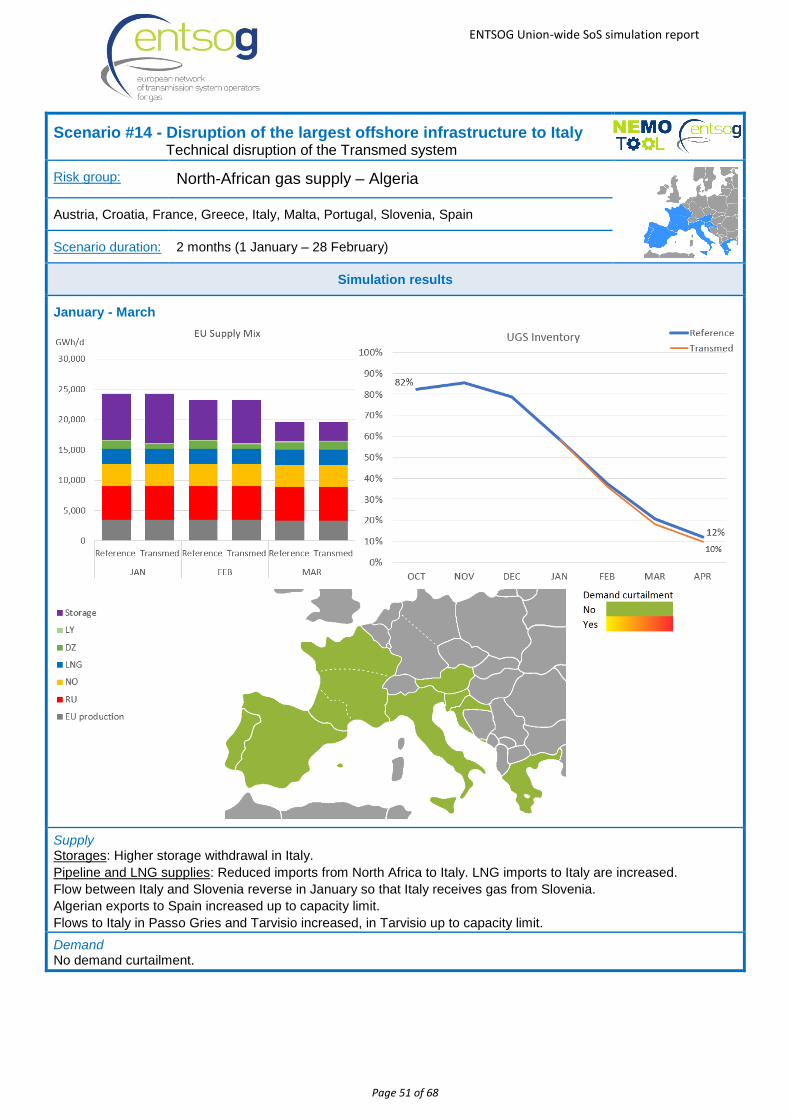
Scenario #14 - Disruption of the largest offshore infrastructure to Italy Technical disruption of the Transmed system
Risk group: North-African gas supply – Algeria
Austria, Croatia, France, Greece, Italy, Malta, Portugal, Slovenia, Spain
Scenario duration: 2 months (1 January – 28 February)
Simulation results
January - March
Supply Storages: Higher storage withdrawal in Italy.
Pipeline and LNG supplies: Reduced imports from North Africa to Italy. LNG imports to Italy are increased.
Flow between Italy and Slovenia reverse in January so that Italy receives gas from Slovenia.
Algerian exports to Spain increased up to capacity limit.
Flows to Italy in Passo Gries and Tarvisio increased, in Tarvisio up to capacity limit.
Demand No demand curtailment.

ENTSOG Union-wide SoS simulation report
Page 52 of 68
Scenario #14 - Disruption of the largest offshore infrastructure to Italy Technical disruption of the Transmed system
2-week / 20 years – simulated from 15 to 28 February
Supply Storages: Higher storage withdrawal in Italy
Pipeline and LNG supplies: Reduced imports from North Africa to Italy.
Algerian exports to Spain increased up to capacity limit.
Demand No demand curtailment
Peak day / 20 years – simulated on 15 February
Supply Storages: Lower storage withdrawal in Italy due to low filling level caused by the higher withdrawal during January
and February.
Pipeline and LNG supplies: Reduced imports from North Africa to Italy.
As in reference LNG regasification up to maximum capacity.
Flows to Italy in Passo Gries and Tarvisio increased to maximum capacity.
Demand No demand curtailment.
Results analysis
Italy’s access to diversified supply sources prevent it from being impacted by Transmed disruption.

ENTSOG Union-wide SoS simulation report
Page 53 of 68
Scenario #15 - Disruption of the largest offshore infrastructure to Spain
Technical disruption of the MEG system
Risk group: North-African gas supply – Algeria
Austria, Croatia, France, Greece, Italy, Malta, Portugal, Slovenia, Spain
Scenario duration: 2 months (1 January – 28 February)
Simulation results
January - March
Supply Pipeline and LNG supplies: Reduced imports from Algeria to Spain only via Medgaz pipeline. More Algerian gas
exported towards Italy.
Higher LNG imports to Spain.
Demand No demand curtailment.

ENTSOG Union-wide SoS simulation report
Page 54 of 68
Scenario #15 - Disruption of the largest offshore infrastructure to Spain
Technical disruption of the MEG system
2-week / 20 years – simulated from 15 to 28 February
Supply Storages: Higher storage withdrawal in Italy
Pipeline and LNG supplies: Reduced imports from Algeria to Spain only via Medgaz pipeline. More Algerian gas
exported towards Italy.
Higher LNG imports to Portugal and Spain.
Demand No demand curtailment
Peak day / 20 years – simulated on 15 February
Supply Pipeline and LNG supplies: Imports from Algeria to Spain only via Medgaz pipeline used up to the maximum.
As in Reference the regasification capacity from the terminals can be used up to the maximum.
Demand No demand curtailment.
Results analysis
In case of a 2-month disruption of the MEG system, LNG terminals in Spain offer sufficient flexibility to mitigate the
situation, while extra flexibility is still available at interconnections.

ENTSOG Union-wide SoS simulation report
Page 55 of 68
Scenario #16 - Disruption of all imports from Algeria including LNG
Risk group: North-African gas supply – Algeria
Austria, Croatia, France, Greece, Italy, Malta, Portugal, Slovenia, Spain
Scenario duration: 2 months (1 January – 28 February)
Simulation results
January - March
Specificity of scenario #16 - Algerian disruption:
Disruption scenario #16 considers the disruptions of the imports from Algeria via both pipelines and LNG cargos.
However, different supply assumptions are made regarding pipelines, that cannot physically be rerouted, and LNG,
to consider that additional cargos can come from different suppliers. Therefore, it is assumed that a period of 3 weeks
is necessary to attract more LNG cargos to substitute the Algerian LNG (see table 3 for more details).
Supply
Storages: Higher use of storages in January and February (around 60 TWh).
Pipeline and LNG supplies: Flow from France to Spain increased compared to reference (up to 66% of the capacity).
LNG tanks: Gas from LNG tanks is used to compensate the missing LNG cargos during the first 3 weeks (total 28 TWh).
-10 GWh/d in January
(-9 mcm/d)

ENTSOG Union-wide SoS simulation report
Page 56 of 68
Scenario #16 - Disruption of all imports from Algeria including LNG
Demand
EU: no demand curtailment except for GR due to infrastructure limitations.
Infrastructure limitations:
During first three weeks GR is exposed to 5% demand curtailment due to infrastructure limitations: capacity from BG
to GR is fully used)
From week 4 on, no demand curtailment is observed.
2-week / 20 years – simulated from 15 to 28 February
Supply
Storages: UGS are used at their maximum withdrawal capacities except for FR, DE, IT, PT and UK.
Pipeline and LNG supplies: capacities from AT to IT are used at their maximum
LNG tanks: at EU level, a minimum of 12 TWh of LNG is necessary in the tanks at the beginning of the 2-week event (17% of the total EU capacity of the tanks) to avoid demand curtailment during a 2-week in 20 years situation.
Demand
No demand curtailment considering a minimum volume of 12 TWh (1.1 bcm) available in the LNG tanks at the beginning of the 2-week event.

ENTSOG Union-wide SoS simulation report
Page 57 of 68
Scenario #16 - Disruption of all imports from Algeria including LNG
Peak day / 20 years – simulated on 15 February
Supply
Storages: all storages are used at their maximum withdrawal capacities except AT, DE and UK.
Pipeline and LNG supplies: All supplies are used at their maximum potential.
LNG tanks: tanks are used to satisfy the higher demand.
Demand
Infrastructure limitations:
IT, HR and SI are exposed to little demand curtailment because of infrastructure limitations.
Capacities towards IT and from AT to SI are fully used during the Peak day.
EU-wide:
Demand curtailment: 150 GWh/d due to infrastructure limitations (0.5% of EU demand)
Within the risk group:
Demand curtailment is around 1% of the risk group demand (12,000 GWh/d).
Results analysis
A high fill level of LNG tanks can help mitigating spontaneous risks and delays for new LNG to arrive
-150 GWh/d
(-14 mcm/d)

ENTSOG Union-wide SoS simulation report
Page 58 of 68
Scenario #17 - Disruption of the largest offshore infrastructure to Italy
Technical disruption of Green Stream
Risk group: North-African gas supply – Libya
Austria, Croatia, Italy, Malta, Slovenia
Scenario duration: 2 months (1 January – 28 February)
Simulation results
January - March
Supply Storages: Higher storage withdrawal in Italy.
Pipeline and LNG supplies: Higher imports from Algerian pipe gas to Italy.
Flows from Italy to Switzerland reverse compared to the reference scenario, resulting in a flow from Switzerland to
Italy.
Higher flows from Austria to Italy.
LNG flows to Italy are increased in January and lower in February following the demand evolution.
Demand
No demand curtailment

ENTSOG Union-wide SoS simulation report
Page 59 of 68
Scenario #17 - Disruption of the largest offshore infrastructure to Italy
Technical disruption of Green Stream
2-week / 20 years – simulated from 15 to 28 February
Supply Storages: Higher storage withdrawal in Italy.
Pipeline and LNG supplies: Higher imports from Algerian pipe gas to Italy.
Higher flows from Austria to Italy.
Higher LNG flows to Italy.
Demand
No demand curtailment.
Peak day / 20 years – simulated on 15 February
Supply
Storages: Higher storage withdrawal limited by withdrawal characteristics from the storages.
Pipeline and LNG supplies: Higher imports from Algerian pipe gas to Italy. Higher flows from Austria to Italy.
Reduced flows from Italy to Switzerland.
LNG flows in reference already making use of the maximum regasification capacity.
Demand
No demand curtailment.
Results analysis
A high fill level of LNG tanks can help mitigating spontaneous risks and delays for new LNG to arrive.
77%

ENTSOG Union-wide SoS simulation report
Page 60 of 68
Annexes: data tables

ENTSOG Union-wide SoS simulation report
Page 61 of 68
Annex I: Demand
Average daily demand and exports [GWh/d]
Country OCT NOV DEC JAN FEB MAR 2-week Peak day
AT 302 335 441 414 412 339 471 471
BA 4 6 9 11 7 5 12 16
BEh 404 483 614 718 663 527 883 964
BEl 113 135 171 200 185 147 378 454
BGn 87 107 127 150 128 101 157 173
CH 109 151 184 219 162 119 225 230
CZ 259 303 479 421 432 315 592 727
DEg 912 1,165 1,482 1,384 1,387 1,255 1,572 1,914
DEgL 187 265 397 344 343 286 434 571
DEn 801 1,141 1,710 1,478 1,477 1,229 1,870 2,460
DEnL 398 553 801 703 703 595 871 1,131
DK 66 93 115 126 122 106 190 230
EE 16 22 39 38 31 36 57 70
ES 1,031 1,257 1,281 1,292 1,269 1,135 1,549 1,823
FI 103 114 148 152 131 140 220 240
FRn 781 1,181 1,594 1,376 1,286 1,062 2,112 2,456
FRnL 143 206 265 223 187 150 336 391
FRs 344 550 718 681 633 516 952 1,107
FRt 72 113 154 186 169 133 214 330
GR 125 158 152 186 191 149 191 228
HR 91 121 107 107 145 93 161 175
HU 314 425 539 623 574 443 780 820
IB-RUek - - - - - - - -
IE 146 166 193 202 201 188 220 282
IT 2,139 2,718 3,618 3,590 3,373 2,885 4,122 4,825
LT 76 74 82 98 68 76 128 151
LU 43 46 57 54 53 47 59 72
LV 49 60 89 79 95 70 104 135
MK 8 11 14 17 13 4 19 19
NL 1,189 1,297 1,742 2,058 1,921 1,496 3,454 3,706
PL 460 588 647 746 669 550 929 973
PT 160 180 176 198 181 176 221 252
RO 353 538 528 561 638 458 719 776
RS 62 62 62 62 62 62 95 104
RUk 79 79 79 79 79 79 109 109
SE 23 31 37 43 41 34 86 86
SI 33 40 42 47 46 39 56 62
SK 156 205 269 281 253 229 441 496
TRe 393 393 393 393 393 393 480 480
UAe 363 363 363 363 363 363 416 416
UK 2,450 3,165 3,969 4,325 4,107 3,551 4,403 5,144
UKn 61 66 68 74 72 68 93 94 Table 5: Demand

ENTSOG Union-wide SoS simulation report
Page 62 of 68
Annex II: National production
Average daily production [GWh/d]
Country OCT NOV DEC JAN FEB MAR 2-week Peak day
AT 38 36 40 39 33 33 40 40
BGn 2 2 2 2 2 2 3 3
CZ 4 4 4 4 4 4 5 5
DEg 55 54 54 53 53 52 11 11
DEgL 131 129 128 126 125 123 175 175
DEn 9 9 9 9 9 9 9 9
DEnL -0 -0 -0 -0 -0 -0 -0 -0
DK 7 7 7 7 7 7 7 7
EE -0 -0 -0 -0 -0 -0 -0 -0
FI 0 0 0 0 0 0 0 0
HR 36 36 36 36 36 36 37 37
HU 44 44 44 44 44 44 82 82
IE 97 96 95 94 93 92 97 97
IT 188 188 188 180 187 180 189 189
LU -0 -0 -0 -0 -0 -0 -0 -0
NL 1162 1309 1397 1400 1419 1300 2769 2769
PL 74 74 74 74 74 74 74 74
RO 251 279 297 306 305 284 310 310
SE 1 1 1 1 1 1 2 2
SI -0 -0 -0 -0 -0 -0 -0 -0
SK 3 3 2 2 2 2 3 3
UK 1066 1079 1088 1131 1116 1088 1250 1250 Table 6: National production
ENTSOG Union-wide SoS simulation report
Page 63 of 68
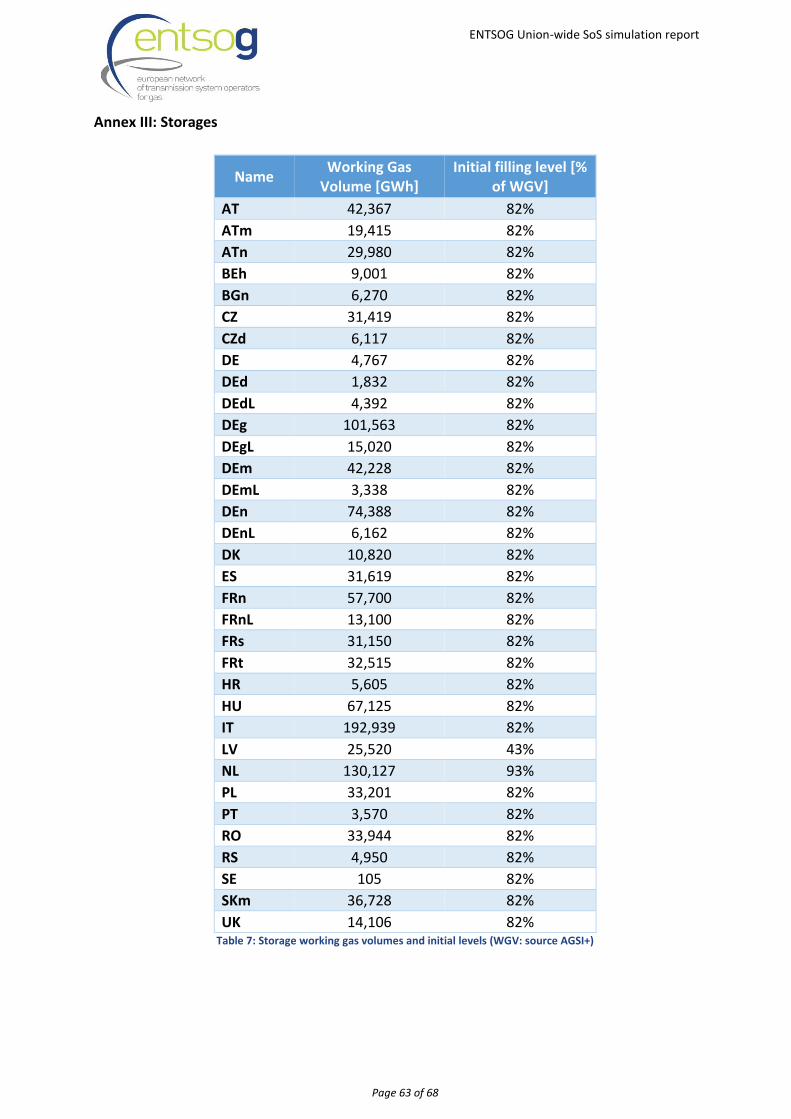
Annex III: Storages
Name Working Gas
Volume [GWh] Initial filling level [%
of WGV]
AT 42,367 82%
ATm 19,415 82%
ATn 29,980 82%
BEh 9,001 82%
BGn 6,270 82%
CZ 31,419 82%
CZd 6,117 82%
DE 4,767 82%
DEd 1,832 82%
DEdL 4,392 82%
DEg 101,563 82%
DEgL 15,020 82%
DEm 42,228 82%
DEmL 3,338 82%
DEn 74,388 82%
DEnL 6,162 82%
DK 10,820 82%
ES 31,619 82%
FRn 57,700 82%
FRnL 13,100 82%
FRs 31,150 82%
FRt 32,515 82%
HR 5,605 82%
HU 67,125 82%
IT 192,939 82%
LV 25,520 43%
NL 130,127 93%
PL 33,201 82%
PT 3,570 82%
RO 33,944 82%
RS 4,950 82%
SE 105 82%
SKm 36,728 82%
UK 14,106 82% Table 7: Storage working gas volumes and initial levels (WGV: source AGSI+)

ENTSOG Union-wide SoS simulation report
Page 64 of 68
UGS inventory Name 100% 99% 90% 80% 70% 60% 50% 40% 30% 20% 10% 0% AT 0% 63% 74% 81% 90% 93% 97% 98% 99% 99% 100% 100%
Inje
ction
availability
ATm 0% 63% 74% 81% 90% 93% 97% 98% 99% 99% 100% 100%
ATn 0% 63% 74% 81% 90% 93% 97% 98% 99% 99% 100% 100%
BEh 0% 37% 50% 50% 100% 100% 100% 100% 100% 100% 100% 100%
BGn 0% 55% 56% 56% 100% 100% 100% 100% 100% 100% 100% 100%
CY 0% 0% 0% 0% 0% 0% 0% 0% 0% 0% 0% 0%
CZ 0% 30% 30% 35% 70% 75% 99% 100% 100% 100% 98% 96%
CZd 0% 55% 63% 70% 81% 87% 94% 96% 98% 99% 100% 100%
DE 0% 50% 59% 69% 80% 88% 97% 98% 99% 99% 100% 100%
DEd 0% 50% 59% 69% 80% 88% 97% 98% 99% 99% 100% 100%
DEdL 0% 50% 59% 69% 80% 88% 97% 98% 99% 99% 100% 100%
DEg 0% 50% 59% 69% 80% 88% 97% 98% 99% 99% 100% 100%
DEgL 0% 50% 59% 69% 80% 88% 97% 98% 99% 99% 100% 100%
DEm 0% 50% 59% 69% 80% 88% 97% 98% 99% 99% 100% 100%
DEmL 0% 50% 59% 69% 80% 88% 97% 98% 99% 99% 100% 100%
DEn 0% 50% 59% 69% 80% 88% 97% 98% 99% 99% 100% 100%
DEnL 0% 50% 59% 69% 80% 88% 97% 98% 99% 99% 100% 100%
DK 0% 56% 61% 68% 79% 85% 93% 96% 98% 99% 100% 100%
EE 0% 0% 0% 0% 0% 0% 0% 0% 0% 0% 0% 0%
ES 0% 55% 85% 90% 90% 90% 95% 100% 100% 100% 100% 100%
FI 0% 0% 0% 0% 0% 0% 0% 0% 0% 0% 0% 0%
FRn 0% 62% 68% 78% 94% 95% 96% 97% 98% 98% 99% 100%
FRnL 0% 62% 68% 78% 94% 95% 96% 97% 98% 98% 99% 100%
FRs 0% 26% 36% 44% 51% 58% 65% 72% 80% 87% 93% 100%
FRt 0% 75% 82% 89% 96% 100% 100% 100% 100% 100% 100% 100%
GR 0% 0% 0% 0% 0% 0% 0% 0% 0% 0% 0% 0%
HR 0% 55% 63% 70% 81% 87% 94% 96% 98% 99% 100% 100%
HU 0% 55% 63% 70% 81% 87% 94% 96% 98% 99% 100% 100%
IE 0% 55% 63% 70% 81% 87% 94% 96% 98% 99% 100% 100%
IT 0% 54% 54% 62% 73% 82% 92% 97% 100% 100% 100% 100%
LT 0% 0% 0% 0% 0% 0% 0% 0% 0% 0% 0% 0%
LV 0% 55% 63% 70% 81% 87% 94% 96% 98% 99% 100% 100%
NL 0% 62% 68% 73% 82% 87% 92% 94% 96% 98% 99% 100%
PL 0% 53% 76% 77% 81% 81% 81% 85% 87% 88% 99% 100%
PT 0% 55% 63% 70% 81% 87% 94% 96% 98% 99% 100% 100%
RO 0% 55% 63% 70% 81% 87% 94% 96% 98% 99% 100% 100%
RS 0% 55% 63% 70% 81% 87% 94% 96% 98% 99% 100% 100%
SE 0% 55% 63% 70% 81% 87% 94% 96% 98% 99% 100% 100%
SI 0% 0% 0% 0% 0% 0% 0% 0% 0% 0% 0% 0%
SKm 0% 55% 63% 70% 81% 87% 94% 96% 98% 99% 100% 100%
UK 0% 55% 63% 70% 81% 87% 94% 96% 98% 99% 100% 100% Table 8: injection curves

ENTSOG Union-wide SoS simulation report
Page 65 of 68
UGS inventory Name 100% 90% 80% 70% 60% 50% 40% 30% 20% 10% 1% 0%
With
draw
de
liverab
ility
AT 100% 99% 98% 97% 97% 95% 90% 83% 73% 63% 51% 0%
ATm 100% 99% 98% 97% 97% 95% 90% 83% 73% 63% 51% 0%
ATn 100% 99% 98% 97% 97% 95% 90% 83% 73% 63% 51% 0%
BEh 100% 100% 100% 100% 100% 100% 100% 100% 35% 35% 24% 0%
BGn 74% 74% 100% 100% 100% 100% 89% 79% 79% 60% 37% 0%
CY 0% 0% 0% 0% 0% 0% 0% 0% 0% 0% 0% 0%
CZ 100% 100% 100% 100% 100% 97% 75% 70% 45% 40% 37% 0%
CZd 100% 98% 96% 95% 94% 91% 85% 75% 65% 54% 37% 0%
DE 100% 99% 97% 96% 95% 93% 85% 75% 63% 51% 34% 0%
DEd 100% 99% 97% 96% 95% 93% 85% 75% 63% 51% 34% 0%
DEdL 100% 99% 97% 96% 95% 93% 85% 75% 63% 51% 34% 0%
DEg 100% 99% 97% 96% 95% 93% 85% 75% 63% 51% 34% 0%
DEgL 100% 99% 97% 96% 95% 93% 85% 75% 63% 51% 34% 0%
DEm 100% 99% 97% 96% 95% 93% 85% 75% 63% 51% 34% 0%
DEmL 100% 99% 97% 96% 95% 93% 85% 75% 63% 51% 34% 0%
DEn 100% 99% 97% 96% 95% 93% 85% 75% 63% 51% 34% 0%
DEnL 100% 99% 97% 96% 95% 93% 85% 75% 63% 51% 34% 0%
DK 100% 100% 100% 100% 100% 100% 100% 100% 85% 40% 30% 0%
EE 0% 0% 0% 0% 0% 0% 0% 0% 0% 0% 0% 0%
ES 100% 80% 72% 67% 63% 60% 55% 50% 45% 40% 37% 0%
FI 0% 0% 0% 0% 0% 0% 0% 0% 0% 0% 0% 0%
FRn 100% 98% 96% 93% 90% 86% 78% 68% 56% 44% 31% 0%
FRnL 100% 100% 100% 100% 100% 100% 100% 100% 99% 93% 85% 0%
FRs 100% 95% 91% 87% 82% 78% 70% 60% 55% 49% 32% 0%
FRt 100% 98% 96% 93% 91% 89% 83% 73% 64% 55% 45% 0%
GR 0% 0% 0% 0% 0% 0% 0% 0% 0% 0% 0% 0%
HR 100% 100% 100% 100% 100% 96% 80% 65% 48% 32% 14% 0%
HU 100% 100% 100% 100% 99% 97% 95% 87% 78% 62% 52% 0%
IE 0% 0% 0% 0% 0% 0% 0% 0% 0% 0% 0% 0%
IT 100% 100% 96% 94% 93% 91% 89% 77% 69% 62% 25% 0%
LT 0% 0% 0% 0% 0% 0% 0% 0% 0% 0% 0% 0%
LV 100% 98% 96% 95% 94% 91% 85% 75% 65% 54% 37% 0%
NL 100% 97% 94% 92% 90% 86% 80% 72% 63% 54% 34% 0%
PL 100% 100% 99% 98% 97% 92% 86% 79% 74% 63% 39% 0%
PT 100% 98% 96% 95% 94% 91% 85% 75% 65% 54% 37% 0%
RO 100% 98% 96% 95% 94% 91% 85% 75% 65% 54% 37% 0%
RS 100% 98% 96% 95% 94% 91% 85% 75% 65% 54% 37% 0%
SE 100% 98% 96% 95% 94% 91% 85% 75% 65% 54% 37% 0%
SI 0% 0% 0% 0% 0% 0% 0% 0% 0% 0% 0% 0%
SKm 100% 98% 96% 95% 94% 91% 85% 75% 65% 54% 37% 0%
UK 100% 98% 96% 95% 94% 91% 85% 75% 65% 54% 37% 0% Table 9: withdrawal curves

ENTSOG Union-wide SoS simulation report
Page 66 of 68
Annex IV: LNG
Name LNG Tank Capacity
[GWh] LNG Tank Flexibility
[% of LNG Tank Capacity]
BE 5,206 35%
ES 22,718 41%
FRn 6,371 73%
FRs 2,809 58%
GR 2,432 35%
IT 3,322 15%
LT 2,329 3%
NL 7,398 35%
PL 2,192 33%
PT 2,672 32%
UK 14,351 35% Table 10: LNG tank capacity and flexibility
ENTSOG Union-wide SoS simulation report
Page 67 of 68
Annex V: Capacities
Capacity data is available at this link https://entsog.eu/publications/security-of-gas-supply#All

ENTSOG Union-wide SoS simulation report
Page 68 of 68
Abbreviations:
Country codes are defined according to the ISO standard 3166-1 DC: Design Case, identical with Peak Day EC: European Commission ENTSOG: European Network of Transmission System Operators for Gas EU: European Union GCG: Gas Coordination Group GIE: Gas Infrastructure Europe GLE: Gas LNG terminals operators Europe GSE: Gas Storages operators Europe H-gas: High calorific gas L-gas: Low calorific gas LNG: Liquified Natural Gas NeMo: ENTSOG’s modelling tool SoS: Security of Supply TSO: Transmission System Operators UGS: Underground Gas Storage WGV: Working Gas Volumes WSO: Winter Supply Outlook


ENTSOG aisbl
Avenue de Cortenbergh 100 1000 Brussels, Belgium Tel. +32 2 894 51 00
[email protected] www.entsog.eu